Human dietary exposure to perfluoroalkyl substances in Catalonia, Spain. Temporal trend José L. Domingo a,⇑ , Ingrid Ericson Jogsten b , Ulrika Eriksson b , Isabel Martorell a , Gemma Perelló a , Martí Nadal a , Bert van Bavel b a Laboratory of Toxicology and Environmental Health, School of Medicine, IISPV, Universitat Rovira i Virgili, Sant Llorenç 21, 43201 Reus, Spain b Man-Technology-Environment (MTM) Research Center, School of Science and Technology, Örebro University, SE-70182 Örebro, Sweden article info Article history: Received 14 March 2012 Received in revised form 7 June 2012 Accepted 13 June 2012 Available online 29 June 2012 Keywords: Perfluoroalkyl substances (PFASs) Foodstuffs Dietary intake Human exposure Catalonia (Spain) abstract In this study, we assessed the levels of 18 perfluoroalkyl substances (PFASs) in the most widely consumed foodstuffs in Catalonia, Spain, as well as the total dietary intake of these compounds. Forty food items were analysed. Only perfluoropentanoic acid (PFPeA), perfluorohexadecanoic acid (PFHxDA) and perflu- orooctanoicdecanoic acid (PFOcDA) were not detected in any sample. Perfluorooctane sulfonate (PFOS) was the compound found in the highest number of samples (33 out of 80), followed by perfluorooctanoic acid (PFOA), perfluoroheptanoic acid (PFHpA), perfluorohexane sulfonic acid (PFHxS), perfluorodecanoic acid (PFDA) and perfluorodecane sulfonic acid (PFDS). Fish and shellfish was the food group in which more PFASs were detected and where the highest PFAS concentrations were found. The highest dietary intakes corresponded to children, followed by male seniors, with values of 1787 and 1466 ng/day, respec- tively. For any of the age/gender groups of the population, the Tolerable Daily Intakes (TDIs) recom- mended by the EFSA were not exceeded. In general terms, PFAS levels found in the current study are lower than the concentrations recently reported in other countries. Ó 2012 Elsevier Ltd. All rights reserved. 1. Introduction Perfluoroalkyl acids (PFAAs) and their salts, PFSAs (perfluoroal- kyl sulfonic acids) and PFCAs (perfluoroalkyl carboxylic acids), are stable chemicals comprising a carbon chain surrounded by fluorine atoms with a functional group located at the end of the carbon chain. Because these substances repel oil, grease and water, they have wide consumer and industrial applications, including protec- tive coating for fabrics and carpets, paper coatings, insecticides, paints, cosmetics and fire-fighting foams (Paul, Jones, & Sweetman, 2009). These substances are known globally as perfluoroalkyl sub- stances (PFASs). Perfluorooctane sulfonate (PFOS) and perfluorooc- tanoic acid (PFOA) are the two PFASs made in the largest quantities. They are the most investigated and the most commonly detected. PFOS is classified as a persistent and bio-accumulative substance (OECD, 2002). The industrial production of PFOS and some of its derivatives was phased out by the major producer, 3 M, in 2002, while the European Union (EU) banned most uses of this compound from 2008 (EC, 2006). PFOS has been very re- cently included in the EU list of priority substances (PS) in the field of water policy, i.e., the chemicals identified among those present- ing a significant risk to or via the aquatic environment, according to the Water Framework Directive (EC, 2012). In 2009, PFOS was included in Annex B of the Stockholm Convention list of persistent organic pollutants (Buck et al., 2011). In turn, US EPA launched a voluntarily stewardship programme to reduce PFOA emitted and contained in products by 95% by 2010, as well as to work towards elimination by 2015 (US EPA, 2012). However, hundreds of related chemicals, such as homologues with shorter or longer alkyl chains, which potentially may degrade to PFASs, have not yet been regulated. In general, PFASs are extremely persistent, bio-accumulative and of toxicological concern (Dewitt, Peden-Adams, Keller, & Ger- molec, 2012; Houde, De Silva, Muir, & Letcher, 2011; Suja, Prama- nik, & Zain, 2009; Zhang et al., 2011). In recent years, a number of studies involving PFASs have focused on increasing general knowl- edge on their toxicity (Florentin, Deblonde, Diguio, Hautemaniere, & Hartemann, 2011; Fuentes, Colomina, Vicens, Franco-Pons, & Domingo, 2007; Fuentes, Vicens, Colomina, & Domingo, 2007; Johansson, Eriksson, & Viberg, 2009; Ribes, Fuentes, Torrente, Col- omina, & Domingo, 2010), environmental distribution and fate (Houde et al., 2011; Martin, Whittle, Muir, & Mabury, 2004; Nakata et al., 2006; Yamashita et al., 2005), as well as potential human health risks of exposure to these pollutants, especially to PFOS and PFOA (Cornelis et al., 2012; Domingo, 2012; Egeghy & Lorber, 2011; Haug, Huber, Becher, & Thomsen, 2011; Liu et al., 2010; Zhao 0308-8146/$ - see front matter Ó 2012 Elsevier Ltd. All rights reserved. http://dx.doi.org/10.1016/j.foodchem.2012.06.054 ⇑ Corresponding author. Tel.: +34 977 759380; fax: +34 977 759322. E-mail address: [email protected] (J.L. Domingo). Food Chemistry 135 (2012) 1575–1582 Contents lists available at SciVerse ScienceDirect Food Chemistry journal homepage: www.elsevier.com/locate/foodchem

Welcome message from author
This document is posted to help you gain knowledge. Please leave a comment to let me know what you think about it! Share it to your friends and learn new things together.
Transcript
Food Chemistry 135 (2012) 1575–1582
Contents lists available at SciVerse ScienceDirect
Food Chemistry
journal homepage: www.elsevier .com/locate / foodchem
Human dietary exposure to perfluoroalkyl substances in Catalonia, Spain.Temporal trend
José L. Domingo a,⇑, Ingrid Ericson Jogsten b, Ulrika Eriksson b, Isabel Martorell a, Gemma Perelló a,Martí Nadal a, Bert van Bavel b
a Laboratory of Toxicology and Environmental Health, School of Medicine, IISPV, Universitat Rovira i Virgili, Sant Llorenç 21, 43201 Reus, Spainb Man-Technology-Environment (MTM) Research Center, School of Science and Technology, Örebro University, SE-70182 Örebro, Sweden
a r t i c l e i n f o
Article history:Received 14 March 2012Received in revised form 7 June 2012Accepted 13 June 2012Available online 29 June 2012
Keywords:Perfluoroalkyl substances (PFASs)FoodstuffsDietary intakeHuman exposureCatalonia (Spain)
0308-8146/$ - see front matter � 2012 Elsevier Ltd. Ahttp://dx.doi.org/10.1016/j.foodchem.2012.06.054
⇑ Corresponding author. Tel.: +34 977 759380; fax:E-mail address: [email protected] (J.L. Dom
a b s t r a c t
In this study, we assessed the levels of 18 perfluoroalkyl substances (PFASs) in the most widely consumedfoodstuffs in Catalonia, Spain, as well as the total dietary intake of these compounds. Forty food itemswere analysed. Only perfluoropentanoic acid (PFPeA), perfluorohexadecanoic acid (PFHxDA) and perflu-orooctanoicdecanoic acid (PFOcDA) were not detected in any sample. Perfluorooctane sulfonate (PFOS)was the compound found in the highest number of samples (33 out of 80), followed by perfluorooctanoicacid (PFOA), perfluoroheptanoic acid (PFHpA), perfluorohexane sulfonic acid (PFHxS), perfluorodecanoicacid (PFDA) and perfluorodecane sulfonic acid (PFDS). Fish and shellfish was the food group in whichmore PFASs were detected and where the highest PFAS concentrations were found. The highest dietaryintakes corresponded to children, followed by male seniors, with values of 1787 and 1466 ng/day, respec-tively. For any of the age/gender groups of the population, the Tolerable Daily Intakes (TDIs) recom-mended by the EFSA were not exceeded. In general terms, PFAS levels found in the current study arelower than the concentrations recently reported in other countries.
� 2012 Elsevier Ltd. All rights reserved.
1. Introduction
Perfluoroalkyl acids (PFAAs) and their salts, PFSAs (perfluoroal-kyl sulfonic acids) and PFCAs (perfluoroalkyl carboxylic acids), arestable chemicals comprising a carbon chain surrounded by fluorineatoms with a functional group located at the end of the carbonchain. Because these substances repel oil, grease and water, theyhave wide consumer and industrial applications, including protec-tive coating for fabrics and carpets, paper coatings, insecticides,paints, cosmetics and fire-fighting foams (Paul, Jones, & Sweetman,2009). These substances are known globally as perfluoroalkyl sub-stances (PFASs). Perfluorooctane sulfonate (PFOS) and perfluorooc-tanoic acid (PFOA) are the two PFASs made in the largestquantities. They are the most investigated and the most commonlydetected. PFOS is classified as a persistent and bio-accumulativesubstance (OECD, 2002). The industrial production of PFOS andsome of its derivatives was phased out by the major producer,3 M, in 2002, while the European Union (EU) banned most usesof this compound from 2008 (EC, 2006). PFOS has been very re-cently included in the EU list of priority substances (PS) in the fieldof water policy, i.e., the chemicals identified among those present-
ll rights reserved.
+34 977 759322.ingo).
ing a significant risk to or via the aquatic environment, accordingto the Water Framework Directive (EC, 2012). In 2009, PFOS wasincluded in Annex B of the Stockholm Convention list of persistentorganic pollutants (Buck et al., 2011). In turn, US EPA launched avoluntarily stewardship programme to reduce PFOA emitted andcontained in products by 95% by 2010, as well as to work towardselimination by 2015 (US EPA, 2012). However, hundreds of relatedchemicals, such as homologues with shorter or longer alkyl chains,which potentially may degrade to PFASs, have not yet beenregulated.
In general, PFASs are extremely persistent, bio-accumulativeand of toxicological concern (Dewitt, Peden-Adams, Keller, & Ger-molec, 2012; Houde, De Silva, Muir, & Letcher, 2011; Suja, Prama-nik, & Zain, 2009; Zhang et al., 2011). In recent years, a number ofstudies involving PFASs have focused on increasing general knowl-edge on their toxicity (Florentin, Deblonde, Diguio, Hautemaniere,& Hartemann, 2011; Fuentes, Colomina, Vicens, Franco-Pons, &Domingo, 2007; Fuentes, Vicens, Colomina, & Domingo, 2007;Johansson, Eriksson, & Viberg, 2009; Ribes, Fuentes, Torrente, Col-omina, & Domingo, 2010), environmental distribution and fate(Houde et al., 2011; Martin, Whittle, Muir, & Mabury, 2004; Nakataet al., 2006; Yamashita et al., 2005), as well as potential humanhealth risks of exposure to these pollutants, especially to PFOSand PFOA (Cornelis et al., 2012; Domingo, 2012; Egeghy & Lorber,2011; Haug, Huber, Becher, & Thomsen, 2011; Liu et al., 2010; Zhao
1576 J.L. Domingo et al. / Food Chemistry 135 (2012) 1575–1582
et al., 2011). However, significant gaps still exist on thatknowledge.
Human exposure to PFASs, mainly PFOS and PFOA, is due to avariety of environmental and product-related sources. However,this exposure has been suggested to be mainly through the diet,including drinking water (D’Hollander, de Voogt, de Coen, & Bervo-ets, 2010; Domingo, 2012; Ericson et al., 2008; Fromme, Tittlemier,Völkel, Wilhelm, & Twardella, 2009; Kärrman et al., 2007, 2009;Picó, Farré, Llorca, & Barceló, 2011; van Asselt, Rietra, Römkens,& van Der Fels-Klerx, 2011). On the other hand, recent investiga-tions have shown that PFASs are also present in house dust at lev-els that may represent an important pathway for human exposure(Cornelis et al., 2012; D’Hollander et al., 2010; Ericson Jogsten, Na-dal, van Bavel, Lindström, & Domingo, 2012; Strynar & Lindstrom,2008). In order to increase the general knowledge on PFASs, in2006 we initiated in our laboratory a wide programme aimed atincreasing the information on human health risks of these com-pounds. We assessed whether diet, including drinking water, couldmake a significant contribution to human exposure to PFASs, aswell as the role that food processing and packaging could play asa source of PFASs through dietary intake (Ericson et al., 2008,2009; Ericson, Nadal, van Bavel, Lindström, & Domingo, 2008; Jog-sten et al., 2009). In addition, we measured the levels of PFASs inhuman blood, milk and the liver of subjects belonging to the pop-ulation for which dietary exposure to these pollutants was as-sessed (Ericson et al., 2007; Kärrman et al., 2010). Recently, wealso determined the concentrations of a number of PFASs in housedust and indoor air samples from selected homes in Catalonia,Spain (Ericson Jogsten et al., 2012). Based on previous studies ondietary intake and drinking water consumption, we noted thathouse dust and indoor air seem to contribute significantly less toPFAS exposure within the Catalan population.
The purpose of the present study was to establish the temporaltrend in the levels of PFASs found in the most widely consumedfoodstuffs in Catalonia, as well as the total dietary intake of thesecompounds. Food items belonging to the same food groups as-sessed in our previous survey (Ericson et al., 2008) and some addi-tional foodstuffs were collected and analysed for various PFASs.Here, we present the concentrations of PFASs in a number of fooditems corresponding to this last survey, as well as the dietary in-take of these pollutants by the population of Catalonia. Finally, cur-rent dietary intake is also compared with human dietary intakes ofPFASs recently reported for various countries.
Table 1Perfluoroalkyl substances, abbreviations, molecular formulae and traces monitored during
Compound Abbreviation M
Perfluoroalkyl carboxylic acids PFCAsPerfluorobutanoic acid PFBA CPerfluoropentanoic acid PFPeA CPerfluorohexanoic acid PFHxA CPerfluoroheptanoic acid PFHpA CPerfluorooctanoic acid PFOA CPerfluorononanoic acid PFNA CPerfluorodecanoic acid PFDA CPerfluoroundecanoic acid PFUnDA CPerfluorododecanoic acid PFDoDA CPerfluorotridecanoic acid PFTrDA CPerfluorotetradecanoic acid PFTeDA CPerfluorohexadecanoic acid PFHxDA CPerfluorooctanoicdecanoic acid PFOcDA CPerfluoroalkyl sulfonic acids PFSAsPerfluorobutane sulfonic acid PFBS CPerfluorohexane sulfonic acid PFHxS CPerfluorooctane sulfonate PFOS CPerfluorodecane sulfonic acid PFDS CTetrahydroperfluorooctane sulfonic acid THPFOS C
2. Materials and methods
2.1. Sampling
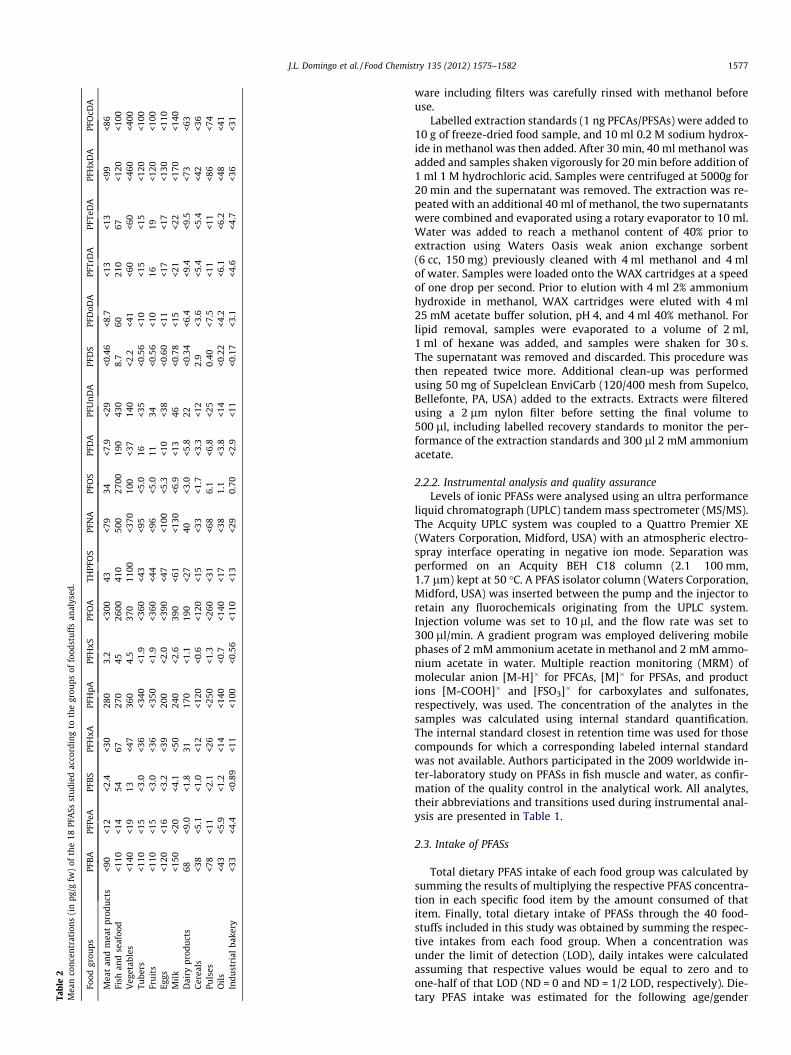
In September 2011, foods were purchased in 12 representativecities of Catalonia, all with more than 20,000 inhabitants: Barce-lona, l’Hospitalet de Llobregat, Vilanova i la Geltrú, Mataró, Saba-dell, Terrassa, Girona, Tarragona, Reus, Tortosa, Lleida andManresa. Globally, these cities represent approximately 72% ofthe population of Catalonia. Food samples were obtained at eachlocality in 4 shops/stores of different size (local markets, smallstores, supermarkets and big grocery stores). Foods selected forPFAS analysis were among the most consumed in Catalonia (Ser-ra-Majem et al., 2003). Analysed food samples included a total of40 items: meat (veal steak, loin of pork, chicken breast, and steakof lamb) and meat products (boiled ham, ‘‘Frankfurt’’-type sausage,and cured ham); fish and shellfish (sardine, tuna, anchovy, sword-fish, salmon, hake, red mullet, sole, cuttlefish, clam, mussel, andshrimp); vegetables and tubers (lettuce, tomato, potato, and car-rot); fresh fruits (apple, orange, and banana); milk and dairy prod-ucts (whole and semi-skimmed milk, yogurt, cheese I – low fat,cheese II – medium fat, and cheese III – extra fat); cereals (Frenchbread, and pasta); pulses (lentils); industrial bakery (cookies); eggs(hen eggs); oils and fats (olive oil), and canned products (sardineand tuna). For each food item, two composite samples were pre-pared for analysis. Each composite sample consisted of 24 individ-ual units. Only edible parts of each food item were included in thecomposites. Samples were freeze-dried at �80 �C with a CryodosTelstar lyophilizer for 24 h and then stored at �20 �C until analysisof PFASs. The list of PFASs analysed is shown in Table 1.
2.2. Sample preparation and instrumental analysis
2.2.1. ChemicalsThirteen PFCAs (C4-C14, C16, C18, 13C4-labeled C4, C6, C8-C12,
13C8-PFOA) and four PFSAs (C4, C6, C8, C10, 13C4-labelled C6, C8,13C8-PFOS) were obtained from Wellington Laboratories (Guelph,Ontario, Canada). Performance standard 7H-PFHpA (98% in metha-nol) was purchased from ABCR (Karlsruhe, Germany). Methanoland water were of HPLC grade and purchased from Fluka (Stein-heim, Germany), Supelclean ENVI-carb (120/400 mesh) was pur-chased from Supelco (Bellafonte, PA, USA) and sodium acetatewas purchased from E. Merck (Darmstadt, Germany). Laboratory
mass spectrometric analysis.
olecular formula Primary trace Secondary trace
4F7O2H 213 > 168.905F9O2H 263.2 > 218.95F11CO2H 313.25 > 269.256F13CO2H 363.18 > 319 363.18 > 168.87F15CO2H 413.1 > 369.2 413.1 > 169.18F17CO2H 462.99 > 419 462.99 > 2199F19CO2H 513.15 > 469.15 513.05 > 168.810F21CO2H 563 > 519.1 563 > 269.111F23CO2H 613.01 > 569 613.01 > 168.912F25CO2H 663.09 > 619.10 663.09 > 16913F27CO2H 713.24 > 669.1 713.24 > 16915F31CO2H 813.13 > 769.2 813.3 > 16917F35CO2H 913.2 > 869.2 913.2 > 169
4F9SO�3 299.2 > 98.85 299.2 > 79.8
6F13SO�3 399.1 > 98.9 399.1 > 79.85
8F17SO�3 498.9 > 98.85 498.9 > 79.85
10F21SO�3 599 > 79.70
6F13C2H4SO�3 427.0 > 407 427.0 > 80.7
Tabl
e2
Mea
nco
ncen
trat
ions
(in
pg/g
fw)
ofth
e18
PFA
Ssst
udie
dac
cord
ing
toth
egr
oups
offo
odst
uffs
anal
ysed
.
Food
grou
psPF
BA
PFPe
APF
BS
PFH
xAPF
HpA
PFH
xSPF
OA
THPF
OS
PFN
APF
OS
PFD
APF
Un
DA
PFD
SPF
DoD
APF
TrD
APF
TeD
APF
HxD
APF
OcD
A
Mea
tan
dm
eat
prod
uct
s<9
0<1
2<2
.4<3
028
03.
2<3
0043
<79
34<7
.9<2
9<0
.46
<8.7
<13
<13
<99
<86
Fish
and
seaf
ood
<110
<14
5467
270
4526
0041
050
027
0019
043
08.
760
210
67<1
20<1
00V
eget
able
s<1
40<1
913
<47
360
4.5
370
1100
<370
100
<37
140
<2.2
<41
<60
<60
<460
<400
Tube
rs<1
10<1
5<3
.0<3
6<3
40<1
.9<3
60<4
3<9
5<5
.016
<35
<0.5
6<1
0<1
5<1
5<1
20<1
00Fr
uit
s<1
10<1
5<3
.0<3
6<3
50<1
.9<3
60<4
4<9
6<5
.011
34<0
.56
<10
1619
<120
<100
Eggs
<120
<16
<3.2
<39
200
<2.0
<390
<47
<100
<5.3
<10
<38
<0.6
0<1
1<1
7<1
7<1
30<1
10M
ilk
<150
<20
<4.1
<50
240
<2.6
390
<61
<130
<6.9
<13
46<0
.78
<15
<21
<22
<170
<140
Dai
rypr
odu
cts
68<9
.0<1
.831
170
<1.1
190
<27
40<3
.0<5
.822
<0.3
4<6
.4<9
.4<9
.5<7
3<6
3C
erea
ls<3
8<5
.1<1
.0<1
2<1
20<0
.6<1
20<1
5<3
3<1
.7<3
.3<1
22.
9<3
.6<5
.4<5
.4<4
2<3
6Pu
lses
<78
<11
<2.1
<26
<250
<1.3
<260
<31
<68
6.1
<6.8
<25
0.40
<7.5
<11
<11
<86
<74
Oil
s<4
3<5
.9<1
.2<1
4<1
40<0
.7<1
40<1
7<3
81.
1<3
.8<1
4<0
.22
<4.2
<6.1
<6.2
<48
<41
Indu
stri
alba
kery
<33
<4.4
<0.8
9<1
1<1
00<0
.56
<110
<13
<29
0.70
<2.9
<11
<0.1
7<3
.1<4
.6<4
.7<3
6<3
1
J.L. Domingo et al. / Food Chemistry 135 (2012) 1575–1582 1577
ware including filters was carefully rinsed with methanol beforeuse.
Labelled extraction standards (1 ng PFCAs/PFSAs) were added to10 g of freeze-dried food sample, and 10 ml 0.2 M sodium hydrox-ide in methanol was then added. After 30 min, 40 ml methanol wasadded and samples shaken vigorously for 20 min before addition of1 ml 1 M hydrochloric acid. Samples were centrifuged at 5000g for20 min and the supernatant was removed. The extraction was re-peated with an additional 40 ml of methanol, the two supernatantswere combined and evaporated using a rotary evaporator to 10 ml.Water was added to reach a methanol content of 40% prior toextraction using Waters Oasis weak anion exchange sorbent(6 cc, 150 mg) previously cleaned with 4 ml methanol and 4 mlof water. Samples were loaded onto the WAX cartridges at a speedof one drop per second. Prior to elution with 4 ml 2% ammoniumhydroxide in methanol, WAX cartridges were eluted with 4 ml25 mM acetate buffer solution, pH 4, and 4 ml 40% methanol. Forlipid removal, samples were evaporated to a volume of 2 ml,1 ml of hexane was added, and samples were shaken for 30 s.The supernatant was removed and discarded. This procedure wasthen repeated twice more. Additional clean-up was performedusing 50 mg of Supelclean EnviCarb (120/400 mesh from Supelco,Bellefonte, PA, USA) added to the extracts. Extracts were filteredusing a 2 lm nylon filter before setting the final volume to500 ll, including labelled recovery standards to monitor the per-formance of the extraction standards and 300 ll 2 mM ammoniumacetate.
2.2.2. Instrumental analysis and quality assuranceLevels of ionic PFASs were analysed using an ultra performance
liquid chromatograph (UPLC) tandem mass spectrometer (MS/MS).The Acquity UPLC system was coupled to a Quattro Premier XE(Waters Corporation, Midford, USA) with an atmospheric electro-spray interface operating in negative ion mode. Separation wasperformed on an Acquity BEH C18 column (2.1 � 100 mm,1.7 lm) kept at 50 �C. A PFAS isolator column (Waters Corporation,Midford, USA) was inserted between the pump and the injector toretain any fluorochemicals originating from the UPLC system.Injection volume was set to 10 ll, and the flow rate was set to300 ll/min. A gradient program was employed delivering mobilephases of 2 mM ammonium acetate in methanol and 2 mM ammo-nium acetate in water. Multiple reaction monitoring (MRM) ofmolecular anion [M-H]� for PFCAs, [M]� for PFSAs, and productions [M-COOH]� and [FSO3]� for carboxylates and sulfonates,respectively, was used. The concentration of the analytes in thesamples was calculated using internal standard quantification.The internal standard closest in retention time was used for thosecompounds for which a corresponding labeled internal standardwas not available. Authors participated in the 2009 worldwide in-ter-laboratory study on PFASs in fish muscle and water, as confir-mation of the quality control in the analytical work. All analytes,their abbreviations and transitions used during instrumental anal-ysis are presented in Table 1.
2.3. Intake of PFASs
Total dietary PFAS intake of each food group was calculated bysumming the results of multiplying the respective PFAS concentra-tion in each specific food item by the amount consumed of thatitem. Finally, total dietary intake of PFASs through the 40 food-stuffs included in this study was obtained by summing the respec-tive intakes from each food group. When a concentration wasunder the limit of detection (LOD), daily intakes were calculatedassuming that respective values would be equal to zero and toone-half of that LOD (ND = 0 and ND = 1/2 LOD, respectively). Die-tary PFAS intake was estimated for the following age/gender
1578 J.L. Domingo et al. / Food Chemistry 135 (2012) 1575–1582
groups: children (6–9 years; assumed average body weight 24 kg),male adolescents (10–19 years; assumed average body weight56 kg), female adolescents (10–19 years; assumed average bodyweight 53 kg), male adults (20–65 years; assumed average bodyweight 70 kg), female adults (20–65 years; assumed average bodyweight 55 kg), male seniors (>65 years; assumed average bodyweight 65 kg), and female seniors (>65 years; assumed averagebody weight 60 kg).
3. Results and discussion
Data corresponding to the 80 individually analysed compositefood samples show that only PFPeA, PFHxDA and PFOcDA couldnot be detected in any sample. The remaining PFASs were detectedin at least one sample (i.e., PFBA in semi-cured cheese). PFOS wasthe compound found in the highest number of samples (33 outof 80). PFOA, PFHpA, PFHxS, PFDA and PFDS were the compoundsthat, concurrently with PFOS, were detected in the greatest num-ber of food samples. PFOA was found in anchovy, red mullet, sole,clams and mussels, as well as in lettuce, carrot, semi-skimmedmilk and yogurt, while PFHpA could be detected in samples ofswordfish, salmon, red mullet, sole and clams, as well as in lettuce,eggs, whole and semi-skimmed milk and yogurt. In turn, PFHxSwas found in six species of fish and shellfish, as well as in boiledham, ‘‘Frankfurt’’-type sausages, canned sardine and lettuce. PFDAwas detected in seven seafood species and in potatoes, apple, or-
0
400
800
1200
1600
2000
Childr
en
Male
adole
scen
ts
Female
adole
scen
ts
Male
adu
Childr
en
Male
adole
scen
ts
Female
adole
scen
ts
Male
adult
s
ng/d
ay f
w
0
100
200
300
400
500
F
ng/d
ay f
w
(a)
(b)
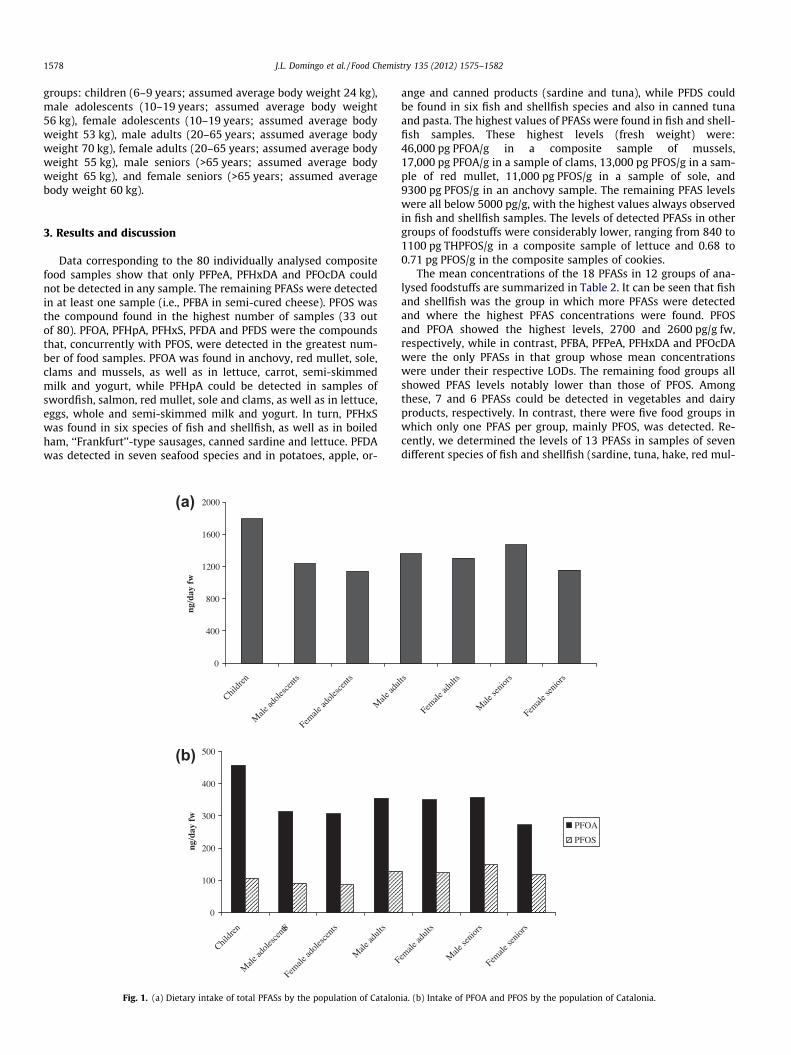
Fig. 1. (a) Dietary intake of total PFASs by the population of Catalon
ange and canned products (sardine and tuna), while PFDS couldbe found in six fish and shellfish species and also in canned tunaand pasta. The highest values of PFASs were found in fish and shell-fish samples. These highest levels (fresh weight) were:46,000 pg PFOA/g in a composite sample of mussels,17,000 pg PFOA/g in a sample of clams, 13,000 pg PFOS/g in a sam-ple of red mullet, 11,000 pg PFOS/g in a sample of sole, and9300 pg PFOS/g in an anchovy sample. The remaining PFAS levelswere all below 5000 pg/g, with the highest values always observedin fish and shellfish samples. The levels of detected PFASs in othergroups of foodstuffs were considerably lower, ranging from 840 to1100 pg THPFOS/g in a composite sample of lettuce and 0.68 to0.71 pg PFOS/g in the composite samples of cookies.
The mean concentrations of the 18 PFASs in 12 groups of ana-lysed foodstuffs are summarized in Table 2. It can be seen that fishand shellfish was the group in which more PFASs were detectedand where the highest PFAS concentrations were found. PFOSand PFOA showed the highest levels, 2700 and 2600 pg/g fw,respectively, while in contrast, PFBA, PFPeA, PFHxDA and PFOcDAwere the only PFASs in that group whose mean concentrationswere under their respective LODs. The remaining food groups allshowed PFAS levels notably lower than those of PFOS. Amongthese, 7 and 6 PFASs could be detected in vegetables and dairyproducts, respectively. In contrast, there were five food groups inwhich only one PFAS per group, mainly PFOS, was detected. Re-cently, we determined the levels of 13 PFASs in samples of sevendifferent species of fish and shellfish (sardine, tuna, hake, red mul-
lts
Female
adult
s
Male
senio
rs
Female
senio
rs
Female
adult
s
Male
senio
rs
Female
senio
rs
PFOA
PFOS
ia. (b) Intake of PFOA and PFOS by the population of Catalonia.
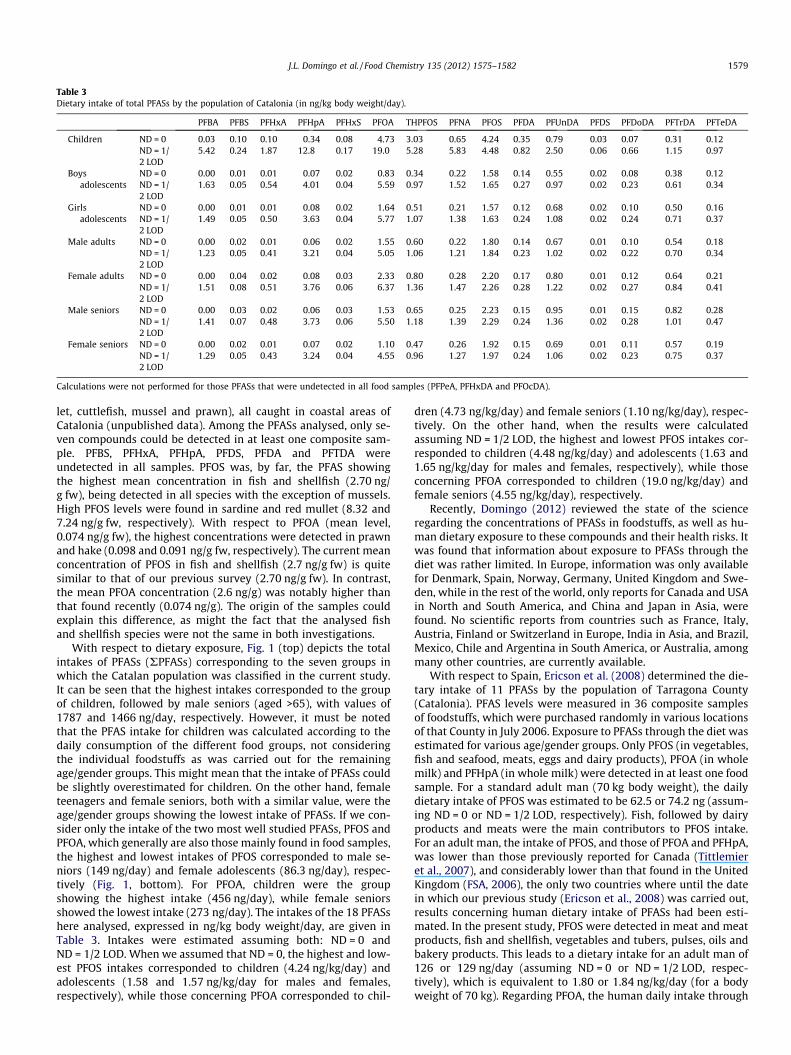
Table 3Dietary intake of total PFASs by the population of Catalonia (in ng/kg body weight/day).
PFBA PFBS PFHxA PFHpA PFHxS PFOA THPFOS PFNA PFOS PFDA PFUnDA PFDS PFDoDA PFTrDA PFTeDA
Children ND = 0 0.03 0.10 0.10 0.34 0.08 4.73 3.03 0.65 4.24 0.35 0.79 0.03 0.07 0.31 0.12ND = 1/2 LOD
5.42 0.24 1.87 12.8 0.17 19.0 5.28 5.83 4.48 0.82 2.50 0.06 0.66 1.15 0.97
Boysadolescents
ND = 0 0.00 0.01 0.01 0.07 0.02 0.83 0.34 0.22 1.58 0.14 0.55 0.02 0.08 0.38 0.12ND = 1/2 LOD
1.63 0.05 0.54 4.01 0.04 5.59 0.97 1.52 1.65 0.27 0.97 0.02 0.23 0.61 0.34
Girlsadolescents
ND = 0 0.00 0.01 0.01 0.08 0.02 1.64 0.51 0.21 1.57 0.12 0.68 0.02 0.10 0.50 0.16ND = 1/2 LOD
1.49 0.05 0.50 3.63 0.04 5.77 1.07 1.38 1.63 0.24 1.08 0.02 0.24 0.71 0.37
Male adults ND = 0 0.00 0.02 0.01 0.06 0.02 1.55 0.60 0.22 1.80 0.14 0.67 0.01 0.10 0.54 0.18ND = 1/2 LOD
1.23 0.05 0.41 3.21 0.04 5.05 1.06 1.21 1.84 0.23 1.02 0.02 0.22 0.70 0.34
Female adults ND = 0 0.00 0.04 0.02 0.08 0.03 2.33 0.80 0.28 2.20 0.17 0.80 0.01 0.12 0.64 0.21ND = 1/2 LOD
1.51 0.08 0.51 3.76 0.06 6.37 1.36 1.47 2.26 0.28 1.22 0.02 0.27 0.84 0.41
Male seniors ND = 0 0.00 0.03 0.02 0.06 0.03 1.53 0.65 0.25 2.23 0.15 0.95 0.01 0.15 0.82 0.28ND = 1/2 LOD
1.41 0.07 0.48 3.73 0.06 5.50 1.18 1.39 2.29 0.24 1.36 0.02 0.28 1.01 0.47
Female seniors ND = 0 0.00 0.02 0.01 0.07 0.02 1.10 0.47 0.26 1.92 0.15 0.69 0.01 0.11 0.57 0.19ND = 1/2 LOD
1.29 0.05 0.43 3.24 0.04 4.55 0.96 1.27 1.97 0.24 1.06 0.02 0.23 0.75 0.37
Calculations were not performed for those PFASs that were undetected in all food samples (PFPeA, PFHxDA and PFOcDA).
J.L. Domingo et al. / Food Chemistry 135 (2012) 1575–1582 1579
let, cuttlefish, mussel and prawn), all caught in coastal areas ofCatalonia (unpublished data). Among the PFASs analysed, only se-ven compounds could be detected in at least one composite sam-ple. PFBS, PFHxA, PFHpA, PFDS, PFDA and PFTDA wereundetected in all samples. PFOS was, by far, the PFAS showingthe highest mean concentration in fish and shellfish (2.70 ng/g fw), being detected in all species with the exception of mussels.High PFOS levels were found in sardine and red mullet (8.32 and7.24 ng/g fw, respectively). With respect to PFOA (mean level,0.074 ng/g fw), the highest concentrations were detected in prawnand hake (0.098 and 0.091 ng/g fw, respectively). The current meanconcentration of PFOS in fish and shellfish (2.7 ng/g fw) is quitesimilar to that of our previous survey (2.70 ng/g fw). In contrast,the mean PFOA concentration (2.6 ng/g) was notably higher thanthat found recently (0.074 ng/g). The origin of the samples couldexplain this difference, as might the fact that the analysed fishand shellfish species were not the same in both investigations.
With respect to dietary exposure, Fig. 1 (top) depicts the totalintakes of PFASs (RPFASs) corresponding to the seven groups inwhich the Catalan population was classified in the current study.It can be seen that the highest intakes corresponded to the groupof children, followed by male seniors (aged >65), with values of1787 and 1466 ng/day, respectively. However, it must be notedthat the PFAS intake for children was calculated according to thedaily consumption of the different food groups, not consideringthe individual foodstuffs as was carried out for the remainingage/gender groups. This might mean that the intake of PFASs couldbe slightly overestimated for children. On the other hand, femaleteenagers and female seniors, both with a similar value, were theage/gender groups showing the lowest intake of PFASs. If we con-sider only the intake of the two most well studied PFASs, PFOS andPFOA, which generally are also those mainly found in food samples,the highest and lowest intakes of PFOS corresponded to male se-niors (149 ng/day) and female adolescents (86.3 ng/day), respec-tively (Fig. 1, bottom). For PFOA, children were the groupshowing the highest intake (456 ng/day), while female seniorsshowed the lowest intake (273 ng/day). The intakes of the 18 PFASshere analysed, expressed in ng/kg body weight/day, are given inTable 3. Intakes were estimated assuming both: ND = 0 andND = 1/2 LOD. When we assumed that ND = 0, the highest and low-est PFOS intakes corresponded to children (4.24 ng/kg/day) andadolescents (1.58 and 1.57 ng/kg/day for males and females,respectively), while those concerning PFOA corresponded to chil-
dren (4.73 ng/kg/day) and female seniors (1.10 ng/kg/day), respec-tively. On the other hand, when the results were calculatedassuming ND = 1/2 LOD, the highest and lowest PFOS intakes cor-responded to children (4.48 ng/kg/day) and adolescents (1.63 and1.65 ng/kg/day for males and females, respectively), while thoseconcerning PFOA corresponded to children (19.0 ng/kg/day) andfemale seniors (4.55 ng/kg/day), respectively.
Recently, Domingo (2012) reviewed the state of the scienceregarding the concentrations of PFASs in foodstuffs, as well as hu-man dietary exposure to these compounds and their health risks. Itwas found that information about exposure to PFASs through thediet was rather limited. In Europe, information was only availablefor Denmark, Spain, Norway, Germany, United Kingdom and Swe-den, while in the rest of the world, only reports for Canada and USAin North and South America, and China and Japan in Asia, werefound. No scientific reports from countries such as France, Italy,Austria, Finland or Switzerland in Europe, India in Asia, and Brazil,Mexico, Chile and Argentina in South America, or Australia, amongmany other countries, are currently available.
With respect to Spain, Ericson et al. (2008) determined the die-tary intake of 11 PFASs by the population of Tarragona County(Catalonia). PFAS levels were measured in 36 composite samplesof foodstuffs, which were purchased randomly in various locationsof that County in July 2006. Exposure to PFASs through the diet wasestimated for various age/gender groups. Only PFOS (in vegetables,fish and seafood, meats, eggs and dairy products), PFOA (in wholemilk) and PFHpA (in whole milk) were detected in at least one foodsample. For a standard adult man (70 kg body weight), the dailydietary intake of PFOS was estimated to be 62.5 or 74.2 ng (assum-ing ND = 0 or ND = 1/2 LOD, respectively). Fish, followed by dairyproducts and meats were the main contributors to PFOS intake.For an adult man, the intake of PFOS, and those of PFOA and PFHpA,was lower than those previously reported for Canada (Tittlemieret al., 2007), and considerably lower than that found in the UnitedKingdom (FSA, 2006), the only two countries where until the datein which our previous study (Ericson et al., 2008) was carried out,results concerning human dietary intake of PFASs had been esti-mated. In the present study, PFOS were detected in meat and meatproducts, fish and shellfish, vegetables and tubers, pulses, oils andbakery products. This leads to a dietary intake for an adult man of126 or 129 ng/day (assuming ND = 0 or ND = 1/2 LOD, respec-tively), which is equivalent to 1.80 or 1.84 ng/kg/day (for a bodyweight of 70 kg). Regarding PFOA, the human daily intake through
1580 J.L. Domingo et al. / Food Chemistry 135 (2012) 1575–1582
the diet was 108 (ND = 0) or 354 ng (ND = 1/2 LOD), which isequivalent to 1.55 or 5.05 ng/kg/day, respectively. These intakesare considerably lower than the recommendations made by vari-ous international regulatory bodies. Thus, an evaluation of the TDIsfor PFOS and PFOA was performed by the UK Committee on Toxic-ity of Chemicals in Food, Consumer Products and the Environment(COT, 2006a, 2006b). The COT recommended a TDI of 300 ng/kg forPFOS, while for PFOA a TDI of 3000 ng/kg was suggested. In turn,the CONTAM Panel of the EFSA recommended TDIs of 150 and1500 ng/kg/day, for PFOS and PFOA, respectively (EFSA, 2008;EFSA., 2011). These latter values are lower than those previouslyproposed by the COT, but they are still notably higher than the dai-ly intakes for PFOS and PFOA estimated in the present study.Although in this survey the number of analysed foodstuffs has beenlimited to 40, among these are those food groups and food itemslikely to contain the highest PFOS and PFOA concentrations, and,therefore, they would make the greatest contribution to the dailydietary intake to these compounds.
The potential role that some food processing and packagingmight play as a source of PFASs through the diet was also investi-gated in our laboratory (Jogsten et al., 2009). The levels of 11 PFASswere determined in composite samples of veal steak (raw, grilledand fried), pork loin (raw, grilled and fried), chicken breast (raw,grilled and fried), black pudding (uncooked), liver lamb (raw), mar-inated salmon (home-made and packaged), lettuce (fresh andpackaged), pate of pork liver, foie grass of duck, ‘‘Frankfurt’’-typesausages, chicken nuggets (fried), and common salt. Only fourPFASs (PFHxS, PFOS, PFHxA and PFOA) were detected in at leastone composite sample. Once more, PFOS was the most frequentlydetected compound (8/20 of the food items analysed), while PFHxAwas detected in samples of raw veal, chicken nuggets, ‘‘Frankfurt’’-type sausages, and packaged lettuce. It was concluded, based onthose results, that it was not sufficiently clear whether cookingwith non-stick cookware, or the specific packaging of some foods,would contribute to significantly modify human exposure toPFASs.
With respect to recent studies performed in other countries, inCanada, Ostertag, Chan, Moisey, Dabeka, and Tittlemier (2009)measured the concentration of various PFASs in composite samplescollected for the 1998 Health Canada Total Diet Study, and esti-mated dietary exposure for the Canadian population (older than12 years of age) using previously collected dietary data(n = 1721). The exposure levels were below the provisional TDIprovided by the German Drinking Water Commission (100 ng/kgfor PFOS) (Fromme et al., 2009). The authors noted that dietaryexposure to total PFASs had not changed over time. However, thecontribution of PFOS to total PFAS exposure might have increasedbetween 1998 and 2004. In Norway, Haug et al. (2010b) deter-mined the levels of 19 PFASs in serum from 175 participants inthe Norwegian Fish and Game Study, evaluating also the relation-ship with respect to food consumption by means of multiple linearregression analysis. It was found that PFAS concentrations in serumwere significantly associated with consumption of lean fish, fish li-ver, shrimps and meat. The estimated dietary intakes of PFOA,PFUnDA, and PFOS were 0.60, 0.34 and 1.5 ng/kg body weight/day, respectively. As in most of the available studies, fish and shell-fish was the group showing the major dietary source of the esti-mated intakes of PFOA (38%), PFUnDA (93%), and PFOS (81%). Theauthors observed that estimated dietary intakes of these three se-lected PFASs were significantly associated with corresponding ser-um levels. In one of our previous studies (Ericson et al., 2008), wealso suggested a positive correlation between dietary intake andblood levels of PFOS, being corroborated in further analyses (Eric-son Jogsten et al., 2012) in which drinking water was estimated asa relevant route only in extreme circumstances. However, accord-ing to those results we could not corroborate that dietary intake
was the main route of exposure governing blood concentrationsof other PFASs. In another Norwegian study by the same research-ers (Haug et al., 2010a), the concentrations of PFASs were deter-mined in 21 samples of meat, fish, bread, vegetables, milk,drinking water and tea from the Norwegian market. Based on these21 measurements together with consumption data for the generalNorwegian population, a rough estimation of the total dietary in-take of PFASs was found to be 100 ng/day. PFOA and PFOS contrib-uted approximately 50% to the total intake. When dividing thepopulation into gender and age groups, estimated intakes de-creased with increasing age and was higher in males than females.The results of our current study do not support this last finding.
In a recent study performed in the Netherlands by Noorlander,van Leeuwen, Te Biesebeek, Mengelers, and Zeilmaker (2011), 6 outof 14 analysed PFASs could be quantified in the majority of the foodcategories evaluated (PFHpA, PFOA, PFNA, PFDA, PFHxS and PFOS).The highest concentration of the sum of these six compounds wasalso found in fish and shellfish: crustaceans (825 pg/g, PFOS:582 pg/g) and lean fish (481 pg/g, PFOS: 308 pg/g). The medianlong-term intake for PFOS was 0.3 ng/kg bw/day and for PFOA,0.2 ng/kg bw/day, values which are clearly lower than those esti-mated in the present study. However, the comparison among thesedietary intakes is rather hard to make, as there are notable differ-ences between both surveys in the food items analysed. In a Chi-nese study (Zhang et al., 2011), the estimated daily intake ofPFOS and PFOA via fish and seafood consumption ranged from0.10 to 2.51 ng/kg/day and from 0.13 to 0.38 ng/kg/day, respec-tively, for different age groups (i.e., toddlers, adolescents and chil-dren, and adults) from selected Chinese locations (i.e., Tianjin,Nanchang, Wuhan and Shenyang). On the other hand, in Flanders(Belgium) Cornelis et al. (2012) recently measured the concentra-tions of PFOS and PFOA in settled dust in homes and offices, in aselection of food items from local origin, in drinking-water, as wellas in human serum. It was found that exposure to these com-pounds was dominated by food intake, while other exposure path-ways contributed only marginally. Dietary exposure of children toPFOS was dominated by intake from potatoes (48%), followed byfish and seafood, dairy products, eggs and fruit (all contributingfor about 10%). In adults, intake was dominated by fish and seafood(57%), followed by potatoes (28%). In turn, the intake of PFOA inchildren resulted mainly from fruits (30%) and vegetables (20%),with fish and seafood constituting only a small fraction, whereasthe exposure of adults resulted from fish and seafood, potatoes,fruit and vegetables with almost equal contributions of about20% from each item.
In summary, the results of the present survey corroborate thatfish and shellfish is the food group showing the highest PFAS levels,in general, and those of PFOS and PFOA, in particular. PFOS was themost detected compound in the 80 analysed samples, while PFOAwas detected in a lower number of samples (10 out of 80), but itwas the compound in which the highest concentration of all PFASswas detected (a composite sample of mussels). In general terms,the PFAS levels found in the current study are lower than concen-trations recently reported in other countries, being similar to thosepreviously found in our laboratory. The differences among thepresent data and those from other countries may be due to the dif-ferences in the experimental designs (food items analysed, numberof samples, PFASs analysed, food processing, etc.). Finally, and con-cerning human health risks from dietary exposure to PFASs inCatalonia, it is important to note that for any of the age/gendergroups of population estimated, the TDIs recommended by theEFSA were not exceeded. As food consumption may be uncertainand/or variable, even for individuals within the same populationgroup, probabilistic tools will be applied in future investigationsin order to estimate the variability/uncertainty in the dietary expo-sure to PFASs.
J.L. Domingo et al. / Food Chemistry 135 (2012) 1575–1582 1581
Acknowledgements
This study was supported financially by the Catalan Food SafetyAgency (ACSA), Department of Health, Generalitat de Catalunya,Barcelona, Catalonia, Spain. The authors thank Ms. Beatriz Millánfor her valuable help in preparing the composite samples.
References
Buck, R. C., Franklin, J., Berger, U., Conder, J. M., Cousins, I. T., de Voogt, P., et al.(2011). Perfluoroalkyl and polyfluoroalkyl substances in the environment:Terminology, classification, and origins. Integrated Environmental Assessmentand Management, 7(4), 513–541.
Cornelis, C., D’Hollander, W., Roosens, L., Covaci, A., Smolders, R., van Den Heuvel, R.,et al. (2012). First assessment of population exposure to perfluorinatedcompounds in Flanders, Belgium. Chemosphere, 86(3), 308–314.
COT (2006a). Statement on the tolerable daily intake for perfluorooctane sulfonate.Committee of the Toxicity of Chemicals in Food, Consumer Products and theEnvironment. <http://www.food.gov.uk/multimedia/pdfs/cotstatementpfos200609.pdf> Accessed 12.03.12.
COT (2006b). Update statement on the tolerable daily intake for perfluorooctanoicacid. Committee of the Toxicity of Chemicals in Food, Consumer Products andthe Environment. <http://www.cot.food.gov.uk/pdfs/cotstatementpfoa200902.pdf> Accessed 12.03.12.
D’Hollander, W., de Voogt, P., de Coen, W., & Bervoets, L. (2010). Perfluorinatedsubstances in human food and other sources of human exposure. Reviews ofEnvironmental Contamination and Toxicology, 208, 179–215.
Dewitt, J. C., Peden-Adams, M. M., Keller, J. M., & Germolec, D. R. (2012).Immunotoxicity of Perfluorinated Compounds: Recent Developments.Toxicologic Pathology, 40(2), 300–311.
Domingo, J. L. (2012). Health risks of dietary exposure to perfluorinated compounds.Environment International, 40(1), 187–195.
EC (2006). Directive 2006/122/ECOF The European Parliament and of the Council of12 December 2006 amending for the 30th time Council Directive 76/769/EEC onthe approximation of the laws, regulations and administrative provisions of theMember States relating to restrictions on the marketing and use of certaindangerous substances and preparations (perfluorooctane sulfonates). OfficialJournal of the European Union, L 372/332.
EC (2012). Proposal for a Directive of the European Parliament and of the Councilamending Directives 2000/60/EC and 2008/105/EC as regards prioritysubstances in the field of water policy. Official Journal of the European Union,2011/0429 [European Commission].
EFSA (2008). Perfluorooctane sulfonate (PFOS), perfluorooctanoic acid (PFOA) andtheir salts (Question No EFSA-Q-2004-163). EFSA Journal, 653, 1–131 [EuropeanFood Safety Authority].
EFSA (2011). Results of the monitoring of perfluoroalkylated substances in food inthe period 2000–2009. EFSA scientific report. EFSA Journal, 9, 2016 [EuropeanFood Safety Authority].
Egeghy, P. P., & Lorber, M. (2011). An assessment of the exposure of Americans toperfluorooctane sulfonate: A comparison of estimated intake with valuesinferred from NHANES data. Journal of Exposure Science and EnvironmentalEpidemiology, 21(2), 150–168.
Ericson Jogsten, I., Nadal, M., van Bavel, B., Lindström, G., & Domingo, J. L. (2012).Per- and polyfluorinated compounds (PFCs) in house dust and indoor air inCatalonia, Spain: Implications for human exposure. Environment International,39(1), 172–180.
Ericson, I., Domingo, J. L., Nadal, M., Bigas, E., Llebaria, X., van Bavel, B., et al. (2009).Levels of perfluorinated chemicals in municipal drinking water from Catalonia,Spain: Public health implications. Archives of Environmental Contamination andToxicology, 57(4), 631–638.
Ericson, I., Gómez, M., Nadal, M., van Bavel, B., Lindström, G., & Domingo, J. L. (2007).Perfluorinated chemicals in blood of residents in Catalonia (Spain) in relation toage and gender: A pilot study. Environment International, 33(5), 616–623.
Ericson, I., Martí-Cid, R., Nadal, M., van Bavel, B., Lindström, G., & Domingo, J. L.(2008). Human exposure to perfluorinated chemicals through the diet: Intake ofperfluorinated compounds in foods from the Catalan (Spain) market. Journal ofAgricultural and Food Chemistry, 56(5), 1787–1794.
Ericson, I., Nadal, M., van Bavel, B., Lindström, G., & Domingo, J. L. (2008). Levels ofperfluorochemicals in water samples from Catalonia, Spain: Is drinking water asignificant contribution to human exposure? Environmental Science andPollution Research, 15(7), 614–619.
Florentin, A., Deblonde, T., Diguio, N., Hautemaniere, A., & Hartemann, P. (2011).Impacts of two perfluorinated compounds (PFOS and PFOA) on humanhepatoma cells: Cytotoxicity but no genotoxicity? International Journal ofHygiene and Environmental Health, 214(6), 493–499.
Fromme, H., Tittlemier, S. A., Völkel, W., Wilhelm, M., & Twardella, D. (2009).Perfluorinated compounds – Exposure assessment for the general population inwestern countries. International Journal of Hygiene and Environmental Health,212(3), 239–270.
FSA (2006). Fluorinated chemicals: UK dietary intakes. Food standards agency.<http://www.food.gov.uk/multimedia/pdfs/fsis1106.pdf> Accessed 12.03.12.
Fuentes, S., Colomina, M. T., Vicens, P., Franco-Pons, N., & Domingo, J. L. (2007).Concurrent exposure to perfluorooctane sulfonate and restraint stress during
pregnancy in mice. Effects on postnatal development and behavior of theoffspring. Toxicological Sciences, 98(2), 589–598.
Fuentes, S., Vicens, P., Colomina, M. T., & Domingo, J. L. (2007). Behavioral effects inadult mice exposed to perfluorooctane sulfonate (PFOS). Toxicology, 242(1–3),123–129.
Haug, L. S., Huber, S., Becher, G., & Thomsen, C. (2011). Characterisation of humanexposure pathways to perfluorinated compounds – Comparing exposureestimates with biomarkers of exposure. Environment International, 37(4),687–693.
Haug, L. S., Salihovic, S., Jogsten, I. E., Thomsen, C., van Bavel, B., Lindström, G., et al.(2010a). Levels in food and beverages and daily intake of perfluorinatedcompounds in Norway. Chemosphere, 80(10), 1137–1143.
Haug, L. S., Thomsen, C., Brantsaeter, A. L., Kvalem, H. E., Haugen, M., Becher, G., et al.(2010b). Diet and particularly seafood are major sources of perfluorinatedcompounds in humans. Environment International, 36(7), 772–778.
Houde, M., De Silva, A. O., Muir, D. C., & Letcher, R. J. (2011). Monitoring ofperfluorinated compounds in aquatic biota: An updated review. EnvironmentalScience and Technology, 45(19), 7962–7973.
Jogsten, I. E., Perelló, G., Llebaria, X., Bigas, E., Martí-Cid, R., Kärrman, A., et al. (2009).Exposure to perfluorinated compounds in Catalonia, Spain, throughconsumption of various raw and cooked foodstuffs, including packaged food.Food and Chemical Toxicology, 47(7), 1577–1583.
Johansson, N., Eriksson, P., & Viberg, H. (2009). Neonatal exposure to PFOS and PFOA inmice results in changes in proteins which are important for neuronal growth andsynaptogenesis in the developing brain. Toxicological Sciences, 108(2), 412–418.
Kärrman, A., Domingo, J. L., Llebaria, X., Nadal, M., Bigas, E., van Bavel, B., et al.(2010). Biomonitoring perfluorinated compounds in Catalonia, Spain:Concentrations and trends in human liver and milk samples. EnvironmentalScience and Pollution Research, 17(3), 750–758.
Kärrman, A., Ericson, I., van Bavel, B., Darnerud, P. O., Aune, M., Glynn, A., et al.(2007). Exposure of perfluorinated chemicals through lactation: Levels ofmatched human milk and serum and a temporal trend, 1996–2004, Sweden.Environmental Health Perspectives, 115(2), 226–230.
Kärrman, A., Harada, K. H., Inoue, K., Takasuga, T., Ohi, E., & Koizumi, A. (2009).Relationship between dietary exposure and serum perfluorochemical (PFCs)levels – A case study. Environment International, 35(4), 712–717.
Liu, J., Li, J., Zhao, Y., Wang, Y., Zhang, L., & Wu, Y. (2010). The occurrence ofperfluorinated alkyl compounds in human milk from different regions of China.Environment International, 36(5), 433–438.
Martin, J. W., Whittle, D. M., Muir, D. C., & Mabury, S. A. (2004). Perfluoroalkylcontaminants in a food web from Lake Ontario. Environmental Science andTechnology, 38(20), 5379–5385.
Nakata, H., Kannan, K., Nasu, T., Cho, H. S., Sinclair, E., & Takemura, A. (2006).Perfluorinated contaminants in sediments and aquatic organisms collectedfrom shallow water and tidal flat areas of the Ariake Sea, Japan: Environmentalfate of perfluorooctane sulfonate in aquatic ecosystems. Environmental Scienceand Technology, 40(16), 4916–4921.
Noorlander, C. W., Van Leeuwen, S. P., Te Biesebeek, J. D., Mengelers, M. J., &Zeilmaker, M. J. (2011). Levels of perfluorinated compounds in food and dietaryintake of PFOS and PFOA in the Netherlands. Journal of Agricultural and FoodChemistry, 59(13), 7496–7505.
OECD (2002). Cooperation on Existing Chemicals – Hazard Assessment ofPerfluorooctane Sulfonate and its Salts, Environment Directorate JointMeeting of the Chemicals Committee and the Working Party on Chemicals,Pesticides and Biotechnology, Organisation for Economic Co-operation andDevelopment, Paris, 21 November 2002. <http://www.oecd.org/dataoecd/23/18/2382880.pdf> Accessed 12.03.12.
Ostertag, S. K., Chan, H. M., Moisey, J., Dabeka, R., & Tittlemier, S. A. (2009). Historicdietary exposure to perfluorooctane sulfonate, perfluorinated carboxylates, andfluorotelomer unsaturated carboxylates from the consumption of store-boughtand restaurant foods for the Canadian population. Journal of Agricultural andFood Chemistry, 57(18), 8534–8544.
Paul, A. G., Jones, K. C., & Sweetman, A. J. (2009). A first global production, emission,and environmental inventory for perfluorooctane sulfonate. EnvironmentalScience and Technology, 43(2), 386–392.
Picó, Y., Farré, M., Llorca, M., & Barceló, D. (2011). Perfluorinated compounds infood: A global perspective. Critical Reviews in Food Science and Nutrition, 51(7),605–625.
Ribes, D., Fuentes, S., Torrente, M., Colomina, M. T., & Domingo, J. L. (2010).Combined effects of perfluorooctane sulfonate (PFOS) and maternal restraintstress on hypothalamus adrenal axis (HPA) function in the offspring of mice.Toxicology and Applied Pharmacology, 243(1), 13–18.
Serra-Majem, L., Ribas, L., Salvador, G., Castells, C., Serra, J., Jover, et al. (2003).Avaluació de l’estat nutricional de la població catalana 2002–2003. Evoluciódels hàbits alimentaris i del consum d’aliments i nutrients a Catalunya (1992–2003). Direcció General de Salut Pública. Departament de Sanitat i SeguretatSocial. Generalitat de Catalunya, Barcelona, Spain (in Catalan).
Strynar, M. J., & Lindstrom, A. B. (2008). Perfluorinated compounds in house dustfrom Ohio and North Carolina, USA. Environmental Science and Technology,42(10), 3751–3756.
Suja, F., Pramanik, B. K., & Zain, S. M. (2009). Contamination, bioaccumulation andtoxic effects of perfluorinated chemicals (PFCs) in the water environment: Areview paper. Water Science and Technology, 60(6), 1533–1554.
Tittlemier, S. A., Pepper, K., Seymour, C., Moisey, J., Bronson, R., Cao, X. L., et al.(2007). Dietary exposure of Canadians to perfluorinated carboxylates andperfluorooctane sulfonate via consumption of meat, fish, fast foods, and food

1582 J.L. Domingo et al. / Food Chemistry 135 (2012) 1575–1582
items prepared in their packaging. Journal of Agricultural and Food Chemistry,55(8), 3203–3210.
US EPA (2012). 2010/2015 PFOA Stewardship Program. United StatesEnvironmental Protection Agency. <http://www.epa.gov/oppt/pfoa/pubs/stewardship/index.html> Accessed 12.03.12.
van Asselt, E. D., Rietra, R. P. J. J., Römkens, P. F. A. M., & van Der Fels-Klerx, H. J.(2011). Perfluorooctane sulphonate (PFOS) throughout the food productionchain. Food Chemistry, 128(1), 1–6.
Yamashita, N., Kannan, K., Taniyasu, S., Horii, Y., Petrick, G., & Gamo, T. (2005). Aglobal survey of perfluorinated acids in oceans. Marine Pollution Bulletin, 51(8–12), 658–668.
Zhang, T., Sun, H., Lin, Y., Wang, L., Zhang, X., Liu, Y., et al. (2011). Perfluorinatedcompounds in human blood, water, edible freshwater fish, and seafood inChina: Daily intake and regional differences in human exposures. Journal ofAgricultural and Food Chemistry, 59(20), 11168–11176.
Zhao, Y. G., Wan, H. T., Law, A. Y., Wei, X., Huang, Y. Q., Giesy, J. P., et al. (2011). Riskassessment for human consumption of perfluorinated compound-contaminatedfreshwater and marine fish from Hong Kong and Xiamen. Chemosphere, 85(2),277–283.
Related Documents