____________________________________ 111 HUMAN DEVELOPMENT IN KARNATAKA: An Inter-District Analysis 5.1 Introduction In the previous chapter an attempt has been made to examine the regional disparities in human development at global, SAARC and national level. Disparities in terms of all the parameters of human development, Gender development and public expenditure on social development have been analysed. The present chapter has made similar attempt at the Karnataka state level to understand the nature and magnitude of such disparities that exist even at the state level. In the background of Karnataka state profile, the objectives of this chapter are to focus on the status of human development and to examine the linkages between economic growth and human development in the state. Further, it also intends to study the inter-district disparities in human development and public expenditure. 5.2 Karnataka: A Profile Karnataka State is situated in the Southern part of India, it lies between the latitudes 11.31 0 and 18.45 0 North and the longitudes 74.12 0 and 78.40 0 East on the western part of the Deccan Plateau. The state covers the total area of 1, 91,791 Sq kms, accounting for 5.83 per cent of the total geographical area of the country. The state is bounded by Maharashtra and Goa states in the north and northwest by the Arabian Sea in the west by Kerala and Tamil Nadu states in the south and by Andhra Pradesh on the east.

Welcome message from author
This document is posted to help you gain knowledge. Please leave a comment to let me know what you think about it! Share it to your friends and learn new things together.
Transcript
������������������������������� �������������������
____________________________________ 111
HUMAN DEVELOPMENT IN KARNATAKA:
An Inter-District Analysis
5.1 Introduction In the previous chapter an attempt has been made to examine the regional
disparities in human development at global, SAARC and national level.
Disparities in terms of all the parameters of human development, Gender
development and public expenditure on social development have been analysed.
The present chapter has made similar attempt at the Karnataka state level to
understand the nature and magnitude of such disparities that exist even at the
state level.
In the background of Karnataka state profile, the objectives of this chapter
are to focus on the status of human development and to examine the linkages
between economic growth and human development in the state. Further, it also
intends to study the inter-district disparities in human development and public
expenditure.
5.2 Karnataka: A Profile
Karnataka State is situated in the Southern part of India, it lies between the
latitudes 11.310 and 18.450 North and the longitudes 74.120 and 78.400 East on
the western part of the Deccan Plateau. The state covers the total area of 1,
91,791 Sq kms, accounting for 5.83 per cent of the total geographical area of the
country. The state is bounded by Maharashtra and Goa states in the north and
northwest by the Arabian Sea in the west by Kerala and Tamil Nadu states in the
south and by Andhra Pradesh on the east.
������������������������������� �������������������
____________________________________ 112
Demographically, Karnataka State has the total population of 53 million which
constitutes 5.13 percent of India’s population. Out of this 27 millions are males
and 26 millions are females. The Sex Ratio is 965 in the state stands above the
all India average of 933. The highest sex ratio in the state has recorded by Udupi
district 1,130 and the lowest by Bangalore 908. The state has the Density of
Population of 275, compared to 324 at the all-India during 2001. Bangalore has
the highest density of population of 2,985 persons per Km where as Uttar
Kannada has lowest density of 132. The literacy rate among the population of
67.04 percent and 59.68 percent in rural and 81.05 percent in urban areas.
For administrative purposes, Karnataka has been divided into 4 divisions -
Coastal Region, Malnad Region, Northern Region and Southern Region.
(Madaiah and Ramapriya 1989), State comprises of 176 taluks, 27 districts,
27,481 inhabited villages, 1,925 uninhabited villages and 270 towns have been
conceded by Karnataka state itself. Bijapur has the largest area of 17,069 Sq
Kms and Kodagu has the smallest area of 4,102 Sq Kms. (Karnataka at a Glance
2006-07, GOK).
The Annual Growth of the Gross State Domestic Product (GSDP) has
increased from 5.61 percent in 1994-95 to 6.21 percent in 2003-04, where as,
India has 7.25 and 3.98 percent respectively. At the same time Per Capita GSDP
has increased from Rs. 9,027 to Rs. 14,769, while India has increased from
Rs.2,229 to 12.796. The annual Growth of Per Capita GSDP has increased from
3.69 to 4.87 in Karnataka whereas India accounted for 5.36 and 2.21 percent
respectively. (KHDR, 2006).

������������������������������� �������������������
____________________________________ 113
The incidence of poverty in the state was marginally higher than the national
average. The expert group set up by the Planning Commission has estimated in
1999-2000 that 20.04 percent of the population was living below the poverty line
in Karnataka compared to the all India average of 26.10 percent (Government of
India 2001, Planning Commission). However, when only rural areas are
considered, poverty ratio was marginally lower in Karnataka State with 17.38
percent in comparison to 27.09 percent at the all India level. Urban poverty
appears to be particularly high in Karnataka where as estimated 25.25 percent of
the population live below the poverty line in comparison to 23.62 percent at the
all India level.
Presently, Karnataka is being recognized as the new growth center in a
reforming Indian economy powered by knowledge based industries such as
Software, Electronic, Biotechnology Pharmaceuticals and back offices for many
Multi National Companies (MNCs). The software revolution has been
aggressively wooing job seekers not only from across the country but also from
overseas in the state. Karnataka in recent times seems to be surging ahead
powered by its booming higher education sector to produce manpower for
diverse jobs in a booming economy.
5.3 Status of Human Development in Karnataka
Human development in Karnataka State was guided by the Millennium
Development Goals (UNDP, HDR 2001). The progress of human development of
Karnataka state was quite good, since the last two decades of human
development experiences in terms of literacy rate, life expectancy at birth, infant
mortality rate and other human development indicators have been better than all
������������������������������� �������������������
____________________________________ 114
India average. For example, the improvement in the literacy rate in the state
during 1991-2001 was 66.64 per cent as against an increase of 56.64 per cent
during 1981-91. The increase in the literacy rate in 1990s was less than half of
the achievement in 1980s.
Similarly, life expectancy has also improved marginally during 1991-92 to
2001-02 from 62.1 to 67.0 years The Infant Mortality Rate was declined from 82
per 1000 population in 1991-92 to 55 in 2002-03 and 50 in 2005-06, which is
higher than its neighbouring states of Kerala 14, Tamil Nadu 37, however lower
than Andhra Pradesh 57 and all-India has 58 per 1000 population. The Mortality
Rate in Karnataka for the year 2001-03 was 228 per lakh births which are highest
among the southern states of Kerala 110, Tamil Nadu 134 and Andhra Pradesh
has registered 195.
Karnataka State has medium human development rank which has increased
from 0.541 to 0.650 between 1991 to 2001 with 7th rank of the 15 Indian states,
were well above the national average 0.423 and 0.621 respectively during same
period. The human development of Karnataka state is more or less equal to
Egypt and considerably higher than South Asian countries such as Pakistan,
Nepal, Bhutan and Bangladesh in 2001. At the international level, state has 120th
rank while the country has 127th rank (UNDP, HDR 2003). The human
development indicators such as per capita NSDP, life expectancy at birth, literacy
rate and infant mortality rate are also improved over the period of time. The
state’s per capita gross state domestic product (GSDP) is above the national
average and it occupies the sixth place in ranking of 15 major states in India. The
total fertility rate in 1999 and has 3rd position, which is equal to Tamil Nadu next

������������������������������� �������������������
____________________________________ 115
only to Kerala and West Bengal. Life expectancy at birth for males and females
was 62.4 and 66.4 respectively. The literacy rate has been increasing over the
time and reached 66.6 percent in 2001.
Table 5.1 Selected Indicators of Human Development of Karnataka and other neighboring States
Sl. No.
Name of the
Districts
Per Capita
NSDP (Rs.)
Life
Expectancy at Birth (LEB)
Literacy
Rate 2001
Infant
Mortality Rate (IMR)
HDI
1. Andhra Pradesh 10,590 63.9 61.11 59 0.609 2. Karnataka 10,709 65.8 66.64 52 0.650 3. Maharashtra 14,892 68.3 77.27 42 0.706 4. Kerala 10,832 73.4 90.92 11 0.746 5. Tamil Nadu 12,717 68.4 73.47 43 0.687 India 10,774 64.8 65.49 57.4 0.627
Source: Government of Karnataka (2006) Karnataka Human Development Report 2005, Planning Commission, Bangalore. The table 5.1 presents selected indicators of human development of
Karnataka with other neighboring states. It also infers relative human
development position of Karnataka State with other neighbouring states such as
Maharashtra, Tamil Nadu, Kerala and Andhra Pradesh. Karnataka has
accounted for per capita NSDP of Rs. 10,709, life expectancy at birth 65.8 years,
infant mortality rate has 52 per 1000 birth, and literacy rate was 66.64 percent
and HDI value of 0.650. While most of the neighboring states except Andhra
Pradesh were above Karnataka’s relative position in all respects.
According to National Human Development Report (NHDR) published by the
planning commission, Karnataka state has improved HDI values from 0.346,
0.412 and 0.478 during 1981, 1991 and 2001 respectively among the 15 major
Indian states and it ranked at sixth in 1981 and seventh position in 1991 and
2001. (Planning Commission, GOK 2001). The data on each of the indicators
such as life expectancy, literacy and income suggests, however, Karnataka is

������������������������������� �������������������
____________________________________ 116
placed above the all India level but it still lags behind neighbouring states. Kerala
is well ahead of Karnataka and toped among Indian states followed by Tamil
Nadu and Maharashtra, in literacy and life expectancy at birth, while Maharashtra
is ahead in LEB and income.
.
Source: Government of India (2002), National Human Development Report 2001,
Planning Commission
The GDI values of Karnataka state have improved from 0.525 to 0.637 during
1991 to 2001 which was above the national average with the value of 0.621 in
2001. Karnataka is the sixth among 15 major states in gender development. At
the international level, Karnataka’s rank in terms of the GDI was 99 as against
103 among the 177 countries. When compared with other neighbouring states
except Andhra Pradesh with 0.621, the state like Kerala, Tamil Nadu and
Maharashtra were above the state average with value of 0.746, 0.706 and 0.687
respectively. Therefore, Karnataka State has a long way to reach the high human
development states. This situation has arised despite of immense increase in the
rate of economic growth in the state during the 90s. The vision of human
0 0.10.20.30.40.50.60.70.80.9
1981 1991 2001 1991 2001
HDI GDIYears
Fig 5.1: HDI & GDI of Karnataka & other Neigbouring States
Karnataka Kerala Tamil Nadu Maharashtra India
������������������������������� �������������������
____________________________________ 117
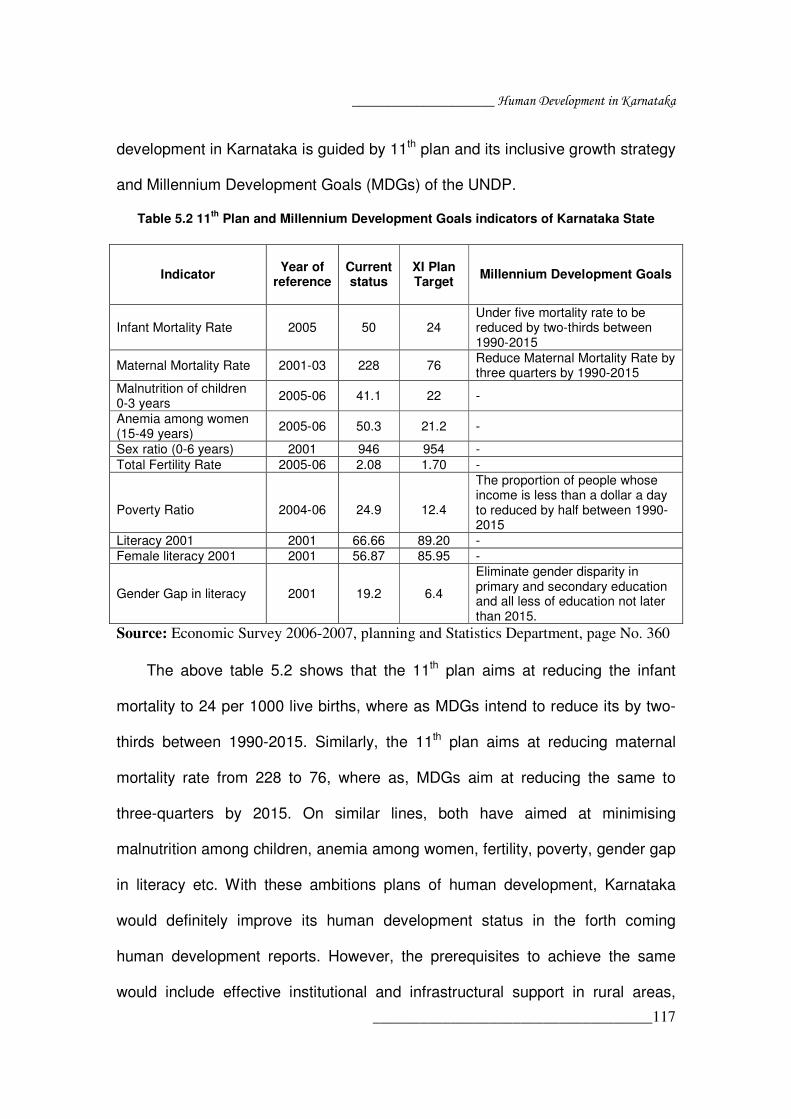
development in Karnataka is guided by 11th plan and its inclusive growth strategy
and Millennium Development Goals (MDGs) of the UNDP.
Table 5.2 11th Plan and Millennium Development Goals indicators of Karnataka State
Indicator
Year of reference
Current status
XI Plan Target Millennium Development Goals
Infant Mortality Rate 2005 50 24 Under five mortality rate to be reduced by two-thirds between 1990-2015
Maternal Mortality Rate 2001-03 228 76 Reduce Maternal Mortality Rate by three quarters by 1990-2015
Malnutrition of children 0-3 years 2005-06 41.1 22 -
Anemia among women (15-49 years) 2005-06 50.3 21.2 -
Sex ratio (0-6 years) 2001 946 954 - Total Fertility Rate 2005-06 2.08 1.70 -
Poverty Ratio
2004-06
24.9
12.4
The proportion of people whose income is less than a dollar a day to reduced by half between 1990-2015
Literacy 2001 2001 66.66 89.20 - Female literacy 2001 2001 56.87 85.95 -
Gender Gap in literacy 2001 19.2 6.4
Eliminate gender disparity in primary and secondary education and all less of education not later than 2015.
Source: Economic Survey 2006-2007, planning and Statistics Department, page No. 360
The above table 5.2 shows that the 11th plan aims at reducing the infant
mortality to 24 per 1000 live births, where as MDGs intend to reduce its by two-
thirds between 1990-2015. Similarly, the 11th plan aims at reducing maternal
mortality rate from 228 to 76, where as, MDGs aim at reducing the same to
three-quarters by 2015. On similar lines, both have aimed at minimising
malnutrition among children, anemia among women, fertility, poverty, gender gap
in literacy etc. With these ambitions plans of human development, Karnataka
would definitely improve its human development status in the forth coming
human development reports. However, the prerequisites to achieve the same
would include effective institutional and infrastructural support in rural areas,

������������������������������� �������������������
____________________________________ 118
good governance and integration of multitutional support to women and children
in rural areas.
5.4 Linkages of EG and HD in the State
A closer examination of the level of achievement in the three indicators of
human development reveals some of the insights into their inter-relationship. The
importance of income for achieving higher standards of living is well known.
Income influences the people to have purchasing power and it widens the range
of consumption pattern. Nonetheless, high literacy and health can be achieved
even with low per capita income, is a typical example of Kerala Model of human
development. However, this is not the virtuous cycle of human development.
It is common experience that good economic performance has not always led
to a good Human Development Index. Infact, India has done much better in
terms of income growth than in terms of human development. For example
Maharashtra and Punjab’s growth in income has been fairly high, but these
states have not made significant progress in the social sector – literacy and
health. Whereas, Kerala with a relatively low per capita income has made rapid
strides in human development. Therefore, enhancing the income of the people is
no doubt necessary but it must be ensured that the increased income is used by
the people for improving their literacy and health status. Accessibility and
affordability of education and health services for the people is crucial status to
improve their level of human development.
Even Karnataka state is not an exception for trade off relationship between
economic growth and human development For example, Mysore and Bellary
districts are placed at 5th and 10th rank in terms of per capita income but placed
������������������������������� �������������������
____________________________________ 119
at 14th and 17th rank respectively in terms of HDI. Probably one of the important
reasons for the distortion of this relationship of economic growth and human
development is inadequate attention paid to the development of social
infrastructure through public policy on health and education (HPCFRRI, 2004).
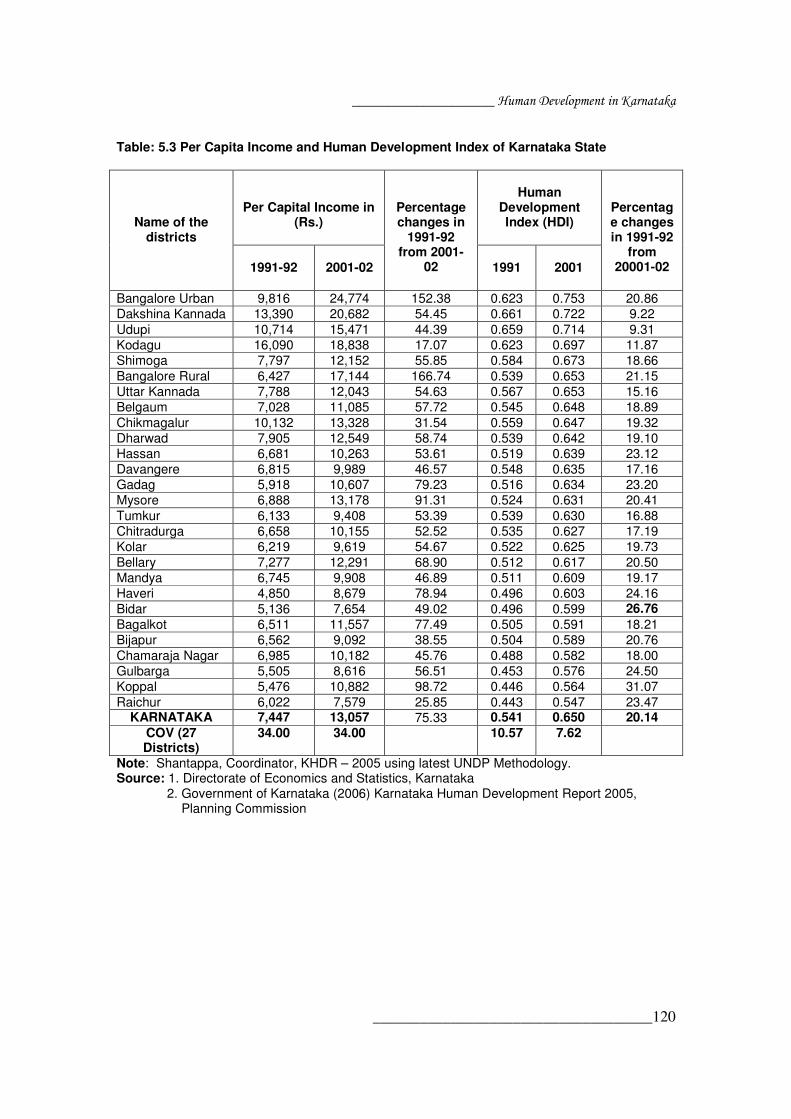
Various districts of Karnataka state have differences in per capita income and
human development index and this has been classified into three groups.
� Mutually reinforcing growth and human development - districts like
Bangalore Urban, Dakshina Kannada, Kodagu, Shimoga and Bangalore
Rural fall in the category of higher human development and higher per
capita income.
� Mutually stifling growth and human development – other districts have
remained at low human development with low per capita income. For
example Raichur, Chamaraja Nagar suffered slow advances in human
development and slow economic growth.
� Modest growth and Human Development – The rest of the districts of
state have neither districts human development nor per capita income
growth including Tumkur, Mysore, Hassan, Mandya and Chitradurga.
������������������������������� �������������������
____________________________________ 120
Table: 5.3 Per Capita Income and Human Development Index of Karnataka State
Per Capital Income in (Rs.)
Human
Development Index (HDI)
Name of the districts
1991-92
2001-02
Percentage changes in
1991-92 from 2001-
02
1991
2001
Percentage changes in 1991-92
from 20001-02
Bangalore Urban 9,816 24,774 152.38 0.623 0.753 20.86 Dakshina Kannada 13,390 20,682 54.45 0.661 0.722 9.22 Udupi 10,714 15,471 44.39 0.659 0.714 9.31 Kodagu 16,090 18,838 17.07 0.623 0.697 11.87 Shimoga 7,797 12,152 55.85 0.584 0.673 18.66 Bangalore Rural 6,427 17,144 166.74 0.539 0.653 21.15 Uttar Kannada 7,788 12,043 54.63 0.567 0.653 15.16 Belgaum 7,028 11,085 57.72 0.545 0.648 18.89 Chikmagalur 10,132 13,328 31.54 0.559 0.647 19.32 Dharwad 7,905 12,549 58.74 0.539 0.642 19.10 Hassan 6,681 10,263 53.61 0.519 0.639 23.12 Davangere 6,815 9,989 46.57 0.548 0.635 17.16 Gadag 5,918 10,607 79.23 0.516 0.634 23.20 Mysore 6,888 13,178 91.31 0.524 0.631 20.41 Tumkur 6,133 9,408 53.39 0.539 0.630 16.88 Chitradurga 6,658 10,155 52.52 0.535 0.627 17.19 Kolar 6,219 9,619 54.67 0.522 0.625 19.73 Bellary 7,277 12,291 68.90 0.512 0.617 20.50 Mandya 6,745 9,908 46.89 0.511 0.609 19.17 Haveri 4,850 8,679 78.94 0.496 0.603 24.16 Bidar 5,136 7,654 49.02 0.496 0.599 26.76 Bagalkot 6,511 11,557 77.49 0.505 0.591 18.21 Bijapur 6,562 9,092 38.55 0.504 0.589 20.76 Chamaraja Nagar 6,985 10,182 45.76 0.488 0.582 18.00 Gulbarga 5,505 8,616 56.51 0.453 0.576 24.50 Koppal 5,476 10,882 98.72 0.446 0.564 31.07 Raichur 6,022 7,579 25.85 0.443 0.547 23.47
KARNATAKA 7,447 13,057 75.33 0.541 0.650 20.14 COV (27 Districts)
34.00 34.00 10.57 7.62
Note: Shantappa, Coordinator, KHDR – 2005 using latest UNDP Methodology. Source: 1. Directorate of Economics and Statistics, Karnataka 2. Government of Karnataka (2006) Karnataka Human Development Report 2005, Planning Commission

������������������������������� �������������������
____________________________________ 121
Fig 5.2:Percentage changes in PCI and HDI of Karnataka State 1991-92 to 2001-02
0
20
40
60
80
100
120
140
160
180
Banga
lore U
rban
Daksh
ina K
anna
daUdu
pi
Kodag
u
Shimog
a
Banga
lore R
ural
Uttar K
anna
da
Belgau
m
Chikmag
alur
Dharw
ad
Hassa
n
Davan
gere
Gadag
Mysor
e
Tumku
r
Chitra
durg
aKola
r
Bellary
Mandy
a
Haver
i
Bidar
Bagalk
ot
Bijapu
r
Cham
araja
Nagar
Gulbar
ga
Koppa
l
Raichu
r
KARNATAKA
in P
erce
ntag
e
PCI HDI
Source: Government of Karnataka (2006) Karnataka Human Development Report 2005, Planning Commission, Bangalore. The table 5.3 depicts the district-wise estimates of HDI and per capita income
during 1991-92 and 2001-02, Bangalore Urban, Dakshina Kannada, Udupi,
Kodagu and Bangalore Urban have shown highest per capita income with
highest human development index, which were above the state average, where
as Raichur, Gulbarga, Bijapur and Haveri were in lowest development in both per
capita income and human development index. Mysore, Bellary and Bagalkot
have lopsided stifling development of better performance in per capita income
than HDI on the one hand and on the other, lopsided development was found in
Shimoga, Uttar Kannada, Tumkur, and Kolar having better HDI performance than
per capita income.
It further reveals that no changes in per capita GDP value of the co-efficient
of variation of 27 districts of Karnataka state which accounted for 34 per cent
both in 1991-92 and 2001-02, whereas the inter-district disparities in Human
������������������������������� �������������������
____________________________________ 122
Development Index have shown remarkable deceleration. It was 10.97 per cent
in 1981 but reduced to 10.57 and 7.62 per cent in 1991 and 2001 respectively.
The percentage changes in HDI values between 1991-92 to 2001-02 was
higher than percentage changes in per capita income between 1991-92 to 2001-
02 in the state. This indicates that except Bangalore Rural and Urban, majority of
poor and middle human development districts improved more than the relatively
better developed districts in the state. Therefore, there is some convergence
among districts in terms of HDI than per capita income. The figure 5.4 indicates
the changes in percentage of Per capita income and HDI value among the
districts of Karnataka state.
5.5 Inter district disparities in human development
Since the publication of First Global Human Development Report in 1990,
various countries of the World including India have published the Regional
Human Development Reports which contain HDI that is believed to express the
level of development in a better way than per capita income. In this regard
Madhya Pradesh was the first state India, which has published region-wise
Human Development Report in 1995.
Karnataka was the second State, which has brought out its first Human
Development Report in 1999. There have been some independent studies which
carried out works on inter district disparities in human development using latest
UNDP methodology. Among them studies by (Vysalu (1997), Benerjee and Roy
(1998), Rani (1999), Roy and Bhattacharya (1999) and Shanmugaum (2005) are
significant. The Government of Karnataka again published the second Human
Development Report - 2005 in 2006. In this report HDI has been computed for

������������������������������� �������������������
____________________________________ 123
all the 27 districts in the state using the UNDP, HDR 1999 methodology. This
shows the regional disparities in HDI of various districts in the state and enables
an understanding of the nature and changing magnitude of variations among
districts.
In addition to this, Government of Karnataka initiated the preparation of
District Human Development Reports for four districts such as Bijapur, Gulbarga,
Mysore and Udupi which are also using both UNDP and NHDR methodology.
The project is strengthening the state plans for human development. The survey
report also studied the four districts to assess the impact of the government
development programmes in uplifting the disadvantaged sections of the society
such as Scheduled Caste and Scheduled Tribes.
1. Classification of Districts in Karnataka State based on HDI
Human Development Group
Human Development Index (HDI)
1991 2001
High Human Development Group
HDI 0.800 and above Nil Nil
Medium
Human
Development
Group
HDI 0.500 - 0.799
Bangalore, Dakshina
Kannada, Udupi, Kodagu,
Shimoga, Bangalore Rural,
Uttara Kannada, Belgaum,
Chikmagalur, Dharwad,
Hassan, Davangere, Gadag,
Mysore Tumkur
Bangalore, Dakshina Kannada, Udupi, Kodagu, Shimoga, Bangalore Rural, Uttara Kannada, Belgaum, Chikmagalur, Dharwad, Hassan, Davangere, Gadag, Mysore Tumkur, Chamaraja Nagar, Gulbarga, Koppal and Raichur
Low Human
Development
Group
HDI below 0.500
Chamaraja Nagar, Gulbarga, Koppal and Raichur
Nil
Source: Planning Commission (2006) Karnataka Human Development Report 2005, Government of Karnataka

������������������������������� �������������������
____________________________________ 124
Like India, Karnataka state’s human development position is also classified
into three groups - high, medium and low human development index according to
their levels of human development for 1991 and 2001. There was no district in
the high human development groups. Except Chamaraja Nagar, Gulbarga,
Koppal and Raichur remaining all districts belonged to the medium human
development groups in 1991. But this situation was quite different in 2001, all the
27 districts belong to the medium human development group, it is also shown in
the table 5.4.
Karnataka State is marked by strong regional disparities in human
development. The range of variation in Human Development Index levels varies
from 0.753 to 0.547. Bangalore Urban takes the top position while Raichur is
placed at the bottom. At the international level its rank at 83, which is on par with
Philippines and above China and Srilanka. While Raichur district is the bottom
district of the state, its international status is ranked 133 on par with Papu and
New Guinea and lower than Ghana, Botswana, Myanmar and Cambodia (KHDR,
2005).
As for as, the GDI is concerned it varies from 0.731 in Bangalore Urban to
0.530 in Raichur in 2001. An international comparison shows the Bangalore
Urban district which was ranked first among other districts in the state, ranks 77
which is lower than Peru and Albania and higher than Guyana and Turkey.
Raichur district which has the lowest ranking in the state ranks 107 which was
marginally lower than India (0.574) and higher than Ghana and Cambodia.
The table 5.5 analyses the top and bottom HDI and GDI values of selected
districts of Karnataka. Bangalore Urban recorded highest in both HDI and GDI
������������������������������� �������������������
____________________________________ 125
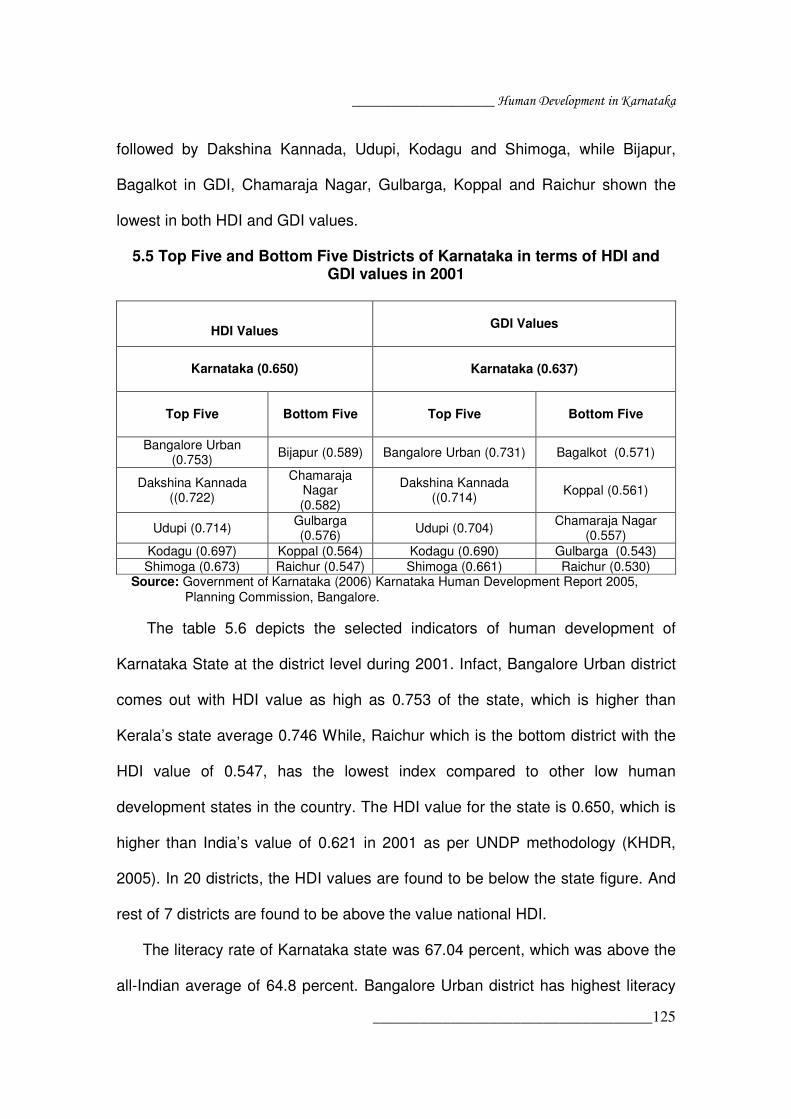
followed by Dakshina Kannada, Udupi, Kodagu and Shimoga, while Bijapur,
Bagalkot in GDI, Chamaraja Nagar, Gulbarga, Koppal and Raichur shown the
lowest in both HDI and GDI values.
5.5 Top Five and Bottom Five Districts of Karnataka in terms of HDI and GDI values in 2001
HDI Values
GDI Values
Karnataka (0.650)
Karnataka (0.637)
Top Five Bottom Five
Top Five
Bottom Five
Bangalore Urban (0.753) Bijapur (0.589) Bangalore Urban (0.731) Bagalkot (0.571)
Dakshina Kannada ((0.722)
Chamaraja Nagar (0.582)
Dakshina Kannada ((0.714) Koppal (0.561)
Udupi (0.714) Gulbarga (0.576) Udupi (0.704) Chamaraja Nagar
(0.557) Kodagu (0.697) Koppal (0.564) Kodagu (0.690) Gulbarga (0.543) Shimoga (0.673) Raichur (0.547) Shimoga (0.661) Raichur (0.530)
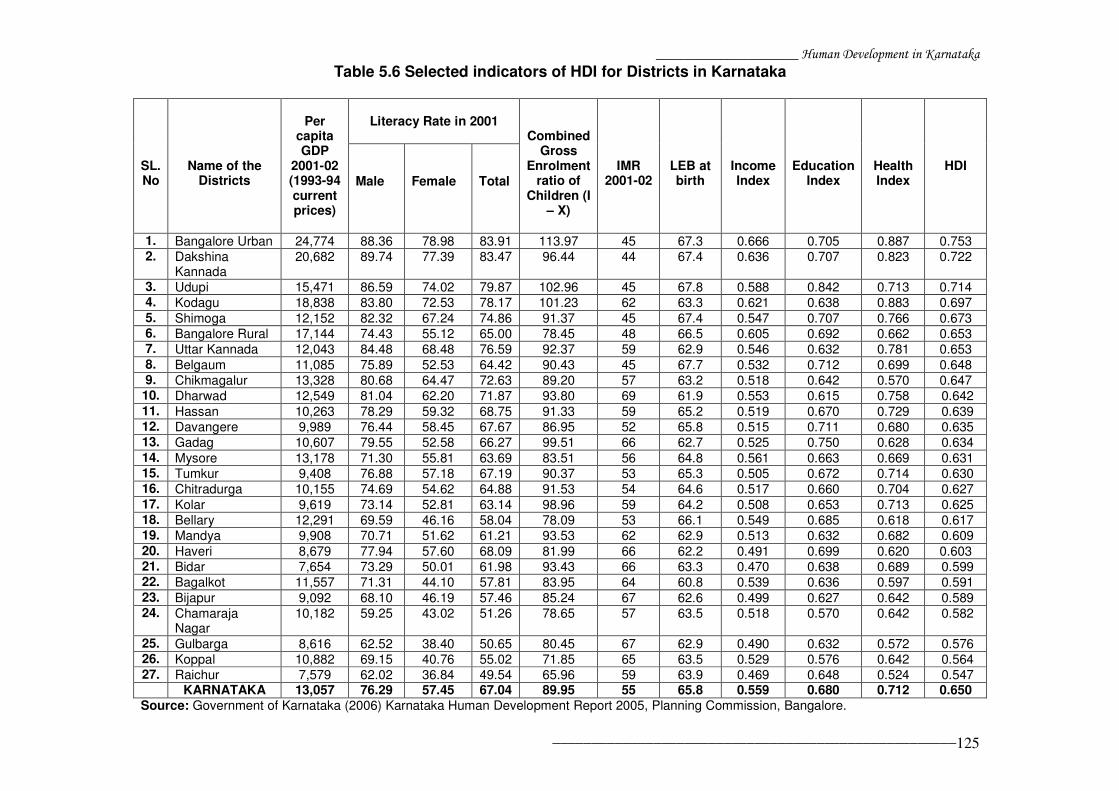
Source: Government of Karnataka (2006) Karnataka Human Development Report 2005, Planning Commission, Bangalore. The table 5.6 depicts the selected indicators of human development of
Karnataka State at the district level during 2001. Infact, Bangalore Urban district
comes out with HDI value as high as 0.753 of the state, which is higher than
Kerala’s state average 0.746 While, Raichur which is the bottom district with the
HDI value of 0.547, has the lowest index compared to other low human
development states in the country. The HDI value for the state is 0.650, which is
higher than India’s value of 0.621 in 2001 as per UNDP methodology (KHDR,
2005). In 20 districts, the HDI values are found to be below the state figure. And
rest of 7 districts are found to be above the value national HDI.
The literacy rate of Karnataka state was 67.04 percent, which was above the
all-Indian average of 64.8 percent. Bangalore Urban district has highest literacy
������������������������������� �������������������
____________________________________ 126
rate of 83.91 percent followed by Dakshina Kannada 83.47, Udupi 79.87, Kodagu
78.17, Uttar Kannada 76.59, Shimoga 74.86 and Chikmagalur 72.63 percent.
While Raichur and Gulbarga have lowest literacy rate of 49.54 and 50.65
respectively.
In terms of Per Capita GDP during 2001-02 the Bangalore Urban district
ensuring highest income of Rs.24, 774 followed by Dakshina Kannada, Kodagu,
Bangalore Rural accounted for Rs 20,682, 18,838 and 17,144 respectively.
These districts are also above the state average of Rs.13, 057. While on the
other hand districts such as Bidar, Bijapur, Tumkur and Kolar has lowest income
of Rs 7,654, 9092, 9,408 and 9,619 respectively. The two poorest districts are
Bidar and Gulbarga adjacent to the two richest districts of Bangalore Urban and
Dakshina Kannada. It is surprising that, the prosperity did not spread to the
neighboring districts from Bangalore Urban and Dakshina Kannada.
Another fact to be noted is that 21 out of 27 districts have a per capita income
below the state average. The fact was mentioned earlier, namely, the Per Capita
Income of the poorest district is only 25-30 percent of that of the richest district of
the state. The combined Gross Enrolment Ratio of children (I-X) has been
depicted in 7th column. The overall Gross Enrolment Ratio is highest in
Bangalore Urban accounted 113.97 was above the state average of 89.95, while
lowest in Raichur 65.96 respectively.
������������������������������� �������������������
____________________________________________________ 125
Table 5.6 Selected indicators of HDI for Districts in Karnataka
Literacy Rate in 2001
SL. No
Name of the
Districts
Per
capita GDP
2001-02 (1993-94 current prices)
Male
Female
Total
Combined Gross
Enrolment ratio of
Children (I – X)
IMR 2001-02
LEB at birth
Income Index
Education Index
Health Index
HDI
1. Bangalore Urban 24,774 88.36 78.98 83.91 113.97 45 67.3 0.666 0.705 0.887 0.753 2. Dakshina
Kannada 20,682 89.74 77.39 83.47 96.44 44 67.4 0.636 0.707 0.823 0.722
3. Udupi 15,471 86.59 74.02 79.87 102.96 45 67.8 0.588 0.842 0.713 0.714 4. Kodagu 18,838 83.80 72.53 78.17 101.23 62 63.3 0.621 0.638 0.883 0.697 5. Shimoga 12,152 82.32 67.24 74.86 91.37 45 67.4 0.547 0.707 0.766 0.673 6. Bangalore Rural 17,144 74.43 55.12 65.00 78.45 48 66.5 0.605 0.692 0.662 0.653 7. Uttar Kannada 12,043 84.48 68.48 76.59 92.37 59 62.9 0.546 0.632 0.781 0.653 8. Belgaum 11,085 75.89 52.53 64.42 90.43 45 67.7 0.532 0.712 0.699 0.648 9. Chikmagalur 13,328 80.68 64.47 72.63 89.20 57 63.2 0.518 0.642 0.570 0.647 10. Dharwad 12,549 81.04 62.20 71.87 93.80 69 61.9 0.553 0.615 0.758 0.642 11. Hassan 10,263 78.29 59.32 68.75 91.33 59 65.2 0.519 0.670 0.729 0.639 12. Davangere 9,989 76.44 58.45 67.67 86.95 52 65.8 0.515 0.711 0.680 0.635 13. Gadag 10,607 79.55 52.58 66.27 99.51 66 62.7 0.525 0.750 0.628 0.634 14. Mysore 13,178 71.30 55.81 63.69 83.51 56 64.8 0.561 0.663 0.669 0.631 15. Tumkur 9,408 76.88 57.18 67.19 90.37 53 65.3 0.505 0.672 0.714 0.630 16. Chitradurga 10,155 74.69 54.62 64.88 91.53 54 64.6 0.517 0.660 0.704 0.627 17. Kolar 9,619 73.14 52.81 63.14 98.96 59 64.2 0.508 0.653 0.713 0.625 18. Bellary 12,291 69.59 46.16 58.04 78.09 53 66.1 0.549 0.685 0.618 0.617 19. Mandya 9,908 70.71 51.62 61.21 93.53 62 62.9 0.513 0.632 0.682 0.609 20. Haveri 8,679 77.94 57.60 68.09 81.99 66 62.2 0.491 0.699 0.620 0.603 21. Bidar 7,654 73.29 50.01 61.98 93.43 66 63.3 0.470 0.638 0.689 0.599 22. Bagalkot 11,557 71.31 44.10 57.81 83.95 64 60.8 0.539 0.636 0.597 0.591 23. Bijapur 9,092 68.10 46.19 57.46 85.24 67 62.6 0.499 0.627 0.642 0.589 24. Chamaraja
Nagar 10,182 59.25 43.02 51.26 78.65 57 63.5 0.518 0.570 0.642 0.582
25. Gulbarga 8,616 62.52 38.40 50.65 80.45 67 62.9 0.490 0.632 0.572 0.576 26. Koppal 10,882 69.15 40.76 55.02 71.85 65 63.5 0.529 0.576 0.642 0.564 27. Raichur 7,579 62.02 36.84 49.54 65.96 59 63.9 0.469 0.648 0.524 0.547 KARNATAKA 13,057 76.29 57.45 67.04 89.95 55 65.8 0.559 0.680 0.712 0.650 Source: Government of Karnataka (2006) Karnataka Human Development Report 2005, Planning Commission, Bangalore.
126
The Life Expectancy at Birth for the State was 65.8 years and India it was 64.8
years. Belgaum obtained the highest of 67.7 years, while, Dharwad got the lowest of
61.9 years. In 21 districts, the life expectancy at birth was below the state average only
in six districts such as Bangalore Urban, Bangalore Rural, Belgaum, Bellary, Dakshina
Kannada and Shimoga registered above state average. Surprisingly, Kodagu district
was the 3rd highest in HDI of the state has only 63.3 years which was below the state
figures. Infant Mortality Rate for Karnataka State was 55 for 1,000 populations during
2001-02. In 17 districts, the rate was above the state values. It may be noted that the
highest Infant Mortality Rate was 67 in Gulbarga district. This information indicates that
significant human development disparities exist between the districts. It was also seen
that the poor districts are associated with low human development, low industrial
development and low agricultural productivity.
The table 5.7 indicates the HDI of 27 districts of Karnataka state for 1981, 1991 and
2001. The districts are ranked in the descending order of the HDI. The table reveals the
significant inter-district disparities in human development in Karnataka state. The HDI
values vary from 0.753 for Bangalore Urban to 0.547 for Raichur districts in 2001. In the
1999 Human Development Report, the variation was from 0.661 in Dakshina Kannada
district to 0.443 in Raichur district. However, what is encouraging is the fact that the
difference between the districts with the highest and the lowest HDI has narrowed from
49.21 percent in 1991 to 37.6 percent in 2001. During 1981 Dakshina Kannada was in
the 1st place among 19 districts of Karnataka state. Where as, in 1991 and 2001
Bangalore urban occupied first place.

127
Table 5.7 HDI of various Districts of Karnataka State during 1981 to 2001
1981
1991
2001
Sl No.
Name of the Districts
Value
Rank
Value
Rank
Value
Rank
Percentage changes in 2001 from
1991
1. Bangalore Urban 0.435 2 0.623 4 0.753 1 20.86 2. Dakshina Kannada 0.436 1 0.661 1 0.722 2 9.22 3. Udupi - - 0.659 2 0.714 3 9.31 4. Kodagu 0.429 3 0.623 3 0.697 4 11.87 5. Shimoga 0.377 6 0.584 5 0.673 5 18.66 6. Bangalore Rural - - 0.539 11 0.653 6 21.15 7. Uttar Kannada 0.406 4 0.567 6 0.653 7 15.16 8. Belgaum 0.352 11 0.545 9 0.648 8 18.89 9. Chikmagalur 0.381 5 0.559 7 0.647 9 19.32 10. Dharwad 0.360 7 0.539 10 0.642 10 19.10 11. Hassan 0.357 8 0.519 16 0.639 11 23.12 12. Davangere - - 0.548 8 0.635 12 17.16 13. Gadag - - 0.516 17 0.634 13 23.20 14. Mysore 0.338 13 0.524 14 0.631 14 20.41 15. Tumkur 0.354 9 0.539 12 0.630 15 16.88 16. Chitradurga 0.352 12 0.535 13 0.627 16 17.19 17. Kolar 0.352 10 0.522 15 0.625 17 19.73 18. Bellary 0.308 17 0.512 18 0.617 18 20.50 19. Mandya 0.330 14 0.511 19 0.609 19 19.17 20. Haveri - - 0.496 22 0.603 20 24.16 21. Bidar 0.319 16 0.496 23 0.599 21 26.76 22. Bagalkot - - 0.505 20 0.591 22 18.21 23. Bijapur 0.324 15 0.504 21 0.589 23 20.76 24. Chamaraja Nagar - - 0.488 24 0.582 24 18.00 25. Gulbarga 0.305 18 0.453 25 0.576 25 24.50 26. Koppal - - 0.446 26 0.564 26 31.07 27. Raichur 0.298 19 0.443 27 0.547 27 23.47
KARNATAKA 0.360 0.541 0.650 20.14 COV (All 27
Districts 11.97 10.57 7.62
Note: 1. 1981 human development index for computed only 20 districts of the state 2. Shantappa, Coordinator, KHDR – 2005 using latest UNDP Methodology. 3. Co-efficient of Variance Computed for 19 districts in 1981. Source: Government of Karnataka (2006) Karnataka Human Development Report 2005.

128
Fig 5.3: HDI of various Districts of Karnataka State during 1991 to 2001
0
0.1
0.2
0.3
0.4
0.5
0.6
0.7
0.8
Banga
lore U
rban
Daksh
ina K
anna
da
Udupi
Kodag
u
Shimog
a
Banga
lore R
ural
Uttar K
anna
da
Belgau
m
Chikmag
alur
Dharw
ad
Hassa
n
Davan
gere
Gadag
Mys
ore
Tumku
r
Chitra
durg
aKola
r
Bellar
y
Man
dya
Haver
i
Bidar
Bagalk
ot
Bijapu
r
Cham
araja
Nag
ar
Gulbar
ga
Koppa
l
Raichu
r
KARNATAKA
HD
I Val
ue
1991 2001
Fig 5.4: Percentage changes HDI during 1991 to 2001
0
5
10
15
20
25
30
35
Banga
lore U
rban
Daksh
ina K
anna
da
Udupi
Kodag
u
Shimog
a
Banga
lore R
ural
Uttar K
anna
da
Belgau
m
Chikmag
alur
Dharw
ad
Hassa
n
Davan
gere
Gadag
Mysor
e
Tumku
r
Chitra
durg
aKola
r
Bellar
y
Mandy
a
Haver
i
Bidar
Bagalk
ot
Bijapu
r
Cham
araja
Nag
ar
Gulbar
ga
Koppa
l
Raichu
r
KARNATAKA
in p
erce
ntag
e
The percentage change in HDI values during 1991-2001 was higher in districts which
had lower HDI in 19991 (See figure 5.1). This indicates that the backward districts
improved more in human development than the relatively better developed districts in
the state. Therefore, there is some convergence among districts in terms of HDI. The
co-efficient of variation shows that it declined from 11.97 in 1981 to 10.57 and 7, 62
129
percent in 1991 and 2001 respectively. This indicates the decline in regional disparities
in human development across the districts of Karnataka State. HDI in Karnataka state
has improved from 0.360 in 1981 to 0.541 in 1991 and 0.650 in 2001 with 20.14
percentage changes during the same period.
Gender related development Index in Karnataka Karnataka has performed better in gender related development and occupies
seventh rank among major states. But HDI values of Karnataka are higher than GDI
values in all districts. It shows that the levels of socio-economic development of women
are lower than the general level all over Karnataka. It was noted that higher level of
economic development does not ensure higher gender related development or human
development. Districts of Malnad and Coastal areas, which rank lower in per capita
income, have higher gender development.
The table 5.5 depicts the progress of Gender Related Development of various
districts of Karnataka state. The progress of GDI at the state level has improved from
0.525 in 1991 to 0.637 in 2001 and registered an increase of 21.33 percent in ten years.
The pace of reduction in gender disparities is rather slow. It is only marginally higher
than the increase of 20.41 percent in the HDI during the same period. Although the
values for the GDI of districts are lower than the corresponding values for the HDI, the
GDI ranking compares favorably within the HDI ranking for a majority of districts during
1991 and 2001. This indicates the districts with high human development have lower
gender disparities while districts with poor human development indicators have greater
gender inequality. However, there are significant variations in the GDI across the
districts.
Table 5.8 GDI of various Districts of Karnataka State during1991 to 2001

130
1991
2001
SL No.
Name of the Districts
Value
Rank
Value
Rank
Percentage changes in 2001 from
1991
1. Bangalore Urban 0.592 4 0.731 1 23.47 2. Dakshina Kannada 0.645 1 0.714 2 10.69 3. Udupi 0.644 2 0.704 3 9.31 4. Kodagu 0.617 3 0.690 4 11.83 5. Shimoga 0572 5 0.661 5 15.55 6. Bangalore Rural 0.524 12 0.640 6 22.13 7. Uttar Kannada 0.548 7 0.639 7 16.60 8. Belgaum 0.525 11 0.635 9 20.95 9. Chikmagalur 0.550 6 0.636 8 15.63
10. Dharwad 0.531 8 0.26 11 17.89 11. Hassan 0.507 14 0.630 10 24.26 12. Davangere 0.530 9 0.621 13 17.16 13. Gadag 0.502 16 0.625 12 24.50 14. Mysore 0.496 18 0.605 18 21.97 15. Tumkur 0.528 10 0.618 15 17.04 16. Chitradurga 0,514 13 0.618 14 20.23 17. Kolar 0.505 15 0.613 16 21.38 18. Bellary 0.499 17 0.606 17 21.44 19. Mandya 0.491 19 0.593 20 20.77 20. Haveri 0.480 22 0.596 19 24.16 21. Bidar 0.477 23 0.572 22 19.91 22. Bagalkot 0.483 21 0.571 23 18.21 23. Bijapur 0.486 20 0.573 21 17.90 24. Chamaraja Nagar 0.472 24 0.557 25 18.00 25. Gulbarga 0.432 25 0.543 26 25.69 26. Koppal 0.428 26 0.561 24 31.07 27. Raichur 0.422 27 0.530 27 25.59
KARNATAKA 0.525 - 0.637 - 21.33 COV (all 27
Districts) 11.81 14.13
Source: Government of Karnataka (2006) Karnataka Human Development Report 2005, Planning Commission

131
Fig 5.5: Percentage changes in GDI from 1991 to 2001
0
5
10
15
20
25
30
35
Banga
lore U
rban
Daksh
ina K
anna
daUdu
pi
Kodag
u
Shimog
a
Banga
lore R
ural
Uttar K
anna
da
Belgau
m
Chikmag
alur
Dharw
ad
Hassa
n
Davan
gere
Gadag
Mysor
e
Tumku
r
Chitra
durg
aKola
r
Bellar
y
Mandy
a
Haver
i
Bidar
Bagalk
ot
Bijapu
r
Cham
araja
Nag
ar
Gulbar
ga
Koppa
l
Raichu
r
KARNATAKA
in p
erce
ntag
e
GDI indices vary from 0.645 in Dakshina Kannada to 0.422 in Raichur during 2001.
It is also interesting to note that ranking in GDI almost follow the HDI ranking, a
phenomenon that is not very common at the international level. The four districts such
as Bangalore Urban, Dakshina Kannada, Udupi and Kodagu have occupied first four
places at top and Raichur, Gulbarga, Chamaraja Nagar and Koppal lie at the bottom.
The extent of gender disparities in development among different districts is
alarming. The GDI of Bangalore Urban can be placed at 92nd rank among the countries
of the world, which is far ahead of the 103rd rank that the state itself would attain with
0.574 position accorded to the country. But Raichur district would only achieve nearly
130th rank, given the degree of disparity in human development between the sexes.
However, in terms of percentage change between 1991 to 2001 Bangalore Urban and
Raichur have 23.47 and 25.59 percent respectively. It shows that Raichur had much
faster growth than Bangalore Urban in terms of gender development.

132
5.7 Public Expenditure on Human Development in Karnataka
Financing human development is a very critical aspect for the modest human
development index of states like Karnataka. Especially the poor and other vulnerable
sub-populations are supported by the state, enabling them to become empowered
beings capable of realizing their inherent potential in a participatory and democratic
context. UNDP Human Development Report 1991 noted that the best strategy for
human development is to ensure, through strong policies, generation and better
distribution of primary incomes. In addition to this, the government investment in social
infrastructure – schools, health clinics, nutrition, food subsidies as well as physical
infrastructure – road, electricity and housing can help the poor bridge the gap caused by
paucity of income.
The size of public expenditure in a state depends on the state’s own revenue
income as well as on transfers from the central government. The size of central
transfers in a federal set-up such as India depends on several factors, such as the
recommendations of the finance commission, central schemes for welfare and
development, central aid for disasters and calamities and so on.
Social sector expenditure is the most effective measure to improve human
development through augmenting various social attainments like literacy rate, and life
expectancy at birth. However, with the prevailing fiscal constraint in the state, it is of
utmost importance to evaluate the government’s commitment in terms of the expenditure
incurred by it. In the post-reforms period, these ratios do not show any radical
improvement.
The table 5.9 analyses the public expenditure ratio and other three ratios of Karnataka
State between 1990-91 to 2002-03. The PER increased from 17.78 percent in 1990-91 to

133
18.83 percent in 2002-03, before declining to 16.33 percent in 1998-99. Thereafter,
mainly due to pay and pension revision, the PER increase constitute more than 18
percent of GSDP in 1999-2000. Infact, the full effect of the pay revision was done in 2000-
01 as the government had to incur substantial expenditures to pay arrears. Thus, in 2001-
02, the public expenditure – GDP ratio increased to 20.06 percent. However, the fiscal
adjustment programme resulted in the deceleration of expenditure, to reduce the PER to
18.8 percent in the following years, and has stabilized at that level in subsequent years.
Table 5.9 Public Expenditure ratios in Karnataka, 1990-91 to 2002-03
(Percent)
Year
Public Expenditure
Ratio (PER)
Social
Allocation Ratio (SAR)
Social Priority
Ratio (SPR)
Human
Expenditure Ratio (HER)
1990-91 17.78 41.22 55.45 4.06 1991-92 17.61 40.20 53.72 3.80 1992-93 19.18 36.77 52.54 3.71 1993-94 18.45 39.50 54.03 3.94 1994-95 17.70 39.19 53.83 3.73 1995-96 17.79 37.62 51.94 3.48 1996-97 17.75 36.90 51.02 3.34 1997-98 16.73 38.40 51.99 3.34 1998-99 16.33 39.49 52.55 3.39
1999-2000 18.09 37.75 54.86 3.75 2000-01 18.22 37.89 52.84 3.65 2001-02 20.06 34.96 52.29 3.67 2002-03 18.83 34.36 50.69 3.28
Note: Expenditure under different heads has been estimated as the sum of revenue expenditure and capital expenditure (including loans and advances net of repayments)
Source: Estimated from Finance Accounts of Karnataka, Accountant General, GOI
134
Fig 5.6: Public Expenditure Ratio in Karnataka 1990-91 to 2002-03
0
10
20
30
40
50
60
1990-91
1991-92
1992-93
1993-94
1994-95
1995-96
1996-97
1997-98
1998-99
1999-2000
2000-01
2001-02
2002-03
in R
atio
Public Expenditure Ratio (PER) Social Allocation Ratio (SAR)Social Priority Ratio (SPR) Human Expenditure Ratio (HER)
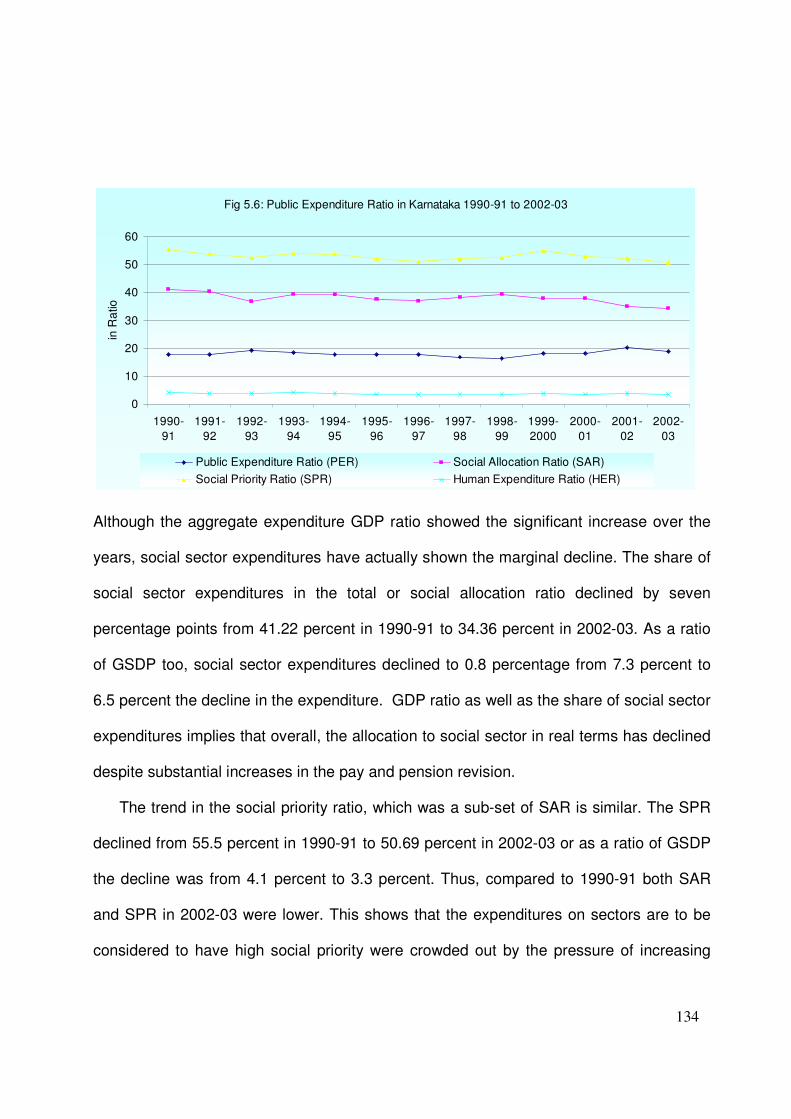
Although the aggregate expenditure GDP ratio showed the significant increase over the
years, social sector expenditures have actually shown the marginal decline. The share of
social sector expenditures in the total or social allocation ratio declined by seven
percentage points from 41.22 percent in 1990-91 to 34.36 percent in 2002-03. As a ratio
of GSDP too, social sector expenditures declined to 0.8 percentage from 7.3 percent to
6.5 percent the decline in the expenditure. GDP ratio as well as the share of social sector
expenditures implies that overall, the allocation to social sector in real terms has declined
despite substantial increases in the pay and pension revision.
The trend in the social priority ratio, which was a sub-set of SAR is similar. The SPR
declined from 55.5 percent in 1990-91 to 50.69 percent in 2002-03 or as a ratio of GSDP
the decline was from 4.1 percent to 3.3 percent. Thus, compared to 1990-91 both SAR
and SPR in 2002-03 were lower. This shows that the expenditures on sectors are to be
considered to have high social priority were crowded out by the pressure of increasing

135
expenditure on salaries, debt servicing and other implicit and explicit subsidies in the
wake of stagnant revenues. The second global Human Development Report
1991suggested - PER for a country should be around 25 percent, SAR should be about
40 percent and SPR about 50 percent. The Human Expenditure Ratio (HER) should be
about 5 percent. However, data reveal that PER in Karnataka has been less than the
suggested norm of 25 percent over the decade.
5.8 Summary
This chapter is an attempt to provide a profile of human development status in
Karnataka focusing on inter district disparities. Human development in Karnataka is
guided by MDGs and the 11th plan’s inclusive growth strategy. The human development
in the state is improved by 20.14 per cent between 1991-2001, which is above the
national average. By 2001, all the 27 districts of the state were in medium human
development group. However, when compared to her neighbour states namely Kerala,
Tamil Nadu and Maharashtra her HDI achievement is lower. Although, characterised by
significant inter district variations in human development, the co-efficient of variation is
declining from 11.97, 10.57 and 7.6 in 1981, 1991 and 2001 respectively. This is, again in
tune with global convergence trend in human development. Similarly, with regard to GDI
between 1991 and 2001, it registered an increase of 21.33 per cent, which is slightly
higher than percentage change in human development.
Tradeoff relationship between economic growth and human development is also
reflected in Karnataka. Further the social expenditure in Karnataka has shown a slightly
declining trend between 1991 to 2003. Her human expenditure ratio is lesser than 5 per
cent of public expenditure suggested by the UNDP. However, along with increasing social
136
sector expenditure, the state has to get rid of structural inadequacies and rigidities to get
maximum benefit from government intervention.
Related Documents