Article Human Carboxylesterase 2 Reverses Obesity- Induced Diacylglycerol Accumulation and Glucose Intolerance Graphical Abstract Highlights d Obesity decreases hepatic activity of AADAC and CES2 in humans d CES2 depletion impairs lipid and glucose metabolism in primary human hepatocytes d Human CES2 expression reverses hepatic steatosis and glucose intolerance in mice d CES2 controls a hepatic lipid network dysregulated in human and mouse obesity Authors Maxwell A. Ruby, Julie Massart, Devon M. Hunerdosse, ..., Erik Na ¨ slund, Daniel K. Nomura, Juleen R. Zierath Correspondence [email protected] In Brief Ruby et al. utilize activity-based protein profiling to discover decreased arylacetamide deacetylase and carboxylesterase 2 activities in livers from obese humans. Carboxylesterase 2 controls a lipid network dysregulated in human obesity to reverse hepatic steatosis, glucose intolerance, and decrease inflammation in high-fat fed mice. Ruby et al., 2017, Cell Reports 18, 636–646 January 17, 2017 ª 2017 The Author(s). http://dx.doi.org/10.1016/j.celrep.2016.12.070

Welcome message from author
This document is posted to help you gain knowledge. Please leave a comment to let me know what you think about it! Share it to your friends and learn new things together.
Transcript
Article
Human Carboxylesterase
2 Reverses Obesity-Induced Diacylglycerol Accumulation and GlucoseIntoleranceGraphical Abstract
Highlights
d Obesity decreases hepatic activity of AADAC and CES2 in
humans
d CES2 depletion impairs lipid and glucose metabolism in
primary human hepatocytes
d Human CES2 expression reverses hepatic steatosis and
glucose intolerance in mice
d CES2 controls a hepatic lipid network dysregulated in human
and mouse obesity
Ruby et al., 2017, Cell Reports 18, 636–646January 17, 2017 ª 2017 The Author(s).http://dx.doi.org/10.1016/j.celrep.2016.12.070
Authors
Maxwell A. Ruby, Julie Massart,
Devon M. Hunerdosse, ..., Erik Naslund,
Daniel K. Nomura, Juleen R. Zierath
In Brief
Ruby et al. utilize activity-based
protein profiling to discover decreased
arylacetamide deacetylase and
carboxylesterase 2 activities in livers
from obese humans. Carboxylesterase 2
controls a lipid network dysregulated in
human obesity to reverse hepatic
steatosis, glucose intolerance, and
decrease inflammation in high-fat fed
mice.
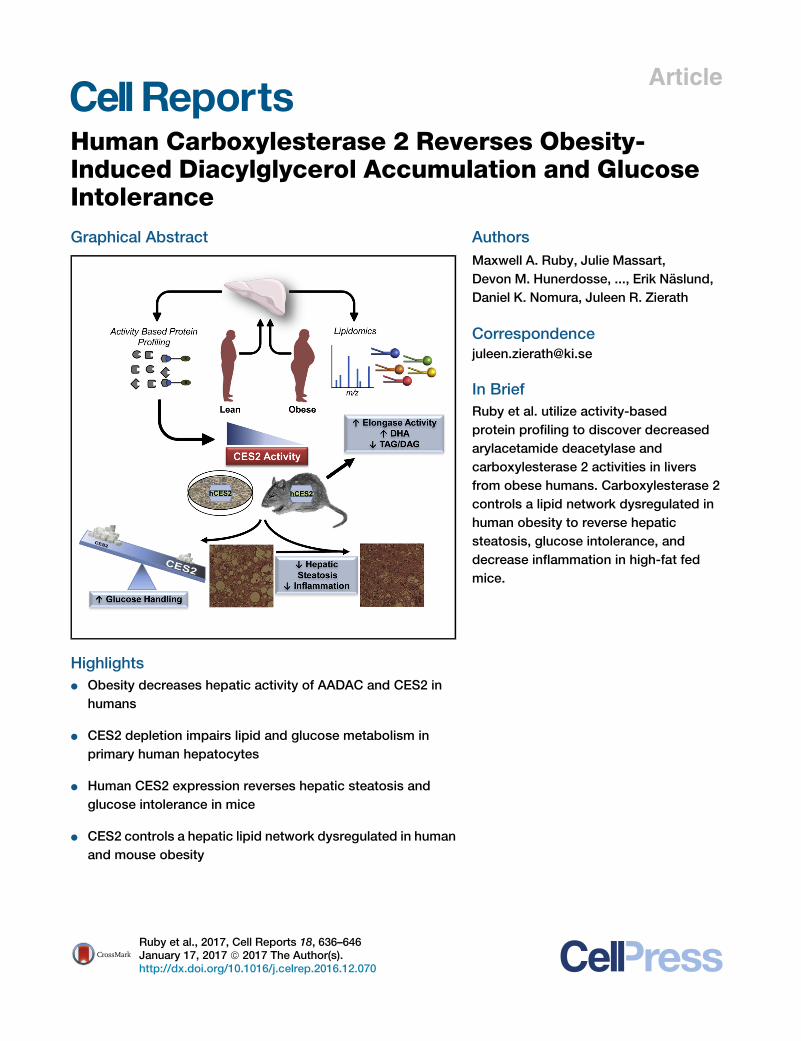
Cell Reports
Article
Human Carboxylesterase 2 ReversesObesity-Induced Diacylglycerol Accumulationand Glucose IntoleranceMaxwell A. Ruby,1 Julie Massart,1 Devon M. Hunerdosse,2 Milena Schonke,1 Jorge C. Correia,3 Sharon M. Louie,2
Jorge L. Ruas,3 Erik Naslund,4 Daniel K. Nomura,2 and Juleen R. Zierath1,5,*1Section for Integrative Physiology, Department of Molecular Medicine and Surgery, Karolinska Institutet, 17177 Stockholm, Sweden2Departments of Chemistry, Molecular and Cell Biology, and Nutritional Sciences and Toxicology, University of California, Berkeley, Berkeley,
CA 94720, USA3Molecular and Cellular Exercise Physiology Unit, Department of Physiology and Pharmacology, Karolinska Institutet, 17177 Stockholm,Sweden4Division of Surgery, Department of Clinical Sciences, Danderyd Hospital, Karolinska Institutet, 17177 Stockholm, Sweden5Lead Contact*Correspondence: [email protected]
http://dx.doi.org/10.1016/j.celrep.2016.12.070
SUMMARY
Serine hydrolases are a large family of multifunc-tional enzymes known to influence obesity. Here,we performed activity-based protein profiling toassess the functional level of serine hydrolases inliver biopsies from lean and obese humans in orderto gain mechanistic insight into the pathophysi-ology of metabolic disease. We identified reducedhepatic activity of carboxylesterase 2 (CES2) and ar-ylacetamide deacetylase (AADAC) in human obesity.In primary human hepatocytes, CES2 knockdownimpaired glucose storage and lipid oxidation. Inmice, obesity reduced CES2, whereas adenoviraldelivery of human CES2 reversed hepatic steatosis,improved glucose tolerance, and decreased inflam-mation. Lipidomic analysis identified a network ofCES2-regulated lipids altered in human and mouseobesity. CES2 possesses triglyceride and diacylgly-cerol lipase activities and displayed an inverse corre-lation with HOMA-IR and hepatic diacylglycerol con-centrations in humans. Thus, decreased CES2 is aconserved feature of obesity and plays a causativerole in the pathogenesis of obesity-related metabolicdisturbances.
INTRODUCTION
The prevalence of obesity has increased at an alarming rate over
the past decades with dire public health consequences (NCD
Risk Factor Collaboration, 2016). Excess weight dramatically
increases a person’s risk of developing numerous diseases,
including cardiovascular disease, cancer, and type 2 diabetes
mellitus. Obesity-associated insulin resistance, characterized
by intracellular defects in insulin action, is central to the etiology
636 Cell Reports 18, 636–646, January 17, 2017 ª 2017 The Author(sThis is an open access article under the CC BY license (http://creative
of related metabolic disturbances. Hepatic insulin resistance
promotes aberrant glucose production, atherogenic dyslipide-
mia, and steatosis, which may lead to a hypercoagulable state
and increased secretion of inflammatory proteins. Presently,
effective therapies for hepatic insulin resistance are limited,
with few clinical options available. The development of novel
therapeutics requires an improved understanding of the mecha-
nistic underpinnings of obesity and insulin resistance.
Transcriptomic and traditional proteomic technologies allow
for the quantification of mRNA and protein levels, respectively.
However, physiology is determined by enzyme activity, which
is often tightly regulated by post-translational modifications
that are undetectable by transcriptomic and standard proteomic
analysis. Activity-based protein profiling (ABPP) was developed
as a method to assess the functional state of enzyme families in
native proteomes (Cravatt et al., 2008). ABPP utilizes site-
directed chemical probes composed of a reactive group linked
to a reporter tag for the detection of probe-bound enzymes.
ABPP of serine hydrolase activity has proved particularly effec-
tive in the identification of dysregulated enzyme activities in
pathological states and the development of small-molecule in-
hibitors (Nomura et al., 2010). For ABPP of serine hydrolases, a
fluorophosphonate (FP) reactive group covalently binds the
serine within the catalytic triad in an activity-dependent manner,
and a biotin reporter tag enables enrichment of probe-bound en-
zymes for subsequent quantification bymultidimensional protein
identification technology (MudPIT) (Jessani et al., 2005). Thus,
ABPP enables the simultaneous determination of multiple serine
hydrolase activities from a single sample.
The serine hydrolase family consists of �240 enzymes, nearly
evenly distributed between proteases andmetabolic hydrolases,
and regulates a wide array of physiological processes (Long
and Cravatt, 2011). Numerous serine hydrolases impact meta-
bolic homeostasis by controlling the bulk flux of metabolites,
and the synthesis and degradation of key signaling molecules
such as glucagon-like peptide-1 and the endocannabinoids
(Blankman and Cravatt, 2013). Importantly, serine hydrolases
have proved amenable to pharmacological intervention with six
).commons.org/licenses/by/4.0/).
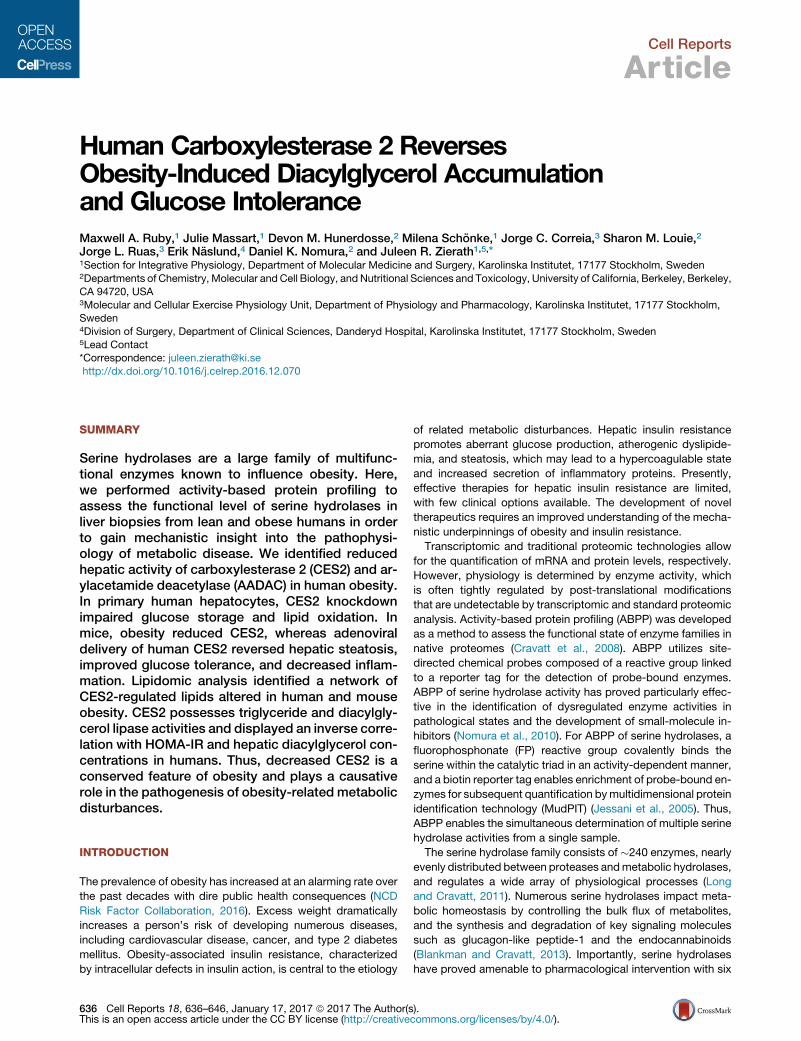
A
Enzy
me
Act
ivity
(Spe
ctra
l Cou
nts)
0
250
500
750
1500
2250
3000
CES1 FASN CPS1 CES2 AADAC APEH ABHD10 MGLL LYPLA1
*
*
CB
FFA
Cer
amid
e
LPA
LPC
LPE
LPI
LPS
MA
G
16:0
18:0
18:1
20:4
PA PC PE PG PI PS PCe
PGe
16:0/18:1
18:0/18:1
16:0/20:4
18:0/20:4
DA
G
SM
Fold Change of Lean0 0.5 1.5 21
0.0
0.5
1.0
1.5
SCD
1 A
ctiv
ity(1
8:1/
18:0
)
0.0
0.5
1.0
1.5
*
Elon
gase
Act
ivity
(18:
0/16
:0)
Lean
Obese
PIe
D
C18:0e/C18:1 PCe
C22:6 FFA MAG 22:6 0.0
0.2
0.4
0.6
0.8
1.0
1.2
1.4
*
**
Lipi
d Le
vel
(Fol
d C
hang
e)
Figure 1. The Hepatic Lipidome and Serine
Hydrolase Activities in Human Obesity
(A) Single- and double-chain species detected
within the targeted lipidomics from lean (n = 8)
and obese (n = 15) individuals. Heatmaps are
shown as fold change of obese compared to lean
individuals.
(B) Enzyme activities determined by product-
to-precursor ratios from the targeted lipidomics
dataset.
(C) Additional lipids significantly altered by
obesity.
(D) Hepatic serine hydrolase activities in lean
(n = 7) and obese (n = 9) individuals determined
by ABPP-MudPIT. *q < 0.05. Data are presented
as mean ± SEM.
classes of drugs already approved for use in the clinic, including
dipeptidyl peptidase-4 and pancreatic/gastric lipase inhibitors
for the treatment of type 2 diabetes mellitus and obesity, respec-
tively (Long and Cravatt, 2011).
Although ABPP has been used successfully to discover dysre-
gulated enzymes in animal models of obesity, the activity levels
of hepatic serine hydrolases in human obesity remain unknown
(Barglow and Cravatt, 2004). Here, we utilized ABPP-MudPIT
of serine hydrolases coupled to targeted lipidomics to gain a
systems-level understanding of hepatic biochemical networks
dysregulated in human obesity. ABPP revealed decreased ac-
tivity of the metabolic serine hydrolases arylacetamide deacety-
lase (AADAC) and carboxylesterase 2 (CES2) in liver from obese
humans. Utilizing loss- and gain-of-function studies in primary
human hepatocytes and mice, respectively, we identify CES2
as a potent regulator of lipid metabolism, insulin sensitivity,
and inflammation. Targeted lipidomics uncovers a CES2-regu-
lated lipid network altered in human and mouse obesity. This
work identifies dysregulated hepatic biochemical networks in
human obesity and establishes CES2 as a regulator of metabolic
disease.
Cell R
RESULTS
Altered Hepatic Lipids andDecreased Activity of AADAC andCES2 in Human ObesityLiver biopsies were obtained from lean
(BMI 19–25) and obese (BMI 35–50) indi-
viduals during elective cholecystectomy
or Roux-en-Y gastric bypass surgery,
respectively. Despite marked obesity,
insulin resistance, and reduced high-
density lipoprotein (HDL) cholesterol, the
obese individuals had neither diagnosed
non-alcoholic fatty liver disease (NAFLD)
nor elevated serum levels of liver en-
zymes (Table S1). To determine the effect
of obesity on the liver lipidome, targeted
lipidomics was used to quantify 116 indi-
vidual lipid species. Obesity increased
oleate-containing diacylglycerols (DAGs),
whereas the ceramide and triglyceride (TAG) species tested
were unchanged (Figure 1A and Data S1). Oleate-containing
DAG concentrations correlated with HOMA-IR (r = 0.61 and 0.75
for DAG 16:0/18:1 and 18:0:18:1, respectively; both p < 0.01).
Similar to changes observed inNAFLD, elongase andSCD1 activ-
ities were diminished and increased, respectively, although SCD1
activity failed to reach statistical significance (q = 0.09) (Figure 1B)
(Kotronen et al., 2009).
DAGs containing arachidonic acid were diminished in obesity
(Figure 1A). Decreases in arachidonyl-containing species were
also observed in lysophospholipids and monoacylglycerol
(MAG), whereas arachidonic acid remained unchanged (Fig-
ure 1A). Multiple forms of lysophosphatidylserine, lysophospha-
tidic acid, phosphatidylglycerol-ether, phosphatidylinositol-
ether, and phosphatidylglycerol were lower in obese individuals
(Figure 1A). Hepatic docosahexaenoic acid (DHA) and C22:6
MAGwere also reduced in obesity (Figure 1C). The complete lip-
idomics dataset is available in Data S1.
To assess hepatic serine hydrolase activity in human obesity,
ABPP-MudPIT was performed on liver biopsies with sufficient
material (Table S1). Although the majority of serine hydrolases
eports 18, 636–646, January 17, 2017 637
A B
C D
E F
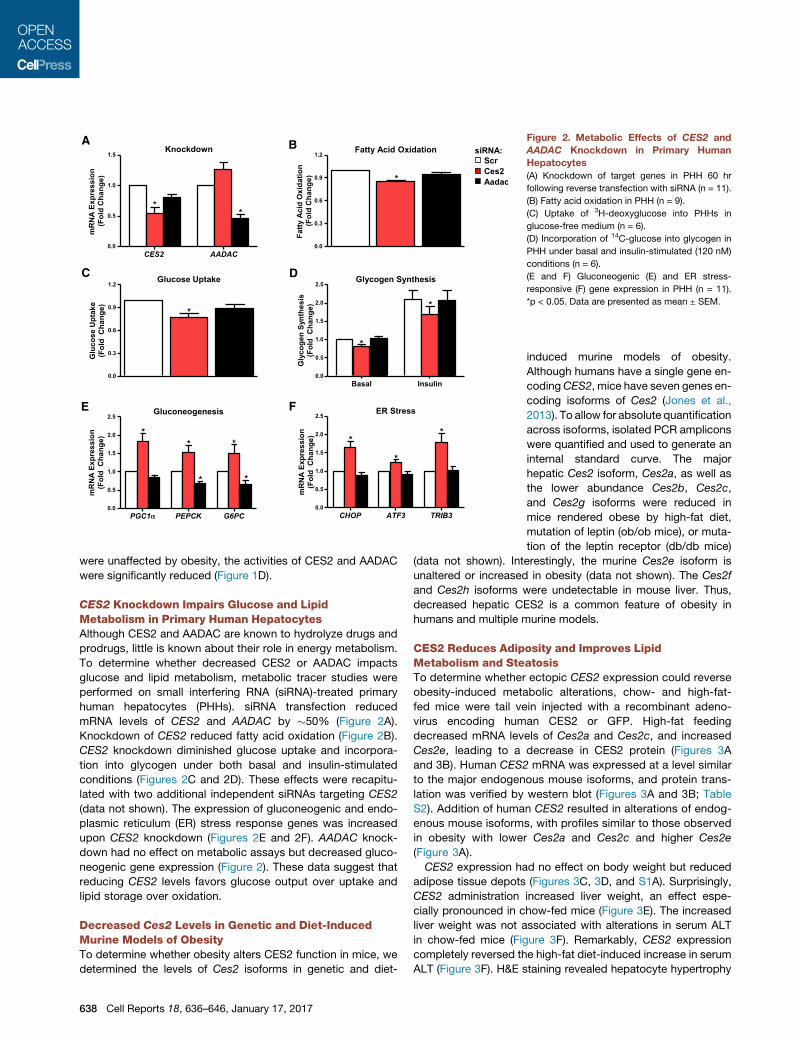
Figure 2. Metabolic Effects of CES2 and
AADAC Knockdown in Primary Human
Hepatocytes
(A) Knockdown of target genes in PHH 60 hr
following reverse transfection with siRNA (n = 11).
(B) Fatty acid oxidation in PHH (n = 9).
(C) Uptake of 3H-deoxyglucose into PHHs in
glucose-free medium (n = 6).
(D) Incorporation of 14C-glucose into glycogen in
PHH under basal and insulin-stimulated (120 nM)
conditions (n = 6).
(E and F) Gluconeogenic (E) and ER stress-
responsive (F) gene expression in PHH (n = 11).
*p < 0.05. Data are presented as mean ± SEM.
were unaffected by obesity, the activities of CES2 and AADAC
were significantly reduced (Figure 1D).
CES2 Knockdown Impairs Glucose and LipidMetabolism in Primary Human HepatocytesAlthough CES2 and AADAC are known to hydrolyze drugs and
prodrugs, little is known about their role in energy metabolism.
To determine whether decreased CES2 or AADAC impacts
glucose and lipid metabolism, metabolic tracer studies were
performed on small interfering RNA (siRNA)-treated primary
human hepatocytes (PHHs). siRNA transfection reduced
mRNA levels of CES2 and AADAC by �50% (Figure 2A).
Knockdown of CES2 reduced fatty acid oxidation (Figure 2B).
CES2 knockdown diminished glucose uptake and incorpora-
tion into glycogen under both basal and insulin-stimulated
conditions (Figures 2C and 2D). These effects were recapitu-
lated with two additional independent siRNAs targeting CES2
(data not shown). The expression of gluconeogenic and endo-
plasmic reticulum (ER) stress response genes was increased
upon CES2 knockdown (Figures 2E and 2F). AADAC knock-
down had no effect on metabolic assays but decreased gluco-
neogenic gene expression (Figure 2). These data suggest that
reducing CES2 levels favors glucose output over uptake and
lipid storage over oxidation.
Decreased Ces2 Levels in Genetic and Diet-InducedMurine Models of ObesityTo determine whether obesity alters CES2 function in mice, we
determined the levels of Ces2 isoforms in genetic and diet-
638 Cell Reports 18, 636–646, January 17, 2017
induced murine models of obesity.
Although humans have a single gene en-
codingCES2, mice have seven genes en-
coding isoforms of Ces2 (Jones et al.,
2013). To allow for absolute quantification
across isoforms, isolated PCR amplicons
were quantified and used to generate an
internal standard curve. The major
hepatic Ces2 isoform, Ces2a, as well as
the lower abundance Ces2b, Ces2c,
and Ces2g isoforms were reduced in
mice rendered obese by high-fat diet,
mutation of leptin (ob/ob mice), or muta-
tion of the leptin receptor (db/db mice)
(data not shown). Interestingly, the murine Ces2e isoform is
unaltered or increased in obesity (data not shown). The Ces2f
and Ces2h isoforms were undetectable in mouse liver. Thus,
decreased hepatic CES2 is a common feature of obesity in
humans and multiple murine models.
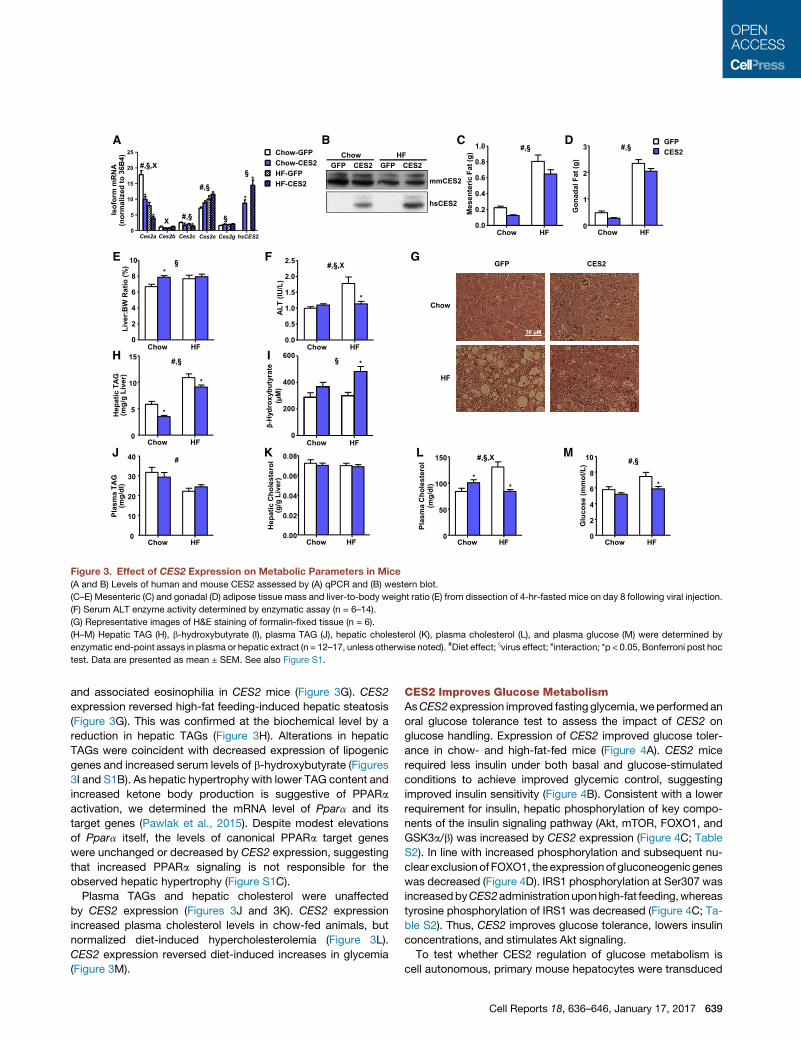
CES2 Reduces Adiposity and Improves LipidMetabolism and SteatosisTo determine whether ectopic CES2 expression could reverse
obesity-induced metabolic alterations, chow- and high-fat-
fed mice were tail vein injected with a recombinant adeno-
virus encoding human CES2 or GFP. High-fat feeding
decreased mRNA levels of Ces2a and Ces2c, and increased
Ces2e, leading to a decrease in CES2 protein (Figures 3A
and 3B). Human CES2 mRNA was expressed at a level similar
to the major endogenous mouse isoforms, and protein trans-
lation was verified by western blot (Figures 3A and 3B; Table
S2). Addition of human CES2 resulted in alterations of endog-
enous mouse isoforms, with profiles similar to those observed
in obesity with lower Ces2a and Ces2c and higher Ces2e
(Figure 3A).
CES2 expression had no effect on body weight but reduced
adipose tissue depots (Figures 3C, 3D, and S1A). Surprisingly,
CES2 administration increased liver weight, an effect espe-
cially pronounced in chow-fed mice (Figure 3E). The increased
liver weight was not associated with alterations in serum ALT
in chow-fed mice (Figure 3F). Remarkably, CES2 expression
completely reversed the high-fat diet-induced increase in serum
ALT (Figure 3F). H&E staining revealed hepatocyte hypertrophy
A CB D
ML
I
mmCES2
hsCES2
Chow HFGFP CES2 GFP CES2
Chow HF0.0
0.2
0.4
0.6
0.8
1.0 #,§
Mes
ente
ric F
at (g
)
E F
Chow HF0
1
2
3 #,§
Gon
adal
Fat
(g)
Chow HF0
2
4
6
8
10 §*
Live
r:B
WR
atio
(%)
Chow HF0
5
10
15 #,§
*
*Hep
atic
TA
G(m
g/g
Live
r)
HChow HF
0.0
0.5
1.0
1.5
2.0
2.5
*
#,§,X
ALT
(IU
/L)
G
KJ
Chow HF0
10
20
30
40 #
Plas
ma
TAG
(mg/
dl)
Chow HF0.00
0.02
0.04
0.06
0.08
Hep
atic
Cho
lest
erol
(g/g
Liv
er)
Chow HF0
50
100
150 #,§,X
**
Plas
ma
Cho
lest
erol
(mg/
dl)
Chow HF0
2
4
6
8
10 #,§
*
Glu
cose
(mm
ol/L
)
Chow
HF
GFP CES2
Chow HF0
200
400
600§ *
β-H
ydro
xybu
tyra
te(μ
M)
Ces2a Ces2b Ces2c Ces2e Ces2g hsCES20
5
10
15
20
25
*
** *
#,§,X
X #,§
#,§
§
*
*§
Isof
orm
mR
NA
(nor
mal
ized
to 3
6B4)
Chow-GFPChow-CES2HF-GFPHF-CES2
30 μM
GFPCES2
Figure 3. Effect of CES2 Expression on Metabolic Parameters in Mice
(A and B) Levels of human and mouse CES2 assessed by (A) qPCR and (B) western blot.
(C–E) Mesenteric (C) and gonadal (D) adipose tissue mass and liver-to-body weight ratio (E) from dissection of 4-hr-fasted mice on day 8 following viral injection.
(F) Serum ALT enzyme activity determined by enzymatic assay (n = 6–14).
(G) Representative images of H&E staining of formalin-fixed tissue (n = 6).
(H–M) Hepatic TAG (H), b-hydroxybutyrate (I), plasma TAG (J), hepatic cholesterol (K), plasma cholesterol (L), and plasma glucose (M) were determined by
enzymatic end-point assays in plasma or hepatic extract (n = 12–17, unless otherwise noted). #Diet effect; xvirus effect; xinteraction; *p < 0.05, Bonferroni post hoc
test. Data are presented as mean ± SEM. See also Figure S1.
and associated eosinophilia in CES2 mice (Figure 3G). CES2
expression reversed high-fat feeding-induced hepatic steatosis
(Figure 3G). This was confirmed at the biochemical level by a
reduction in hepatic TAGs (Figure 3H). Alterations in hepatic
TAGs were coincident with decreased expression of lipogenic
genes and increased serum levels of b-hydroxybutyrate (Figures
3I and S1B). As hepatic hypertrophy with lower TAG content and
increased ketone body production is suggestive of PPARa
activation, we determined the mRNA level of Ppara and its
target genes (Pawlak et al., 2015). Despite modest elevations
of Ppara itself, the levels of canonical PPARa target genes
were unchanged or decreased by CES2 expression, suggesting
that increased PPARa signaling is not responsible for the
observed hepatic hypertrophy (Figure S1C).
Plasma TAGs and hepatic cholesterol were unaffected
by CES2 expression (Figures 3J and 3K). CES2 expression
increased plasma cholesterol levels in chow-fed animals, but
normalized diet-induced hypercholesterolemia (Figure 3L).
CES2 expression reversed diet-induced increases in glycemia
(Figure 3M).
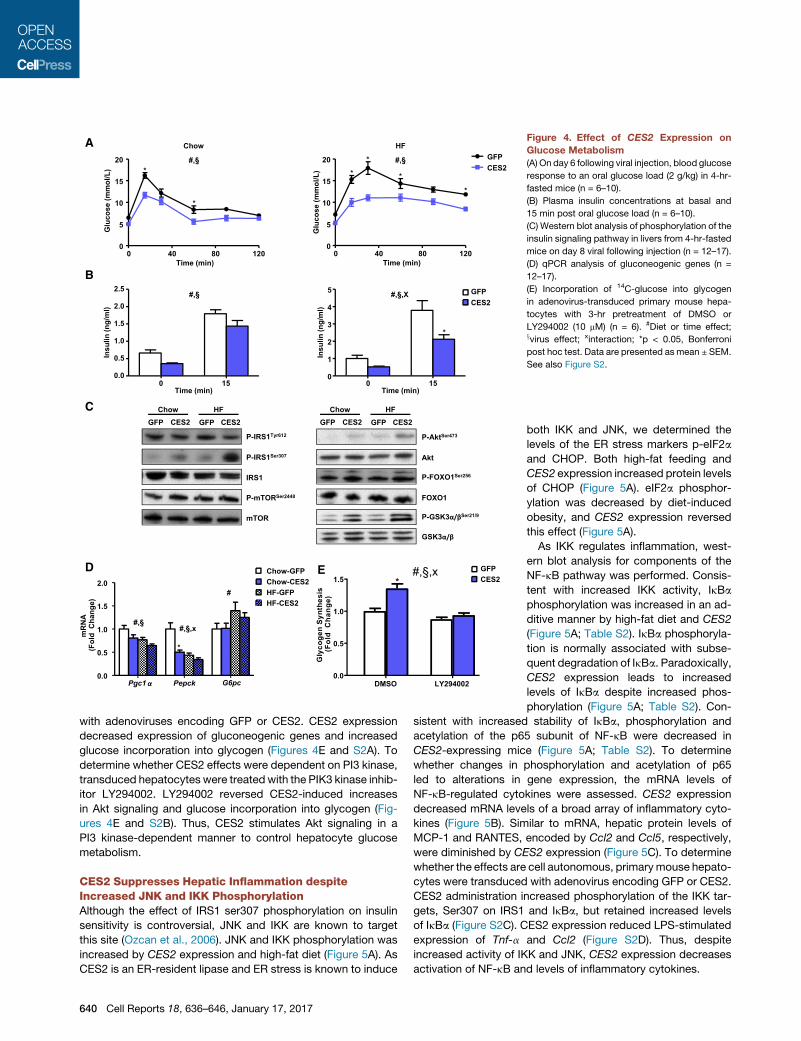
CES2 Improves Glucose MetabolismAsCES2 expression improved fastingglycemia,weperformedan
oral glucose tolerance test to assess the impact of CES2 on
glucose handling. Expression of CES2 improved glucose toler-
ance in chow- and high-fat-fed mice (Figure 4A). CES2 mice
required less insulin under both basal and glucose-stimulated
conditions to achieve improved glycemic control, suggesting
improved insulin sensitivity (Figure 4B). Consistent with a lower
requirement for insulin, hepatic phosphorylation of key compo-
nents of the insulin signaling pathway (Akt, mTOR, FOXO1, and
GSK3a/b) was increased by CES2 expression (Figure 4C; Table
S2). In line with increased phosphorylation and subsequent nu-
clear exclusionof FOXO1, the expressionofgluconeogenic genes
was decreased (Figure 4D). IRS1 phosphorylation at Ser307 was
increasedbyCES2administrationuponhigh-fat feeding,whereas
tyrosine phosphorylation of IRS1 was decreased (Figure 4C; Ta-
ble S2). Thus, CES2 improves glucose tolerance, lowers insulin
concentrations, and stimulates Akt signaling.
To test whether CES2 regulation of glucose metabolism is
cell autonomous, primary mouse hepatocytes were transduced
Cell Reports 18, 636–646, January 17, 2017 639
Chow
0 40 80 120 0
5
10
15
20 *
*
#,§
Time (min)
Glu
cose
(mm
ol/L
)
HF
0 40 80 120 0
5
10
15
20
*
*
*
*
#,§
Time (min)
Glu
cose
(mm
ol/L
)
0 15 0.0
0.5
1.0
1.5
2.0
2.5
Time (min)
#,§
Insu
lin (n
g/m
l)
0 15 0
1
2
3
4
5
Time (min)
#,§,X
*
Insu
lin (n
g/m
l)
A
B
C
D
GFP CES2
GFP CES2
P-IRS1Tyr612
Chow HF GFP CES2 GFP CES2
P-IRS1Ser307
IRS1
mTOR
P-mTORSer2448
Chow HF GFP CES2 GFP CES2
P-AktSer473
Akt
P-FOXO1Ser256
FOXO1
P-GSK3α/βSer21/9
GSK3α/β
Pgc1 α Pepck G6pc 0.0
0.5
1.0
1.5
2.0
#,§,x #,§
#
*
mR
NA
(F
old
Cha
nge)
Chow-GFP Chow-CES2 HF-GFP HF-CES2
E
DMSO LY294002 0.0
0.5
1.0
1.5 #,§,x
*
G l y
c o g e
n S
y n t h
e s i s
( F
o l d
C h a
n g e
)
GFP CES2
Figure 4. Effect of CES2 Expression on
Glucose Metabolism
(A) On day 6 following viral injection, blood glucose
response to an oral glucose load (2 g/kg) in 4-hr-
fasted mice (n = 6–10).
(B) Plasma insulin concentrations at basal and
15 min post oral glucose load (n = 6–10).
(C) Western blot analysis of phosphorylation of the
insulin signaling pathway in livers from 4-hr-fasted
mice on day 8 viral following injection (n = 12–17).
(D) qPCR analysis of gluconeogenic genes (n =
12–17).
(E) Incorporation of 14C-glucose into glycogen
in adenovirus-transduced primary mouse hepa-
tocytes with 3-hr pretreatment of DMSO or
LY294002 (10 mM) (n = 6). #Diet or time effect;xvirus effect; xinteraction; *p < 0.05, Bonferroni
post hoc test. Data are presented asmean ± SEM.
See also Figure S2.
with adenoviruses encoding GFP or CES2. CES2 expression
decreased expression of gluconeogenic genes and increased
glucose incorporation into glycogen (Figures 4E and S2A). To
determine whether CES2 effects were dependent on PI3 kinase,
transduced hepatocytes were treated with the PIK3 kinase inhib-
itor LY294002. LY294002 reversed CES2-induced increases
in Akt signaling and glucose incorporation into glycogen (Fig-
ures 4E and S2B). Thus, CES2 stimulates Akt signaling in a
PI3 kinase-dependent manner to control hepatocyte glucose
metabolism.
CES2 Suppresses Hepatic Inflammation despiteIncreased JNK and IKK PhosphorylationAlthough the effect of IRS1 ser307 phosphorylation on insulin
sensitivity is controversial, JNK and IKK are known to target
this site (Ozcan et al., 2006). JNK and IKK phosphorylation was
increased by CES2 expression and high-fat diet (Figure 5A). As
CES2 is an ER-resident lipase and ER stress is known to induce
640 Cell Reports 18, 636–646, January 17, 2017
both IKK and JNK, we determined the
levels of the ER stress markers p-eIF2a
and CHOP. Both high-fat feeding and
CES2 expression increased protein levels
of CHOP (Figure 5A). eIF2a phosphor-
ylation was decreased by diet-induced
obesity, and CES2 expression reversed
this effect (Figure 5A).
As IKK regulates inflammation, west-
ern blot analysis for components of the
NF-kB pathway was performed. Consis-
tent with increased IKK activity, IkBa
phosphorylation was increased in an ad-
ditive manner by high-fat diet and CES2
(Figure 5A; Table S2). IkBa phosphoryla-
tion is normally associated with subse-
quent degradation of IkBa. Paradoxically,
CES2 expression leads to increased
levels of IkBa despite increased phos-
phorylation (Figure 5A; Table S2). Con-
sistent with increased stability of IkBa, phosphorylation and
acetylation of the p65 subunit of NF-kB were decreased in
CES2-expressing mice (Figure 5A; Table S2). To determine
whether changes in phosphorylation and acetylation of p65
led to alterations in gene expression, the mRNA levels of
NF-kB-regulated cytokines were assessed. CES2 expression
decreased mRNA levels of a broad array of inflammatory cyto-
kines (Figure 5B). Similar to mRNA, hepatic protein levels of
MCP-1 and RANTES, encoded by Ccl2 and Ccl5, respectively,
were diminished by CES2 expression (Figure 5C). To determine
whether the effects are cell autonomous, primarymouse hepato-
cytes were transduced with adenovirus encoding GFP or CES2.
CES2 administration increased phosphorylation of the IKK tar-
gets, Ser307 on IRS1 and IkBa, but retained increased levels
of IkBa (Figure S2C). CES2 expression reduced LPS-stimulated
expression of Tnf-a and Ccl2 (Figure S2D). Thus, despite
increased activity of IKK and JNK, CES2 expression decreases
activation of NF-kB and levels of inflammatory cytokines.
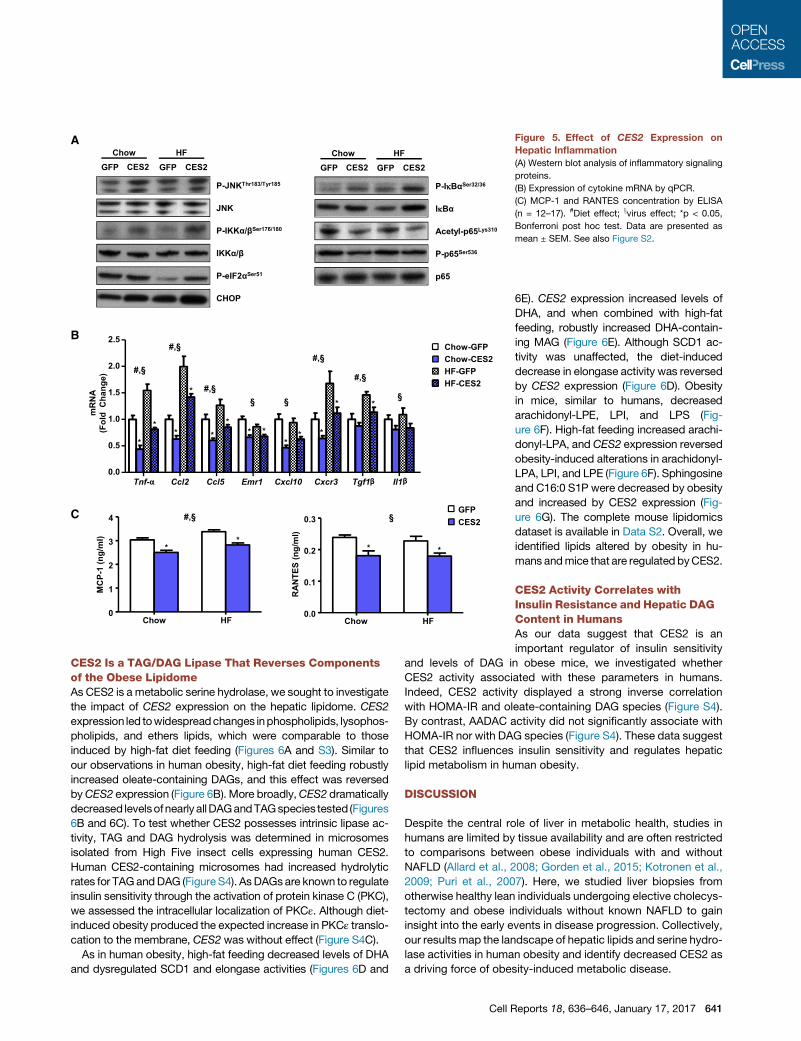
A
B
C
Figure 5. Effect of CES2 Expression on
Hepatic Inflammation
(A) Western blot analysis of inflammatory signaling
proteins.
(B) Expression of cytokine mRNA by qPCR.
(C) MCP-1 and RANTES concentration by ELISA
(n = 12–17). #Diet effect; xvirus effect; *p < 0.05,
Bonferroni post hoc test. Data are presented as
mean ± SEM. See also Figure S2.
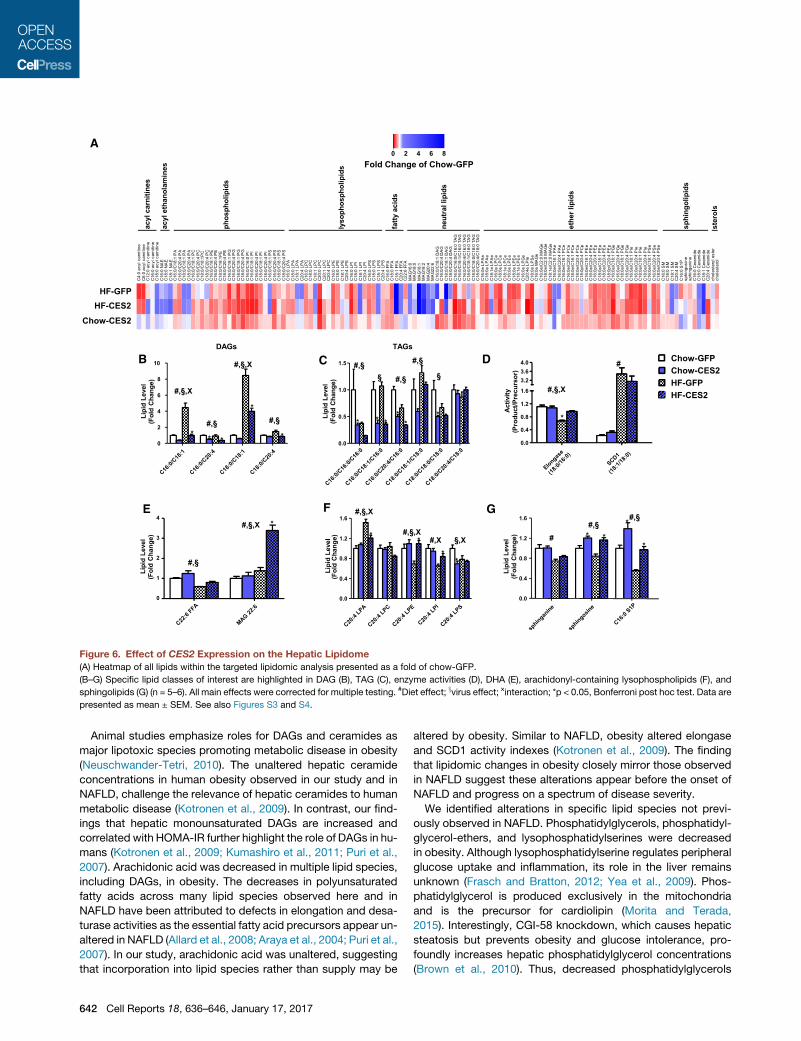
CES2 Is a TAG/DAG Lipase That Reverses Componentsof the Obese LipidomeAs CES2 is a metabolic serine hydrolase, we sought to investigate
the impact of CES2 expression on the hepatic lipidome. CES2
expression led towidespreadchanges inphospholipids, lysophos-
pholipids, and ethers lipids, which were comparable to those
induced by high-fat diet feeding (Figures 6A and S3). Similar to
our observations in human obesity, high-fat diet feeding robustly
increased oleate-containing DAGs, and this effect was reversed
byCES2 expression (Figure 6B). More broadly,CES2 dramatically
decreased levelsofnearly allDAGandTAGspecies tested (Figures
6B and 6C). To test whether CES2 possesses intrinsic lipase ac-
tivity, TAG and DAG hydrolysis was determined in microsomes
isolated from High Five insect cells expressing human CES2.
Human CES2-containing microsomes had increased hydrolytic
rates for TAGandDAG (FigureS4). AsDAGsare known to regulate
insulin sensitivity through the activation of protein kinase C (PKC),
we assessed the intracellular localization of PKCε. Although diet-
induced obesity produced the expected increase in PKCε translo-
cation to the membrane, CES2 was without effect (Figure S4C).
As in human obesity, high-fat feeding decreased levels of DHA
and dysregulated SCD1 and elongase activities (Figures 6D and
Cell R
6E). CES2 expression increased levels of
DHA, and when combined with high-fat
feeding, robustly increased DHA-contain-
ing MAG (Figure 6E). Although SCD1 ac-
tivity was unaffected, the diet-induced
decrease in elongase activity was reversed
by CES2 expression (Figure 6D). Obesity
in mice, similar to humans, decreased
arachidonyl-LPE, LPI, and LPS (Fig-
ure 6F). High-fat feeding increased arachi-
donyl-LPA, and CES2 expression reversed
obesity-induced alterations in arachidonyl-
LPA, LPI, and LPE (Figure 6F). Sphingosine
and C16:0 S1P were decreased by obesity
and increased by CES2 expression (Fig-
ure 6G). The complete mouse lipidomics
dataset is available in Data S2. Overall, we
identified lipids altered by obesity in hu-
mans andmice that are regulated byCES2.
CES2 Activity Correlates withInsulin Resistance and Hepatic DAGContent in HumansAs our data suggest that CES2 is an
important regulator of insulin sensitivity
and levels of DAG in obese mice, we investigated whether
CES2 activity associated with these parameters in humans.
Indeed, CES2 activity displayed a strong inverse correlation
with HOMA-IR and oleate-containing DAG species (Figure S4).
By contrast, AADAC activity did not significantly associate with
HOMA-IR nor with DAG species (Figure S4). These data suggest
that CES2 influences insulin sensitivity and regulates hepatic
lipid metabolism in human obesity.
DISCUSSION
Despite the central role of liver in metabolic health, studies in
humans are limited by tissue availability and are often restricted
to comparisons between obese individuals with and without
NAFLD (Allard et al., 2008; Gorden et al., 2015; Kotronen et al.,
2009; Puri et al., 2007). Here, we studied liver biopsies from
otherwise healthy lean individuals undergoing elective cholecys-
tectomy and obese individuals without known NAFLD to gain
insight into the early events in disease progression. Collectively,
our results map the landscape of hepatic lipids and serine hydro-
lase activities in human obesity and identify decreased CES2 as
a driving force of obesity-induced metabolic disease.
eports 18, 636–646, January 17, 2017 641
A C
4:0
acyl
car
nitin
e C
6:0
acyl
car
nitin
e C
12:0
acy
l car
nitin
e C
16:0
acy
l car
nitin
e C
18:0
acy
l car
nitin
e C
16:0
NA
E
C18
:0 N
AE
C
18:1
NA
E
C16
:0/C
18:1
PA
C
16:0
/C20
:4 P
A
C18
:0/C
18:1
PA
C
18:0
/C20
:4 P
A
C16
:0/C
18:1
PC
C
16:0
/C20
:4 P
C
C18
:0/C
18:1
PC
C
18:0
/C20
:4 P
C
C16
:0/C
18:1
PE
C
16:0
/C20
:4 P
E
C18
:0/C
18:1
PE
C
18:0
/C20
:4 P
E
C16
:0/C
18:1
PG
C
16:0
/C20
:4 P
G
C18
:0/C
18:1
PG
C
18:0
/C20
:4 P
G
C16
:0/C
16:0
PI
C16
:0/C
18:1
PI
C16
:0/C
20:4
PI
C18
:0/C
18:1
PI
C18
:0/C
20:4
PI
C16
:0/C
18:1
PS
C
16:0
/C20
:4 P
S
C18
:0/C
18:1
PS
C
18:0
/C20
:4 P
S
C16
:0 L
PA
C
18:0
LP
A
C18
:1 L
PA
C
20:4
LP
A
C16
:0 L
PC
C
18:0
LP
C
C18
:1 L
PC
C
20:0
LP
CC
20:1
LPC
C20
:4 L
PC
C
16:0
LP
E
C18
:0 L
PE
C
18:1
LP
E
C20
:4 L
PE
C
16:0
LP
I C
18:0
LP
I C
18:1
LP
I C
20:4
LP
I C
16:0
LP
S
C18
:0 L
PS
C
18:1
LP
S
C20
:4 L
PS
C
16:0
FFA
C
18:0
FFA
C
18:1
FFA
C
20:4
FFA
C
22:6
FFA
MA
G16
:0
MA
G18
:0
MA
G18
:1
MA
G18
:2
MA
G20
:4
MA
G22
:6
C16
:0/C
18:1
DA
G
C16
:0/C
20:4
DA
G
C18
:0/C
18:1
DA
G
C18
:0/C
20:4
DA
G
C16
:0/C
16:0
/C16
:0 T
AG
C
16:0
/C18
:1/C
16:0
TA
G
C16
:0/C
20:4
/C16
:0 T
AG
C
18:0
/C18
:1/C
18:0
TA
G
C18
:0/C
18:0
/C18
:0 T
AG
C
18:0
/C20
:4/C
18:0
TA
G
C16
:0e
LPA
eC
18:0
e LP
Ae
C18
:1e
LPA
eC
16:0
e LP
Ce
C18
:0e
LPC
eC
18:1
e LP
Ce
C16
:0e
LPE
eC
18:0
e LP
Ee
C18
:1e
LPE
eC
16:0
e LP
Ge
C20
:4e
LPIe
C18
:0e
LPS
eC
16:0
e M
AG
eC
16:0
e/C
2:0
MA
Ge
C18
:0e/
C2:
0 M
AG
eC
18:1
e/C
2:0
MA
Ge
C16
:0e/
C18
:1 P
Ae
C16
:0e/
C20
:4 P
Ae
C16
:0e/
C18
:1 P
Ce
C16
:0e/
C20
:4 P
Ce
C18
:0e/
C18
:1 P
Ce
C18
:0e/
C20
:4 P
Ce
C18
:0p/
C20
:4 P
Cp
C16
:0e/
C18
:1 P
Ee
C16
:0e/
C20
:4 P
Ee
C16
:0p/
C20
:4 P
Ep
C18
:0e/
C18
:1 P
Ee
C18
:0e/
C20
:4 P
Ee
C18
:0p/
C20
:4 P
Ep
C16
:0e/
C18
:1 P
Ge
C16
:0e/
C20
:4 P
Ge
C18
:0e/
C18
:1 P
Ge
C18
:0e/
C20
:4 P
Ge
C16
:0e/
C18
:1 P
IeC
16:0
e/C
20:4
PIe
C18
:0e/
C18
:1 P
IeC
18:0
e/C
20:4
PIe
C16
:0e/
C18
:1 P
Se
C16
:0e/
C20
:4 P
Se
C18
:0e/
C20
:4 P
Se
C16
:0 S
MC
18:0
SM
C18
:1 S
MC
20:4
SM
C16
:0 S
1Psp
hing
osin
e sp
hing
anin
e C
16:0
Cer
amid
e C
18:0
Cer
amid
e C
18:1
Cer
amid
e C
20:4
Cer
amid
e ch
oles
tery
l est
erch
oles
tero
l
Chow-CES2 HF-CES2
HF-GFP
acyl
car
nitin
es
acyl
eth
anol
amin
es
phos
phol
ipid
s
lyso
phos
phol
ipid
s
neut
ral l
ipid
s
fatty
aci
ds
ethe
r lip
ids
sphi
ngol
ipid
s
ster
ols
2 4 6 8
Fold Change of Chow-GFP 0 2 4 6 80
B C D
0
2
4
6
8
10
* #,§
#,§,X
* *
#,§,X
#,§
* *
Lipi
d Le
vel
(Fol
d C
hang
e)
0.0
0.5
1.0
1.5 #,§
§
*
§ #,§
* *
* * *
#,§
Lipi
d Le
vel
(Fol
d C
hang
e)
0.0
0.4
0.8
1.2
1.6
3.2 3.6 4.0
#,§,X
*
#
Act
ivity
(P
rodu
ct/P
recu
rsor
)
0.0
0.4
0.8
1.2
1.6
#,§,X #,X
*
§,X *
* *
#,§,X
Lipi
d Le
vel
(Fol
d C
hang
e )
0.0
0.4
0.8
1.2
1.6
#
* #,§
*
#,§ * *
Lipi
d Le
vel
(Fol
d C
hang
e)
0
1
2
3
4 #,§,X *
#,§
Lipi
d Le
vel
(Fol
d C
hang
e)
DAGs TAGs
E F G
Chow-GFP Chow-CES2 HF-GFP HF-CES2
Figure 6. Effect of CES2 Expression on the Hepatic Lipidome
(A) Heatmap of all lipids within the targeted lipidomic analysis presented as a fold of chow-GFP.
(B–G) Specific lipid classes of interest are highlighted in DAG (B), TAG (C), enzyme activities (D), DHA (E), arachidonyl-containing lysophospholipids (F), and
sphingolipids (G) (n = 5–6). All main effects were corrected for multiple testing. #Diet effect; xvirus effect; xinteraction; *p < 0.05, Bonferroni post hoc test. Data are
presented as mean ± SEM. See also Figures S3 and S4.
Animal studies emphasize roles for DAGs and ceramides as
major lipotoxic species promoting metabolic disease in obesity
(Neuschwander-Tetri, 2010). The unaltered hepatic ceramide
concentrations in human obesity observed in our study and in
NAFLD, challenge the relevance of hepatic ceramides to human
metabolic disease (Kotronen et al., 2009). In contrast, our find-
ings that hepatic monounsaturated DAGs are increased and
correlated with HOMA-IR further highlight the role of DAGs in hu-
mans (Kotronen et al., 2009; Kumashiro et al., 2011; Puri et al.,
2007). Arachidonic acid was decreased in multiple lipid species,
including DAGs, in obesity. The decreases in polyunsaturated
fatty acids across many lipid species observed here and in
NAFLD have been attributed to defects in elongation and desa-
turase activities as the essential fatty acid precursors appear un-
altered in NAFLD (Allard et al., 2008; Araya et al., 2004; Puri et al.,
2007). In our study, arachidonic acid was unaltered, suggesting
that incorporation into lipid species rather than supply may be
642 Cell Reports 18, 636–646, January 17, 2017
altered by obesity. Similar to NAFLD, obesity altered elongase
and SCD1 activity indexes (Kotronen et al., 2009). The finding
that lipidomic changes in obesity closely mirror those observed
in NAFLD suggest these alterations appear before the onset of
NAFLD and progress on a spectrum of disease severity.
We identified alterations in specific lipid species not previ-
ously observed in NAFLD. Phosphatidylglycerols, phosphatidyl-
glycerol-ethers, and lysophosphatidylserines were decreased
in obesity. Although lysophosphatidylserine regulates peripheral
glucose uptake and inflammation, its role in the liver remains
unknown (Frasch and Bratton, 2012; Yea et al., 2009). Phos-
phatidylglycerol is produced exclusively in the mitochondria
and is the precursor for cardiolipin (Morita and Terada,
2015). Interestingly, CGI-58 knockdown, which causes hepatic
steatosis but prevents obesity and glucose intolerance, pro-
foundly increases hepatic phosphatidylglycerol concentrations
(Brown et al., 2010). Thus, decreased phosphatidylglycerols

and phosphatidylglycerol-ethers may reflect alterations in mito-
chondrial content or function in livers from obese humans.
The major hepatic serine hydrolase activities, carboxylester-
ase 1 (CES1) and fatty acid synthase, were unaltered in human
obesity. Unexpectedly, activity of CES2 and AADAC, enzymes
that are best known for their role in the metabolism of xenobi-
otics, was decreased in livers from obese individuals. Adaptation
of drug doses presents a challenge in obese patients, and the
most appropriatemethod for dose correction remains controver-
sial (Griggs et al., 2012). Our findings of altered levels of enzymes
in drug breakdown and activation may inform determination of
proper drug dosing in the context of obesity.
AADACoverexpression regulates lipidmetabolism inMcArdle-
RH7777 hepatoma cells (Lo et al., 2010). Hepatoma cell lines
have aberrant expression of drug-metabolizing enzymes that
limits their use to such overexpression studies (Guo et al.,
2011). PHH sustain expression of drug-metabolizing enzymes
and are considered the gold standard for studying xenobiotic
metabolism (Guo et al., 2011). Here, knockdown of endogenous
AADAC in PHH did not alter fatty acid oxidation. However, our
negative findings may be due to the modest level of AADAC
knockdown and do not preclude a role for this enzyme in
metabolism.
Hepatic lipid content reflects the balance of lipid synthesis and
removal. In PHH, CES2 promotes lipid oxidation in a cell-auton-
omous manner. Decreases in TAG content, reversal of histolog-
ically determined steatosis, and increases in serum ketone
bodies suggest that human CES2 plays a similar role in vivo.
Increased b-oxidation was independent of transcriptional ac-
tivation of this pathway, suggesting that CES2 could play a
more direct role. In addition to apparent increases in oxidation,
CES2 decreased expression of lipogenic genes. Increases in
polyunsaturated fatty acids, such as DHA, inhibit SREBP1c
and subsequent expression of lipogenic genes (Deng et al.,
2002; Xu et al., 2001). Similar to CES1, CES2 may regulate
DHA levels to inhibit SREBP1c (Quiroga et al., 2012). Lipidomics
revealed robust decreases in TAG and DAG, and CES2 dis-
played significant TAG and DAG hydrolase activities. Although
the role of arachidonic acid containing lysophospholipids is un-
known, our observation that they are decreased in human and
murine obesity and reversed by CES2 raises interest in their
role in hepatic metabolism. The elongase activity index was
also decreased in both human and murine obesity and reversed
by CES2. In mice, ELOVL6 performs the reaction measured by
the elongase activity index. ELOVL6 knockout increases hepatic
lipid accumulation with inconsistent effects on body weight and
insulin sensitivity (Matsuzaka et al., 2007;Moon et al., 2014). This
suggests that reversing the diet-induced decrease in elongase
activity may contribute to the reversal of hepatic steatosis
upon CES2 administration.
ER stress sits at the intersection of inflammation and meta-
bolic disease (Hotamisligil, 2010). Interestingly, both loss of
CES2 in vitro and addition of CES2 in vivo stimulated ER stress.
As CES2 is an ER-resident enzyme, appropriate levels of CES2
may be necessary to maintain ER homeostasis. In support of
this notion, CES2 administration decreased an extensive array
of phospholipids and ether lipids, similar to alterations observed
in diet-induced obesity, which may be responsible for triggering
ER stress. JNK and IKK are key kinases in transmitting the
signals from ER stress to promote insulin resistance and inflam-
mation (Hotamisligil, 2010). Remarkably, CES2 dissociates acti-
vation of ER stress, IKK, and JNK from inflammation and insulin
resistance.
Hepatic inflammation contributes to perturbations in meta-
bolic homeostasis and causes the progression from simple stea-
tosis to more serious liver diseases. Despite activation of IKKa/b
and increased phosphorylation of IkBa, CES2 administration
had an anti-inflammatory effect associatedwith reduced expres-
sion of NF-kB target genes. This paradox exists due to continued
increases in IkBa despite its phosphorylation. Increases in DHA,
which decreases p65 nuclear translocation, may also contribute
to the anti-inflammatory effect of CES2 (Mullen et al., 2010). The
anti-inflammatory effects of CES2 overexpression suggest that
decreased CES2 may promote the progression from NAFLD to
non-alcoholic steatohepatitis (NASH).
In our studies, CES2 emerged as a powerful regulator of
glucose metabolism both in vitro and in vivo. Interestingly,
CES2 appears to affect both insulin-dependent and -indepen-
dent pathways. The improvement in glucose tolerance, with
decreased serum insulin and activation of Akt, suggests
enhanced insulin sensitivity in CES2 mice. Lipid accumulation
and inflammation are thought to underlie insulin resistance.
CES2 dramatically decreased hepatic levels of DAGs, which
stimulate PKC enzyme activity to induce insulin resistance.
Despite this decrease in DAG, CES2 did not alter PKCε activa-
tion upon high-fat feeding. The reasons for this are unclear, but
may reflect the cellular localization of DAG (Bergman et al.,
2012). Upon CES2 administration, we observed increased
activity of IKK and JNK, which are thought to induce insulin
resistance through phosphorylation of serine sites on IRS1
and IRS2 (Giraud et al., 2004; Hotamisligil, 2010). Although
Ser307 on IRS1 has gained particular attention in promoting in-
sulin resistance, it is phosphorylated in response to insulin and
a knockin mutation that prevents phosphorylation promotes,
rather than prevents, insulin resistance (Copps et al., 2010;
Giraud et al., 2004). However, in our study, Ser307 phosphor-
ylation was associated with decreased tyrosine phosphoryla-
tion of IRS1. This suggests that IRS2 may be responsible for
activation of Akt and downstream signaling. Alternatively, Akt
could be stimulated independent of insulin, reducing the
requirement for circulating insulin concentrations. In support
of this, CES2 knockdown decreased glucose uptake and
incorporation into glycogen in vitro in the absence of insulin.
Moreover, in insulin-sensitive fasted chow-fed animals, CES2
further increased Akt signaling while reducing serum insulin.
In primary mouse hepatocytes, CES2 administration stimu-
lated Akt signaling and glucose incorporation into glycogen
in a PI3 kinase-dependent manner. Interestingly, sphingosine
and C16:0 S1P species were elevated in CES2 mice. S1P ac-
tivates Akt signaling through PI3 kinase by activating its recep-
tors in various settings and plays a role in downstream effects
of the adiponectin receptors (Holland et al., 2011; Osawa et al.,
2001). In vivo, hepatic sphingosine kinase 2 or acid sphingo-
myelinase overexpression increase S1P, glucose tolerance,
and Akt signaling independent of IRS1/2 (Lee et al., 2015;
Ma et al., 2007). Taken together, this raises the intriguing
Cell Reports 18, 636–646, January 17, 2017 643
possibility that CES2 regulates sphingolipid metabolism to
control hepatic glucose metabolism.
Overall, CES2 improves glucose tolerance and decreases the
requirement for serum insulin, despite increased activation of
IKK and JNK and aberrant phosphorylation of IRS1. In the setting
of CES2 overexpression, as in conditional XBP1 knockout mice
fed a fructose diet, improving lipid homeostasis reverses glucose
intolerance despite elevated ER stress (Jurczak et al., 2012). The
strong correlation between hepatic CES2 activity and HOMA-IR
suggests that our findings are pertinent to human insulin resis-
tance in vivo.
While this manuscript was in preparation, Li et al. (2016b)
reported that mouse CES2 is a TAG hydrolase that prevents
hepatic steatosis and that CES2 protein levels are decreased
in patients with NASH. Similar to our findings with human
CES2 expression, overexpression of mouse CES2 decreased
adiposity, improved glucose tolerance, and reversal of steatosis
(Li et al., 2016b). Despite these similarities, several differences
exist between the overexpression of mouse and human CES2.
Mouse CES2 overexpression reversed, whereas human CES2
expression activated ER stress (Li et al., 2016b). In contrast to
our findings with human CES2, mouse CES2 overexpression
activated PPARa and decreased levels of DHA (Li et al.,
2016b). The divergent properties of human and mouse CES2
that underlie these phenotypic differences warrant further study.
In conclusion, CES2 is a robust and reproducible regulator of
intermediary metabolism that is altered in mouse and human
obesity. Mechanistically, CES2 promotes lipid oxidation to
reverse hepatic steatosis and dissociates activation of ER stress,
as well as the downstream effector proteins IKK and JNK, from
inflammation, Akt activation, and glucose intolerance. Thus,
decreased CES2 appears to be a causative factor in the progres-
sion of hepatic metabolic disease and suggests that strategies
restoring CES2 activity may prove effective in the treatment of
obesity-associated metabolic disease.
EXPERIMENTAL PROCEDURES
Human Sample Collection
The Regional Ethics Committee of Stockholm approved this study. Partici-
pants provided informed written consent, and the study was performed in
accordance with the Declaration of Helsinki. Liver biopsies were collected
from 8 lean (BMI 19–25) individuals during elective cholecystectomy and
from 15 obese (BMI 35–50) individuals during Roux-en-Y gastric bypass
surgery. Biopsies were collected after an overnight fast at the beginning of
the surgical procedure. Patients were not given intravenous glucose until the
biopsies were obtained, and the obese subjects were not subjected to a pre-
operative diet. Biopsies were flash-frozen in liquid nitrogen.
Lipidomic Analysis and Activity-Based Protein Profiling
Lipidomic analysis was performed as described (Louie et al., 2016). Identifica-
tion and comparative quantitation of serine hydrolase activities from human
liver proteomes by ABPP-MudPIT was conducted as previously described us-
ing FP-biotin (5 mM) (Jessani et al., 2005). Analysis between lean and obese
individuals was limited to serine hydrolases detected in all samples.
Primary Human Hepatocyte Isolation and Culture
Liver tissue was attained from the Liver Center, Karolinska University Hospital
(Huddinge,Sweden),with informeddonorconsent from individualswithmetasta-
tic cancer or from donor livers unsuitable for transplantation. Primary human he-
patocyteswere isolated fromfreshly resected liver tissueaspreviouslydescribed
644 Cell Reports 18, 636–646, January 17, 2017
(Li et al., 2016a). Cells were plated on collagen-coated plates in William’s-E
media containing 25 mM HEPES, 2 mM glutamine, 120 nM insulin, and 100 nM
dexamethasone, and transfected with lipofectamine RNAiMAX and 100 nmol
of silencer select siRNA (Life Technologies) in 1% DMSO. Following 12-hr
transfection, non-adherent cells were removed by washing with PBS and
media replaced with William’s-E media with 1 nM insulin. All experiments were
performed 48 hr after the end of transfection. Primary mouse hepatocytes
were isolated, plated, and transduced as previously described (Correia et al.,
2015).
Radioactive Tracer Metabolic Assays
Fatty Acid Oxidation
Fatty acid oxidationwasmeasured as previously described (Nascimento et al.,
2015). Briefly, PHHs were incubated in media with radioactive 3H-palmitate
(PerkinElmer) and cold palmitate (25 mM) in low-glucose DMEM for 3 hr. A
portion of the media was transferred to charcoal slurry to bind un-metabolized
palmitate. Following centrifugation, the amount of radioactivity associated
with H2O was measured in the medium. The cells were washed with ice-
cold PBS three times, and lysate was used for protein determination.
Glucose Uptake
2-Deoxyglucose uptake was measured as described (Al-Khalili et al., 2006).
PHHs were serum starved for 4 hr in low-glucose DMEM. Following a PBS
wash, glucose-free media with 3H-2-deoxyglucose (Moravek Biochemicals),
and cold 2-deoxyglucose (10 mM) was added to the cells for 15 min. The assay
was terminated by washing in ice-cold PBS four times. Cells lysate was
analyzed for protein concentration and 3H content.
Glycogen Synthesis
Glycogen synthesis was determined as described (Nascimento et al., 2015).
PHHs were serum starved in DMEM (low glucose) for 4 hr and stimulated
with 120 nM insulin or vehicle control for 2 hr with addition of 14C-glucose
(PerkinElmer) for the final 90 min. Cells were washed with ice-cold PBS three
times and lysed. Protein concentration was determined in a portion of the
lysate. Glycogen was precipitated in ethanol, isolated by centrifugation,
washed, and suspended in water prior to analysis for radioactivity.
qPCR
mRNA was extracted from cells and livers with the RNeasy Mini Kit (QIAGEN)
and TRIzol reagent (Invitrogen), respectively, according to the manufacturer’s
recommendations. RNA concentration was measured with Nanodrop 1000
(Thermo Scientific) and reverse transcribed using the High-Capacity cDNA
RT Kit (Applied Biosystems). Relative quantitative real-time PCRs were
performed in duplicate using SYBR Green reagents (Applied Biosystems).
For absolute quantification of Ces2 isoforms, PCR amplicons were isolated
following gel electrophoresis, quantified, and diluted to form standard curves.
Primer sequences are available in Supplemental Experimental Procedures.
Animal Work
Male C57BL/6J mice (4 weeks old) were purchased from Charles River and
housed for 1 week prior to diet treatment. Mice were maintained on a 12-h
light/12-h dark cycle and received water and food ad libitum. Mice were fed
with a standard rodent chow (4% fat, 16.5% protein, 58% carbohydrate,
3.0kcal/gpurchased fromLantmannen)or ahigh-fat diet (54.8%fat, 21.2%pro-
tein, 24% carbohydrates, 4.8 kcal/g from Envigo) for 16 weeks. Mice were in-
jected with 1.6 3 109 PFU particles of adenoviral vectors (Vector Biolabs) into
the tail vein. Six days after injection, mice were fasted for 4 hr prior to an oral
glucose tolerance test. Glucose was administrated orally to the mice (2 g/kg)
and blood glucose wasmeasured at 0, 15, 30, 60, 90, and 120min (One-Touch
Accu-CheckGlucometer; Roche). Bloodwas collected at 0 and 15min for insu-
linmeasurementby tail bleeding. Eightdayspost-injection,micewere fasted for
4 hr and anesthetizedwithAvertin (2.5%solution of 99%2,2,2-tribromoethanol
and tertiary amyl alcohol; Sigma-Aldrich). Tissues were dissected, weighed,
and immediately frozen in liquid nitrogen. All animal procedures were approved
by the Regional Animal Ethical Committee (Stockholm, Sweden).
Western Blotting
Western blot analysis was as described (Riedl et al., 2016). Antibodies used
are provided in Supplemental Experimental Procedures. Ponceau S staining
was used to confirm equal protein loading. Western blots were quantified by
densitometry utilizing Quantity One Software (Bio-Rad), and quantifications
are presented in Table S2.
Biochemical Analysis
Cholesterol (Life Technologies) and triglyceride (Sigma-Aldrich) levels were
determined in plasma and hepatic lipids extracted by iosproponal:heptane
extraction (Massart et al., 2014). Serum ALT, b-hydroxybutyrate (Cayman
Chemical), and insulin (Crystal Chem) levels were determined using commer-
cial kits according to manufacturer instructions. Hepatic tissue was lysed in
PBS containing 0.1% Tween 20 to analyze MCP1 (Biolegend) and RANTES
(R&D Systems) levels by ELISA. Formalin-fixed livers were sent to HistoCenter
AB for H&E staining.
DAG and TAG Lipase Assays
Supersomes transduced with human CES2 (Corning; #453322) or negative
control Supersomes (Corning; #456200) were utilized in TAG lipase activity as-
says as previously described (Ahmadian et al., 2011). DAG lipase activity assay
was assessed with cold and 14C-labeled diolein. Reactions were terminated,
and lipids were extracted and separated by thin-layer chromatography as pre-
viously described (Massart et al., 2014).
Statistics
Statistical analyses were performed using GraphPad Prism 6.0 (GraphPad
Software) and the q-value R package. A t test analysis with multiple
testing correction was used to compare lean and obese individuals. For
primary human hepatocyte experiments, data are presented as fold to ac-
count for inter-donor variation, and significance was assessed utilizing
Friedman’s test with Dunn’s multiple-testing comparison. For animal ex-
periments, two-way ANOVA was performed with a Bonferroni’s post hoc
test within each dietary condition. Virus and interaction effects were sub-
jected to multiple-testing correction for the murine lipidomics dataset.
For all tests, significance was set at q or p < 0.05. Data are presented
as mean ± SEM.
SUPPLEMENTAL INFORMATION
Supplemental Information includes Supplemental Experimental Procedures,
four figures, two tables and two data files can be found with this article online
at http://dx.doi.org/10.1016/j.celrep.2016.12.070.
AUTHOR CONTRIBUTIONS
Conceptualization, M.A.R., D.K.N., and J.R.Z.; Investigation, M.A.R., J.M.,
D.M.H., M.S., J.C.C., and S.M.L.; Writing – Original Draft, M.A.R.; Writing – Re-
view and Editing, M.A.R, D.K.N., and J.R.Z.; Visualization, M.A.R. and J.M.;
Funding Acquisition, M.A.R., E.N., D.K.N., and J.R.Z.; Resources, J.L.R.,
E.N., D.K.N., and J.R.Z.; Supervision, D.K.N. and J.R.Z.
ACKNOWLEDGMENTS
This work was supported by grants to M.A.R. (O.E. och Edla Johanssons
vetenskapliga stiftelse), E.N. (NovoNordisk Foundation and Stockholm County
Council [ALF]), J.L.R. (Swedish Research Council), and J.R.Z. (Strategic Dia-
betes Program at Karolinska Institutet [2009-1068], European Research Coun-
cil Ideas Program, Swedish Research Council [2011-3550 and 2015-00165],
Swedish Diabetes Foundation [DIA2012-082 and DIA2015-032], Swedish
Foundation for Strategic Research [SRL10-0027], Diabetes Wellness Network
Sweden [783_2015PG], NovoNordisk Foundation [NNF14OC0009941], and
Stockholm County Council [20120086 and 20150326]). J.C.C. is supported
by a fellowship from the Swedish Society for Medical Research.
Received: August 8, 2016
Revised: November 18, 2016
Accepted: December 20, 2016
Published: January 17, 2017
REFERENCES
Ahmadian, M., Abbott, M.J., Tang, T., Hudak, C.S., Kim, Y., Bruss, M., Heller-
stein, M.K., Lee, H.Y., Samuel, V.T., Shulman, G.I., et al. (2011). Desnutrin/
ATGL is regulated by AMPK and is required for a brown adipose phenotype.
Cell Metab. 13, 739–748.
Al-Khalili, L., Bouzakri, K., Glund, S., Lonnqvist, F., Koistinen, H.A., and Krook,
A. (2006). Signaling specificity of interleukin-6 action on glucose and lipid
metabolism in skeletal muscle. Mol. Endocrinol. 20, 3364–3375.
Allard, J.P., Aghdassi, E., Mohammed, S., Raman, M., Avand, G., Arendt,
B.M., Jalali, P., Kandasamy, T., Prayitno, N., Sherman, M., et al. (2008). Nutri-
tional assessment and hepatic fatty acid composition in non-alcoholic fatty
liver disease (NAFLD): a cross-sectional study. J. Hepatol. 48, 300–307.
Araya, J., Rodrigo, R., Videla, L.A., Thielemann, L., Orellana, M., Pettinelli, P.,
and Poniachik, J. (2004). Increase in long-chain polyunsaturated fatty
acid n - 6/n - 3 ratio in relation to hepatic steatosis in patients with non-alco-
holic fatty liver disease. Clin. Sci. 106, 635–643.
Barglow, K.T., and Cravatt, B.F. (2004). Discovering disease-associated en-
zymes by proteome reactivity profiling. Chem. Biol. 11, 1523–1531.
Bergman, B.C., Hunerdosse, D.M., Kerege, A., Playdon, M.C., and Perreault,
L. (2012). Localisation and composition of skeletal muscle diacylglycerol pre-
dicts insulin resistance in humans. Diabetologia 55, 1140–1150.
Blankman, J.L., and Cravatt, B.F. (2013). Chemical probes of endocannabi-
noid metabolism. Pharmacol. Rev. 65, 849–871.
Brown, J.M., Betters, J.L., Lord, C., Ma, Y., Han, X., Yang, K., Alger, H.M., Mel-
chior, J., Sawyer, J., Shah, R., et al. (2010). CGI-58 knockdown in mice causes
hepatic steatosis but prevents diet-induced obesity and glucose intolerance.
J. Lipid Res. 51, 3306–3315.
Copps, K.D., Hancer, N.J., Opare-Ado, L., Qiu, W., Walsh, C., and White, M.F.
(2010). Irs1 serine 307 promotes insulin sensitivity in mice. Cell Metab. 11,
84–92.
Correia, J.C., Massart, J., de Boer, J.F., Porsmyr-Palmertz, M., Martınez-Re-
dondo, V., Agudelo, L.Z., Sinha, I., Meierhofer, D., Ribeiro, V., Bjornholm,
M., et al. (2015). Bioenergetic cues shift FXR splicing towards FXRa2 to modu-
late hepatic lipolysis and fatty acid metabolism. Mol. Metab. 4, 891–902.
Cravatt, B.F., Wright, A.T., and Kozarich, J.W. (2008). Activity-based protein
profiling: from enzyme chemistry to proteomic chemistry. Annu. Rev. Bio-
chem. 77, 383–414.
Deng, X., Cagen, L.M., Wilcox, H.G., Park, E.A., Raghow, R., and Elam, M.B.
(2002). Regulation of the rat SREBP-1c promoter in primary rat hepatocytes.
Biochem. Biophys. Res. Commun. 290, 256–262.
Frasch, S.C., and Bratton, D.L. (2012). Emerging roles for lysophosphatidylser-
ine in resolution of inflammation. Prog. Lipid Res. 51, 199–207.
Giraud, J., Leshan, R., Lee, Y.H., and White, M.F. (2004). Nutrient-dependent
and insulin-stimulated phosphorylation of insulin receptor substrate-1 on
serine 302 correlates with increased insulin signaling. J. Biol. Chem. 279,
3447–3454.
Gorden, D.L., Myers, D.S., Ivanova, P.T., Fahy, E., Maurya, M.R., Gupta, S.,
Min, J., Spann, N.J., McDonald, J.G., Kelly, S.L., et al. (2015). Biomarkers of
NAFLD progression: a lipidomics approach to an epidemic. J. Lipid Res. 56,
722–736.
Griggs, J.J., Mangu, P.B., Anderson, H., Balaban, E.P., Dignam, J.J., Hryniuk,
W.M., Morrison, V.A., Pini, T.M., Runowicz, C.D., Rosner, G.L., et al.; American
Society of Clinical Oncology (2012). Appropriate chemotherapy dosing for
obese adult patients with cancer: American Society of Clinical Oncology clin-
ical practice guideline. J. Clin. Oncol. 30, 1553–1561.
Guo, L., Dial, S., Shi, L., Branham, W., Liu, J., Fang, J.L., Green, B., Deng, H.,
Kaput, J., and Ning, B. (2011). Similarities and differences in the expression of
drug-metabolizing enzymes between human hepatic cell lines and primary hu-
man hepatocytes. Drug Metab. Dispos. 39, 528–538.
Holland, W.L., Miller, R.A., Wang, Z.V., Sun, K., Barth, B.M., Bui, H.H., Davis,
K.E., Bikman, B.T., Halberg, N., Rutkowski, J.M., et al. (2011). Receptor-
Cell Reports 18, 636–646, January 17, 2017 645
mediated activation of ceramidase activity initiates the pleiotropic actions of
adiponectin. Nat. Med. 17, 55–63.
Hotamisligil, G.S. (2010). Endoplasmic reticulum stress and the inflammatory
basis of metabolic disease. Cell 140, 900–917.
Jessani, N., Niessen, S., Wei, B.Q., Nicolau, M., Humphrey, M., Ji, Y., Han, W.,
Noh, D.Y., Yates, J.R., 3rd, Jeffrey, S.S., and Cravatt, B.F. (2005). A stream-
lined platform for high-content functional proteomics of primary human spec-
imens. Nat. Methods 2, 691–697.
Jones, R.D., Taylor, A.M., Tong, E.Y., and Repa, J.J. (2013). Carboxyles-
terases are uniquely expressed among tissues and regulated by nuclear hor-
mone receptors in the mouse. Drug Metab. Dispos. 41, 40–49.
Jurczak, M.J., Lee, A.H., Jornayvaz, F.R., Lee, H.Y., Birkenfeld, A.L., Guigni,
B.A., Kahn, M., Samuel, V.T., Glimcher, L.H., and Shulman, G.I. (2012). Disso-
ciation of inositol-requiring enzyme (IRE1a)-mediated c-Jun N-terminal kinase
activation from hepatic insulin resistance in conditional X-box-binding protein-
1 (XBP1) knock-out mice. J. Biol. Chem. 287, 2558–2567.
Kotronen, A., Seppanen-Laakso, T., Westerbacka, J., Kiviluoto, T., Arola, J.,
Ruskeepaa, A.L., Oresic, M., and Yki-Jarvinen, H. (2009). Hepatic stearoyl-
CoA desaturase (SCD)-1 activity and diacylglycerol but not ceramide concen-
trations are increased in the nonalcoholic human fatty liver. Diabetes 58,
203–208.
Kumashiro, N., Erion, D.M., Zhang, D., Kahn, M., Beddow, S.A., Chu, X., Still,
C.D., Gerhard, G.S., Han, X., Dziura, J., et al. (2011). Cellular mechanism of in-
sulin resistance in nonalcoholic fatty liver disease. Proc. Natl. Acad. Sci. USA
108, 16381–16385.
Lee, S.Y., Hong, I.K., Kim, B.R., Shim, S.M., Sung Lee, J., Lee, H.Y., Soo Choi,
C., Kim, B.K., and Park, T.S. (2015). Activation of sphingosine kinase 2 by
endoplasmic reticulum stress ameliorates hepatic steatosis and insulin resis-
tance in mice. Hepatology 62, 135–146.
Li, M., Ellis, E., Johansson, H., Nowak, G., Isaksson, B., Gnocchi, D., Parini, P.,
and Axelsson, J. (2016a). Changes in gluconeogenesis and intracellular lipid
accumulation characterize uremic human hepatocytes ex vivo. Am. J. Physiol.
Gastrointest. Liver Physiol. 310, G952–G961.
Li, Y., Zalzala, M., Jadhav, K., Xu, Y., Kasumov, T., Yin, L., and Zhang, Y.
(2016b). Carboxylesterase 2 prevents liver steatosis by modulating lipolysis,
endoplasmic reticulum stress, and lipogenesis and is regulated by hepatocyte
nuclear factor 4 alpha in mice. Hepatology 63, 1860–1874.
Lo, V., Erickson, B., Thomason-Hughes, M., Ko, K.W., Dolinsky, V.W., Nelson,
R., and Lehner, R. (2010). Arylacetamide deacetylase attenuates fatty-acid-
induced triacylglycerol accumulation in rat hepatoma cells. J. Lipid Res. 51,
368–377.
Long, J.Z., and Cravatt, B.F. (2011). The metabolic serine hydrolases and their
functions in mammalian physiology and disease. Chem. Rev. 111, 6022–6063.
Louie, S.M., Grossman, E.A., Crawford, L.A., Ding, L., Camarda, R., Huffman,
T.R., Miyamoto, D.K., Goga, A., Weerapana, E., and Nomura, D.K. (2016).
GSTP1 is a driver of triple-negative breast cancer cell metabolism and patho-
genicity. Cell Chem. Biol. 23, 567–578.
Ma, M.M., Chen, J.L., Wang, G.G., Wang, H., Lu, Y., Li, J.F., Yi, J., Yuan, Y.J.,
Zhang, Q.W., Mi, J., et al. (2007). Sphingosine kinase 1 participates in insulin
signalling and regulates glucose metabolism and homeostasis in KK/Ay dia-
betic mice. Diabetologia 50, 891–900.
Massart, J., Zierath, J.R., and Chibalin, A.V. (2014). A simple and rapid method
to characterize lipid fate in skeletal muscle. BMC Res. Notes 7, 391.
Matsuzaka, T., Shimano, H., Yahagi, N., Kato, T., Atsumi, A., Yamamoto, T.,
Inoue, N., Ishikawa, M., Okada, S., Ishigaki, N., et al. (2007). Crucial role of a
646 Cell Reports 18, 636–646, January 17, 2017
long-chain fatty acid elongase, Elovl6, in obesity-induced insulin resistance.
Nat. Med. 13, 1193–1202.
Moon, Y.A., Ochoa, C.R., Mitsche, M.A., Hammer, R.E., and Horton, J.D.
(2014). Deletion of ELOVL6 blocks the synthesis of oleic acid but does not pre-
vent the development of fatty liver or insulin resistance. J. Lipid Res. 55, 2597–
2605.
Morita, S.Y., and Terada, T. (2015). Enzymatic measurement of phosphatidyl-
glycerol and cardiolipin in cultured cells and mitochondria. Sci. Rep. 5, 11737.
Mullen, A., Loscher, C.E., and Roche, H.M. (2010). Anti-inflammatory effects of
EPA and DHA are dependent upon time and dose-response elements associ-
ated with LPS stimulation in THP-1-derived macrophages. J. Nutr. Biochem.
21, 444–450.
Nascimento, E.B., Riedl, I., Jiang, L.Q., Kulkarni, S.S., Naslund, E., and Krook,
A. (2015). Enhanced glucosemetabolism in cultured human skeletal muscle af-
ter Roux-en-Y gastric bypass surgery. Surg. Obes. Relat. Dis. 11, 592–601.
NCD Risk Factor Collaboration (NCD-RisC) (2016). Trends in adult body-mass
index in 200 countries from 1975 to 2014: a pooled analysis of 1698 popula-
tion-based measurement studies with 19$2 million participants. Lancet 387,
1377–1396.
Neuschwander-Tetri, B.A. (2010). Hepatic lipotoxicity and the pathogenesis of
nonalcoholic steatohepatitis: the central role of nontriglyceride fatty acid me-
tabolites. Hepatology 52, 774–788.
Nomura, D.K., Dix, M.M., and Cravatt, B.F. (2010). Activity-based protein
profiling for biochemical pathway discovery in cancer. Nat. Rev. Cancer 10,
630–638.
Osawa, Y., Banno, Y., Nagaki, M., Brenner, D.A., Naiki, T., Nozawa, Y., Naka-
shima, S., and Moriwaki, H. (2001). TNF-alpha-induced sphingosine 1-phos-
phate inhibits apoptosis through a phosphatidylinositol 3-kinase/Akt pathway
in human hepatocytes. J. Immunol. 167, 173–180.
Ozcan, U., Yilmaz, E., Ozcan, L., Furuhashi, M., Vaillancourt, E., Smith, R.O.,
Gorg€un, C.Z., and Hotamisligil, G.S. (2006). Chemical chaperones reduce
ER stress and restore glucose homeostasis in a mouse model of type 2 dia-
betes. Science 313, 1137–1140.
Pawlak, M., Lefebvre, P., and Staels, B. (2015). Molecular mechanism of
PPARa action and its impact on lipid metabolism, inflammation and fibrosis
in non-alcoholic fatty liver disease. J. Hepatol. 62, 720–733.
Puri, P., Baillie, R.A., Wiest, M.M., Mirshahi, F., Choudhury, J., Cheung, O.,
Sargeant, C., Contos, M.J., and Sanyal, A.J. (2007). A lipidomic analysis of
nonalcoholic fatty liver disease. Hepatology 46, 1081–1090.
Quiroga, A.D., Li, L., Trotzm€uller, M., Nelson, R., Proctor, S.D., Kofeler, H., and
Lehner, R. (2012). Deficiency of carboxylesterase 1/esterase-x results in
obesity, hepatic steatosis, and hyperlipidemia. Hepatology 56, 2188–2198.
Riedl, I., Osler, M.E., Bjornholm, M., Egan, B., Nader, G.A., Chibalin, A.V., and
Zierath, J.R. (2016). AMPKg3 is dispensable for skeletal muscle hypertrophy
induced by functional overload. Am. J. Physiol. Endocrinol. Metab. 310,
E461–E472.
Xu, J., Teran-Garcia, M., Park, J.H., Nakamura, M.T., and Clarke, S.D. (2001).
Polyunsaturated fatty acids suppress hepatic sterol regulatory element-bind-
ing protein-1 expression by accelerating transcript decay. J. Biol. Chem. 276,
9800–9807.
Yea, K., Kim, J., Lim, S., Kwon, T., Park, H.S., Park, K.S., Suh, P.G., and Ryu,
S.H. (2009). Lysophosphatidylserine regulates blood glucose by enhancing
glucose transport in myotubes and adipocytes. Biochem. Biophys. Res. Com-
mun. 378, 783–788.
Related Documents