Human Capital Versus Signaling Models: University Access and High School Dropouts Kelly Bedard* University of California, Santa Barbara *I thank Heather Antecol, Martin Browning, Rick Harbaugh, Eric Helland, Peter Kuhn, John Spraggon, Mike Veall, and particularly Sherwin Rosen and two anonymous referees for very helpful comments. I am responsible for all errors.

Welcome message from author
This document is posted to help you gain knowledge. Please leave a comment to let me know what you think about it! Share it to your friends and learn new things together.
Transcript
Human Capital Versus Signaling Models: University Access and High School Dropouts
Kelly Bedard*
University of California, Santa Barbara
*I thank Heather Antecol, Martin Browning, Rick Harbaugh, Eric Helland, Peter Kuhn, John Spraggon, Mike Veall, and particularly Sherwin Rosen and two anonymous referees for very helpful comments. I am responsible for all errors.

1
ABSTRACT Under the educational sorting hypothesis, an environment in which some individuals are constrained from entering university will be characterized by increased pooling at the high school graduation level, as compared to an environment with greater university access. This results because some potential high school dropouts and university enrollees choose the high school graduate designation in order to take advantage of high ability individuals who are constrained from entering university. This is in stark contrast to human capital theory which predicts higher university enrollment, but identical high school dropout rates in regions with greater university access. I test the contradictory high school dropout predictions of the human capital and signaling models using NLSYM and NLSYW education data from the late 1960s and early 1970s. I find that labor markets that contain universities have higher high school dropout rates. This result is consistent with a signaling model, and inconsistent with a pure human capital model. JEL Classification: I2, C25. Keywords: Education, Human Capital, Sorting Models.

2
1. Introduction
Within a human capital framework, education augments natural abilities that are
subsequently sold in the labor market. While agreeing with this description, supporters of
sorting models argue that education also acts as a signaling, or screening, device for
unobservable ability. More specifically, firms infer ability from education and students choose
an education level to signal their ability to potential employers. The earnings reward for high
school graduation is therefore the combined effect of human capital accumulation as well as the
effect of being identified as a graduate rather than a dropout.
In this paper I develop, and test, a simple signaling model in which some fraction of the
population is constrained1 from entering university. I show that increasing university access, by
expanding the university system and thereby lowering the cost of post-secondary education, may
increase the high school dropout rate. As some previously constrained, but relatively high
ability, students leave the high school graduate group to become university enrollees, the
incentive to hide behind the remaining “constrained” high school graduates is diminished. As a
result, the most able “unconstrained” high school graduates enroll in university and the least able
drop out of high school. This is in stark contrast to a pure human capital model which predicts
only an upward movement in educational attainment.
Despite the importance of the debate surrounding human capital and sorting
interpretations, empirical evidence is fairly limited and often unconvincing. The difficulty
largely arises because many of the empirical implications of the basic human capital and sorting
models are similar or identical. This is not particularly surprising since the firm and worker
1 The term “constrained” is used to convey the idea that the cost of going to university is too high for some fraction of the population to pay. Since it is significantly cheaper to attend a local university, “access” is said to be higher in areas that have a university. In other words, the cost of attending university is much lower for people living in areas with universities, and enrollment is therefore higher.

3
decision processes are the same in both models. Firms weigh the productivity of workers with
different amounts of schooling against the wages they command, and select the education mix
that maximizes profits. At the same time, workers compare wages to education costs and choose
the schooling level that maximizes wealth (or utility).
To avoid this problem, Riley (1979) takes advantage of the fact that within a sorting
framework extra information about worker productivity reduces the importance of education as a
signal. He divides workers into jobs with and without observable productivity, and tests whether
education is less important in jobs where productivity is observable. Although Riley's results are
consistent with a sorting model, they are also compatible with the view that his two samples
simply consist of workers in more and less risky occupations.
Using a somewhat different approach, Wolpin (1977) estimates separate earnings
functions for self-employed and privately employed workers in the NBER-Thorndike sample.
He finds that average schooling is lower among the self-employed, but that education has a
larger impact on their earnings. Since the self-employed enjoy average earnings that are one-
third higher in each of the educational categories, it seems reasonable to conclude that the
amount of schooling required to attain each earnings level is lower for the self-employed.
Wolpin's results provide some support for the sorting hypothesis.
An alternative approach, employed by Lang and Kropp (1986), is to look at the
comparative statics properties of the models. Lang and Kropp consider the effect of a
compulsory attendance law in the presence of educational sorting. Under a sorting model, an
increase in the minimum school leaving age will increase the educational attainment of
individuals not directly affected by the rule change. A rise in the school leaving age from s to
s+1 will be accompanied by a decrease in the average ability level of people with s+1 years of

4
education. As this happens, the most able people with s+1 years of education will choose to
remain in school for s+2 years and so on. In contrast, under the human capital model a change in
the minimum schooling age will only alter the behavior of directly affected individuals. Using
school enrollment data and compulsory attendance laws across U.S. states from 1910-70, Lang
and Kropp (1986) show that the enrollment rates for individuals with schooling levels beyond
those directly affected by compulsory attendance laws did in fact rise with minimum leaving age
requirements.
Departing from previous work, but following most closely in the spirit of Lang and
Kropp (1986), this paper considers the role of university access in educational attainment
decisions. Access refers to the presence of a university, and not to admission. Within a
symmetric information (standard human capital) framework, local universities and satellite
campuses provide lower cost post-secondary alternatives, and consequently increase university
enrollment. While fewer barriers to higher education will increase university enrollment within
an asymmetric information (signaling) framework, it might also increase the high school dropout
rate. If fewer high ability people are constrained from entering university, the high school
graduate2 skill pool is reduced, and the incentive to obtain the high school graduate designation
is diminished. The least able graduates therefore become dropouts and the most able enroll in
university.
Using National Longitudinal Survey of Young Men (NLSYM) and Young Women
(NLSYW) data for men aged 14-19 in 1966 and women aged 14-19 in 1968, I investigate the
role that university access plays in schooling decisions. This time period is well suited to this
2 Throughout this paper I use high school dropout to describe any individual not completing grade 12, high school graduate to identify any individual who completes high school but does not enter university, and university enrollee to describe a person with some university training.

5
study because there was substantial variation in university access, and the NLSYM and NLSYW
report the presence of a university in the respondent's local labor market.
The remainder of the paper is as follows. The next section sketches a simple theoretical
framework. Section 3 details the empirical approach. Section 4 discusses the NLSYM and
NLSYW data. Section 5 presents the results. Section 6 concludes.
2. The Determinants of Degree Choice
2.1 A Simple Asymmetric Information Framework
Consider a simple environment in which ability (θ) is continuously distributed and the
distribution of ability and the probability of constraint are common knowledge, but only
individuals know their actual ability and whether or not they are constrained. I initially assume
that the probability an individual is constrained from entering university, 1−p, is independent of
ability.3 The implications of relaxing this restriction are discussed later in this section. For
expositional convenience, and with no loss of generality, I ignore any human capital
accumulation associated with education.4 Finally, I assume that employers can observe
schooling, but not ability, output, or whether an individual was constrained from entering
university, and therefore pay workers with education level s the average product (ability) of
group s. In this environment, just as in the human capital framework, people choose the
3 With imperfect capital markets, a student might be constrained from entering university if he does not live near a university and his parents lack the financial resources to board him at an out of town school. This description is clearly stronger than it needs to be; university participation will obviously be higher in areas that have a university since the marginal cost of attending university is substantially lower if you can live with your parents while in school. In other words, some fraction of the population will choose to attend university even if expensive private, or distant universities are the only option, while another proportion of the population will choose to attend only if a university exists in their local area. 4 The notation also blurs all lifecycle wage components, but θ can be viewed as the discounted value of lifetime ability.

6
education level that maximizes their lifetime wealth, discounted lifetime wages less the cost of
education.
The framework presented in this section is a generalization of the standard signaling
model (Spence 1973 and Stiglitz 1975). There are three schooling choices (s): drop out of high
school (d), graduate from high school (h), or enroll in university (u). Schooling costs, Cs(θ), are
a continuous decreasing function of ability and are increasing in educational designation.
Education costs must be paid in order; a university enrollee must pay the high school graduation
cost as well as the university enrollment cost.
Within this framework, a separating equilibrium with three distinct education groups, and
cutoffs for group membership at θh and θu, must satisfy the following break point conditions:
)()()|()()()|(
uuu
hhh
CECE
θθφθθθθθφθθθ
+=≥−=<
where
[ ] [ ][ ] [ ])(1)1()()(
)|()(1)1()|()()()(uhu
uuuhhu
FpFFEFpEFF
θθθθθθθθθθθθθθφ
−−+−≥−−+<≤−=
is the expected wage of high school graduates, )|( hE θθθ < is the expected wage of high school
dropouts, )|( uE θθθ ≥ is the expected wage of university enrollees, F() denotes the cumulative
distribution function, and f() denotes the probability density function. Notice that this
is a non-standard separating equilibrium since the high school graduate group contains people
with ability in excess of θu who are constrained from entering university. Such a separating
equilibrium satisfies the intuitive criterion,5 as well as other standard refinements, since all
signals are sent in equilibrium by some type. Although the assumption of a separating
equilibrium is somewhat restrictive, and Spence (1974) shows that Nash behavior is not

7
sufficient to rule out pooling, empirical evidence clearly proves that any model that does not give
rise to some sorting can be rejected.6
Proposition: If we begin in a stable separating equilibrium, greater university access leads to
more high school dropouts.
The intuition behind the proposition is very simple. As constraints fall, the movement of
previously constrained individuals with skills above θu into the university enrollee group reduces
the high school graduate skill pool, encouraging the least able graduates to drop out. The
changing education choices are particularly easy to see diagrammatically. For illustrative
purposes, suppose that skills are uniformly distributed and that we begin in a separating
equilibrium with cutoffs for education group membership at θh and θu. Individuals in the shaded
region in the top half of Figure 1 are free to choose any level of education, while people in the
unshaded area are constrained from entering university. It is the people above θu that make this a
non-standard equilibrium; the people in the shaded area beyond θu enter university, but those in
the unshaded area beyond θu are constrained from doing so and are forced to leave at high school
graduation. Stated somewhat differently, the high school graduate group consists of the entire
unshaded region beyond θh as well as the shaded region between θh and θu. This means that the
graduate skill pool is substantially greater than would otherwise be the case.
Now consider an increase in university access, or an increase in p. The bottom half of
Figure 1 illustrates the equilibrium education choices after an increase in university access (an
5 See Cho and Kreps (1987). 6 Rothschild and Stiglitz (1976) and Riley (1979) prove that a Nash equilibrium might not exist if the concentration of low ability types is too low, but Riley (1985) and Dickens and Lang (1985) show that this possibility is not important in practical terms.
8
increase in the shaded area). Individuals beyond θu, and above the hatched line, become
university enrollees and thereby reduce the high school graduate skill pool. This in turn induces
the most able, and unconstrained, graduates to enroll in university (those in the shaded region
between uθ′ and θu) and the least able graduates to become dropouts (individuals between θh and
hθ′ ). In other words, the cutoffs for education group membership shift inward. The net result is
an abandoning of the middle; more university enrollees and more high school dropouts.
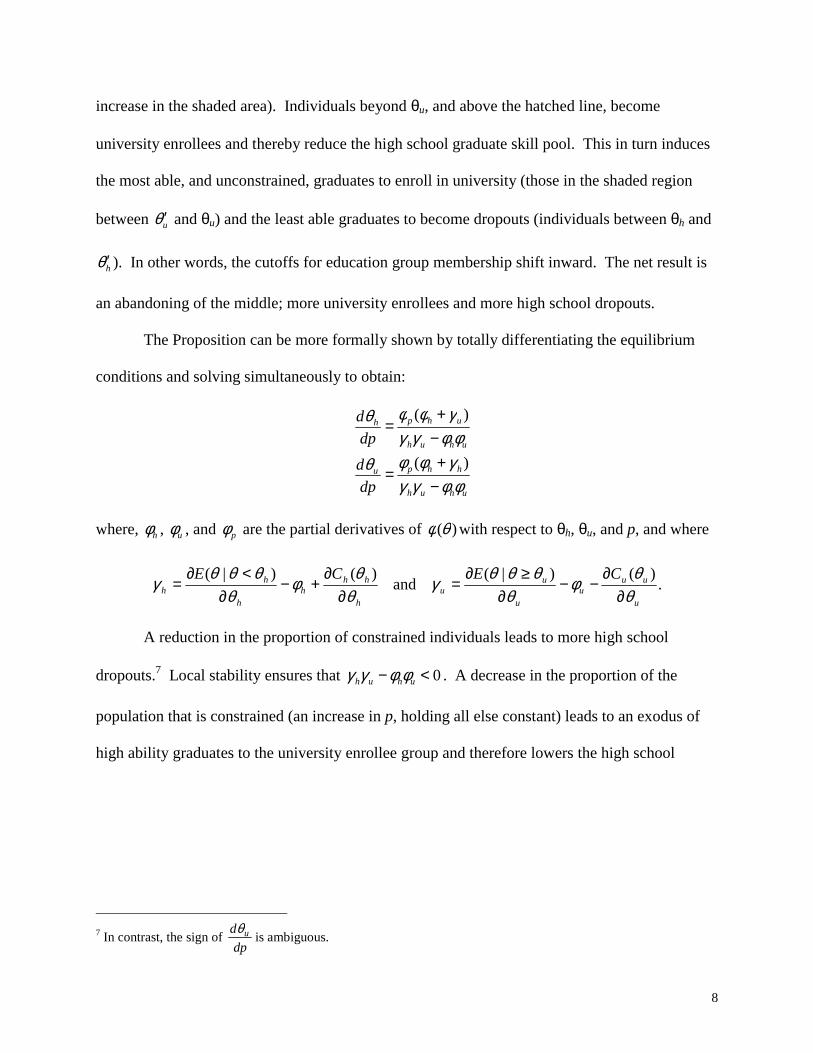
The Proposition can be more formally shown by totally differentiating the equilibrium
conditions and solving simultaneously to obtain:
uhuh
hhpu
uhuh
uhph
dpddpd
φφγγγφφθφφγγ
γφφθ
−+
=
−+
=
)(
)(
where, hφ , uφ , and pφ are the partial derivatives of )(θφ with respect to θh, θu, and p, and where
.)()|(
and)()|(
u
uuu
u
uu
h
hhh
h
hh
CECEθθφ
θθθθγ
θθφ
θθθθγ
∂∂
−−∂
≥∂=
∂∂
+−∂
<∂=
A reduction in the proportion of constrained individuals leads to more high school
dropouts.7 Local stability ensures that 0<− uhuh φφγγ . A decrease in the proportion of the
population that is constrained (an increase in p, holding all else constant) leads to an exodus of
high ability graduates to the university enrollee group and therefore lowers the high school
7 In contrast, the sign of
dpd uθ is ambiguous.

9
graduate skill pool ( pφ < 0). Finally, the assumption that p is independent of ability guarantees
that 0>+ hh γφ by ensuring that uu
uE φθ
θθθ>
∂≥∂ )|(
. Hence we conclude that 0>dpd hθ .8
The analysis is somewhat more complicated if the probability of constraint is a function
of ability, )(1 θp− . However, as long as the probability of constraint is a decreasing function of
ability and is non-zero for the most able, both before and after the constraint is eased, the
Proposition continues to hold.
Assuming that all ability types have some probability of constraint, an increase in
university enrollment that results from better university access may come from two sources:
previously constrained and previously unconstrained people. Access therefore has an ambiguous
impact on the university enrollee skill mean. While the previously unconstrained people moving
into the university enrollee group are less able than the university enrollees they are joining, the
skill mean of previously constrained movers depends on the probability of constraint and
educational cost functions. In contrast, those moving from the high school graduate group to the
dropout group are more skilled than the initial high school dropouts, and hence unambiguously
raise the average skill level. Given the potential exodus of both the most and least gifted high
school graduates, the impact on the graduate skill mean is also ambiguous.
It might appear that high school dropouts in high access regions have an incentive to
graduate from high school and then look for work in low access areas where high school
graduates are more highly paid. There are a couple of points that one should bear in mind. First,
employers can observe the institution from which a job applicant graduated. If there are
differences between `locals' and `non-locals' employers can use this information to sort workers.
8 Note that this comparative static result refers to a small change in p. If there are multiple equilibria, a large change in p might induce a shift to a different equilibrium.

10
Second, if students in high access regions take the behavior of students in low access areas into
account when choosing an education level, fewer people will dropout of high school in these
regions than if they fail to incorporate this information. The dropout estimates presented in this
paper might therefore be viewed as a lower bound.
2.2. The Standard Symmetric Information Framework
The predictions of a standard, symmetric information, human capital model differ
substantially. Within in this framework, reducing the barriers to higher education will increase
university enrollment, but will have no impact on the high school dropout rate. An increase in
access to local universities will bring the cost of higher education within range for some
proportion of previously constrained individuals, and thereby encourage higher university
enrollment. It will not, however, have any impact on the high school dropout rate, or the
university enrollment rate of unconstrained people.
It might seem that university access rate differences might alter the number of people in
each education category, and thus the return to a specific degree. However, since regions are
relatively small, there is a free flow of goods across regions, and we are concerned with the
variation in access at a point in time, the return to education will be the same across regions
under the human capital hypothesis.9 Even if the return to education differs across access levels,
the human capital model is consistent with a higher school dropout rate only if college enrollees
are substitutes for high school graduates but complements with high school dropouts.10 Grant
(1979), as reported in Hamermesh and Grant (1979), is the only study that estimates the labor
9 Even if goods and factors do not move perfectly, Lang and Kropp (1986) show that changes in school policy will not have a significant impact on people not directly affected by the policy. The analysis presented in this paper uses local labor market (based on 1966 county definitions) data, whereas Lang and Kropp (1986) use state level data. It

11
substitutability using more than two education groups. Defining education groups as those with
0-8, 9-12, and 13+ years of education, Grant (1979) finds that college enrollees are substitutes
for both high school dropouts and graduates. Studies breaking education into only two
categories, regardless of break-point, also find that more and less educated workers are
substitutes. Examples include, Johnson (1970) using college versus high school graduates,
Welch (1970) using college graduates versus some college, Dougherty (1972) using 9+ versus -
8, and Berger (1983) using 0-15 versus 16+ years of education. These results are not consistent
with a human capital model generating more high school dropouts in areas with university
access.
In contrast to the skill pool predictions of the signaling model, the human capital model
predicts a decrease in the mean skill level of high school graduates, no change for high school
dropouts and an ambiguous change for university enrollees. The high school dropout skill mean
is unchanged since there is no entry or exit. Conversely, higher access decreases the graduate
skill pool by encouraging the most able graduates to become university enrollees. Finally,
access has no impact on the university skill mean if the probability of constraint is independent
of ability, but more generally, it depends on the form of the constraint probability.
3. Empirical Implementation
The model presented in Section 2 offers two specific testable predictions that differ across
signaling and human capital models. Or more precisely, it offers two alternative ways to test the
same prediction. First, the signaling model predicts a higher high school dropout rate in regions
that contain a university while the human capital model predicts no difference. Second, the
is even less likely that differences in educational category sizes would give rise to differences in the return to schooling levels across local labor markets.

12
signaling model predicts a higher skill pool among dropouts in regions with a university and the
human capital model does not.
The United States during the late 1960s offers a good opportunity to test the predictions of
the signaling model across university access levels. During this era approximately 30% of the
population lived in labor markets that did not contain a university. The NLSYM and NLSYW
data, described in the next section, allow us to investigate the differences in educational
decisions made by youth with and without access to a university, controlling for family
background.
3.1. Educational Attainment
Following from the simple model outlined in the previous section, I assume that people
choose membership in one of three education groups (s): high school dropouts (d), high school
graduates (h), and university attendees (u). While this is clearly a simplification, it captures the
essence of the problem and is necessary for tractability. Since choosing between education
groups is a single decision among ordered alternatives, it can easily be estimated as an ordered
probit model.
Within the framework of a standard ordered probit model, individual i chooses to be a
high school graduate if
σβκ
θσ
βκ ∑∑ −<<
−s issu
is issh XX
where iθ is a standard normal variate, hκ and uκ are the cut points that induce individual i to drop
out of high school or enroll in university, and X is a vector of family background and regional
characteristics.
10 I am indebted to two anonymous referees for making this point.
13
As is well known, σ is not identified in the ordered probit model described above. I
follow standard practice and normalize σ to one and then interpret the coefficient estimates as
relative to this variance term. This model also produces standardized cut points hκ and uκ
which are assumed to be the same for all individuals in the sample (Specification 1).
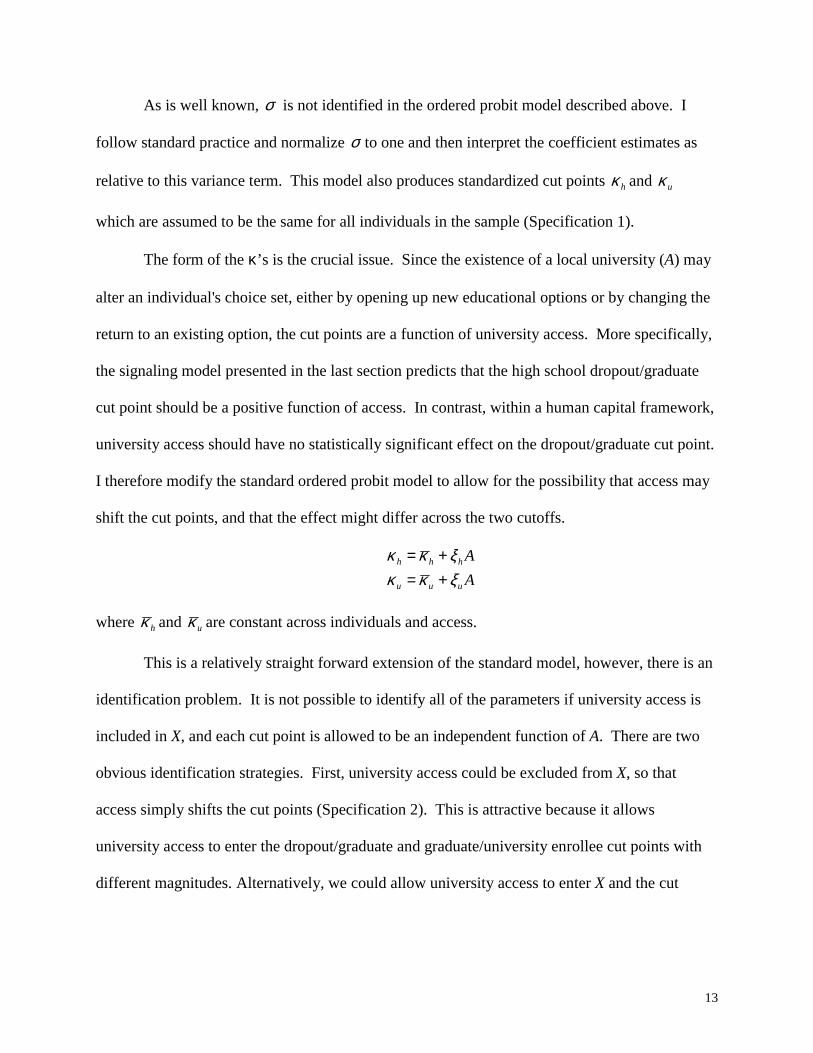
The form of the κ’s is the crucial issue. Since the existence of a local university (A) may
alter an individual's choice set, either by opening up new educational options or by changing the
return to an existing option, the cut points are a function of university access. More specifically,
the signaling model presented in the last section predicts that the high school dropout/graduate
cut point should be a positive function of access. In contrast, within a human capital framework,
university access should have no statistically significant effect on the dropout/graduate cut point.
I therefore modify the standard ordered probit model to allow for the possibility that access may
shift the cut points, and that the effect might differ across the two cutoffs.
AA
uuu
hhh
ξκκξκκ
+=+=
where hκ and uκ are constant across individuals and access.
This is a relatively straight forward extension of the standard model, however, there is an
identification problem. It is not possible to identify all of the parameters if university access is
included in X, and each cut point is allowed to be an independent function of A. There are two
obvious identification strategies. First, university access could be excluded from X, so that
access simply shifts the cut points (Specification 2). This is attractive because it allows
university access to enter the dropout/graduate and graduate/university enrollee cut points with
different magnitudes. Alternatively, we could allow university access to enter X and the cut

14
points, but restrict access to have the same impact (but of opposite sign) on both cut-points11
(Specification 3). More specifically, we could restrict the model such that
AA
uu
hh
ξκκξκκ
−=+=
.
Since there is no a priori reason to restrict university access to have the same impact on
both cut points, all results reported in this paper are for Specification 2. However, all results are
similar using Specification 3. Further, a likelihood ratio test rejects the standard ordered probit
(Specification 1), with no university access measure in X, in favor of either Specification 2 or 3
with p-values of less than 0.01 under all access definitions.
3.2. The Skill Level within Education Groups
The NLSYM and NLSYW include scores for the Knowledge of the World of Work test,
which has been used by both Card (1995) and Griliches (1977) as a measure of ability. Using
this information it is possible to examine how education group mean test scores vary across
university access.
issisisis ZAKWW υααα +++= 210
where Z is a vector of family and individual characteristics and s denotes education group.
4. Data
The data used in this paper are drawn from the National Longitudinal
Surveys of Young Men (NLSYM) and Young Women (NLSYW). The NLSYM began in 1966
with 5225 men aged 14-24 and continued with follow-up surveys through 1981. The NLSYW
began in 1968 with 5159 women aged 14-24 and continued through 1993. As the primary
11 In fact, any pre-specified function of access would be identified.

15
variable of interest (access to a local university) is only reported in the base year, I limit the
sample to individuals aged 14-19 in the base year in order to measure access as accurately as
possible. Restricting the sample in this manner is important for two related reasons. First, the
rapid expansion of the university system during the 60s and 70s might lead to significant
measurement error if the access measure refers to access 6 or 8 years after schooling decisions
are made. Secondly, university access information was only collected in 1966 (1968), for the
labor market of residence in that year. This data is therefore less likely to correspond to the labor
market of residence when educational decisions were made the older the individual was in 1966
(1968). Restricting the sample in this manner leaves 3203 men and 2693 women. Summary
statistics are reported in Table 1.
Education is defined as the highest grade completed in any survey year. For example, a
person who does not report years of education in 1981, but reported 14 years in 1980, is assigned
14 years of schooling.12 This method of measuring years of education reduces missing
observations. Since I am interested in initial education decisions and not the decision to return to
school later in life, an individual must complete grade 12 by age 20 to be considered a high
school graduate,13 and enter university by age 22 to be considered a university enrollee. The
average man has 13.3 years education while the average woman has only 13.0. The male/female
education gap is largely due to university participation differences; 47% of men, but only 33% of
women attended university.
In the 1966 (1968) baseline interview, respondents were asked numerous family
background questions. Individuals were asked their mothers' and fathers' years of education, but
12 I exclude individuals who do not complete grade ten because it is unclear how they arrived at educational decisions. 13 This definition also reduces the probability of mixing high school graduates who completed their education at a high school and people receiving high school equivalency diplomas.

16
unfortunately a relatively large fraction (approximately 15%) of the sample have missing values
for these variables.14 The respondents were also asked if either parent was an immigrant; 4.5%
and 4.1% of men report an immigrant father and mother respectively while the corresponding
rates for women are 3.7% and 3.3%. Family status at age 14 is also reported in both surveys;
88% of men and 81% women lived with both parents at age 14.
The baseline survey also asked a series of questions about the respondent's local labor
market. The Census Division (CD) of residence and community size (city, suburb, or rural) are
reported for all individuals. Most importantly, the NLSYM and NLSYW report the existence of
several types of post-secondary educational institutions in the respondent's local labor market. In
order to check the robustness of the estimates to the access definition, I define four different
access measures and report all estimates under each of the four definitions. Access definitions
include the presence of: a public two or four year degree granting institution, a public four year
degree granting institution, a two or four year degree granting institution, and a four year degree
granting institution. There was substantial variation in university access: 62% (58%) of men
(women) lived in a labor market containing a public two or four year university and only 52%
(48%) of men (women) had access to a public four year institution.
Finally, the baseline data also includes Knowledge of the World of Work (KWW) and IQ
test scores. Unfortunately, the IQ test-instrument differed across schools and states. All analysis
presented in this paper is therefore restricted to the KWW test which was administered to all
respondents in the base year of the survey. The male version of this test consists of twenty-eight
questions about job activities in ten occupations, the educational requirements for these
14 I use two approaches to deal with this problem, I run all regressions with the complete data set assigning mean fathers' and mothers' education to those with missing values (and include dummies too indicate imputed data) as well as simply excluding people who do not report parental education information.

17
occupations, and the relative earnings of eight paired occupations. The KWW test for women
was a shorter version of the same test.
Although I report the results for the KWW scores by education group, a better ability
measure, such as an IQ score from a standardized test instrument, would clearly be preferable.
Thus, while the results presented in section 5.2 are supportive of the main results reported in
section 5.1, they are best viewed as suggestive rather than conclusive given the weakness of the
KWW test.
5. Results
5.1. Educational Attainment
Before turning to the formal analysis, it is helpful to compare the distribution of
educational attainment for individuals living in labor markets with and without a university. The
bottom of Table 1 reports the percentage of people in each education group across university
access. If access is defined as the presence of a two or four year public institution, 20.5% of men
and 17.3% of women drop out of high school in labor markets without access compared to
22.3% and 21.3% in regions with access respectively. However, differences in educational
attainment levels do not prove that university access plays a role since we have not controlled for
regional, family, or individual characteristics that clearly influence schooling choices. The
remainder of this section therefore focuses on more formally exploring the role that university
access plays in determining educational decisions, holding other factors constant.
Table 2 reports the ordered probit estimates allowing university access to enter the high
school dropout/graduate and graduate/university enrollee cut points independently (Specification
2). All regressions include dummy variables indicating residence in a city in 1966 (1968),
18
residence in a suburb in 1966 (1968), race being black, immigrant father, immigrant mother,
household subscribed to a newspaper when the respondent was 14 years of age, someone in the
household had a library card when respondent was 14, eight indicators for census division in the
base year, father's and mother's years of education, and number of siblings.15
The coefficient estimates, presented in Table 2, generally have the expected signs.
Parental education, the presence of a newspaper in the home, and access to a library card, all
have a positive impact on the probability that an individual stays in school longer. Conversely,
family size and residence in an inner city increase the probability that an individual will leave
school early.
Most importantly, university access enters the high school dropout/graduate cut point
positively, and is statistically significant at conventional levels under most access definitions. In
other words, university access increases the probability that an individual chooses to be a high
school dropout. Table 3 reports the predicted education group sizes under all access definitions.
The predicted high school dropout rate in labor markets with access is 0.8-1.3 percentage points,
or 4.2%-7.0%, higher for men and 0.8-4.4 percentage points, or 4.7%-31.4%, higher for women
compared to labor markets without access, depending on the access definition. To the extent that
area of residence is endogenous and families with university-bound children choose to reside in
areas with a university, these estimates understate the high school dropout increase associated
with university access.
The impact and statistical significance of access on the dropout/graduate cut point differs
across access measures for men and women. This likely reflects differences in program/degree
preferences between men and women during the late 1960s and early 1970s. Training for `good'
15 To check the robustness of the estimates to sample definitions, all regressions were also run excluding observations with missing parental education data. The results are robust to this sampling restriction and are

19
female jobs, such as nursing, teaching, and more technical office jobs was more likely available
at two-year colleges. It is not, therefore, surprising that the female estimates are more sensitive
to the definition of access. Further notice that the estimates are more precise when access is
defined as a local public university. This is exactly as one would expect. It is more likely that
`constrained' individuals can gain access to a local public institution compared to a private
university.
One might also wish to control for ability. Adding the KWW score to the independent
variable list does not substantially alter any of the results, and are therefore not reported. The
statistical significance of all coefficients are largely unchanged, as are coefficient magnitudes
and the probabilities of opting for various education groups.
To check that model specification is not driving the results I also ran all regressions using
Specification 3. The estimates, including the access measure coefficients and the predicted
educational group sizes, are similar in all cases. Further, the flavor of the results is also similar
using a standard probit model, with the two education choices being dropout of high school or
high school graduation and beyond.
Table 4 presents a variety of specification and robustness checks. Columns 1-3 for men,
and column 1 for women16, add the unemployment rate,17 labor demand index,18 and market
size19 combined with the unemployment rate respectively. The impact and statistical
significance of the university access measure in the high school dropout/graduate cut point is
similar to previous specifications in all cases.
therefore not reported. 16 Fewer variables are reported for women. 17 The NLSYM and NLSYW report local unemployment rates for 1967-70. The unemployment measure in Table 4 is the average for the available years. 18 This index ranges from 0-73, with higher numbers reflecting greater labor demand. The labor demand index in Table 4 is the average for the available years, 1967-70.

20
Table 5 replicates Table 2 with the addition of the father's Duncan socioeconomic index20
to the list of regressors and the replacement of university access in the cut points with an
interaction between access and the socioeconomic index. This index ranges from 0-100, with
larger numbers reflecting higher socioeconomic status as computed by occupation and industry
codes.21 I use this index rather than parental income or education to avoid sample size reduction
due to missing information. The results are again similar; having a father with a higher Duncan
index increases the probability of staying in school longer, but the interaction of access and the
socioeconomic index also shifts the dropout/graduate cut point to the right. Finally, the first two
panels of Table 6 repeat Table 4 with the addition of the socioeconomic index and the second
two panels exclude the socioeconomic index and interact access with father's education.22 Once
again the results are similar.
5.2. The Skill Level within Education Groups
The signaling model presented in Section 2 also predicts that the skill pool will be greater
among high school dropouts in labor markets with university access, as compared to labor
markets without access. This is supported by the raw average test score differences for high
school dropouts. Table 1 reports a 2.5 (3.3) percentage point higher mean for male (female) high
school dropouts with university access than without.
Table 7 reports the average KWW test score differential for regions with and without
access, controlling for observable factors. Controlling for family background and observable
characteristics, the average score for a male dropout is 1.9%-3.6% higher in regions with
19 The size of the labor force for the repondents' labor market is reported in thousands for the 1960 Census. The mean labor market has 622,000 workers. 20 The Duncan index for the women's sample is reported for the head of the household. 21 For a detailed description of the index see Duncan (1961).

21
university access. In contrast, there is no statistically significant relationship between university
access and KWW scores for women in any education group. The difference between the male
and female versions of the KWW test instrument is the most likely explanation for this result.
The female test instrument is very coarse; it consists of only 10 questions, while the male version
has 28.
6. Discussion
While a pure human capital model predicts higher university attendance in regions
containing a university, it predicts no difference in the high school dropout rate. In contrast,
signaling allows for the possibility that higher university access may actually discourage high
school graduation. Using data from the late 1960s and early 1970s, I find that areas with
universities did indeed have higher post-secondary participation, from 10%-15% higher,
depending on access definitions and gender. At the same time, high school dropout rates were
also 4%-31% higher in areas with university access. To put this in context, the percent increase
in high school dropouts is at least 33% of the percent increase in university enrollment.
Although fewer people are constrained from entering university today than twenty years
ago, there remain individuals who are unable to attend university due to geographic or financial
barriers. Coming at this from a somewhat different perspective, many European countries use
selective education systems that effectively bar a large percentage of the population from
entering university. Although a human capital model clearly predicts that these types of
rigidities influence the choice set, and earnings, of individuals directly affected, the results
22 Individuals who do not report their father's years of schooling are assigned the mean.

22
presented in this paper suggest that they might also influence the decisions of people not directly
affected.23
Further, as it becomes easier for more able individuals to distinguish themselves from
less able individuals, wages become more meritocratic. In other words, as constraints decline, or
higher education becomes more accessible, wages more closely reflect productivity. This is an
important finding for social policy. Although increased university access is often touted as part
of the prescription to improve the lives of the `less' fortunate, the results presented in this paper
suggest that increased university access might increase education and wage dispersion, and result
in lower earnings power for the less able.
23 In a similar vein, Betts (1998) shows that a higher educational standard can increase the earnings power of both the most and least able, even though the behavior of the least able is unaffected.
23
References
Berger, Mark C., “Changes in Labor Force Composition and Male Earnings: A Production Approach.” Journal of Human Resources 18 (Spring 1983): 177-96.
Betts, Julian. “The Impact of Educational Standards on the Level and Distribution of Earnings.”
American Economic Review 88 (March 1998): 266-75. Cho, I-K, and D.M. Kreps. “Signaling Games and Stable Equilibria.” Quarterly Journal of
Economics 102 (May 1987): 179-221. Card, David. “Using Geographic Variation in College Proximity to Estimate the Return to
Schooling.” In Aspects of Labour Market Behaviour: Essays in Honour of John Vanderkamp, edited by Louis N. Christofides, Kenneth E. Grant and Robert Swindinsky. Toronto; Buffalo and London: University of Toronto Press, 1995.
Dickens, William T. and Kevin Lang. “A Test of Dual Labor Market Theory.” American
Economic Review 75 (September 1985): 792-805. Dougherty, C.R.S. “Estimates of Labor Aggregation Functions.” Journal of Political Economy
80 (November-December 1972): 1101-19. Duncan, Otis Dudley. “A Socioeconomic Index for All Occupations.” In Occupations and Social
Status, edited by Albert J. Reiss, Jr. The Free Press of Glencoe Inc., 1961 Grant, James. “Labor Substitution in U.S. Manufacturing.” Ph.D. dissertation, Michigan State
University, 1979. Griliches, Zvi. “Estimating the Returns to Schooling: Some Econometric Problems.”
Econometrica 45 (January 1977): 1-22. Hamermesh, Daniel and James Grant. “Econometric Studies of Labor-Labor Substitution and
Their Implications for Policy.” Journal of Human Resources 14 (Fall 1979): 518-42. Johnson, George E. “The Demand for Labor by Educational Category.” Southern Economic
Journal 37 (October 1970): 190-204. Lang, Kevin and David Kropp. “Human Capital vs. Sorting: The Effects of Compulsory Attendance Laws.” Quarterly Journal of Economics 101(August 1986): 609-24. Riley, John. “Informational Equilibrium.” Econometrica 47 (March 1979): 331-59. Riley, John. “Testing the Educational Screening Hypothesis.” Journal of Political Economy, 87
(October 1979): S227-52.

24
Riley, John. (1985), “Competition with Hidden Knowledge.” Journal of Political Economy
93(October 1985): 958-76. Rothschild, Michael and Joseph Stiglitz. “Equilibrium in Competitive Insurance Markets: An
Essay on the Economics of Imperfect Information.” Quarterly Journal of Economics 90 (November 1976): 630-49.
Spence, Michael A. “Job Market Signaling.” Quarterly Journal of Economics 87 (August 1973):
355-74. Spence, Michael A. Job Market Signalling: Informational Transfers in Hiring and Related
Processes. Cambridge: Harvard University Press, 1974. Stiglitz, Joseph. “The Theory of Screening Education and the Distribution of Income.” American
Economic Review 65 (June 1975): 283-300. Welch, Finis. “Education in Production.” Journal of Political Economy 78 (January-February
1970): 35-59. Wolpin, Kenneth I. “Education and Screening.” American Economic Review 67 (December
1977): 949-58.

Figure 1. Uniformly Distributed Ability Before Constraints are Eased
After Constraints are Eased
θ
θu θh θ
)
θ
f(θ)
θh
h' θu' θuf(θ
25

26
Table 1. Descriptive Statistics
Entire Sample Men Women
Men Women Access No Access Access No Access
Age Distribution (%)*14-15 37.2 28.7 37.0 37.6 27.8 31.216-17 36.9 36.5 36.3 37.9 38.1 35.518-19 25.9 34.8 26.8 24.5 34.0 33.4
Regional Distribution (%)*Northeast 20.5 19.9 23.9 14.9 23.8 8.2Midwest 26.5 28.2 27.6 24.8 27.6 28.6South 39.9 38.3 23.7 23.7 27.3 51.7West 13.1 13.6 24.8 36.6 21.4 11.5
Residence in (%)*Inner-City 33.9 35.9 44.0 17.6 47.7 13.6Suburb 32.4 30.2 33.9 29.9 32.2 22.6Rural 33.7 33.9 22.1 52.5 20.1 63.8
University Access in Local Area (%) 2 or 4-year public university 61.6 58.0 100.0 0.0 100.0 0.04-year public university 51.8 47.9 84.1 0.0 82.5 32.72 or 4-year university 80.6 77.5 100.0 49.6 100.0 18.74-year university 69.9 66.5 84.5 38.5 89.2 0.0
Family Structure at Age 14 (%)Mother and Father 83.8 77.5 82.7 85.4 75.1 80.7
Average Parental EducationMother's Education 10.6 10.7 10.6 10.4 10.8 10.5Father's Education 10.3 10.6 10.6 10.0 10.9 10.0
Black (%) 29.3 29.1 31.1 26.2 31.6 25.8Newspaper at Age 14 87.0 86.1 88.9 83.8 88.2 83.2Library Card at Age 14 70.2 72.0 74.3 63.8 77.3 64.8Father is an Immigrant 3.9 3.0 5.2 1.9 4.4 1.2Mother is an Immigrant 3.5 2.7 4.5 1.9 3.7 1.3Average Number of Siblings 3.4 3.6 3.3 3.5 3.6 3.7
Average Score on KWW Test (%)High School Drop-outs 50.4 57.0 51.3 * 48.8 58.2 * 54.9High School Graduates 55.3 70.2 55.7 54.7 70.5 70.0University Enrollees 61.8 79.1 62.4 60.8 80.0 78.1
Mean Years of Education 13.3 13.0 13.4 13.2 13.1 13.0
Distribution of Education Choices (%)High School Droup-outs 21.6 19.6 22.3 20.5 21.3 * 17.3High School Graduates 30.9 47.8 28.5 34.6 44.5 52.2University Enrollees 47.6 32.6 49.2 44.9 34.2 30.5
Sample Size 3203 2693 1972 1231 1563 1130
* In 1966 for men and 1968 women. Access (in the last 4 columns) is defined as the presence of a 2 or 4-yearpublic degree-granting institution. The raw difference between high school drop-out outcomes for labor marketswith and without university access are statistically significant at the 1% (***), 5% (**) and 10% (*) levels.

27
Table 2. Ordered Probit Estimates (Specification 2)
Men Women
Access Measure Public Public Public Public2 & 4-Year 4-Year 2 & 4-Year 4-Year 2 & 4-Year 4-Year 2 & 4-Year 4-Year
Father's Education 0.0634 0.0636 0.0632 0.0633 0.0634 0.0637 0.0634 0.0633
(0.0082) (0.0082) (0.0082) (0.0082) (0.0090) (0.0091) (0.0090) (0.0090)Mother's Education 0.0725 0.0723 0.0723 0.0725 0.0914 0.0911 0.0912 0.0915
(0.0095) (0.0095) (0.0095) (0.0095) (0.0104) (0.0104) (0.0104) (0.0104)Immigrant Father 0.3633 0.3578 0.3617 0.3579 0.5272 0.5254 0.5261 0.5262
(0.1306) (0.1307) (0.1306) (0.1307) (0.1521) (0.1519) (0.1520) (0.1521)Immigrant Mother 0.2977 0.3011 0.2947 0.2960 0.1923 0.1957 0.1918 0.1884
(0.1390) (0.1390) (0.1392) (0.1392) (0.1561) (0.1561) (0.1561) (0.1561)Black Indicator -0.0621 -0.0590 -0.0663 -0.0644 0.1091 0.1086 0.1052 0.1002
(0.0583) (0.0584) (0.0582) (0.0582) (0.0637) (0.0636) (0.0637) (0.0634)Number of Siblings -0.0275 -0.0272 -0.0277 -0.0273 -0.0258 -0.0265 -0.0264 -0.0261
(0.0090) (0.0090) (0.0090) (0.0090) (0.0099) (0.0099) (0.0099) (0.0099)Newspaper* 0.3404 0.3422 0.3411 0.3419 0.3185 0.3204 0.3156 0.3173
(0.0680) (0.0680) (0.0680) (0.0680) (0.0725) (0.0725) (0.0725) (0.0725)Library Card* 0.2387 0.2394 0.2348 0.2343 0.1307 0.1306 0.1285 0.1258
(0.0505) (0.0505) (0.0505) (0.0505) (0.0557) (0.0556) (0.0556) (0.0556)Mom and Dad* 0.1722 0.1746 0.1757 0.1757 0.1913 0.1906 0.1937 0.1951
(0.0674) (0.0674) (0.0675) (0.0675) (0.0788) (0.0789) (0.0788) (0.0788)City -0.2462 -0.2441 -0.2553 -0.2623 -0.1683 -0.1708 -0.1848 -0.2070
(0.0588) (0.0588) (0.0585) (0.0609) (0.0616) (0.0610) (0.0617) (0.0638)Suburb -0.0850 -0.0846 -0.0906 -0.0989 -0.0918 -0.0909 -0.0985 -0.1147
(0.0571) (0.0576) (0.0575) (0.0594) (0.0602) (0.0604) (0.0609) (0.0616)
Drop/Grad Cut Point
Kappa H 0.7892 0.8031 0.7677 0.7892 0.8229 0.8489 0.7559 0.8676(0.1520) (0.1509) (0.1564) (0.1534) (0.1687) (0.1680) (0.1748) (0.1712)
University Access 0.1248 0.1318 0.1142 0.1068 0.1851 0.1627 0.2127 0.0762(0.0592) (0.0575) (0.0715) (0.0641) (0.0650) (0.0630) (0.0774) (0.0681)
Grad/Univ Cut Point
Kappa U 1.8873 1.8793 1.9348 1.9287 2.4561 2.4330 2.5188 2.4915(0.1533) (0.1527) (0.1568) (0.1549) (0.1722) (0.1718) (0.1771) (0.1748)
University Access -0.0772 -0.0677 -0.1264 -0.1322 -0.0621 -0.0368 -0.1375 -0.1270(0.0525) (0.0514) (0.0632) (0.0576) (0.0586) (0.0576) (0.0686) (0.0626)
Log-Likelihood -3020 -3019 -3020 -3018 -2509 -2512 -2507 -2512N 3203 3203 3203 3203 2693 2693 2693 2693
* These variables are household attributes at age 14. All models also include Census Division of residence at age 14and missing parental education indicator variables. The standard errors are in parentheses.

28
Table 3. Predicted Educational Group Sizes
Men Women
Education Regions Regions Regions RegionsGroups Without Access With Access Without Access With Access
Access is defined as a public 2 or 4 year degree granting institution High School Drop-outs 18.5 ** 19.8 15.8 *** 18.5High School Graduates 34.2 28.3 51.5 45.0University Enrollees 47.3 51.9 32.7 36.5
Access is defined as a public 4 year degree granting institution
High School Drop-outs 18.9 ** 19.7 17.0 *** 17.8High School Graduates 33.8 27.5 50.3 44.9University Enrollees 47.3 52.8 32.7 37.3 Access is defined as a 2 or 4 year degree granting institution High School Drop-outs 18.0 19.6 14.0 *** 18.4High School Graduates 36.5 29.2 54.6 45.7University Enrollees 45.5 51.2 31.4 35.9
Access is defined as a 4 year degree granting institution
High School Drop-outs 18.6 * 19.6 17.2 17.5High School Graduates 35.9 28.3 51.6 45.8University Enrollees 45.5 52.1 31.2 36.7
The access measure in the drop-out/graduate cut point is statistically significant at the 1% (***), 5% (**) or 10% (*) level.

29
Table 4. Ordered Probit Estimates (Specification 2) – Robustness Checks
Men Women Men Women
1 2 3 1 1 2 3 1
Access: 2 or 4-Year Public Schools Access: 4-Year Public Schools
City -0.2407 -0.2129 -0.1769 -0.2436 -0.2157 -0.1803(0.0611) (0.0702) (0.0625) (0.0610) (0.0697) (0.0619)
Suburb -0.0740 -0.0483 -0.0985 -0.0772 -0.0514 -0.0980(0.0590) (0.0673) (0.0608) (0.0594) (0.0673) (0.0609)
Unemployment Rate -0.0001 0.0003 -0.0126 -0.0001 0.0003 -0.0147(0.0016) (0.0016) (0.0159) (0.0016) (0.0016) (0.0160)
Labor Demand Index 0.0022 0.0023(0.0028) (0.0029)
Labor Market Size -0.0001 -0.0001(0.0000) (0.0000)
Drop/Grad Cut PointKappa H 0.7782 0.8557 0.7413 0.7617 0.8031 0.8847 0.7782 0.7761
(0.1737) (0.1821) (0.1735) (0.1856) (0.1727) (0.1825) (0.1724) (0.1858)University Access 0.1406 0.1342 0.1549 0.1904 0.1289 0.1188 0.1237 0.1715
(0.0623) (0.0628) (0.0623) (0.0653) (0.0602) (0.0613) (0.0616) (0.0637)
Grad/Univ Cut PointKappa U 1.9248 2.0027 1.8934 2.3945 1.9177 1.9995 1.8949 2.3604
(0.1748) (0.1834) (0.1745) (0.1890) (0.1744) (0.1842) (0.1740) (0.1891)University Access -0.0887 -0.0955 -0.0853 -0.0559 -0.0859 -0.0963 -0.0984 -0.0279
(0.0542) (0.0547) (0.0549) (0.0591) (0.0530) (0.0543) (0.0550) (0.0585)
Log-Likelihood -2823 -2822 -2826 -2508 -2823 -2823 -2827 -2511N 3051 3051 3051 2693 3051 3051 3051 2693
Access: 2 or 4-Year Schools Access: 4-Year Schools
City -0.2558 -0.2218 -0.1933 -0.2701 -0.2339 -0.2131(0.0610) (0.0699) (0.0629) (0.0633) (0.0707) (0.0645)
Suburb -0.0840 -0.0530 -0.1049 -0.0984 -0.0649 -0.1194(0.0595) (0.0674) (0.0615) (0.0614) (0.0680) (0.0621)
Unemployment Rate -0.0001 0.0003 -0.0112 0.0000 0.0003 -0.0103(0.0016) (0.0016) (0.0158) (0.0016) (0.0016) (0.0159)
Labor Demand Index 0.0027 0.0033(0.0029) (0.0029)
Labor Market Size -0.0001 -0.0001(0.0000) (0.0000)
Drop/Grad Cut Point
Kappa H 0.7598 0.8575 0.7063 0.7010 0.8014 0.9156 0.7435 0.8151(0.1779) (0.1878) (0.1786) (0.1911) (0.1761) (0.1871) (0.1769) (0.1894)
University Access 0.1169 0.1062 0.1582 0.2156 0.0878 0.0698 0.1377 0.0823(0.0755) (0.0763) (0.0740) (0.0775) (0.0674) (0.0689) (0.0647) (0.0687)
Grad/Univ Cut Point
Kappa U 1.9857 2.0845 1.9401 2.4636 1.9794 2.0942 1.9259 2.4395(0.1778) (0.1884) (0.1783) (0.1933) (0.1771) (0.1885) (0.1777) (0.1923)
University Access -0.1576 -0.1693 -0.1280 -0.1342 -0.1624 -0.1809 -0.1212 -0.1215(0.0657) (0.0668) (0.0645) (0.0687) (0.0599) (0.0618) (0.0572) (0.0632)
Log-Likelihood -2822 -2822 -2827 -2507 -2821 -2821 -2826 -2512N 3051 3051 3051 2693 3051 3051 3051 2693
All models also include parental education, parental immigrant status, a black indicator, number of siblings, newspaper, library card, mom and dad present, and census division indicators (the variables used in all earlier specifications).The standard errors are in parentheses.

30
Table 5. Ordered Probit Estimates (Specification 2) – Including an Interaction between the Duncan Index and University Access
Men Women
Access Measure Public Public Public Public2 & 4-Year 4-Year 2 & 4-Year 4-Year 2 & 4-Year 4-Year 2 & 4-Year 4-Year
Duncan Index 0.0052 0.0054 0.0043 0.0044 0.0055 0.0056 0.0058 0.0047
(0.0014) (0.0014) (0.0018) (0.0016) (0.0015) (0.0014) (0.0018) (0.0017)Father's Education 0.0514 0.0517 0.0514 0.0515 0.0469 0.0474 0.0472 0.0477
(0.0090) (0.0090) (0.0089) (0.0089) (0.0100) (0.0100) (0.0100) (0.0100)Mother's Education 0.0661 0.0657 0.0661 0.0661 0.0874 0.0874 0.0868 0.0875
(0.0100) (0.0100) (0.0100) (0.0100) (0.0111) (0.0111) (0.0111) (0.0111)Immigrant Father 0.3023 0.2994 0.3046 0.3025 0.4799 0.4793 0.4879 0.4871
(0.1362) (0.1362) (0.1362) (0.1362) (0.1570) (0.1569) (0.1572) (0.1571)Immigrant Mother 0.3268 0.3294 0.3213 0.3216 0.1593 0.1593 0.1597 0.1563
(0.1448) (0.1448) (0.1450) (0.1451) (0.1622) (0.1622) (0.1622) (0.1622)Black Indicator -0.0418 -0.0384 -0.0457 -0.0448 0.1922 0.1937 0.1936 0.1928
(0.0629) (0.0630) (0.0628) (0.0629) (0.0701) (0.0701) (0.0700) (0.0699)Number of Siblings -0.0269 -0.0269 -0.0274 -0.0272 -0.0296 -0.0297 -0.0302 -0.0297
(0.0096) (0.0096) (0.0096) (0.0096) (0.0106) (0.0106) (0.0106) (0.0106)Newspaper* 0.3853 0.3855 0.3872 0.3879 0.2908 0.2890 0.2921 0.2907
(0.0742) (0.0742) (0.0742) (0.0742) (0.0785) (0.0785) (0.0785) (0.0785)Library Card* 0.2378 0.2379 0.2351 0.2345 0.1114 0.1111 0.1123 0.1125
(0.0534) (0.0534) (0.0534) (0.0534) (0.0596) (0.0595) (0.0596) (0.0595)Mom and Dad* 0.1259 0.1273 0.1299 0.1304 0.1777 0.1770 0.1787 0.1795
(0.0741) (0.0740) (0.0740) (0.0740) (0.0846) (0.0846) (0.0846) (0.0845)City -0.2489 -0.2460 -0.2577 -0.2608 -0.2081 -0.2100 -0.2069 -0.2273
(0.0607) (0.0606) (0.0605) (0.0617) (0.0634) (0.0631) (0.0639) (0.0649)Suburb -0.1357 -0.1339 -0.1400 -0.1446 -0.1234 -0.1256 -0.1190 -0.1352
(0.0598) (0.0600) (0.0598) (0.0607) (0.0630) (0.0632) (0.0634) (0.0637)
Drop/Grad Cut Point
Kappa H 0.7410 0.7508 0.7290 0.7394 0.7763 0.7986 0.7552 0.7899(0.1591) (0.1589) (0.1595) (0.1592) (0.1789) (0.1786) (0.1794) (0.1790)
Access*Duncan 0.0041 0.0044 0.0026 0.0027 0.0034 0.0026 0.0038 0.0013(0.0015) (0.0015) (0.0018) (0.0016) (0.0017) (0.0017) (0.0019) (0.0018)
Grad/Univ Cut Point
Kappa U 1.8289 1.8258 1.8307 1.8294 2.3620 2.3508 2.3783 2.3613(0.1608) (0.1607) (0.1610) (0.1609) (0.1822) (0.1819) (0.1824) (0.1821)
Access*Duncan -0.0015 -0.0012 -0.0023 -0.0023 -0.0024 -0.0020 -0.0020 -0.0029(0.0013) (0.0013) (0.0016) (0.0015) (0.0014) (0.0014) (0.0017) (0.0015)
Log-Likelihood -2729 -2729 -2732 -2731 -2263 -2266 -2263 -2266N 2937 2937 2937 2937 2438 2438 2438 2438
* These variables are household attributes at age 14. All models also include Census Division of residence at age 14and missing parental education indicator variables. The standard errors are in parentheses.

31
Table 6. Robustness Checks Including and Interaction between Socioeconomic Status and University Access
Men Women Men Women
1 2 3 1 1 2 3 1
Access: 2 or 4-Year Public Schools Access: 4-Year Public Schools
Drop/Grad Cut PointAccess*Duncan 0.0033 0.0031 0.0030 0.0035 0.0034 0.0031 0.0028 0.0028
(0.0016) (0.0016) (0.0016) (0.0017) (0.0016) (0.0016) (0.0016) (0.0017)
Log-Likelihood -2542 -2542 -2545 -2263 -2542 -2542 -2545 -2266N 2795 2795 2795 2438 2795 2795 2795 2438
Access: 2 or 4-Year Schools Access: 4-Year Schools
Drop/Grad Cut PointAccess*Duncan 0.0018 0.0015 0.0023 0.0040 0.0017 0.0012 0.0024 0.0015
(0.0019) (0.0019) (0.0019) (0.0019) (0.0018) (0.0018) (0.0017) (0.0018)
Log-Likelihood -2542 -2542 -2545 -2263 -2542 -2542 -2545 -2266N 2795 2795 2795 2438 2795 2795 2795 2438
Access: 2 or 4-Year Public Schools Access: 4-Year Public Schools
Drop/Grad Cut PointAccess*Father's Education 0.0132 0.0126 0.0138 0.0172 0.0126 0.0117 0.0113 0.0160
(0.0060) (0.0060) (0.0060) (0.0061) (0.0058) (0.0059) (0.0059) (0.0059)
Log-Likelihood -2828 -2828 -2828 -2506 -2828 -2828 -2826 -2509N 3051 3051 3051 2693 2795 2795 2795 2438
Access: 2 or 4-Year Schools Access: 4-Year Schools
Drop/Grad Cut PointAccess*Father's Education 0.0079 0.0068 0.0113 0.0228 0.0068 0.0051 0.0110 0.0109
(0.0071) (0.0072) (0.0069) (0.0071) (0.0064) (0.0066) (0.0062) (0.0064)
Log-Likelihood -2824 -2824 -2828 -2502 -2820 -2820 -2825 -2509N 3051 3051 3051 2693 2795 2795 2795 2438
All models also include parental education, parental immigrant status, a black indicator, number of siblings, newspaper,library card, mom and dad present, and census division indicators (the variables used in all earlier specifications).Column 1 includes the local unemployment rate, column 2 includes the labor demand index, and column 3 replacescity and suburb dummies with labor market size. The first two panels also include the Duncan index. The standarderrors are in parentheses.

32
Table 7. Mean Percentage Difference in KWW Scores between Labor Markets With and Without University Access
Men Women
High School High School University High School High School University Drop-outs Graduates Enrollees Drop-outs Graduates Enrollees
Access is defined as a public 2 or 4 year degree granting institution
Score Difference 0.8263 -0.6696 0.5790 2.0477 -0.9431 0.7929(1.1454) (0.8739) (0.6368) (2.2200) (1.0949) (1.1500)
N 680 973 1502 484 1248 863R2 0.3279 0.3039 0.3160 0.2935 0.3309 0.2364
Access is defined as a public 4 year degree granting institution
Score Difference 1.9063 * -0.1396 1.8490 2.1817 1.1707 1.0059(1.1030) (0.8626) (0.6260) (2.1017) (1.0842) (1.1307)
N 680 973 1502 484 1248 863R2 0.3304 0.3034 0.3197 0.2938 0.3312 0.2367
Access is defined as a 2 or 4 year degree granting institution
Score Difference 3.5835 *** -0.7480 -0.2494 -0.4250 -0.9450 1.9455(1.3891) (0.9711) (0.7914) (2.6726) (1.2002) (1.3796)
N 680 973 1502 484 1248 863R2 0.3341 0.3039 0.3157 0.2922 0.3309 0.2378
Access is defined as a 4 year degree granting institution
Score Difference 2.0691 * -0.8661 1.1022 1.1219 0.8995 0.3772(1.2587) (0.9202) (0.7246) (2.3139) (1.1580) (1.2555)
N 680 973 1502 484 1248 863R2 0.3301 0.3041 0.3167 0.2925 0.3308 0.2360
The difference between mean test scores across university access is significant at the 1% (***), 5% (**) or 10%(*) level. All models also include parental education, parental immigrant status, a black indicator, number of siblings, newspaper, library card, mom and dad present, and census division indicators (the variables used in all earlierspecifications) as well as age indicator variables.
Related Documents
![Polychronous Design of Real-Time Applications with Signalburns/papers/signal.pdf · Polychronous Design of Real-Time Applications with Signal ... Nowak [36] proposed a co-inductice](https://static.cupdf.com/doc/110x72/5b93d76309d3f219658ba0e6/polychronous-design-of-real-time-applications-with-signal-burnspapers-polychronous.jpg)