Human Breast Cancer Tumor Models: Molecular Imaging of Drug Susceptibility and Dosing during HER2/neu-targeted Therapy 1 Michael S. Gee, MD, PhD Rabi Upadhyay, BS Henry Bergquist, BS Herlen Alencar, MD Fred Reynolds, PhD Marco Maricevich, MD Ralph Weissleder, MD, PhD Lee Josephson, PhD Umar Mahmood, MD, PhD Purpose: To use near-infrared (NIR) optical imaging to assess the therapeutic susceptibility and drug dosing of orthotopic human breast cancers implanted in mice treated with mo- lecularly targeted therapy. Materials and Methods: This study was approved by the institutional animal care and use committee. Imaging probes were synthesized by conjugating the human epidermal growth factor receptor type 2 (HER2)-specific antibody trastuzumab with fluores- cent dyes. In vitro probe binding was assessed with flow cytometry. HER2-normal and HER2-overexpressing hu- man breast cancer cells were orthotopically implanted in nude mice. Intravital laser scanning fluorescence micros- copy was used to evaluate the in vivo association of the probe with the tumor cells. Mice bearing 3–5-mm-diame- ter tumors were intravenously injected with 0.4 nmol of HER2 probe before or after treatment. A total of 123 mice were used for all in vivo tumor growth and imaging exper- iments. Tumor fluorescence intensity was assessed, and standard fluorescence values were determined. Statistical significance was determined by performing standard anal- ysis of variance across the imaging cohorts. Results: HER2 probe enabled differentiation between HER2-nor- mal and HER2-overexpressing human breast cancer cells in vitro and in vivo, with binding levels correlating with tumor trastuzumab susceptibility. Serial imaging before and during trastuzumab therapy revealed a significant re- duction (P .05) in probe binding with treatment and thus provided early evidence of successful HER2 inhibition days before the overall reduction in tumor growth was appar- ent. Conclusion: NIR imaging with HER2-specific imaging probes enables evaluation of the therapeutic susceptibility of human mam- mary tumors and of drug dosing during HER2-targeted therapy with trastuzumab. This approach, combined with tomographic imaging techniques, has potential in the clin- ical setting for determining patient eligibility for and ade- quate drug dosing in molecularly targeted cancer thera- pies. RSNA, 2008 1 From the Center for Molecular Imaging Research, Mas- sachusetts General Hospital and Harvard Medical School, Simches 8226, 185 Cambridge St, Boston, MA 02114. Received August 22, 2007; revision requested October 10; revision received November 16; accepted December 28; final version accepted March 3, 2008. Supported by Susan G. Komen for the Cure and by NIH grants R01- EB001872, R01-EB004472, R24-CA92782, and P50-CA86355. Address correspondence to U.M. (e-mail: [email protected] ). RSNA, 2008 ORIGINAL RESEARCH MOLECULAR IMAGING Radiology: Volume 248: Number 3—September 2008 925 Note: This copy is for your personal, non-commercial use only. To order presentation-ready copies for distribution to your colleagues or clients, use the Radiology Reprints form at the end of this article.

Welcome message from author
This document is posted to help you gain knowledge. Please leave a comment to let me know what you think about it! Share it to your friends and learn new things together.
Transcript

Human Breast Cancer TumorModels: Molecular Imaging of DrugSusceptibility and Dosing duringHER2/neu-targeted Therapy1
Michael S. Gee, MD, PhDRabi Upadhyay, BSHenry Bergquist, BSHerlen Alencar, MDFred Reynolds, PhDMarco Maricevich, MDRalph Weissleder, MD, PhDLee Josephson, PhDUmar Mahmood, MD, PhD
Purpose: To use near-infrared (NIR) optical imaging to assess thetherapeutic susceptibility and drug dosing of orthotopichuman breast cancers implanted in mice treated with mo-lecularly targeted therapy.
Materials andMethods:
This study was approved by the institutional animal careand use committee. Imaging probes were synthesized byconjugating the human epidermal growth factor receptortype 2 (HER2)-specific antibody trastuzumab with fluores-cent dyes. In vitro probe binding was assessed with flowcytometry. HER2-normal and HER2-overexpressing hu-man breast cancer cells were orthotopically implanted innude mice. Intravital laser scanning fluorescence micros-copy was used to evaluate the in vivo association of theprobe with the tumor cells. Mice bearing 3–5-mm-diame-ter tumors were intravenously injected with 0.4 nmol ofHER2 probe before or after treatment. A total of 123 micewere used for all in vivo tumor growth and imaging exper-iments. Tumor fluorescence intensity was assessed, andstandard fluorescence values were determined. Statisticalsignificance was determined by performing standard anal-ysis of variance across the imaging cohorts.
Results: HER2 probe enabled differentiation between HER2-nor-mal and HER2-overexpressing human breast cancer cellsin vitro and in vivo, with binding levels correlating withtumor trastuzumab susceptibility. Serial imaging beforeand during trastuzumab therapy revealed a significant re-duction (P � .05) in probe binding with treatment and thusprovided early evidence of successful HER2 inhibition daysbefore the overall reduction in tumor growth was appar-ent.
Conclusion: NIR imaging with HER2-specific imaging probes enablesevaluation of the therapeutic susceptibility of human mam-mary tumors and of drug dosing during HER2-targetedtherapy with trastuzumab. This approach, combined withtomographic imaging techniques, has potential in the clin-ical setting for determining patient eligibility for and ade-quate drug dosing in molecularly targeted cancer thera-pies.
� RSNA, 2008
1 From the Center for Molecular Imaging Research, Mas-sachusetts General Hospital and Harvard Medical School,Simches 8226, 185 Cambridge St, Boston, MA 02114.Received August 22, 2007; revision requested October10; revision received November 16; accepted December28; final version accepted March 3, 2008. Supported bySusan G. Komen for the Cure and by NIH grants R01-EB001872, R01-EB004472, R24-CA92782, andP50-CA86355. Address correspondence to U.M. (e-mail:[email protected] ).
� RSNA, 2008
ORIGINALRESEARCH
�M
OLECULARIM
AGING
Radiology: Volume 248: Number 3—September 2008 925
Note: This copy is for your personal, non-commercial use only. To order presentation-ready copies for distribution to your colleagues or clients, use the Radiology Reprints form at the end of this article.
Noninvasive methods of measuringtumor physiologic parameters onthe molecular level are being de-
veloped (1). Such molecular imagingtechnology is becoming increasingly im-portant as new cancer therapeuticagents more specifically target tumorcell signaling pathways, with the goal ofincreasing tumor response while mini-mizing systemic toxicity (2).
The introduction of these agentsinto clinical practice is generating newprognostic and diagnostic questions thatmolecular imaging has the potential toaddress. Pretherapy imaging, by en-abling physicians to determine the tu-mor expression profile of particularmolecules, could be used to identify pa-tients who are likely to benefit from tar-geted therapies. During the course oftreatment, imaging could also facilitateearly assessment of therapeutic targetinhibition before alterations in tumorsize become apparent. This would expe-dite the dosing process by ensuring thateach patient received the optimal dosethat inhibits the molecular target whileminimizing side effects, and given the
tremendous expense associated withthese agents, this protocol would alsobe of substantial financial benefit to pa-tients (3,4). The ability to assess molec-ular target inhibition independently oftumor response is important for theseagents because molecular inhibition isthe primary endpoint of therapeutic ef-ficacy, while control of tumor growth isa secondary therapeutic consequence.Such imaging ensures that the lack oftumor response observed during treat-ment represents true therapy failure(ie, lack of tumor response despite ade-quate target inhibition) and not inade-quate drug delivery.
Among the different technologiesbeing used to image molecular events,near-infrared (NIR) fluorescence opti-cal imaging is particularly promising(4). NIR light (650–900 nm) can pen-etrate to a depth of up to 5–10 cm intissue owing to the low photon absorp-tion by water and hemoglobin in thisspectral range (5,6); thus, it enablesimaging of tumors within tissue suchas breast tissue. This technology isreadily applicable to human breast tu-mor evaluation because diffuse opticaltomography and spectroscopy withNIR light are currently being evaluatedin clinical studies to distinguish benignfrom malignant breast lesions and fol-low tumor response to chemother-apy (7–9).
We chose to investigate humanepidermal growth factor receptor type2 (HER2)/neu-targeted therapy withthe monoclonal antibody trastuzumab(Herceptin; Genentech, San Fran-cisco, Calif) in human breast cancer.HER2/neu is a tyrosine kinase recep-tor that is overexpressed in 20%–25%of invasive human breast cancers, andtumor cell levels of HER2/neu expres-sion are associated with increased bi-ological aggressiveness and a worseclinical prognosis (10,11). Trastuzumab is ahumanized monoclonal antibody target-ing the HER2/neu extracellular domainand has been approved for treatment ofpatients with HER2/neu-overexpressingbreast cancers (12). The purpose of ourstudy was to use NIR fluorescence opti-cal imaging to assess the therapeuticsusceptibility and drug dosing of ortho-
topic human breast cancers implantedin mice treated with molecularly tar-geted therapy.
Materials and Methods
This study was performed according toa protocol approved by the institutionalanimal care and use committee and wascompliant with National Institutes ofHealth guidelines for the care of labora-tory animals.
Optical Probe GenerationAn optical imaging probe for detectingHER2 was generated (F.R., L.J.) bymeans of covalent modification of thehumanized anti-HER2/neu antibodytrastuzumab with the NIR dye cyanine5.5 (Cy5.5; Invitrogen, Carlsbad,Calif), followed by purification over aSephadex G50 column (Amersham,Piscataway, NJ). Dye concentrationwas measured spectrophotometri-cally, whereas total probe concentra-tion was determined by using thebicinchoninic acid method (Bio-Rad,Hercules, Calif). Multiple probes weresynthesized with molar ratios of fluo-rochrome to antibody ranging from0.5:1 to 2.0:1 and were tested for af-finity for binding to HER2/neu-overex-pressing SKBR-3 tumor cells. For se-rial imaging of HER2 inhibition, a sec-ond optical probe was generated bycombining trastuzumab with AF750(Invitrogen), an NIR dye with an exci-
Published online before print10.1148/radiol.2482071496
Radiology 2008; 248:925–935
Abbreviations:HER2 � human epidermal growth factor receptor type 2NIR � near infrared
Author contributions:Guarantors of integrity of entire study, M.S.G., U.M.; studyconcepts/study design or data acquisition or data analy-sis/interpretation, all authors; manuscript drafting ormanuscript revision for important intellectual content, allauthors; manuscript final version approval, all authors;literature research, M.S.G., R.U., R.W., L.J., U.M.; experi-mental studies, M.S.G., R.U., H.B., H.A., F.R., M.M.; sta-tistical analysis, M.S.G., R.U., H.B., U.M.; and manuscriptediting, M.S.G., R.U., H.B., R.W., L.J., U.M.
Authors stated no financial relationship to disclose.
Advances in Knowledge
� A synthesized near-infrared (NIR)fluorescence imaging probe spe-cific for human epidermal growthfactor receptor type 2 (HER2)/neu was used to distinguishHER2-normal from HER2-overex-pressing human breast tumorsin vitro and in vivo. Probe-bindinglevels were associated with sus-ceptibility to molecular therapywith the HER2/neu-targetedmonoclonal antibody trastu-zumab.
� Serial imaging of HER2-overex-pressing human breast tumorsbefore and after therapeutic ad-ministration of trastuzumab re-vealed a significant decrease (P �.05) in HER2 probe binding aftertreatment, reflecting therapeuticHER2 inhibition. HER2 imagingperformed within the first 48hours after therapy initiation canbe used to predict subsequent tu-mor response to treatment.
MOLECULAR IMAGING: Imaging of Breast Cancer during HER2/neu-targeted Therapy Gee et al
926 Radiology: Volume 248: Number 3—September 2008
tation and emission spectrum distinctfrom cyanine 5.5, to ensure that anyresidual fluorescence from the cyanine5.5 probe administered before treat-ment would not contribute to the flu-orescent signal at posttreatment imag-ing. Compared with the cyanine 5.5-labeled probe, the AF750-conjugatedHER2 probe demonstrated compara-ble affinity for binding to HER2/neureceptor (10 nmol/L) and comparablein vivo half-life in blood (36 hours).
Determination of Probe Binding toHER2/neuProbe binding to HER2/neu was as-sessed (M.S.G., R.U., and H.B.) byusing a modified version of a previ-ously established flow cytometricbinding assay (13). Briefly, 106
SKBR-3 cells were incubated in sus-pension with various concentrations ofcyanine 5.5– or AF750-conjugated trastu-zumab for 15 minutes at 37°C in atotal volume of 150 �L and thenwashed twice in Hanks balanced saltsolution. Fluorescence intensity wasassessed with flow cytometry (Facs-Calibur; Becton Dickinson, FranklinLakes, NJ). For competitive inhibitionof probe binding, 5 nmol/L labeledprobe, along with different concentra-tions (0 –500 nmol/L) of unlabeledtrastuzumab, was added to theSKBR-3 cells by using the same incu-bation and washing conditions; flowcytometric analysis was then per-formed. As a control for nonspecificcompetition, purified whole humanimmunoglobulin G (Jackson Immu-noresearch, West Grove, Pa) was alsotested at equivalent molar concentra-tions. Fluorescence microscopy (with anOlympus microscope; Olympus, CenterValley, Pa) of probe-stained tumor cellswas also performed for visual confirma-tion of membrane localization. All ex-periments were carried out in triplicate,and the mean values calculated for thethree experiments were plotted to forma saturation binding curve. The dissoci-ation constant (KD) was determinedfrom the saturation binding plot by us-ing computer software (GraphPadPrism; GraphPad Software, San Diego,Calif).
Cell Lines and MiceWe used human cancer cells with vary-ing levels of HER2 expression, includingthe 9L glioma line, which does not ex-press HER2/neu; the MCF-7 breast can-cer line, which expresses normal mam-mary HER2/neu levels (single copy ofthe HER2/neu locus); and the BT-474and SKBR-3 breast cancer lines, whichoverexpress HER2/neu (four- to eight-fold gene amplification) (12,14,15). The9L human glioma cell line was main-tained in Dulbecco’s modified Eagle’smedium–F12 medium supplemented with10% fetal bovine serum and penicillin-streptomycin (ie, complete Dulbecco’smodified Eagle’s medium–F12 me-dium). The BT-474 human mammarycarcinoma cell line was maintained incomplete Dulbecco’s modified Eagle’smedium–F12 medium supplementedwith human insulin (3.6 � 10�3 mg/mL). The MCF-7 and SKBR-3 humanmammary carcinoma cell lines weremaintained in complete McCoy me-dium. For intravital laser scanning mi-croscopy with dorsal window cham-bers, the tumor cell lines were stablytransfected (R.U., H.B.) with an expres-sion vector encoding green fluorescentprotein (pAcGFP-N1; Clontech, Moun-tain View, Calif) by using a transfectionreagent (SuperFect; Qiagen, Valencia,Calif) according to the manufacturer’sprotocol. Female C57BL/6 nude micewere purchased from Jackson Labora-tories (Bar Harbor, Me). The mice werehoused and maintained under asepticconditions according to guidelines setby the institutional animal care and usecommittee. A total of 123 mice wereused for all animal experiments.
Determination of HER2 Probe in VivoPlasma Half-lifeThe imaging dose (0.4 nmol) of AF750-conjugated probe was intravenously ad-ministered to the mice. Plasma sampleswere obtained from the mice (H.B.,R.U.) at multiple time points (6, 24, 48,72, and 96 hours) after probe adminis-tration. Whole blood samples were cen-trifuged in capillary tubes. Plasma wassubsequently analyzed with an NIR fluo-rimeter at 694 nm to measure cyanine5.5 fluorescence or at 779 nm to measure
AF750 fluorescence. A total of eightmice were used for these plasma half-life measurements.
Multichannel Intravital Laser ScanningFluorescence MicroscopyTumor cells were implanted in dorsalskin fold window chambers by a sur-geon (M.M.) according to a previouslydescribed protocol (16). A custom-made aluminum saddle was used tobracket each chamber. For each cham-ber, (2.5–5.0) � 106 tumor cells wereimplanted in a total volume of 20 �L ofbuffered saline. One chamber was im-planted in each mouse. Seven to 10 daysafter implantation, intravital laser scan-ning fluorescence microscopy was per-formed (H.B., R.U.) by using a minia-turized four-laser scanning microscopysystem optimized for visible and NIRimaging, as previously described (17).Excitation laser and band-pass filter set-tings were optimized for green fluores-cent protein (excitation at 488 nm,emission at 509 nm), cyanine 5.5 (exci-tation at 675 nm, emission at 694 nm),and AF750 (excitation at 752 nm, emis-sion at 779 nm) excitation and emission.HER2 probe was administered intrave-nously and imaged according to the pro-tocol described earlier for imaging or-thotopic tumors. All image stacks wereacquired by using identical laser power,window, and level settings. All imageswere recorded and stored as propri-etary multilayer 16-bit tagged image fileformat files. Five window chamberswere imaged per tumor type (BT-474,SKBR-3, MCF-7, and 9L) by using onechamber per mouse (n � 20).
In Vivo Tumor ExperimentsFor tumor implantation, tumor cells inculture were detached by using a pro-tease-free phosphate-buffered saline–edetic acid solution (Versene; Invitro-gen). The tumor cells were mixed with100 �L of a gelatinous protein mixturesecreted by mouse tumor cells (Matri-gel; Becton Dickinson) and then im-planted orthotopically into the mam-mary glands of female C57BL/6 nudemice (Jackson Laboratories) by a sur-geon (M.M.). Totals of 10 � 106 BT-474,SKBR-3, and MCF-7 cells and 106 9L
MOLECULAR IMAGING: Imaging of Breast Cancer during HER2/neu-targeted Therapy Gee et al
Radiology: Volume 248: Number 3—September 2008 927
cells were implanted in each tumor. Forthe mice bearing BT-474 or MCF-7 tu-mors, a 0.72-mg (60-day release) 17�-estradiol pellet (Innovative Research,Sarasota, Fla) was implanted subcuta-neously at the time of tumor cell inocu-lation (18). The tumors were measuredbidirectionally (M.S.G.) twice per weekby using calipers, and tumor size wascalculated by approximating the volumeof a spheroid (0.52 � W2 � L), where W2
is the square width and L is the length.Five untreated and five trastuzumab-treated tumors were measured in eachtumor group (forty mice total). Trastu-zumab therapy consisted of intraperito-neal administration of 100 mg of trastu-zumab per kilogram of body weight di-luted in sterile saline (2 mg [15 nmol]per dose) every 7 days, starting whenthe tumors reached 50–100 mm3. Themice with untreated tumors received in-traperitoneal injections of saline solu-tion according to the same schedule.Ten additional mice bearing BT-474 tu-mors were also treated with an interme-diate dose of trastuzumab (5 mg/kg).The treated tumors were followed upfor 14 days after the initiation of trastu-zumab therapy.
Whole-Animal NIR Fluorescence ImagingHER2 imaging was performed 0, 6, 24,and 48 hours (R.U. and H.B.) after theintravenous administration of 0.4 nmolof HER2 probe (five mice per tumortype, 20 mice total). Peak probe uptakein the HER2-overexpressing tumors oc-curred 48 hours after injection, and thistime point was used for all subsequentexperiments. Whole-animal epifluores-cence imaging was performed as de-scribed previously (19) by using a mul-tichannel whole-animal optical imagingsystem (BonSAI; Siemens Medical Solu-tions, Malvern, Pa) optimized for cya-nine 5.5 and AF750 excitation and emis-sion wavelengths. Imaging times were0.3 second for all cyanine 5.5 imagingexaminations and 1.1 seconds for allAF750 imaging examinations. Quantita-tive measurements (R.U., H.B.) on theacquired epifluorescent images were per-formed by using a circular, roughly2000-pixel region of interest placedover each xenograft (approximately
0.25 mm2 covering most of the tumor)and were reported by using image anal-ysis software (Syngo; Siemens MedicalSolutions). For serial probe imaging be-fore and after trastuzumab treatment,the cyanine 5.5–conjugated probe wasused for pretreatment imaging while theAF750-conjugated probe was injected16 hours after trastuzumab injectionand was used for posttreatment imaging(five mice per tumor type, 20 mice to-tal). Standardized fluorescence valueswere calculated by dividing the fluores-cence within the tumor region of inter-est by the fluorescence within an identi-cal-size region of interest placed on theskin of one of the hind legs. Five addi-tional mice were used to image BT-474tumors that were treated with an inter-mediate (5 mg/kg) trastuzumab dose.
Statistical AnalysisData are presented as means � stan-dard errors of the mean. Statistical sig-nificance was assessed (R.U.) by usingstandard repeated-measures analysis ofvariance to compare mean fluorescencevalues of HER2 probe binding in vivo.The Student t test was used to comparethe mean fluorescence intensities ofHER2 probe binding to cell lines withflow cytometry in vitro. A statisticalsoftware package (Octave Software,Madison, Wis) was used for data analy-sis. P � .05 was considered to indicate asignificant difference.
Results
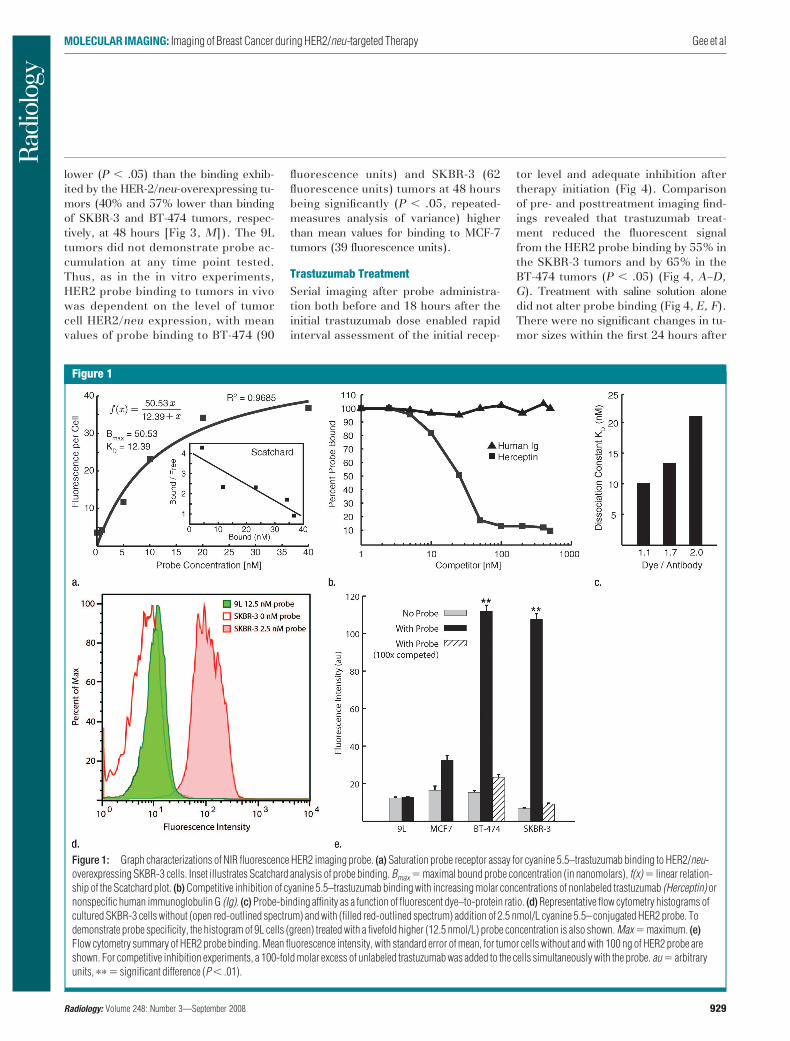
Probe Binding to HER2/neuThe HER2 probe demonstrated high-af-finity saturable HER2/neu binding, witha KD of 12.4 nmol/L (Fig 1a). At compe-tition receptor-binding assay, nonla-beled trastuzumab competed specifi-cally with the HER2 probe for binding tothe SKBR-3 cells, while nonspecific hu-man immunoglobulin G did not (Fig 1b).An initial molecular ratio of fluoro-chrome to antibody of 1.1 was chosenon the basis of findings in prior studiesof other fluorescently labeled proteins(20). We synthesized other variationsof the probe with increased fluoro-chrome-to-antibody ratios; however, these
probes were not used owing to de-creased binding affinity (Fig 1c). Aprobe containing a lower dye-to-anti-body ratio (0.5) was also rejected, be-cause although it maintained high bind-ing affinity, it had reduced fluorescenceintensity (data not shown).
The HER2 probe demonstrated agreater than 10-fold increase in bindingto BT-474 and SKBR-3 cells comparedwith its binding to 9L cells, as measuredaccording to fluorescence intensity (P �.005, Student t test) (Fig 1d, 1e), withbinding reaching a plateau at probe con-centrations greater than 20 nmol/L.Probe binding to the SKBR-3 and BT-474 cells was 3.3 and 3.4 times higher,respectively, than that to the HER2/neu-normal MCF-7 cells, consistentwith the four- to eightfold gene amplifi-cation exhibited by these cells. Probebinding was competitively inhibited bythe addition of a 100-fold molar excessof unlabeled trastuzumab (Fig 1e). Fluo-rescence microscopy findings confirmedthe increased probe binding to HER2/neu-overexpressing cell lines and dem-onstrated probe localization to the cellmembrane (data not shown).
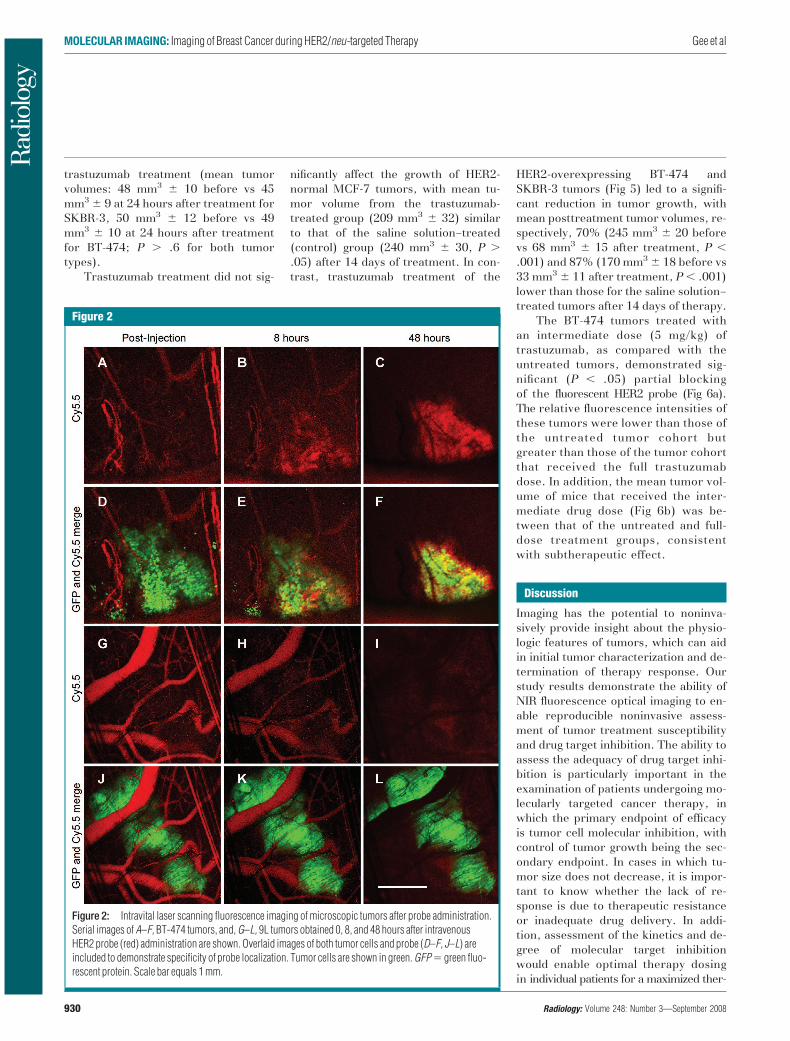
The probe intravenously adminis-tered in microscopic tumors implantedinto the dorsal window chambers ini-tially was confined to the blood pool(Fig 2, D, J). In the HER2-overexpress-ing tumors, serial imaging revealed agradual loss of probe signal in the circu-lation accompanied by progressiveprobe accumulation around the tumorcells. By 48 hours, detectable probe waslocalized exclusively around the tumorcells (Fig 2, C, F). In contrast, the probeinjected into the mice with 9L tumorsleft the circulation without marked tu-mor cell localization or accumulation(Fig 2, I, L). Serial quantitation ofplasma fluorochrome levels after probeadministration in the normal mice dem-onstrated an in vivo plasma half-life of37 hours.
Serial tumor imaging in vivo (Fig 3) re-vealed progressive HER2 probe accumu-lation in the BT-474 and SKBR-3 tumors,which was maximal at 48 hours afterprobe injection (Fig 3, C, F). The MCF-7tumors exhibited an intermediate level ofprobe binding, which was significantly
MOLECULAR IMAGING: Imaging of Breast Cancer during HER2/neu-targeted Therapy Gee et al
928 Radiology: Volume 248: Number 3—September 2008
lower (P � .05) than the binding exhib-ited by the HER-2/neu-overexpressing tu-mors (40% and 57% lower than bindingof SKBR-3 and BT-474 tumors, respec-tively, at 48 hours [Fig 3, M]). The 9Ltumors did not demonstrate probe ac-cumulation at any time point tested.Thus, as in the in vitro experiments,HER2 probe binding to tumors in vivowas dependent on the level of tumorcell HER2/neu expression, with meanvalues of probe binding to BT-474 (90
fluorescence units) and SKBR-3 (62fluorescence units) tumors at 48 hoursbeing significantly (P � .05, repeated-measures analysis of variance) higherthan mean values for binding to MCF-7tumors (39 fluorescence units).
Trastuzumab TreatmentSerial imaging after probe administra-tion both before and 18 hours after theinitial trastuzumab dose enabled rapidinterval assessment of the initial recep-
tor level and adequate inhibition aftertherapy initiation (Fig 4). Comparisonof pre- and posttreatment imaging find-ings revealed that trastuzumab treat-ment reduced the fluorescent signalfrom the HER2 probe binding by 55% inthe SKBR-3 tumors and by 65% in theBT-474 tumors (P � .05) (Fig 4, A–D,G). Treatment with saline solution alonedid not alter probe binding (Fig 4, E, F).There were no significant changes in tu-mor sizes within the first 24 hours after
Figure 1
Figure 1: Graph characterizations of NIR fluorescence HER2 imaging probe. (a) Saturation probe receptor assay for cyanine 5.5–trastuzumab binding to HER2/neu-overexpressing SKBR-3 cells. Inset illustrates Scatchard analysis of probe binding. Bmax � maximal bound probe concentration (in nanomolars), f(x) � linear relation-ship of the Scatchard plot. (b) Competitive inhibition of cyanine 5.5–trastuzumab binding with increasing molar concentrations of nonlabeled trastuzumab (Herceptin) ornonspecific human immunoglobulin G (Ig). (c) Probe-binding affinity as a function of fluorescent dye–to-protein ratio. (d) Representative flow cytometry histograms ofcultured SKBR-3 cells without (open red-outlined spectrum) and with (filled red-outlined spectrum) addition of 2.5 nmol/L cyanine 5.5– conjugated HER2 probe. Todemonstrate probe specificity, the histogram of 9L cells (green) treated with a fivefold higher (12.5 nmol/L) probe concentration is also shown. Max � maximum. (e)Flow cytometry summary of HER2 probe binding. Mean fluorescence intensity, with standard error of mean, for tumor cells without and with 100 ng of HER2 probe areshown. For competitive inhibition experiments, a 100-fold molar excess of unlabeled trastuzumab was added to the cells simultaneously with the probe. au � arbitraryunits, �� � significant difference (P � .01).
MOLECULAR IMAGING: Imaging of Breast Cancer during HER2/neu-targeted Therapy Gee et al
Radiology: Volume 248: Number 3—September 2008 929
trastuzumab treatment (mean tumorvolumes: 48 mm3 � 10 before vs 45mm3 � 9 at 24 hours after treatment forSKBR-3, 50 mm3 � 12 before vs 49mm3 � 10 at 24 hours after treatmentfor BT-474; P � .6 for both tumortypes).
Trastuzumab treatment did not sig-
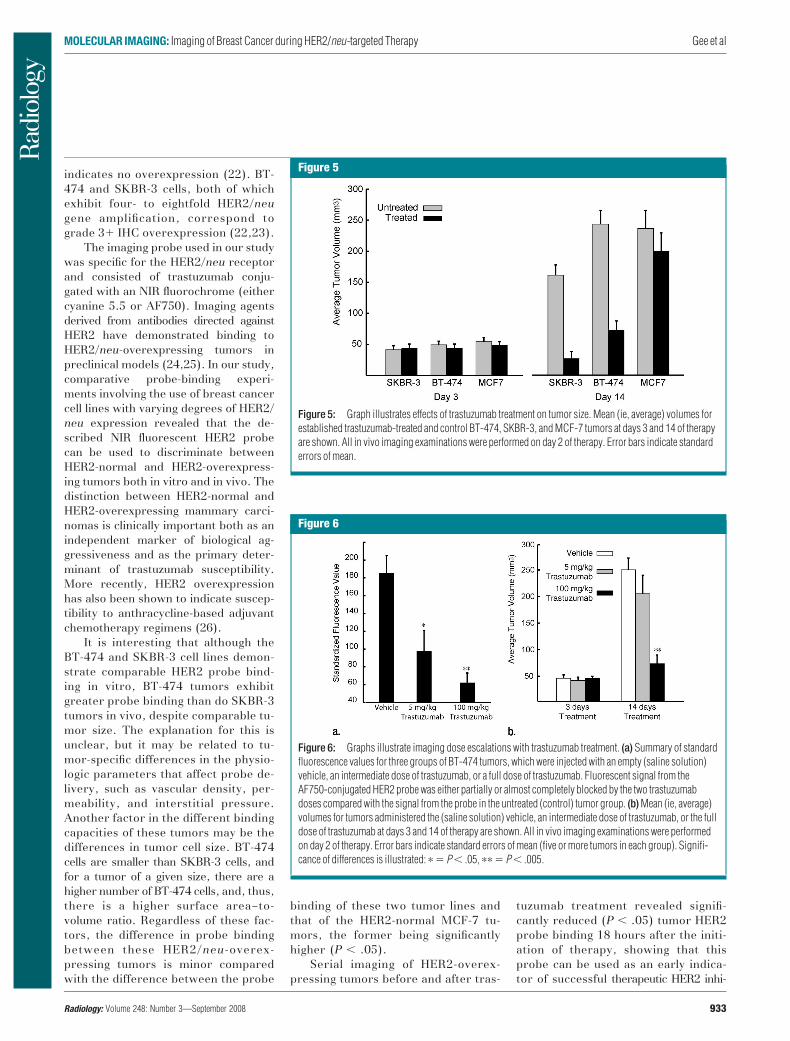
nificantly affect the growth of HER2-normal MCF-7 tumors, with mean tu-mor volume from the trastuzumab-treated group (209 mm3 � 32) similarto that of the saline solution–treated(control) group (240 mm3 � 30, P �.05) after 14 days of treatment. In con-trast, trastuzumab treatment of the
HER2-overexpressing BT-474 andSKBR-3 tumors (Fig 5) led to a signifi-cant reduction in tumor growth, withmean posttreatment tumor volumes, re-spectively, 70% (245 mm3 � 20 beforevs 68 mm3 � 15 after treatment, P �.001) and 87% (170 mm3 � 18 before vs33 mm3 � 11 after treatment, P � .001)lower than those for the saline solution–treated tumors after 14 days of therapy.
The BT-474 tumors treated withan intermediate dose (5 mg/kg) oftrastuzumab, as compared with theuntreated tumors, demonstrated sig-nificant (P � .05) partial blockingof the fluorescent HER2 probe (Fig 6a).The relative fluorescence intensities ofthese tumors were lower than those ofthe untreated tumor cohort butgreater than those of the tumor cohortthat received the full trastuzumabdose. In addition, the mean tumor vol-ume of mice that received the inter-mediate drug dose (Fig 6b) was be-tween that of the untreated and full-dose treatment groups, consistentwith subtherapeutic effect.
Discussion
Imaging has the potential to noninva-sively provide insight about the physio-logic features of tumors, which can aidin initial tumor characterization and de-termination of therapy response. Ourstudy results demonstrate the ability ofNIR fluorescence optical imaging to en-able reproducible noninvasive assess-ment of tumor treatment susceptibilityand drug target inhibition. The ability toassess the adequacy of drug target inhi-bition is particularly important in theexamination of patients undergoing mo-lecularly targeted cancer therapy, inwhich the primary endpoint of efficacyis tumor cell molecular inhibition, withcontrol of tumor growth being the sec-ondary endpoint. In cases in which tu-mor size does not decrease, it is impor-tant to know whether the lack of re-sponse is due to therapeutic resistanceor inadequate drug delivery. In addi-tion, assessment of the kinetics and de-gree of molecular target inhibitionwould enable optimal therapy dosingin individual patients for a maximized ther-
Figure 2
Figure 2: Intravital laser scanning fluorescence imaging of microscopic tumors after probe administration.Serial images of A–F, BT-474 tumors, and, G–L, 9L tumors obtained 0, 8, and 48 hours after intravenousHER2 probe (red) administration are shown. Overlaid images of both tumor cells and probe (D–F, J–L) areincluded to demonstrate specificity of probe localization. Tumor cells are shown in green. GFP � green fluo-rescent protein. Scale bar equals 1 mm.
MOLECULAR IMAGING: Imaging of Breast Cancer during HER2/neu-targeted Therapy Gee et al
930 Radiology: Volume 248: Number 3—September 2008
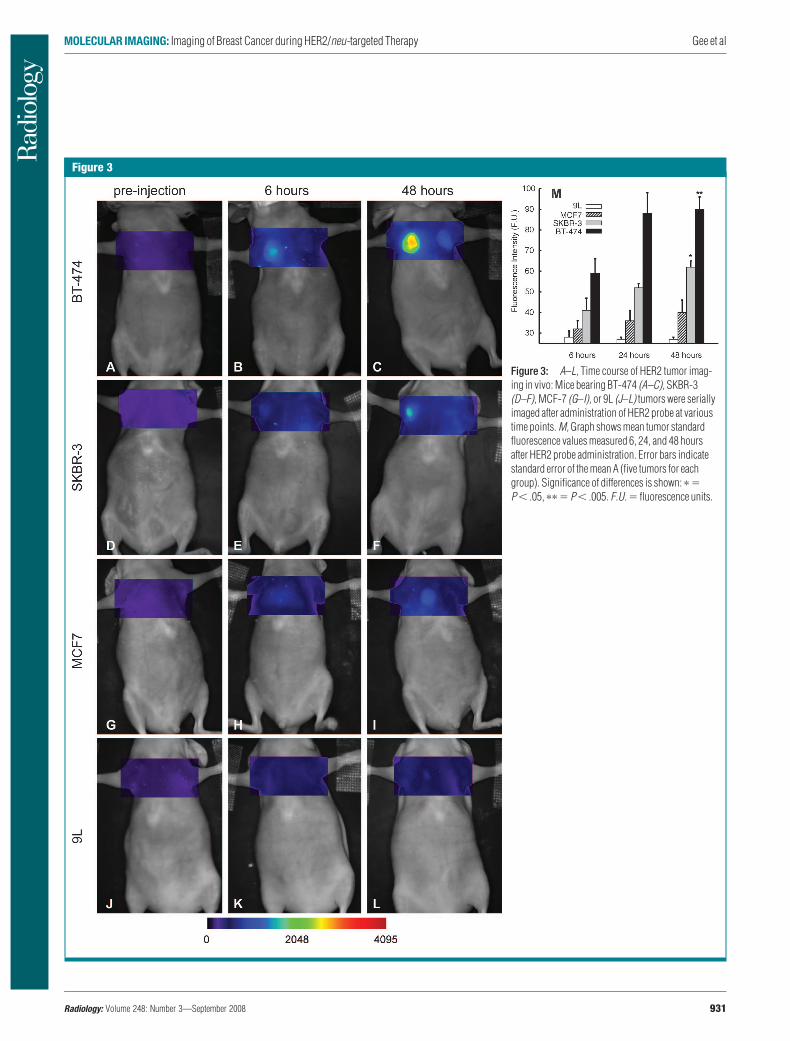
Figure 3
Figure 3: A–L, Time course of HER2 tumor imag-ing in vivo: Mice bearing BT-474 (A–C), SKBR-3(D–F), MCF-7 (G–I), or 9L (J–L) tumors were seriallyimaged after administration of HER2 probe at varioustime points. M, Graph shows mean tumor standardfluorescence values measured 6, 24, and 48 hoursafter HER2 probe administration. Error bars indicatestandard error of the mean A (five tumors for eachgroup). Significance of differences is shown: � �P � .05, �� � P � .005. F.U. � fluorescence units.
MOLECULAR IMAGING: Imaging of Breast Cancer during HER2/neu-targeted Therapy Gee et al
Radiology: Volume 248: Number 3—September 2008 931

apeutic effect while minimizing drug tox-icity. Heretofore, treatment effective-ness has been determined according tothe decrease in overall tumor size orchanges in the architecture or cell mor-phology of the tumor at histologic analy-sis of excised tumor tissue (21). Theimaging methods used in our study pro-vide multiple advantages, including theability to promptly demonstrate thera-peutic efficacy (or the lack thereof) andthe opportunity for serial determination
of target dose levels in patients receiv-ing increasing drug doses.
We investigated whether molecu-lar imaging could be used to accuratelyassess HER2/neu-targeted therapy ofhuman mammary carcinomas withtrastuzumab. This was the ideal ther-apy model to study because of thewidespread clinical use of trastu-zumab in the treatment of patientswith HER2/neu-overexpressing breastcancers. An additional advantage was
the availability of human breast cancercell lines with known levels of HER2expression that correlated with trastu-zumab susceptibility. In fact, all threecell lines used in our study have beenused as controls to standardize the im-munohistochemical (IHC) assay forHER2 expression in excised biopsy tis-sue. The MCF-7 cell line, which exhib-its normal mammary HER2/neu levels(single copy of the HER2/neu locus),corresponds to IHC grade 0, which
Figure 4
Figure 4: Fluorescence imaging of tumor target inhibi-tion during trastuzumab therapy. A–F, Serial images ofrepresentative HER2-overexpressing BT-474 and SKBR-3tumors before (A and C) and 18 hours after (B and D) tras-tuzumab treatment with cyanine 5.5– and AF750-conju-gated HER2 probes according to the schedule outlined inthe timeline (top left), E, F, Images of vehicle (saline solu-tion)-treated BT-474 tumor are shown for comparison. G,Graph summarizes standard fluorescence values forSKBR-3 and BT-474 tumors measured before and aftertrastuzumab treatment. Error bars indicate standard errorsof mean. F. U. � fluorescence units, � � significant dif-ference (P � .05).
MOLECULAR IMAGING: Imaging of Breast Cancer during HER2/neu-targeted Therapy Gee et al
932 Radiology: Volume 248: Number 3—September 2008
indicates no overexpression (22). BT-474 and SKBR-3 cells, both of whichexhibit four- to eightfold HER2/neugene amplification, correspond tograde 3 IHC overexpression (22,23).
The imaging probe used in our studywas specific for the HER2/neu receptorand consisted of trastuzumab conju-gated with an NIR fluorochrome (eithercyanine 5.5 or AF750). Imaging agentsderived from antibodies directed againstHER2 have demonstrated binding toHER2/neu-overexpressing tumors inpreclinical models (24,25). In our study,comparative probe-binding experi-ments involving the use of breast cancercell lines with varying degrees of HER2/neu expression revealed that the de-scribed NIR fluorescent HER2 probecan be used to discriminate betweenHER2-normal and HER2-overexpress-ing tumors both in vitro and in vivo. Thedistinction between HER2-normal andHER2-overexpressing mammary carci-nomas is clinically important both as anindependent marker of biological ag-gressiveness and as the primary deter-minant of trastuzumab susceptibility.More recently, HER2 overexpressionhas also been shown to indicate suscep-tibility to anthracycline-based adjuvantchemotherapy regimens (26).
It is interesting that although theBT-474 and SKBR-3 cell lines demon-strate comparable HER2 probe bind-ing in vitro, BT-474 tumors exhibitgreater probe binding than do SKBR-3tumors in vivo, despite comparable tu-mor size. The explanation for this isunclear, but it may be related to tu-mor-specific differences in the physio-logic parameters that affect probe de-livery, such as vascular density, per-meability, and interstitial pressure.Another factor in the different bindingcapacities of these tumors may be thedifferences in tumor cell size. BT-474cells are smaller than SKBR-3 cells, andfor a tumor of a given size, there are ahigher number of BT-474 cells, and, thus,there is a higher surface area–to-volume ratio. Regardless of these fac-tors, the difference in probe bindingbetween these HER2/neu-overex-pressing tumors is minor comparedwith the difference between the probe
binding of these two tumor lines andthat of the HER2-normal MCF-7 tu-mors, the former being significantlyhigher (P � .05).
Serial imaging of HER2-overex-pressing tumors before and after tras-
tuzumab treatment revealed signifi-cantly reduced (P � .05) tumor HER2probe binding 18 hours after the initi-ation of therapy, showing that thisprobe can be used as an early indica-tor of successful therapeutic HER2 inhi-
Figure 5
Figure 5: Graph illustrates effects of trastuzumab treatment on tumor size. Mean (ie, average) volumes forestablished trastuzumab-treated and control BT-474, SKBR-3, and MCF-7 tumors at days 3 and 14 of therapyare shown. All in vivo imaging examinations were performed on day 2 of therapy. Error bars indicate standarderrors of mean.
Figure 6
Figure 6: Graphs illustrate imaging dose escalations with trastuzumab treatment. (a) Summary of standardfluorescence values for three groups of BT-474 tumors, which were injected with an empty (saline solution)vehicle, an intermediate dose of trastuzumab, or a full dose of trastuzumab. Fluorescent signal from theAF750-conjugated HER2 probe was either partially or almost completely blocked by the two trastuzumabdoses compared with the signal from the probe in the untreated (control) tumor group. (b) Mean (ie, average)volumes for tumors administered the (saline solution) vehicle, an intermediate dose of trastuzumab, or the fulldose of trastuzumab at days 3 and 14 of therapy are shown. All in vivo imaging examinations were performedon day 2 of therapy. Error bars indicate standard errors of mean (five or more tumors in each group). Signifi-cance of differences is illustrated: � � P � .05, �� � P � .005.
MOLECULAR IMAGING: Imaging of Breast Cancer during HER2/neu-targeted Therapy Gee et al
Radiology: Volume 248: Number 3—September 2008 933

bition. Decreased probe uptake was re-producibly observed in the SKBR-3 andBT-474 tumors days before differencesin the overall tumor size were apparent.The benefit gained from early imaging ofHER2 inhibition is likely to be evengreater in patients because tumors aris-ing in humans tend to have a slowerbaseline growth rate and no control tu-mors are available for growth rate com-parisons.
The described HER2 imaging methodwas shown to be dose sensitive: TheBT-474 tumors treated with an interme-diate subtherapeutic dose of trastu-zumab (5 mg/kg intraperitoneally) dem-onstrated a lower degree of HER2probe binding compared with the un-treated tumor cohort but a greater de-gree of probe binding compared withthe cohort that received the therapeuticdose. This intermediate level of probebinding helped to predict subsequentpartial tumor response to treatment, ascharacterized by partial inhibition of tu-mor growth. The ability to assess thekinetics and degree of molecular targetinhibition has the potential to lead tooptimized cancer therapy dosing andscheduling on an individual patient basisfor a maximized therapeutic effect whileminimizing drug toxicity. Our study re-sults demonstrate that NIR fluorescenceimaging of the degree of HER2 inhibi-tion can provide an early temporal win-dow in which to modify trastuzumabdosing before changes in tumor growthbecome apparent.
One issue related to NIR fluores-cence imaging was the quantitation andcomparison of fluorescence intensities.To that end, we devised a method ofcalculating the standard fluorescencevalues for each tumor, with which thefluorescence intensity in the tumor re-gion of interest was normalized to der-mal fluorescence at a site away from thetumor. This method enabled us to com-pare probe uptake among the differenttumors. Alternatively, quantitative NIRfluorescence tomographic methods maybe used to make such assessments.
Potential limitations of our study in-cluded the relatively long plasma half-life of the HER2 probe that resultedfrom our use of the intact trastuzumab
antibody for imaging probe synthesis.We included the entire antibody to max-imize HER2/neu binding affinity, whichfor our probe (KD � 12.4 nmol/L) wasconsiderably higher than that of the in-dium 111–labeled trastuzumab Fab frag-ments used for nuclear imaging (27).The strong binding affinity of our probewas largely responsible for our ability todistinguish between HER2-normal andHER2-overexpressing tumors. The cir-culating plasma half-life of the probe (37hours) was comparable to that of thenative trastuzumab antibody (28). Se-rial HER2 imaging before and after tras-tuzumab therapy was possible owing tothe use of two HER2 probes with similarHER2/neu binding activity but distinctfluorescent spectra. Because the dose ofprobe administered was so low (0.4nmoL per 20 g per mouse), administra-tion of the first probe was presumed notto have affected the second probe’sbinding (similar to tracer concentra-tions used in nuclear imaging tech-niques). Future study investigators mayexplore the use of NIR fluorescence im-aging probes synthesized from antibodyfragments, which exhibit more rapidclearance and may enable serial admin-istration of a single wavelength probe(29,30). However, the potential disad-vantage of using such smaller probes isreduced tumor binding owing to multi-ple mechanisms, including rapid clear-ance, renal trapping, and fluorophoresteric interference of target binding.
An additional limitation of NIR opti-cal tomographic imaging in general isthat it is not yet approved for routineclinical use. However, recent clinicalstudies have revealed the ability to dis-tinguish benign from malignant breastlesions in humans with use of NIR opti-cal spectroscopy, both alone and incombination with magnetic resonanceimaging (8,9). It is hoped that the lackof ionizing radiation and the ability toassess multiple physiologic parameterssimultaneously will lead to more wide-spread clinical application of NIR imag-ing.
Practical applications of the NIR im-aging protocol assessed in our study in-clude the potential translation of theseconcepts to the clinic, including nonin-
vasive in situ characterization of breasttumors, individualized trastuzumab dos-ing in patients with breast cancer, andimaging of primary therapeutic efficacybefore changes in tumor growth are ap-parent. Furthermore, this approach isgeneralizable to other monoclonal anti-body cancer therapies. It is hoped thatthe use of a small tracer dose of labeledantibody to assess the adequacy of ther-apeutic dosing of the same antibody toblock the target receptor may be of clin-ical benefit to patients with cancer inthe future.
References1. Rudin M, Weissleder R. Molecular imaging
in drug discovery and development. Nat RevDrug Discov 2003;2:123–131.
2. Chabner BA, Roberts TG Jr. Timeline: che-motherapy and the war on cancer. Nat RevCancer 2005;5:65–72.
3. Nadler E, Eckert B, Neumann PJ. Do oncolo-gists believe new cancer drugs offer goodvalue? Oncologist 2006;11:90–95.
4. Weissleder R. Molecular imaging in cancer.Science 2006;312:1168–1171.
5. Jobsis FF. Noninvasive, infrared monitoringof cerebral and myocardial oxygen suffi-ciency and circulatory parameters. Science1977;198:1264–1267.
6. Taroni P, Pifferi A, Torricelli A, Comelli D,Cubeddu R. In vivo absorption and scatter-ing spectroscopy of biological tissues. Photo-chem Photobiol Sci 2003;2:124–129.
7. Spinelli L, Torricelli A, Pifferi A, Taroni P,Danesini G, Cubeddu R. Characterization offemale breast lesions from multi-wavelengthtime-resolved optical mammography. PhysMed Biol 2005;50:2489–2502.
8. Tromberg BJ, Cerussi A, Shah N, et al. Imag-ing in breast cancer: diffuse optics in breastcancer—detecting tumors in pre-meno-pausal women and monitoring neoadjuvantchemotherapy. Breast Cancer Res 2005;7:279–285.
9. Choe R, Corlu A, Lee K, et al. Diffuse opticaltomography of breast cancer during neoad-juvant chemotherapy: a case study with com-parison to MRI. Med Phys 2005;32:1128–1139.
10. Slamon DJ, Clark GM, Wong SG, Levin WJ,Ullrich A, McGuire WL. Human breastcancer: correlation of relapse and survivalwith amplification of the HER-2/neu onco-gene. Science 1987;235:177–182.
11. Mendelsohn J, Baselga J. The EGF receptor
MOLECULAR IMAGING: Imaging of Breast Cancer during HER2/neu-targeted Therapy Gee et al
934 Radiology: Volume 248: Number 3—September 2008

family as targets for cancer therapy. Onco-gene 2000;19:6550–6565.
12. Lewis GD, Figari I, Fendly B, et al. Differen-tial responses of human tumor cell lines toanti-p185HER2 monoclonal antibodies. Can-cer Immunol Immunother 1993;37:255–263.
13. Olafsen T, Tan GJ, Cheung CW, et al. Char-acterization of engineered anti-p185HER-2(scFv-CH3)2 antibody fragments (minibod-ies) for tumor targeting. Protein Eng Des Sel2004;17:315–323.
14. Kraus MH, Popescu NC, Amsbaugh SC, KingCR. Overexpression of the EGF receptor-related proto-oncogene erbB-2 in humanmammary tumor cell lines by different mo-lecular mechanisms. EMBO J 1987;6:605–610.
15. Lewis GD, Lofgren JA, McMurtrey AE, et al.Growth regulation of human breast andovarian tumor cells by heregulin: evidencefor the requirement of ErbB2 as a criticalcomponent in mediating heregulin respon-siveness. Cancer Res 1996;56:1457–1465.
16. Huang Q, Shan S, Braun RD, et al. Noninvasivevisualization of tumors in rodent dorsal skin win-dow chambers. Nat Biotechnol 1999;17:1033–1035.
17. Alencar H, Mahmood U, Kawano Y, HirataT, Weissleder R. Novel multiwavelength mi-
croscopic scanner for mouse imaging. Neo-plasia 2005;7:977–983.
18. van Slooten HJ, Bonsing BA, Hiller AJ, et al.Outgrowth of BT-474 human breast cancercells in immune-deficient mice: a new in vivomodel for hormone-dependent breast can-cer. Br J Cancer 1995;72:22–30.
19. Mahmood U, Tung CH, Tang Y, WeisslederR. Feasibility of in vivo multichannel opticalimaging of gene expression: experimentalstudy in mice. Radiology 2002;224:446–451.
20. Petrovsky A, Schellenberger E, Josephson L,Weissleder R, Bogdanov A Jr. Near-infraredfluorescent imaging of tumor apoptosis. Can-cer Res 2003;63:1936–1942.
21. Kurosumi M. Significance and problems inevaluations of pathological responses to neo-adjuvant therapy for breast cancer. BreastCancer 2006;13:254–259.
22. Penault-Llorca F, Adelaide J, HouvenaeghelG, Hassoun J, Birnbaum D, Jacquemier J.Optimization of immunohistochemical detec-tion of ERBB2 in human breast cancer: im-pact of fixation. J Pathol 1994;173:65–75.
23. Rhodes A, Jasani B, Couturier J, et al. Aformalin-fixed, paraffin-processed cell linestandard for quality control of immunohisto-chemical assay of HER-2/neu expression inbreast cancer. Am J Clin Pathol 2002;117:81–89.
24. Hilger I, Leistner Y, Berndt A, et al. Near-infrared fluorescence imaging of HER-2 pro-tein over-expression in tumour cells. Eur Ra-diol 2004;14:1124–1129.
25. Robinson MK, Doss M, Shaller C, et al.Quantitative immuno-positron emission to-mography imaging of HER2-positive tumorxenografts with an iodine-124 labeled anti-HER2 diabody. Cancer Res 2005;65:1471–1478.
26. Pritchard KI, Shepherd LE, O’Malley FP,et al. HER2 and responsiveness of breastcancer to adjuvant chemotherapy. N EnglJ Med 2006;354:2103–2111.
27. Tang Y, Wang J, Scollard DA, et al. Imagingof HER2/neu-positive BT-474 human breastcancer xenografts in athymic mice using(111)In-trastuzumab (Herceptin) Fab frag-ments. Nucl Med Biol 2005;32:51–58.
28. Yeon CH, Pegram MD. Anti-erbB-2 antibodytrastuzumab in the treatment of HER2-am-plified breast cancer. Invest New Drugs2005;23:391–409.
29. Smith-Jones PM, Solit DB, Akhurst T,Afroze F, Rosen N, Larson SM. Imaging thepharmacodynamics of HER2 degradation inresponse to Hsp90 inhibitors. Nat Biotechnol2004;22:701–706.
30. Olafsen T, Kenanova VE, Sundaresan G,et al. Optimizing radiolabeled engineeredanti-p185HER2 antibody fragments for in vivoimaging. Cancer Res 2005;65:5907–5916.
MOLECULAR IMAGING: Imaging of Breast Cancer during HER2/neu-targeted Therapy Gee et al
Radiology: Volume 248: Number 3—September 2008 935

Radiology 2008 This is your reprint order form or pro forma invoice
(Please keep a copy of this document for your records.)
Reprint order forms and purchase orders or prepayments must be received 72 hours after receipt of form either by mail or by fax at 410-820-9765. It is the policy of Cadmus Reprints to issue one invoice per order.
Please print clearly.
Author Name _______________________________________________________________________________________________ Title of Article _______________________________________________________________________________________________ Issue of Journal_______________________________ Reprint # _____________ Publication Date ________________ Number of Pages_______________________________ KB # _____________ Symbol Radiology Color in Article? Yes / No (Please Circle) P lease include the journal name and reprint number or manuscript number on your purchase order or other correspondence.
Order and Shipping Information Reprint Costs (Please see page 2 of 2 for reprint costs/fees.) ________ Number of reprints ordered $_________ ________ Number of color reprints ordered $_________ ________ Number of covers ordered $_________ Subtotal $_________ Taxes $_________ (Add appropriate sales tax for Virginia, Maryland, Pennsylvania, and the District of Columbia or Canadian GST to the reprints if your order is to be shipped to these locations.) First address included, add $32 for each additional shipping address $_________
TOTAL $_________
Country _________________________________________
Quantity __________________ Fax __________________
Shipping Address (cannot ship to a P.O. Box) Please Print Clearly Name ___________________________________________ Institution _________________________________________ Street ___________________________________________ City ____________________ State _____ Zip ___________ Country ___________________________________________ Quantity___________________ Fax ___________________ Phone: Day _________________ Evening _______________ E-mail Address _____________________________________ Additional Shipping Address* (cannot ship to a P.O. Box) Name ___________________________________________ Institution _________________________________________ Street ___________________________________________ City ________________ State ______ Zip ___________
Phone: Day ________________ Evening ______________ E-mail Address ____________________________________ * Add $32 for each additional shipping address
P ayment and Credit Card Details Enclosed: Personal Check ___________ Credit Card Payment Details _________ Checks must be paid in U.S. dollars and drawn on a U.S. Bank. Credit Card: __ VISA __ Am. Exp. __ MasterCard Card Number __________________________________ E xpiration Date_________________________________ Signature: _____________________________________ Please send your order form and prepayment made payable to: Cadmus Reprints P.O. Box 751903 Charlotte, NC 28275-1903 Note: Do not send express packages to this location, PO Box.
FEIN #:541274108
Invoice or Credit Card Information Invoice Address Please Print Clearly Please complete Invoice address as it appears on credit card statement Name ____________________________________________ Institution ________________________________________ Department _______________________________________ Street ____________________________________________ City ________________________ State _____ Zip _______ Country ___________________________________________ Phone _____________________ Fax _________________ E-mail Address _____________________________________ Cadmus will process credit cards and Cadmus Journal
Services will appear on the credit card statement. If you don’t mail your order form, you may fax it to 410-820-9765 with
your credit card information.
Signature __________________________________________ Date _______________________________________ Signature is required. By signing this form, the author agrees to accept the responsibility for the payment of reprints and/or all charges described in this document. RB-9/26/07
Page 1 of 2
Black and White Reprint Prices
Domestic (USA only) # of
Pages 50 100 200 300 400 500
1-4 $221 $233 $268 $285 $303 $323 5-8 $355 $382 $432 $466 $510 $544 9-12 $466 $513 $595 $652 $714 $775
13-16 $576 $640 $749 $830 $912 $995 17-20 $694 $775 $906 $1,017 $1,117 $1,22021-24 $809 $906 $1,071 $1,200 $1,321 $1,47125-28 $928 $1,041 $1,242 $1,390 $1,544 $1,68829-32 $1,042 $1,178 $1,403 $1,568 $1,751 $1,924
Covers $97 $118 $215 $323 $442 $555
International (includes Canada and Mexico) # of
Pages 50 100 200 300 400 500
1-4 $272 $283 $340 $397 $446 $506 5-8 $428 $455 $576 $675 $784 $884 9-12 $580 $626 $805 $964 $1,115 $1,278
13-16 $724 $786 $1,023 $1,232 $1,445 $1,65217-20 $878 $958 $1,246 $1,520 $1,774 $2,03021-24 $1,022 $1,119 $1,474 $1,795 $2,108 $2,42625-28 $1,176 $1,291 $1,700 $2,070 $2,450 $2,81329-32 $1,316 $1,452 $1,936 $2,355 $2,784 $3,209
Covers $156 $176 $335 $525 $716 $905 Minimum order is 50 copies. For orders larger than 500 copies, please consult Cadmus Reprints at 800-407-9190. Reprint Cover Cover prices are listed above. The cover will include the publication title, article title, and author name in black. Shipping Shipping costs are included in the reprint prices. Domestic orders are shipped via UPS Ground service. Foreign orders are shipped via a proof of delivery air service. Multiple Shipments Orders can be shipped to more than one location. Please be aware that it will cost $32 for each additional location. Delivery Your order will be shipped within 2 weeks of the journal print date. Allow extra time for delivery.
Color Reprint Prices
Domestic (USA only) # of
Pages 50 100 200 300 400 500
1-4 $223 $239 $352 $473 $597 $719 5-8 $349 $401 $601 $849 $1,099 $1,3499-12 $486 $517 $852 $1,232 $1,609 $1,992
13-16 $615 $651 $1,105 $1,609 $2,117 $2,62417-20 $759 $787 $1,357 $1,997 $2,626 $3,26021-24 $897 $924 $1,611 $2,376 $3,135 $3,90525-28 $1,033 $1,071 $1,873 $2,757 $3,650 $4,53629-32 $1,175 $1,208 $2,122 $3,138 $4,162 $5,180
Covers $97 $118 $215 $323 $442 $555
International (includes Canada and Mexico)) # of
Pages 50 100 200 300 400 500
1-4 $278 $290 $424 $586 $741 $904 5-8 $429 $472 $746 $1,058 $1,374 $1,6909-12 $604 $629 $1,061 $1,545 $2,011 $2,494
13-16 $766 $797 $1,378 $2,013 $2,647 $3,28017-20 $945 $972 $1,698 $2,499 $3,282 $4,06921-24 $1,110 $1,139 $2,015 $2,970 $3,921 $4,87325-28 $1,290 $1,321 $2,333 $3,437 $4,556 $5,66129-32 $1,455 $1,482 $2,652 $3,924 $5,193 $6,462
Covers $156 $176 $335 $525 $716 $905 Tax Due Residents of Virginia, Maryland, Pennsylvania, and the District of Columbia are required to add the appropriate sales tax to each reprint order. For orders shipped to Canada, please add 7% Canadian GST unless exemption is claimed. Ordering Reprint order forms and purchase order or prepayment is required to process your order. Please reference journal name and reprint number or manuscript number on any correspondence. You may use the reverse side of this form as a proforma invoice. Please return your order form and prepayment to: Cadmus Reprints P.O. Box 751903 Charlotte, NC 28275-1903 Note: Do not send express packages to this location, PO Box. FEIN #:541274108
Reprint Order Forms and purchase order or prepayments must be received 72 hours after receipt of form.
Please direct all inquiries to:
Rose A. Baynard 800-407-9190 (toll free number) 410-819-3966 (direct number) 410-820-9765 (FAX number)
[email protected] (e-mail)
Page 2 of 2
Radiology 2008
Related Documents