HUDM4122 Probability and Statistical Inference April 1, 2015

Welcome message from author
This document is posted to help you gain knowledge. Please leave a comment to let me know what you think about it! Share it to your friends and learn new things together.
Transcript

HUDM4122Probability and Statistical Inference
April 1, 2015

First Announcement
• HW8 will be due on April 15, rather than April13
• I don’t expect us to get through the entirelecture today, so I decided to delay thehomework rather than splitting it

HW7
Q5
• Take a variable with mean = 12 and SE = 6.• What is the variable's lower bound for its 90%
Confidence Interval?(Give two digits after the decimal place)
• Answers were all over the place, so let’s goover this together

Q6• You are testing a new brand of Moose Chow.
You feed it to 25 meese.• The meese eat an average of 10 pounds of Moose Chow.
The standard deviation for how much they eat is 1 pound.
What is the upper bound of the 95% confidence interval forthe average amountof Moose Chow a moose eats?
• A lot of people got incorrect answer of 11.96, which comesfrom confusing standard deviation with standard error…
• Let’s take a look
Q10
• Your favorite sports team is already 25 games intotheir season, and has a win-loss record of 15-10(0.6). What is the lower bound on the 95%confidence interval for what percentage of gamesthey will win by the end of the season?(Give two digits after the decimal)
• No common wrong answers, so let’s go over thistogether
Other questions/comments on the hw?
Statistical Significance Testing
• The core of the traditional “frequentist”paradigm of statistics
Statistical Significance Testing
• The core of the traditional “frequentist”paradigm of statistics
• Determining what is “probably not not true”– Not the same as determining what is true!

Let’s unpack this
In statistical significance testing
• We start with a hypothesis
– Curriculum A is better than curriculum B

In statistical significance testing
• We start with a hypothesis
– All swans are white
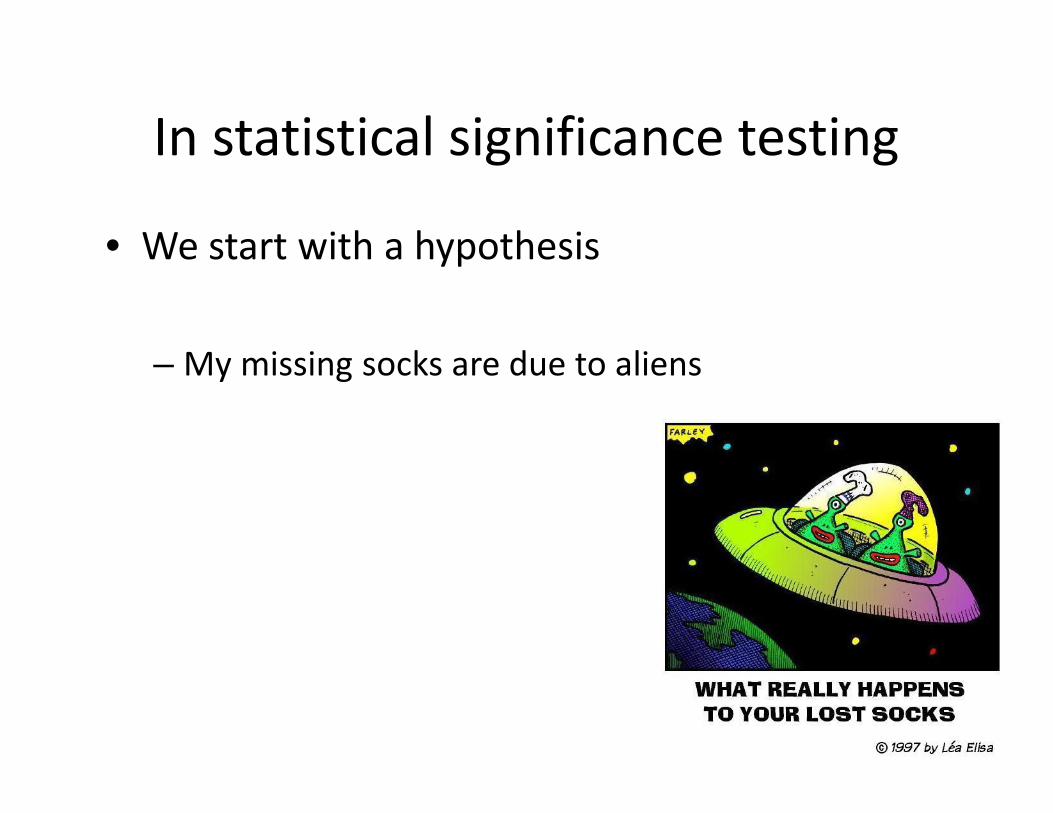
In statistical significance testing
• We start with a hypothesis
– My missing socks are due to aliens
We don’t try to prove that ourhypothesis is true
• It’s very difficult to prove something is true

We don’t try to prove that ourhypothesis is true
• I looked at 30 swans. They were all white.Therefore, all swans are white.
• Insufficient evidence!

We don’t try to prove that ourhypothesis is true
• I looked at 30 swans. They were all white.Therefore, all swans are white.
• Insufficient evidence! (Convenience sample?)

Instead, we try to look for evidencethat our hypothesis is false
Instead, we try to look for evidencethat our hypothesis is false
• We create what is called a null hypothesis

Instead, we try to look for evidencethat our hypothesis is false
• We create what is called a null hypothesis
• Which basically means that we say “nothing isgoing on here”

Instead, we try to look for evidencethat our hypothesis is false
• We create what is called a null hypothesis
• Some swans are not white• My missing socks are due to some factor other
than aliens• Curriculum A is not better than Curriculum B
And we refer to our original hypothesisas the alternative hypothesis

Example
• Null Hypothesis: Some swans are not white• Alternative Hypothesis: All swans are white
You Try It
• Null Hypothesis: My missing socks are due tosome factor other than aliens
• Alternative Hypothesis:

You Try It
• Null Hypothesis: My missing socks are due tosome factor other than aliens
• Alternative Hypothesis: Aliens stole my socks
You Try It
• Null Hypothesis: Curriculum A is not betterthan Curriculum B
• Alternative Hypothesis:

Usually It’s Thought of as
• Null Hypothesis: Curriculum A is not betterthan Curriculum B
• Alternative Hypothesis: There is a differencebetween Curriculum A and Curriculum B
• And we’ll get into why a little later

The Goal
• Find evidence that will help you distinguishbetween the null hypothesis and thealternative hypothesis

So why…
• Do we turn it around this way?

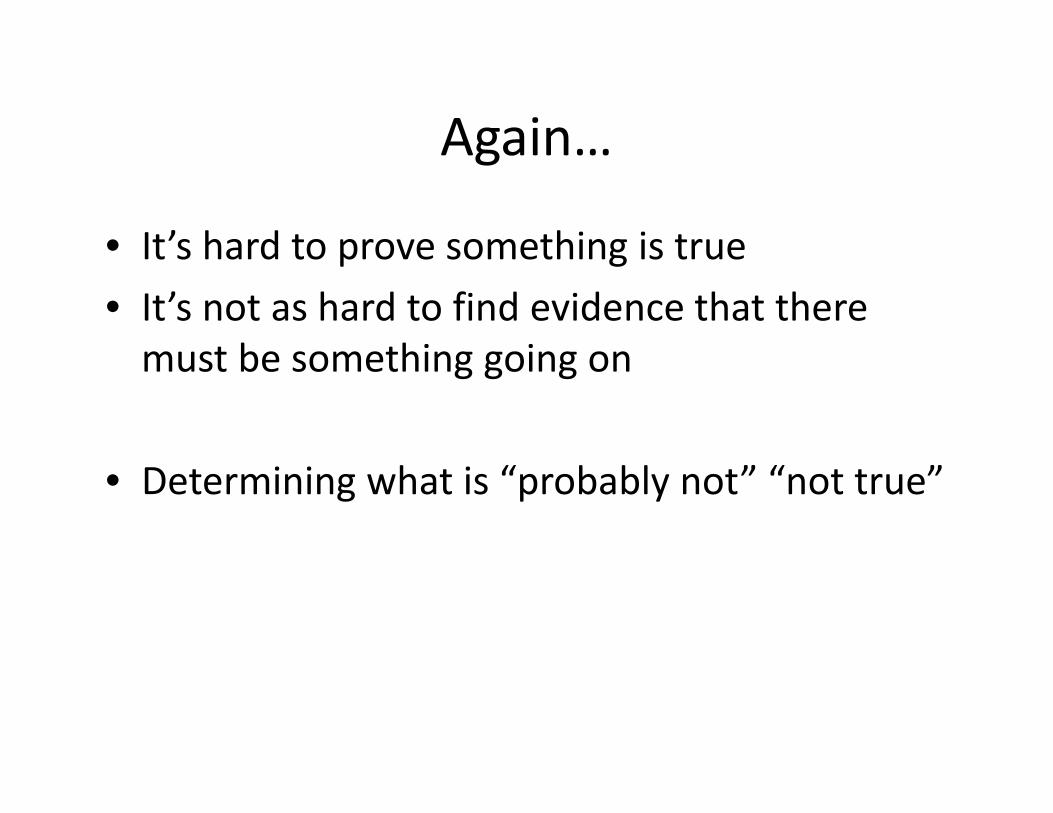
Again…
• It’s hard to prove something is true• It’s not as hard to find evidence that there
must be something going on
Again…
• It’s hard to prove something is true• It’s not as hard to find evidence that there
must be something going on
• Determining what is “probably not” “not true”

Questions? Comments?
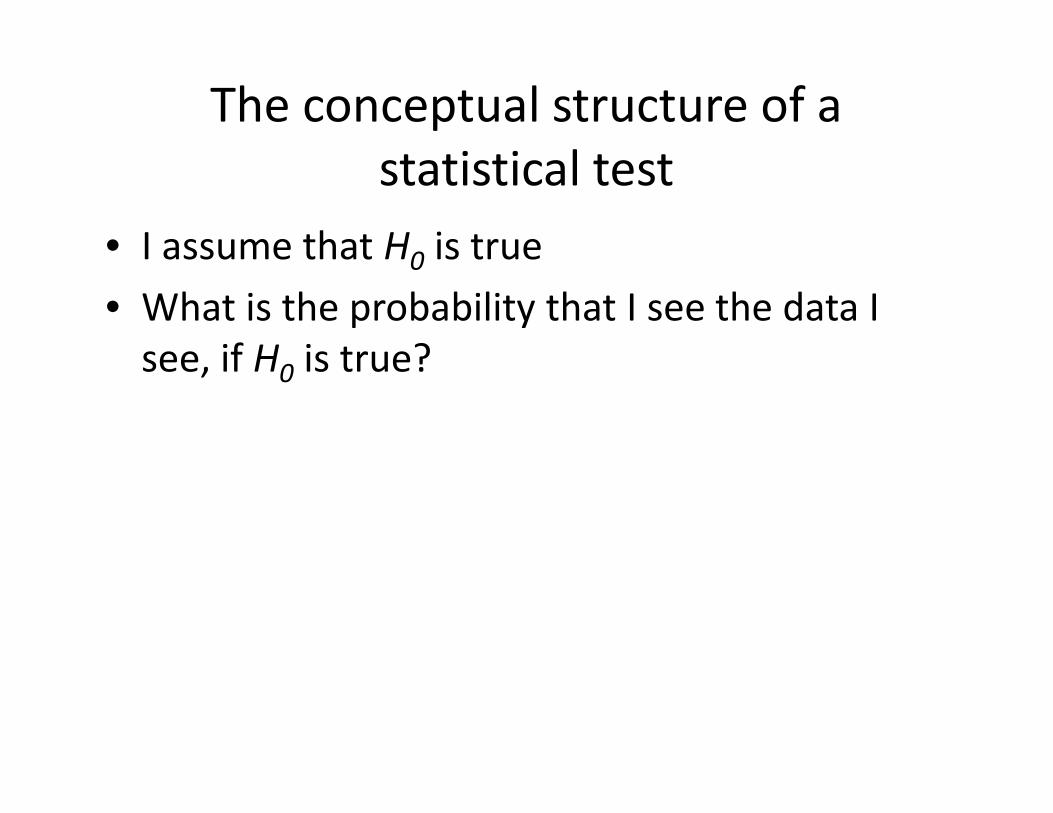
The conceptual structure of astatistical test
• I assume that H0 is true• What is the probability that I see the data I
see, if H0 is true?

Not the same
• What is the probability that I see the data Isee, if H0 is true?
• What is the probability that H0 is true, if I seethe data I see?

Example
• If I want to study the difference between twocurricula
• I ask the question
• What is the probability that I see the data Isee, if there is no difference betweencurricula?

You try it
• If you want to study whether Japanese highschool students are off-task less thanAmerican high school students
• What question do you ask?

You try it
• If you want to study whether students whotake your curriculum have an average learninggain greater than zero
• What question do you ask?

Questions? Comments?
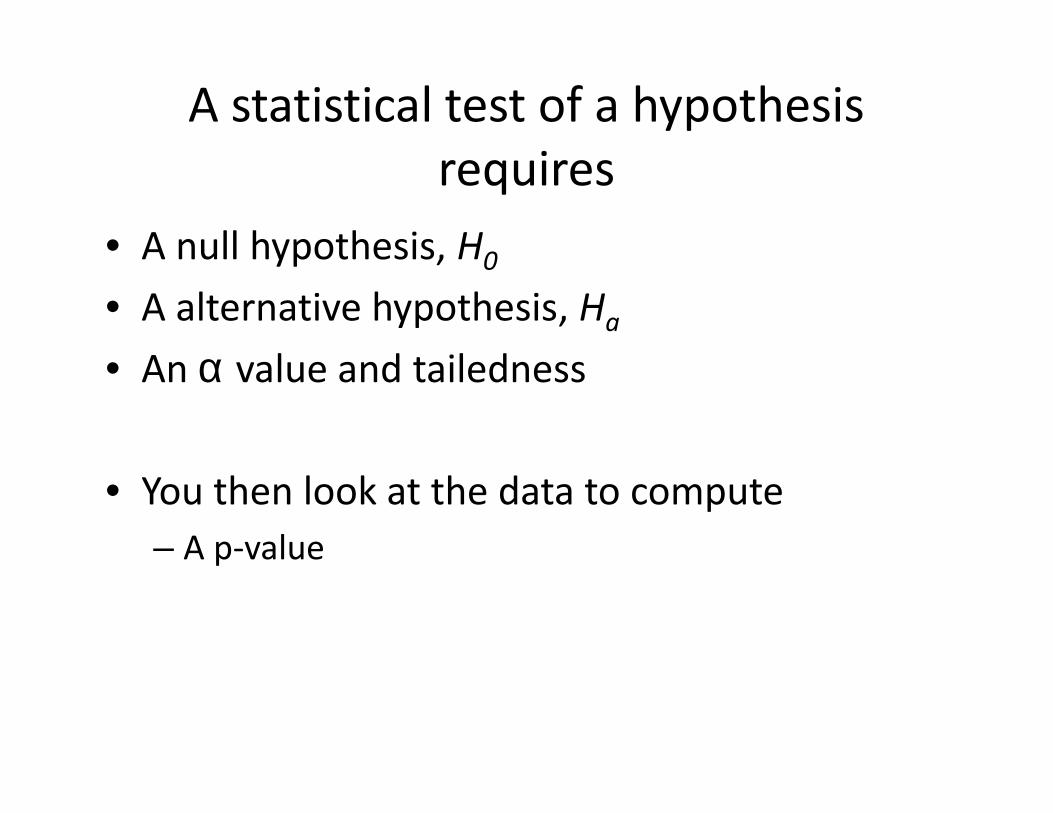
A statistical test of a hypothesisrequires
• A null hypothesis, H0
• A alternative hypothesis, Ha
• An α value and tailedness
• You then look at the data to compute– A p-value

We’ve already discussed the null andalternative hypotheses
• The third part of the test is the alpha andtailedness, which come together to identifythe rejection region

You may remember α from last class
• α was the parameter we used to define thearea outside the confidence interval
• If α = 0.05, 95% CI region is [0.025, 0.975]• If α = 0.01, 99% CI region is [0.005, 0.995]• If α = 0.10, 9o% CI region is [0.05, 0.95]
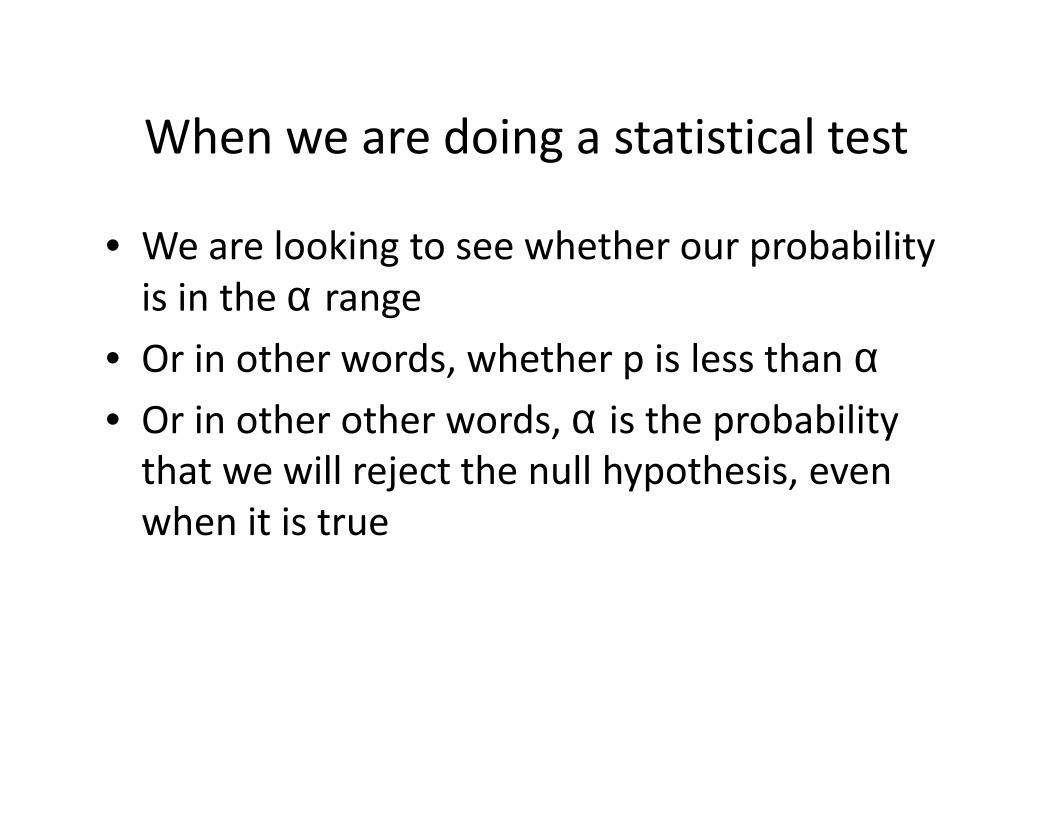
When we are doing a statistical test
• We are looking to see whether our probabilityis in the α range
• Or in other words, whether p is less than α• Or in other other words, α is the probability
that we will reject the null hypothesis, evenwhen it is true

Remember from Confidence Intervals
• A 95% Confidence Interval means• That given our data, the true value can be
expected to be inside this range 95% of thetime
• And outside the range 5% of the time
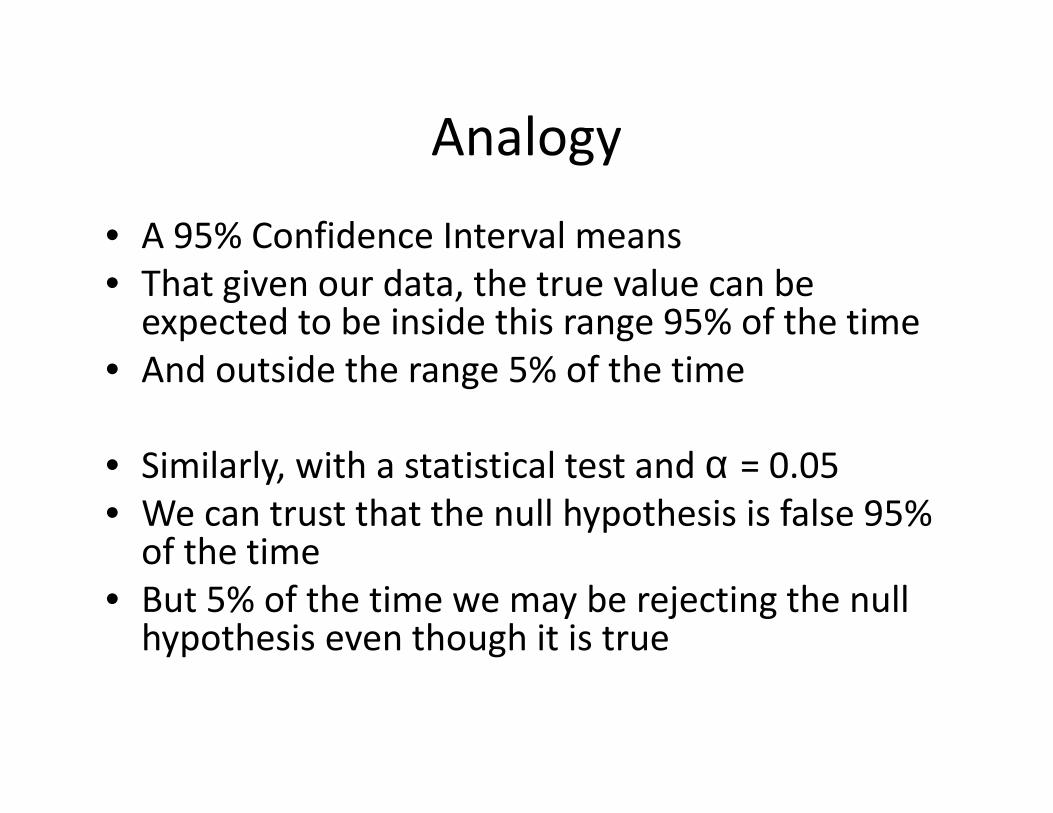
Analogy• A 95% Confidence Interval means• That given our data, the true value can be
expected to be inside this range 95% of the time• And outside the range 5% of the time
• Similarly, with a statistical test and α = 0.05• We can trust that the null hypothesis is false 95%
of the time• But 5% of the time we may be rejecting the null
hypothesis even though it is true
Terminology
• If a statistical test is such that p < α• Then we say the result is statistically
significant

Questions? Comments?
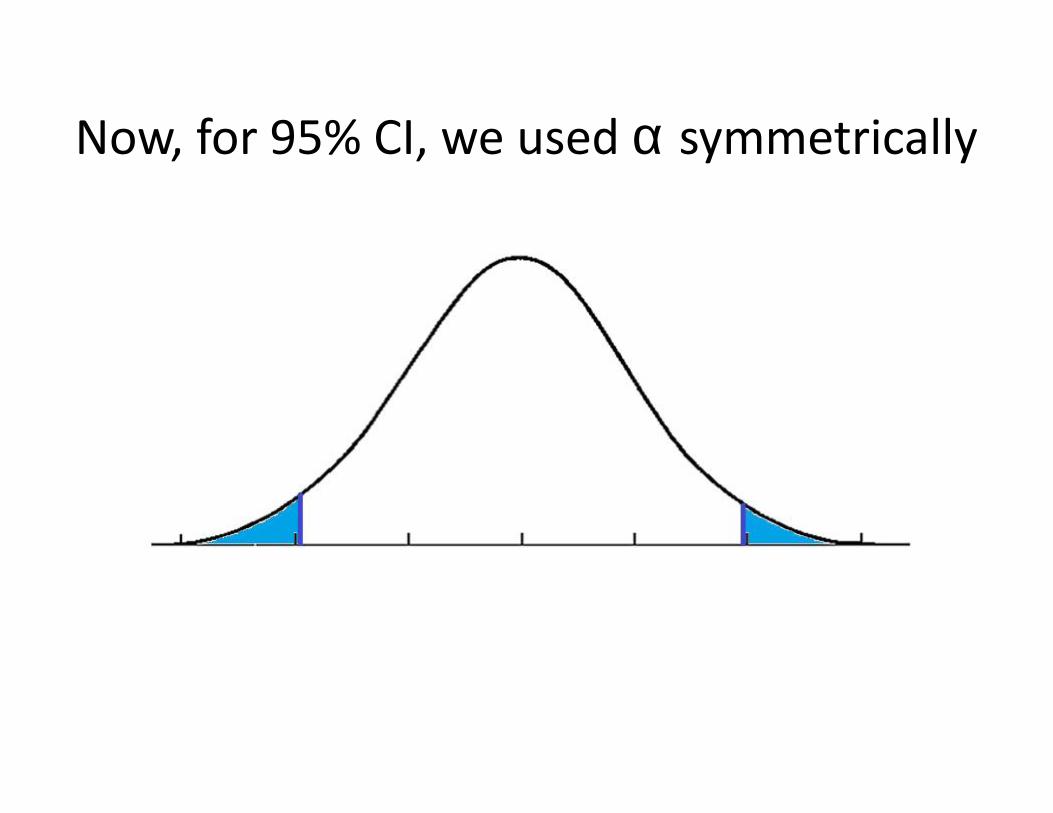
Now, for 95% CI, we used α symmetrically

There is another alternative

There is another alternative
• Which I totally, totally, totally don’trecommend

There is another alternative
• Which I totally, totally, totally don’trecommend
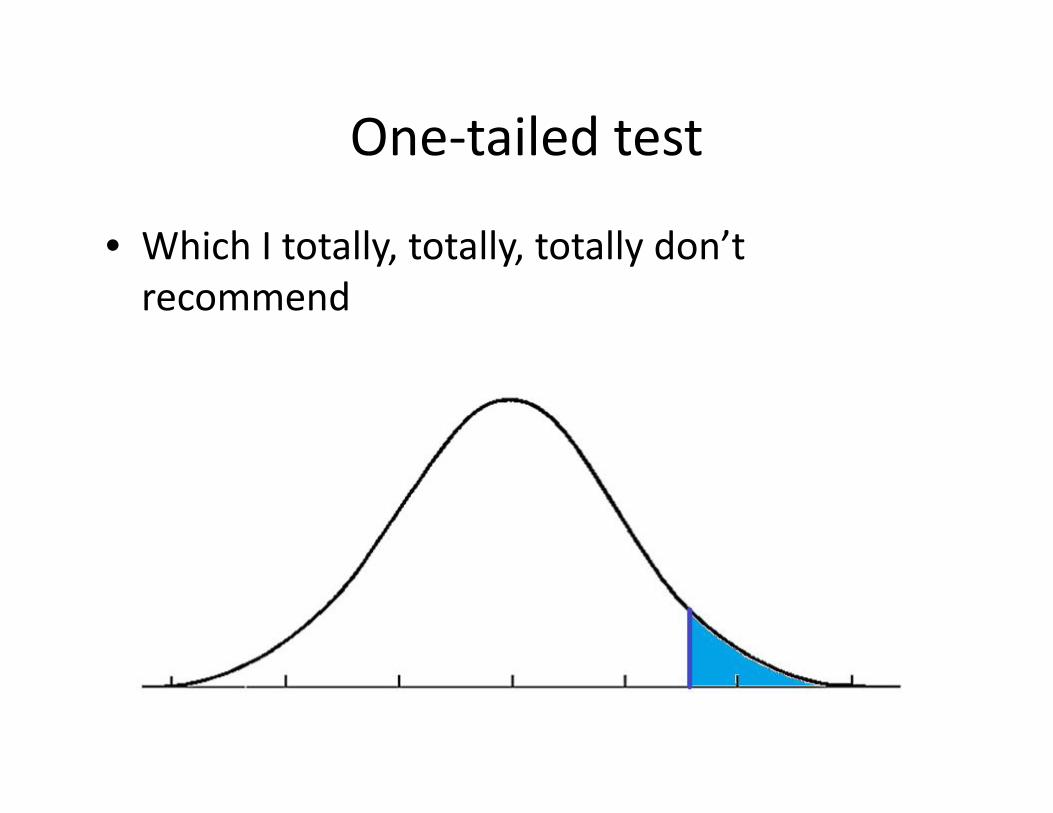
One-tailed test
• Which I totally, totally, totally don’trecommend

• One-tailed
• Two-tailed
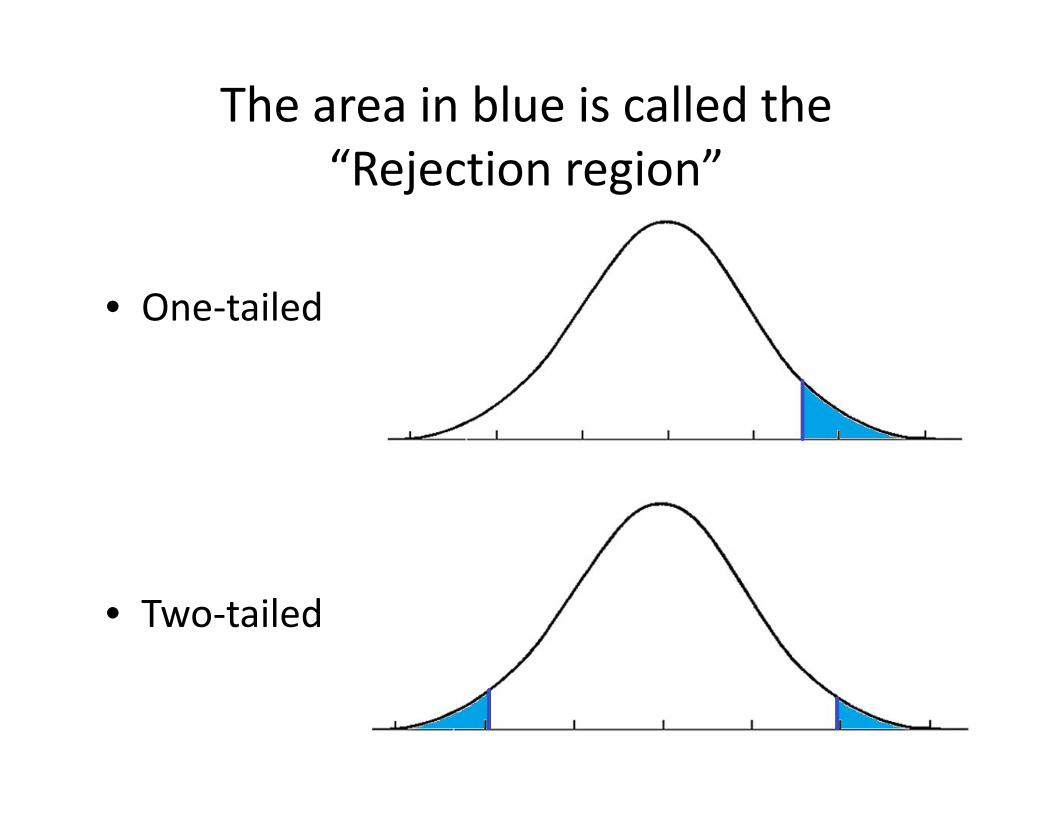
The area in blue is called the“Rejection region”
• One-tailed
• Two-tailed
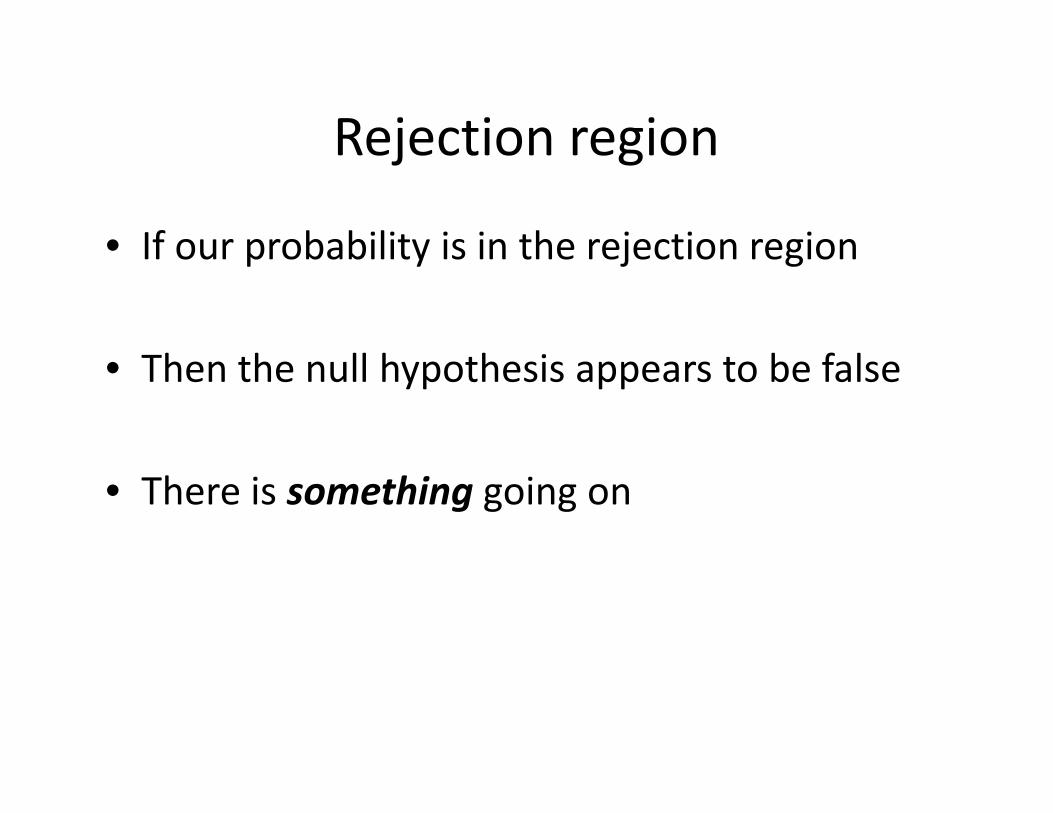
Rejection region
• If our probability is in the rejection region
• Then the null hypothesis appears to be false
• There is something going on

Comments? Questions?

You don’t actually have a choice
• Despite what textbooks will tell you• Everyone uses α = 0.05
– Caveat: Sometimes people do refer to marginalsignificance, where they compare probabilities toα * 2 = 0.10
• Everyone uses two-tailed tests

Why two-tailed tests?
• Because one-tailed tests have a weirdimplication
• It commits you to ignoring extreme findings inthe unexpected direction
Actual findingHighly improbable but we’ll ignore it
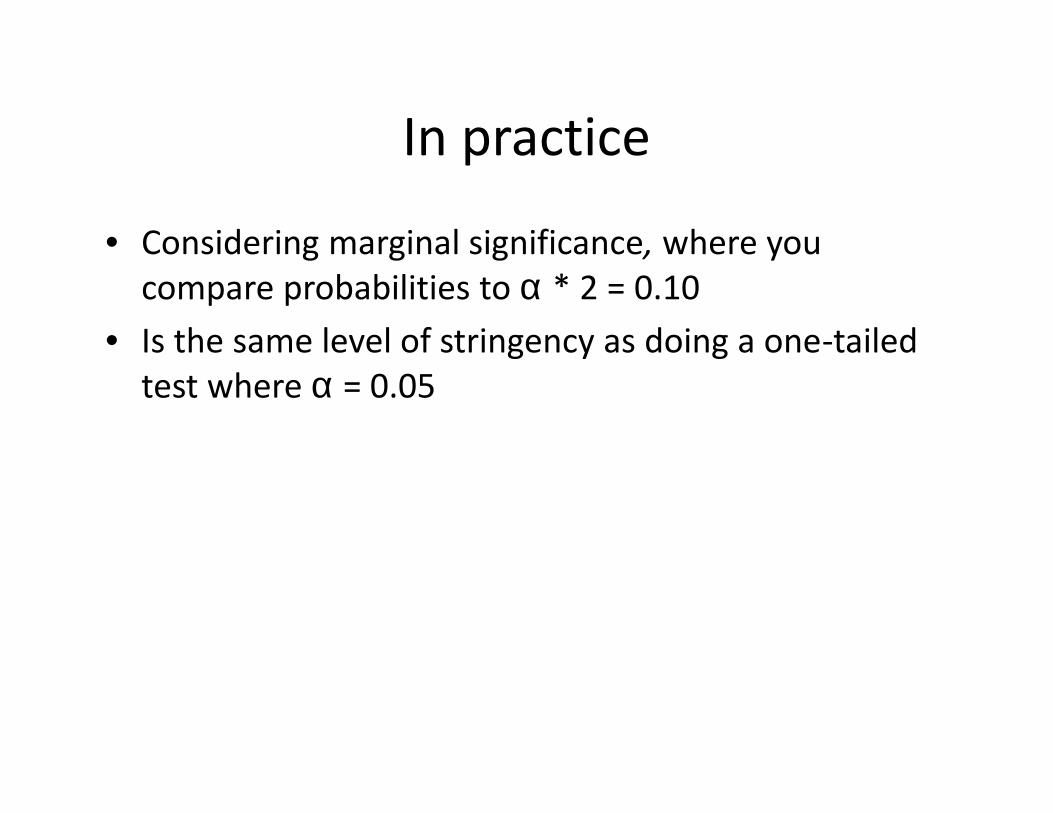
In practice
• Considering marginal significance, where youcompare probabilities to α * 2 = 0.10
• Is the same level of stringency as doing a one-tailedtest where α = 0.05

In practice
• Considering marginal significance, where youcompare probabilities to α * 2 = 0.10
• Is the same level of stringency as doing a one-tailedtest where α = 0.05
• Never ever ever say “a marginally significant one-tailed test”
• Your paper will be rejected
In practice
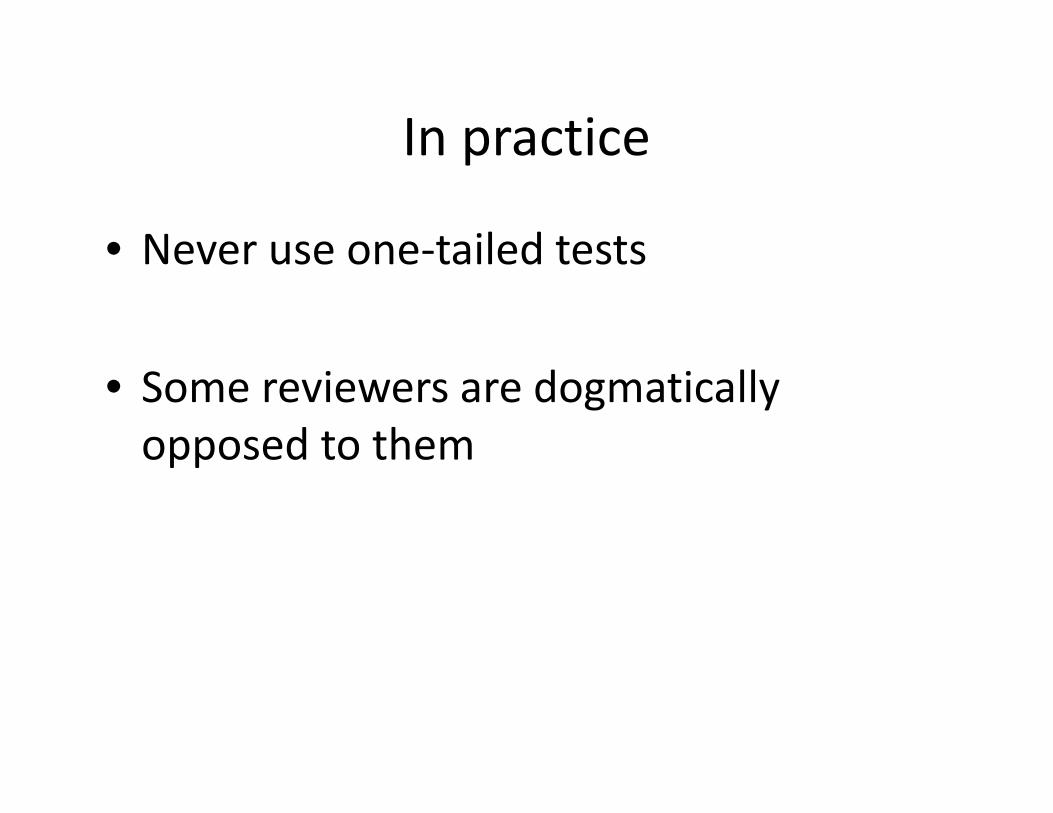
• Never use one-tailed tests
• Some reviewers are dogmaticallyopposed to them

Questions? Comments?

A statistical test of a hypothesisrequires
• A null hypothesis, H0
• A alternative hypothesis, Ha
• An α value and tailedness
• You then look at the data to compute– Whether the result is statistically significant– A p-value

One-sample Z-test
• A statistical test involving the Z distribution• Which, yes, means that your sample should
have N>30
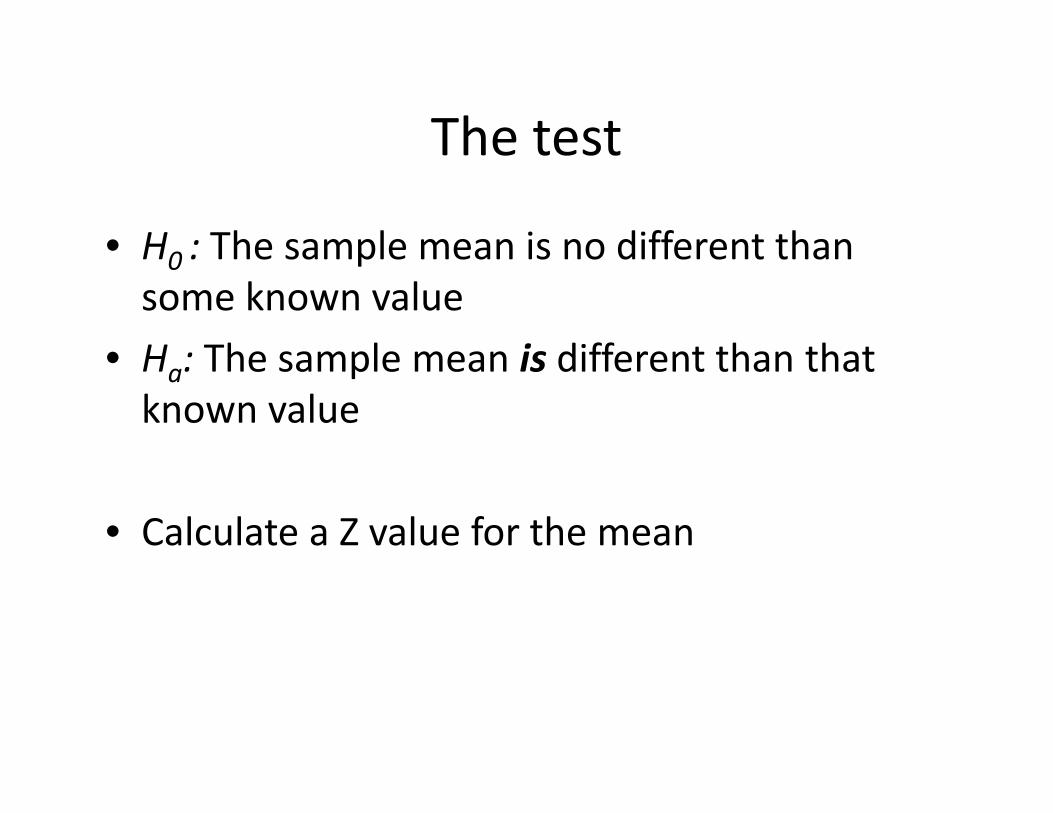
The test
• H0 : The sample mean is no different thansome known value
• Ha: The sample mean is different than thatknown value
• Calculate a Z value for the mean

Significance Criterion
• For a two-tailed test, where α = 0.05
• We consider the test significant if
< − ∝/> ∝/

Significance Criterion
• For a two-tailed test, where α = 0.05
• We consider the test significant if
< −1.96> 1.96

Abstract Example
• ̅ is 6, SE is 3
• We want to know if M is greater than 0

Abstract Example
• ̅ is 6, SE is 3
• We want to know if M is greater than 0
• Null hypothesis: M is not significantly differentthan 0

Abstract Example
• ̅ is 6, SE is 3
• We want to know if M is greater than 0
• Null hypothesis: M is not significantly different than 0
• = = 2 Z > 1.96
• So it is significant!
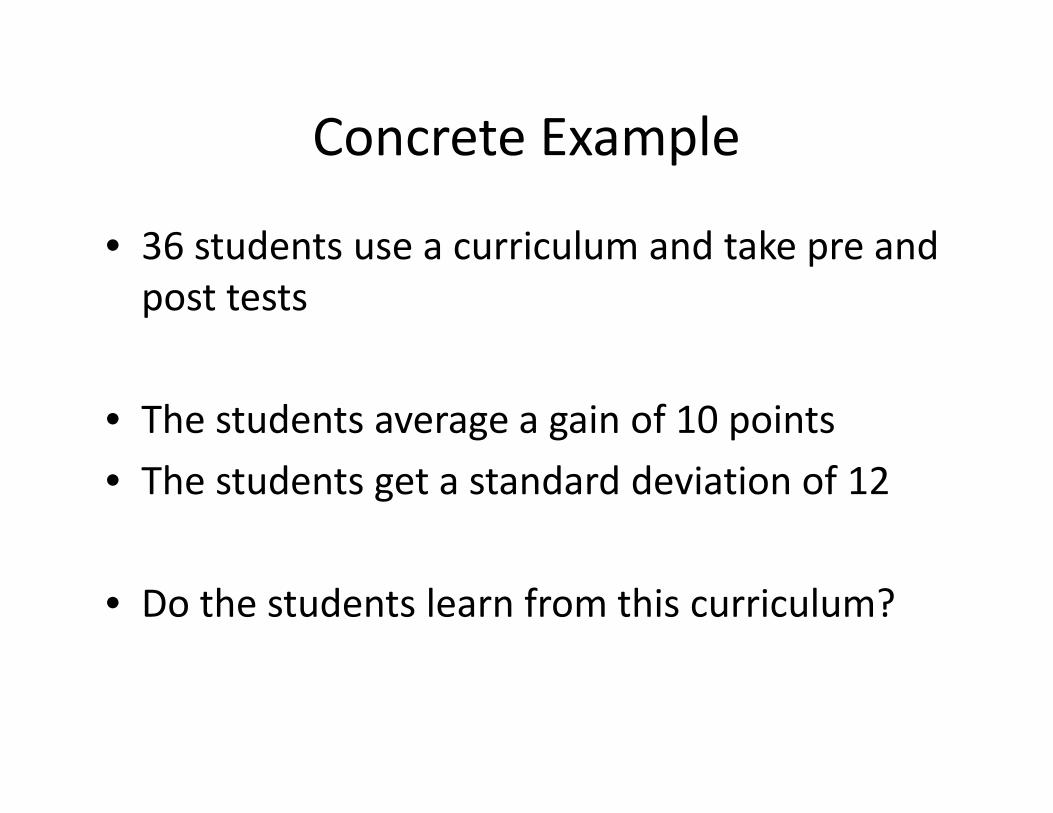
Concrete Example
• 36 students use a curriculum and take pre andpost tests
• The students average a gain of 10 points• The students get a standard deviation of 12
• Do the students learn from this curriculum?
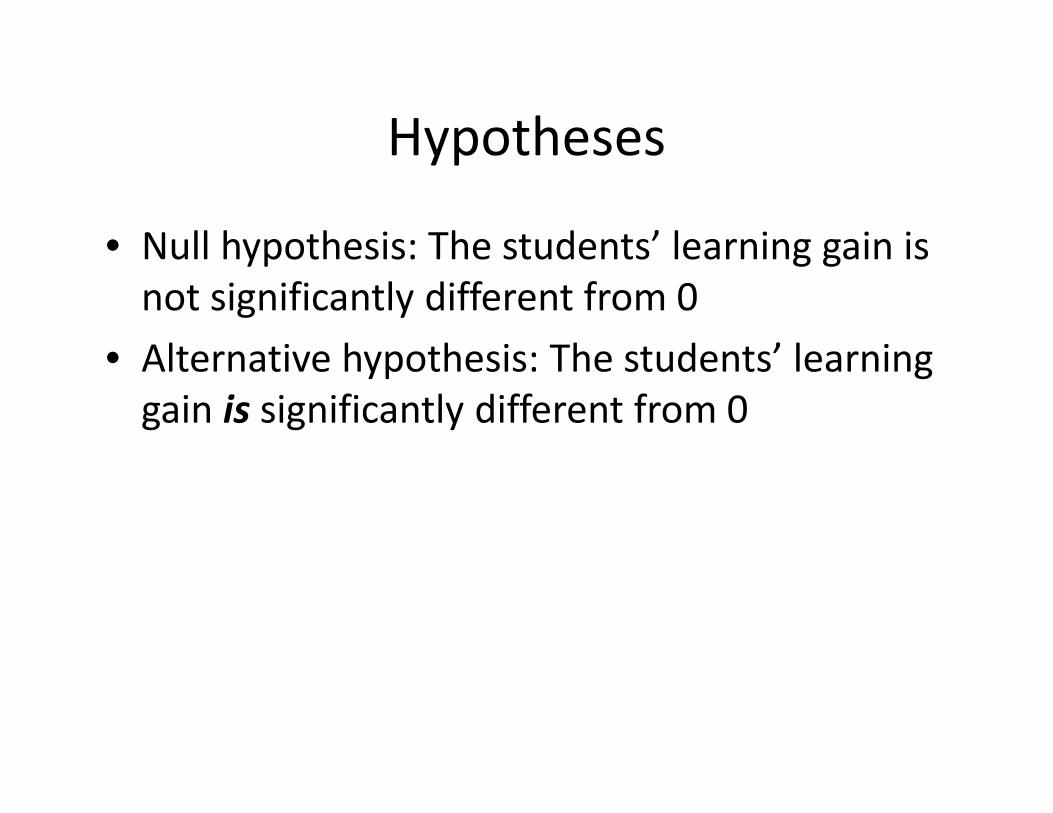
Hypotheses
• Null hypothesis: The students’ learning gain isnot significantly different from 0
• Alternative hypothesis: The students’ learninggain is significantly different from 0

Z = ̅ = = = = 5
• 36 students use a curriculum and take pre andpost tests
• The students average a gain of 10 points• The students get a standard deviation of 12
• Do the students learn from this curriculum?

5> 1.96It is statistically significant
• 36 students use a curriculum and take pre andpost tests
• The students average a gain of 10 points• The students get a standard deviation of 12
• Do the students learn from this curriculum?

Class Ends
• See next slide deck for continuation

Final questions or commentsfor the day?

Upcoming Classes
• 4/8 No class
• 4/13 Types of Errors
• 4/15 Statistical power– HW8 due
Related Documents