THE ASTROPHYSICAL JOURNAL, 493 : 440È450, 1998 January 20 1998. The American Astronomical Society. All rights reserved. Printed in U.S.A. ( HUBBL E SPACE TEL ESCOPE GODDARD HIGH RESOLUTION SPECTROGRAPH OBSERVATIONS OF THE Be ] sdO BINARY / PERSEI1 DOUGLAS R. WILLIAM G. ELIZABETH C. GIES, BAGNUOLO,JR., FERRARA, ANTHONY B. AND MICHELLE L. KAYE, THALLER Center for High Angular Resolution Astronomy and Department of Physics and Astronomy, Georgia State University, Atlanta, GA 30303 ; gies=chara.gsu.edu, bagnuolo=chara.gsu.edu, ferrara=chara.gsu.edu, kaye=chara.gsu.edu, thaller=chara.gsu.edu LAURA R. PENNY Department of Physics, University of Montreal, C.P. 6128, Succ. Centre Ville, Montreal, PQ H3C 3J7, Canada ; penny=astro.umontreal.ca AND GERALDINE J. PETERS Space Sciences Center, University of Southern California, University Park, Los Angeles, CA 90089-1341 ; gjpeters=mucen.usc.edu Received 1997 April 23 ; accepted 1997 September 2 ABSTRACT Mass transfer during the evolution of intermediate-mass stars in a close binary system can result in a rejuvenated and spun-up secondary star (which may appear as a rapidly rotating Be star) orbiting an unseen, stripped-down, remnant companion. One of the best candidates for such a system is the long- period (127 days) binary / Per. Here we present new Hubble Space Telescope Goddard High Resolution Spectrograph spectra of / Per in several UV regions that show clearly for the Ðrst time the spectral signature of the faint remnant companion. We derive a double-lined solution for the radial velocity curve that yields masses of 9.3 ^ 0.3 and 1.14 ^ 0.04 for the Be star and companion, respectively. A M _ M _ Doppler tomographic reconstruction of the secondary spectrum shows a rich spectrum dominated by sharp Fe IV and Fe V lines, similar to those observed in hot sdO stars. Non-LTE spectrum synthesis indicates that the subdwarf has temperature kK and gravity log g \ 4.2 ^ 0.1 and that the T eff \ 53 ^ 3 subdwarfÈtoÈBe star Ñux ratio is 0.165 ^ 0.006 and 0.154 ^ 0.009 for the 1374 and 1647 regions, A ł respectively. The spectrum of the Be primary appears normal for a very rapidly rotating early B-type star, but we argue that the star is overluminous for its mass (perhaps owing to accretion-induced mixing). Additional sharp lines of Fe IV appear when the companion is in the foreground, and we show that these form in a heated region of the Be starÏs disk that faces the hot subdwarf. Subject headings : stars : binaries : spectroscopic È stars : emission-line, Be È stars : evolution È stars : individual (/ Persei, HD 10516) È stars : subdwarfs 1. INTRODUCTION Mass transfer in close binary systems is a potential means to spin up the mass gainer, and a series of investigators have suggested that the rapidly rotating Be stars may result from the mass transfer process & Harmanec (Kr— iz— 1975 ; & Kr—iz— & van den Heuvel Harmanec 1976 ; Rappaport der Linden et al. et al. 1982 ; van 1987 ; Waters 1989 ; Pols Zwart According to these models, the 1991 ; Portegies 1995). Be star should have an evolved companion, either a helium star, a white dwarf, or a neutron star. The term ““ helium star ÏÏ in this context refers to a stripped-down, bare stellar core ; the actual surface abundance will depend on how much, if any, of the envelope was retained after rapid mass transfer. A signiÐcant number of Be stars could be formed in this way ; estimates for the fraction of Be stars with evolved companions range from 50% et al. to 5%È20% (Pols 1991) Bever & Vanbeveren However, despite the large (Van 1997). estimated number of Be binaries, only Be plus neutron star 1 Based on observations with the NASA/ESA Hubble Space Telescope, obtained at the Space Telescope Science Institute, which is operated by the Association of Universities for Research in Astronomy, Inc., under NASA contract NAS5-26555. (Be/X-ray) systems have been found den Heuvel & (van Rappaport Systems with helium star or white dwarf 1987). companions have yet to be detected et al. (Meurs 1992), although the presence of such hot companions has been advocated in the cases of HR 2142 CoteŁ, & Pols (Waters, and / Per 1991) (Poeckert 1981). presented the Ðrst evidence of a helium Poeckert (1981) star companion in the bright Be binary / Persei (HR 496, HD 10516). Based on the antiphase velocity curve of the He II 4686 emission line, Poeckert argued that emission A ł originates in hot gas surrounding the companion. The high temperature required to ionize helium led Poeckert to suggest that the companion must be a very hot star, poss- ibly the stripped-down remnant from prior mass transfer. Poeckert used the velocity curves to determine the masses, and (Throughout this paper, M p \ 21 M _ M s \ 3.4 M _ . we will refer to the Be star as the ““ primary ÏÏ and to the hot companion as the ““ secondary ÏÏ based on their current masses.) Poeckert estimated that the companion has an e†ective temperature of 50,000 K, and, because of this high temperature, the companion contributes more to the com- bined Ñux at shorter wavelengths (a magnitude brighter in the UV and dominant in the EUV region). Subsequently, et al. and et al. observed an anti- Gies (1993) Boz— icŁ (1995) 440

Welcome message from author
This document is posted to help you gain knowledge. Please leave a comment to let me know what you think about it! Share it to your friends and learn new things together.
Transcript
THE ASTROPHYSICAL JOURNAL, 493 :440È450, 1998 January 201998. The American Astronomical Society. All rights reserved. Printed in U.S.A.(
HUBBL E SPACE TEL ESCOPE GODDARD HIGH RESOLUTION SPECTROGRAPHOBSERVATIONS OF THE Be] sdO BINARY / PERSEI1
DOUGLAS R. WILLIAM G. ELIZABETH C.GIES, BAGNUOLO, JR., FERRARA,ANTHONY B. AND MICHELLE L.KAYE, THALLER
Center for High Angular Resolution Astronomy and Department of Physics and Astronomy, Georgia State University,Atlanta, GA 30303 ; gies=chara.gsu.edu, bagnuolo=chara.gsu.edu, ferrara=chara.gsu.edu,
kaye=chara.gsu.edu, thaller=chara.gsu.edu
LAURA R. PENNY
Department of Physics, University of Montreal, C.P. 6128, Succ. Centre Ville, Montreal, PQ H3C 3J7, Canada ;penny=astro.umontreal.ca
AND
GERALDINE J. PETERS
Space Sciences Center, University of Southern California, University Park, Los Angeles, CA 90089-1341 ;gjpeters=mucen.usc.edu
Received 1997 April 23 ; accepted 1997 September 2
ABSTRACTMass transfer during the evolution of intermediate-mass stars in a close binary system can result in a
rejuvenated and spun-up secondary star (which may appear as a rapidly rotating Be star) orbiting anunseen, stripped-down, remnant companion. One of the best candidates for such a system is the long-period (127 days) binary / Per. Here we present new Hubble Space Telescope Goddard High ResolutionSpectrograph spectra of / Per in several UV regions that show clearly for the Ðrst time the spectralsignature of the faint remnant companion. We derive a double-lined solution for the radial velocity curvethat yields masses of 9.3^ 0.3 and 1.14^ 0.04 for the Be star and companion, respectively. AM
_M
_Doppler tomographic reconstruction of the secondary spectrum shows a rich spectrum dominated bysharp Fe IV and Fe V lines, similar to those observed in hot sdO stars. Non-LTE spectrum synthesisindicates that the subdwarf has temperature kK and gravity log g \ 4.2^ 0.1 and that theTeff \ 53 ^ 3subdwarfÈtoÈBe star Ñux ratio is 0.165 ^ 0.006 and 0.154 ^ 0.009 for the 1374 and 1647 regions,A�respectively. The spectrum of the Be primary appears normal for a very rapidly rotating early B-typestar, but we argue that the star is overluminous for its mass (perhaps owing to accretion-inducedmixing). Additional sharp lines of Fe IV appear when the companion is in the foreground, and we showthat these form in a heated region of the Be starÏs disk that faces the hot subdwarf.Subject headings : stars : binaries : spectroscopic È stars : emission-line, Be È stars : evolution È
stars : individual (/ Persei, HD 10516) È stars : subdwarfs
1. INTRODUCTION
Mass transfer in close binary systems is a potential meansto spin up the mass gainer, and a series of investigators havesuggested that the rapidly rotating Be stars may result fromthe mass transfer process & Harmanec(Kr— iz— 1975 ;
& Kr— iz— & van den HeuvelHarmanec 1976 ; Rappaportder Linden et al. et al.1982 ; van 1987 ; Waters 1989 ; Pols
Zwart According to these models, the1991 ; Portegies 1995).Be star should have an evolved companion, either a heliumstar, a white dwarf, or a neutron star. The term ““ heliumstar ÏÏ in this context refers to a stripped-down, bare stellarcore ; the actual surface abundance will depend on howmuch, if any, of the envelope was retained after rapid masstransfer. A signiÐcant number of Be stars could be formed inthis way ; estimates for the fraction of Be stars with evolvedcompanions range from 50% et al. to 5%È20%(Pols 1991)
Bever & Vanbeveren However, despite the large(Van 1997).estimated number of Be binaries, only Be plus neutron star
1 Based on observations with the NASA/ESA Hubble Space Telescope,obtained at the Space Telescope Science Institute, which is operated by theAssociation of Universities for Research in Astronomy, Inc., under NASAcontract NAS5-26555.
(Be/X-ray) systems have been found den Heuvel &(vanRappaport Systems with helium star or white dwarf1987).companions have yet to be detected et al.(Meurs 1992),although the presence of such hot companions has beenadvocated in the cases of HR 2142 Cote� , & Pols(Waters,
and / Per1991) (Poeckert 1981).presented the Ðrst evidence of a heliumPoeckert (1981)
star companion in the bright Be binary / Persei (HR 496,HD 10516). Based on the antiphase velocity curve of theHe II 4686 emission line, Poeckert argued that emissionA�originates in hot gas surrounding the companion. The hightemperature required to ionize helium led Poeckert tosuggest that the companion must be a very hot star, poss-ibly the stripped-down remnant from prior mass transfer.Poeckert used the velocity curves to determine the masses,
and (Throughout this paper,Mp\ 21 M
_M
s\ 3.4 M
_.
we will refer to the Be star as the ““ primary ÏÏ and to the hotcompanion as the ““ secondary ÏÏ based on their currentmasses.) Poeckert estimated that the companion has ane†ective temperature of 50,000 K, and, because of this hightemperature, the companion contributes more to the com-bined Ñux at shorter wavelengths (a magnitude brighter inthe UV and dominant in the EUV region). Subsequently,
et al. and et al. observed an anti-Gies (1993) Boz— ic� (1995)
440
GHRS OBSERVATIONS OF / Per 441
TABLE 1
RADIAL VELOCITIES
jc
Date Vr,p (O[ C)
pVr,s (O[ C)
sObservation Root Name (A� ) (HJD [2,400,000) Orbital Phase (km s~1) (km s~1) (km s~1) (km s~1)
Z2ZAA102 . . . . . . . . . . . . . . . . 1374 50,023.5987 0.212 [9.8 1.9 78.2 1.2Z2ZAA202 . . . . . . . . . . . . . . . . 1374 50,084.5151 0.693 8.7 1.4 [77.6 0.5Z3BIA102 . . . . . . . . . . . . . . . . 1647 50,276.5235 0.208 [12.8 [1.2 75.5 [1.1Z3BIA202 . . . . . . . . . . . . . . . . 1647 50,327.3240 0.610 4.1 [0.2 [54.1 [0.5Z3BIA302 . . . . . . . . . . . . . . . . 1374 50,371.3607 0.957 [0.2 [0.9 [24.2 [0.6Z3BIA303 . . . . . . . . . . . . . . . . 1647 50,371.4089 0.958 [0.2 [0.9 [23.0 0.4Z3BIA304 . . . . . . . . . . . . . . . . 1735 50,371.4238 0.958 . . . . . . . . . . . .
phase velocity curve (similar to that of He II j4686) in theHe I 6678 emission line (presumably formed in the outer,A�cooler part of the disk surrounding the companion). Boz— ic�et al. present a comprehensive review of the availablephotometric and radial velocity data, and they give arevised orbital solution (with a period P\ 126.6731 days)that results in lower masses and 1.7\(16 \M
p/M
_\ 22
than Poeckert found. Lower masses wereMs/M
_\ 2.2)
also advocated by et al. based on their model-Singh (1994)ing of the optical emission lines.
The predicted, relatively brighter appearance of the sec-ondary in the UV motivated et al. to searchThaller (1995)for evidence of the secondaryÏs features in IUE high-dispersion spectra using the Doppler tomography algo-rithm et al. an iterative scheme that uses(Bagnuolo 1994),an ensemble of composite spectra and the associated radialvelocity curves to reconstruct the spectrum of each star.They found that the primaryÏs spectrum has rotationallybroadened photospheric lines (consistent with a spectraltype B0.5 IIIÈVe) and narrow emission lines formed in itscircumstellar disk. The recovered secondary spectrum isnoisy (S/N D 8) because the secondary contributes onlyB12% of the UV Ñux, but it has a very di†erent appearancewith strong emission in C IV j1550 and many narrow, weakabsorption lines (mainly Fe V) similar to those found in thespectra of hot O-type subdwarfs.
The conÐrmation of the existence of a faint secondaryspectrum in the UV would provide direct evidence of thephotosphere of a companion helium star, and here wepresent such proving observations based on high-qualityspectra obtained with the Goddard High ResolutionSpectrograph (GHRS) and the Hubble Space Telescope(HST ). We discuss the appearance of the primary and sec-ondary spectra in two regions of the UV spectrum, and weuse the observations to obtain new orbital elements andmass estimates. The reconstructed spectra are comparedwith synthetic model spectra to help estimate the physicalproperties of both stars, and we use this information todiscuss the evolutionary state of this unique, postÈmasstransfer binary.
2. OBSERVATIONS AND REDUCTIONS
The spectra of / Per were obtained with the GHRS onHST during observing Cycles 5 and 6. The spectra weremade in the ACCUM mode with the Large Science Aper-ture and the Ðrst-order G160M grating. They record in2060 subpixels three regions centered on 1647,j
c\ 1374,
and 1735 with reciprocal dispersions of 0.0179, 0.0175,A�and 0.0173 subpixel~1, respectively. A STEP-PATT\ 5A�(the default value) provided four subsamples of each pixel
(to obtain the fullest possible resolution) and two sub-samples of the background within each substepping cycle.Application of the COMB\ 4 option to perform four inte-gral pixel shifts helped remove small diode-to-diode sensi-tivity variations, and the FP-SPLIT \ 4 option (the defaultvalue) was selected to step the grating carrousel throughfour o†set positions in order to estimate better the Ñat-Ðeldvariations. The entire cycle of pixel substepping and gratingshifts required 108.8 s (using the default integration time of0.2 s at each position in the pattern), and four such cycles ineach of three exposures provided a total integration time of1306 s (except in the case of the 1735 observation, forA�which we made two exposures for a total of 870 s). There arethree spectra each of the 1374 and 1647 regions obtainedA�at three di†ering orbital phases ; only a single spectrum wasmade of the 1735 region. The times of observation areA�listed in Table 1.
The GHRS spectra were reduced using standard pipelinesoftware, and the STSDAS tasks ““ hst–calib.ctools.po†sets ÏÏand ““ hst–calib.ctools.specalign ÏÏ were used, respectively, toÐnd the individual wavelength o†sets of each FP-SPLITposition in each exposure and to combine the individualspectra using these o†sets and a tomographic reconstruc-tion of the Ñat-Ðeld irregularities Bruhweiler, & Smith(Lyu,
We made small corrections to the wavelength scale1995).by Ðrst measuring line positions in the SPYBAL exposurepreceding each science exposure using““ hst–calib.hrs.wavecal ÏÏ and then applying the correctionsto the wavelength scale using ““ toolbox.imgtools.imcalc ÏÏ
Sherbert, & Hulbert Heliocentric Julian(Soderblom, 1994).dates were calculated using the routine ““ noao.astutil.setjd ÏÏin IRAF.2
The spectra for each region are illustrated in Figures 1, 2,and There are at least four components apparent in these3.spectra :
1. The shallow and very broad spectral features of therapidly rotating Be star (V sin i \ 450 km s~1 ; Poeckert1981).
2. A host of weak and extremely narrow absorption linesthat we observe to follow the antiphase radial velocity curveof the companion (see below). This faint component was° 3Ðrst detected in low S/N IUE spectra by et al.Thaller
but these HST spectra show the weak lines with(1995),unprecedented clarity.
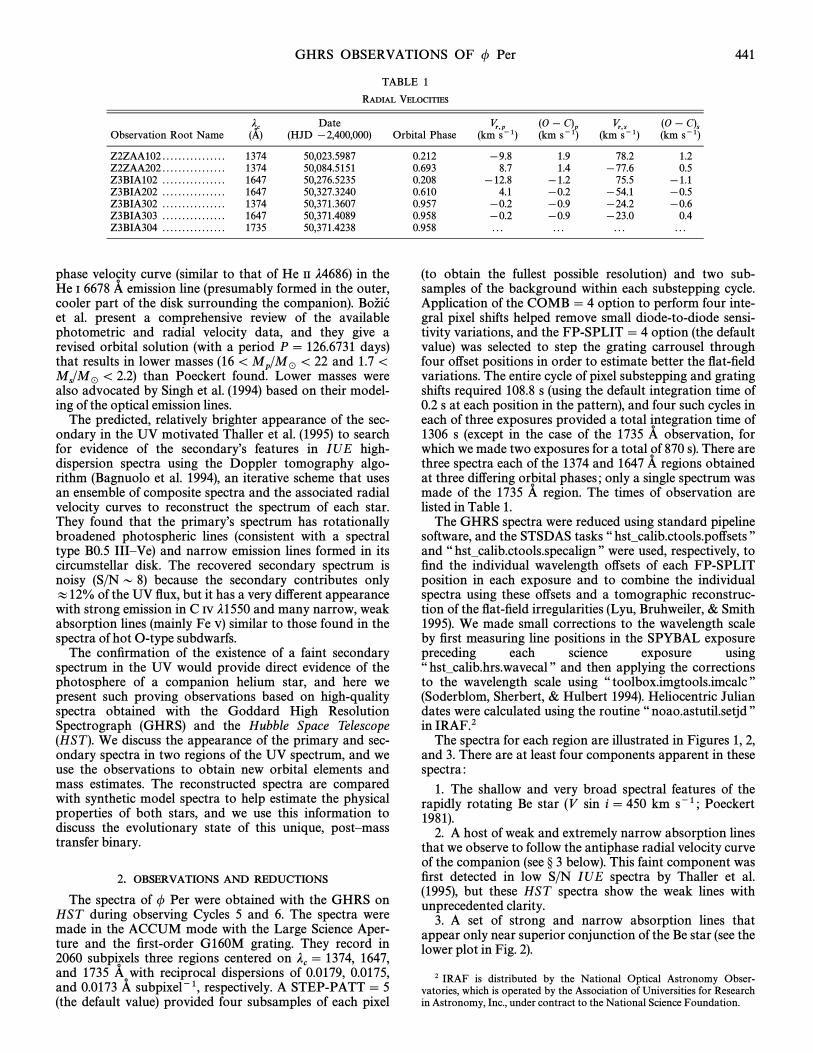
3. A set of strong and narrow absorption lines thatappear only near superior conjunction of the Be star (see thelower plot in Fig. 2).
2 IRAF is distributed by the National Optical Astronomy Obser-vatories, which is operated by the Association of Universities for Researchin Astronomy, Inc., under contract to the National Science Foundation.
1360 1370 1380 1390WAVELENGTH (ANGSTROMS)
0.0
0.5
1.0
1.5
2.0
2.5
3.0F
LUX
(10
-9 E
RG
CM
-2 S
-1 A
NG
ST
RO
M-1)
1630 1640 1650 1660WAVELENGTH (ANGSTROMS)
0.0
0.5
1.0
1.5
FLU
X (
10-9 E
RG
CM
-2 S
-1 A
NG
ST
RO
M-1)
1720 1730 1740 1750WAVELENGTH (ANGSTROMS)
0.0
0.5
1.0
1.5
FLU
X (
10-9 E
RG
CM
-2 S
-1 A
NG
ST
RO
M-1)
442 GIES ET AL. Vol. 493
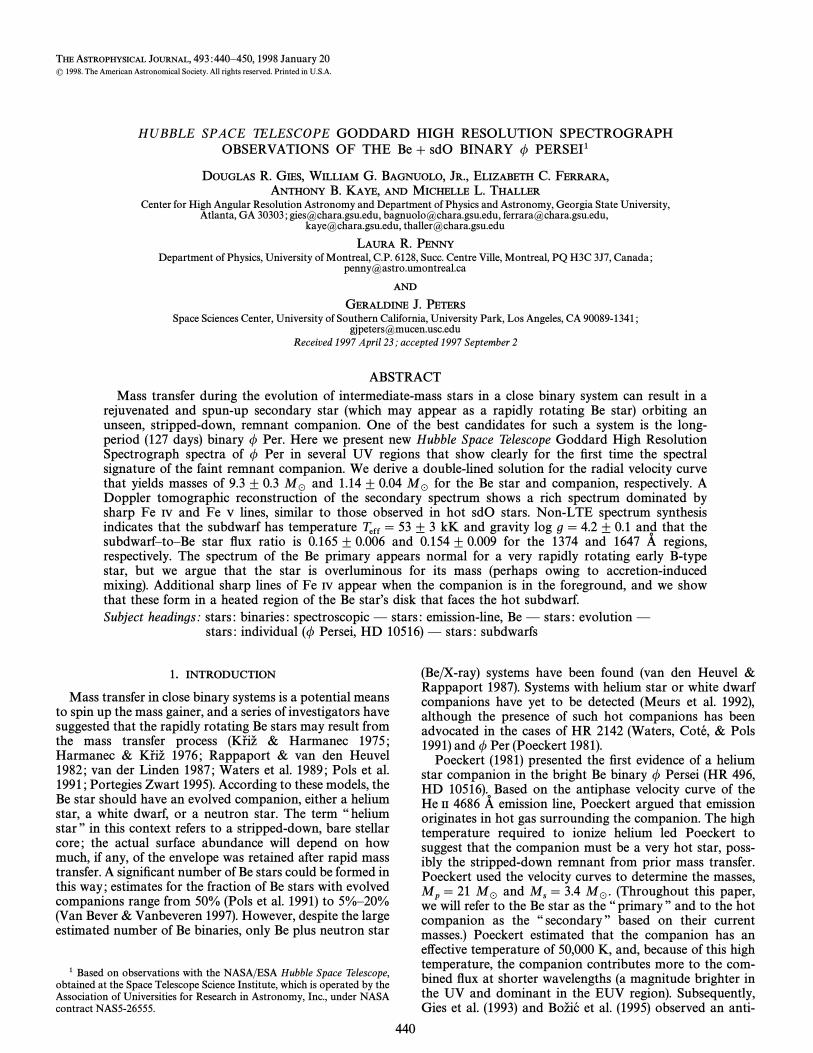
FIG. 1.ÈGHRS spectra of / Per in the 1374 region at orbital phasesA�0.212, 0.693, and 0.957 (from top to bottom, respectively). The spectra areo†set by 0.0, [0.3, and [0.6 units, respectively, for clarity.
4. Interstellar absorption lines (identiÐed in Table 2 ;from the list of Morton 1991).
We used the interstellar lines to help register the individ-ual spectra and then transform the spectra for each regiononto a standard grid suitable for radial velocity (see and° 3)
FIG. 2.ÈGHRS spectra of / Per in the 1647 region at orbital phasesA�0.208, 0.610, and 0.958 (from top to bottom). The spectra are o†set by 0.0,[0.3, and [0.6 units, respectively, for clarity. Note the appearance of deepshell lines in the lower plot.
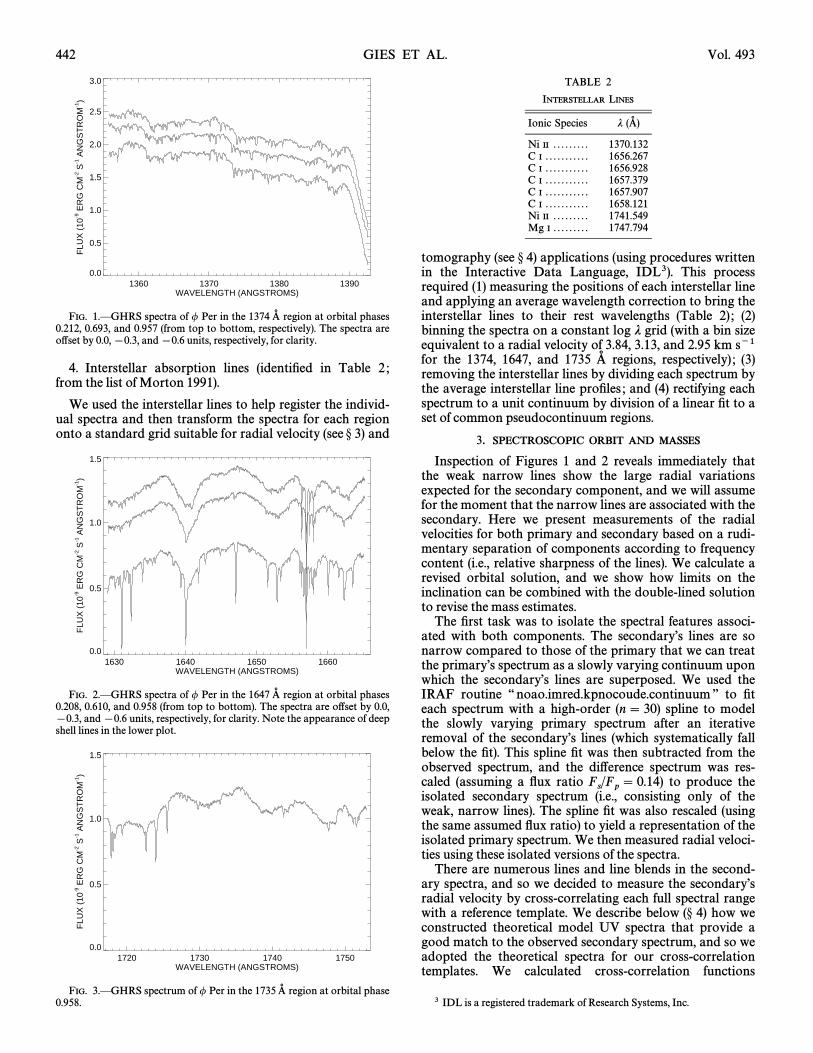
FIG. 3.ÈGHRS spectrum of / Per in the 1735 region at orbital phaseA�0.958.
TABLE 2
INTERSTELLAR LINES
Ionic Species j (A� )
Ni II . . . . . . . . . 1370.132C I . . . . . . . . . . . 1656.267C I . . . . . . . . . . . 1656.928C I . . . . . . . . . . . 1657.379C I . . . . . . . . . . . 1657.907C I . . . . . . . . . . . 1658.121Ni II . . . . . . . . . 1741.549Mg I . . . . . . . . . 1747.794
tomography (see applications (using procedures written° 4)in the Interactive Data Language, This processIDL3).required (1) measuring the positions of each interstellar lineand applying an average wavelength correction to bring theinterstellar lines to their rest wavelengths (2)(Table 2) ;binning the spectra on a constant log j grid (with a bin sizeequivalent to a radial velocity of 3.84, 3.13, and 2.95 km s~1for the 1374, 1647, and 1735 regions, respectively) ; (3)A�removing the interstellar lines by dividing each spectrum bythe average interstellar line proÐles ; and (4) rectifying eachspectrum to a unit continuum by division of a linear Ðt to aset of common pseudocontinuum regions.
3. SPECTROSCOPIC ORBIT AND MASSES
Inspection of Figures and reveals immediately that1 2the weak narrow lines show the large radial variationsexpected for the secondary component, and we will assumefor the moment that the narrow lines are associated with thesecondary. Here we present measurements of the radialvelocities for both primary and secondary based on a rudi-mentary separation of components according to frequencycontent (i.e., relative sharpness of the lines). We calculate arevised orbital solution, and we show how limits on theinclination can be combined with the double-lined solutionto revise the mass estimates.
The Ðrst task was to isolate the spectral features associ-ated with both components. The secondaryÏs lines are sonarrow compared to those of the primary that we can treatthe primaryÏs spectrum as a slowly varying continuum uponwhich the secondaryÏs lines are superposed. We used theIRAF routine ““ noao.imred.kpnocoude.continuum ÏÏ to Ðteach spectrum with a high-order (n \ 30) spline to modelthe slowly varying primary spectrum after an iterativeremoval of the secondaryÏs lines (which systematically fallbelow the Ðt). This spline Ðt was then subtracted from theobserved spectrum, and the di†erence spectrum was res-caled (assuming a Ñux ratio to produce theF
s/F
p\ 0.14)
isolated secondary spectrum (i.e., consisting only of theweak, narrow lines). The spline Ðt was also rescaled (usingthe same assumed Ñux ratio) to yield a representation of theisolated primary spectrum. We then measured radial veloci-ties using these isolated versions of the spectra.
There are numerous lines and line blends in the second-ary spectra, and so we decided to measure the secondaryÏsradial velocity by cross-correlating each full spectral rangewith a reference template. We describe below how we(° 4)constructed theoretical model UV spectra that provide agood match to the observed secondary spectrum, and so weadopted the theoretical spectra for our cross-correlationtemplates. We calculated cross-correlation functions
3 IDL is a registered trademark of Research Systems, Inc.
0.0 0.5 1.0ORBITAL PHASE
-50
0
50
RA
DIA
L V
ELO
CIT
Y (
km s
-1)
No. 1, 1998 GHRS OBSERVATIONS OF / Per 443
(CCFs) for essentially the full spectral range of each of the1374 region spectra and the Ðrst two 1647 spectra, butA� A�the full range could not be used in the Ðnal 1647 spectrumA�because of the predominance of the deep shell lines thatappear at this conjunction phase (see Instead, weFig. 2).selected two weak features in this last spectrum (Cr V
j1644.050 and Fe V j1654.744 ; see Figs. and below),10 11,that appear to have similar strength in all three 1647 A�region spectra and we calculated CCF velocities using awavelength range restricted to the immediate vicinity ofthese lines. No measurement was made for the secondaryvelocity in our single 1735 region spectrum (obtained atA�the same conjunction phase) because of possible confusionabout the origin of the narrow lines (see Our measured° 5).velocities, appear in Since we registered ourV
r,s, Table 1.spectra according to the rest wavelengths of the interstellarlines all these velocities are measured relative to the(° 2),mean ISM velocity along this line of sight.
We also measured primary-component radial velocitiesusing CCF methods, but we found that theoretical spectramade less satisfactory Ðts (see and so we used instead° 4),the average of the Ðtted primary spectra for the referencetemplate. These velocities were taken relative to the mea-sured velocity of the Ðnal 1374 region and 1647 regionA� A�spectra (which were obtained at essentially the same time inthe 127 day orbit), and they appear in with aTable 1 (V
r,p)small constant added ([0.24 km s~1) in order to equate theÐnal systemic velocities of both the primary and secondaryorbital solutions.
We Ðtted an orbital solution to these velocities in thefollowing way. Since the entire time span of observationcovers only a few orbits, we adopted the orbital period fromthe comprehensive study of et al. and weBoz— ic� (1995),assumed their result of a circular orbit (e\ 0). We used theprogram of & Brosterhus to then make aMorbey (1974)constrained Ðt for epoch of primary superior conjunction,
(following the phase convention of Boz— ic� et al.), semi-Tscamplitude, K, and systemic velocity, Our results areV0.compared in with those of Boz— ic� et al. (from theirTable 3Table 8, Solution 1, except for which comes from theirV0,Solution 2). We Ðrst made Ðts independently for both thesecondary and primary, and then, because the errors are somuch smaller for the secondary, we subsequently appliedthe value of from the secondary Ðt to the Ðt of theTscprimary (column titled ““ Joint ÏÏ in The ÐnalTable 3). V0(ISM) values of the primary and secondary Ðts were com-pared to convert the relative velocities of the primary to thesame system used for the secondary. The radial velocitiesand solutions are plotted in Figure 4.
The good Ðts of these velocities o†er an independent con-Ðrmation of the period and circular orbit advocated by
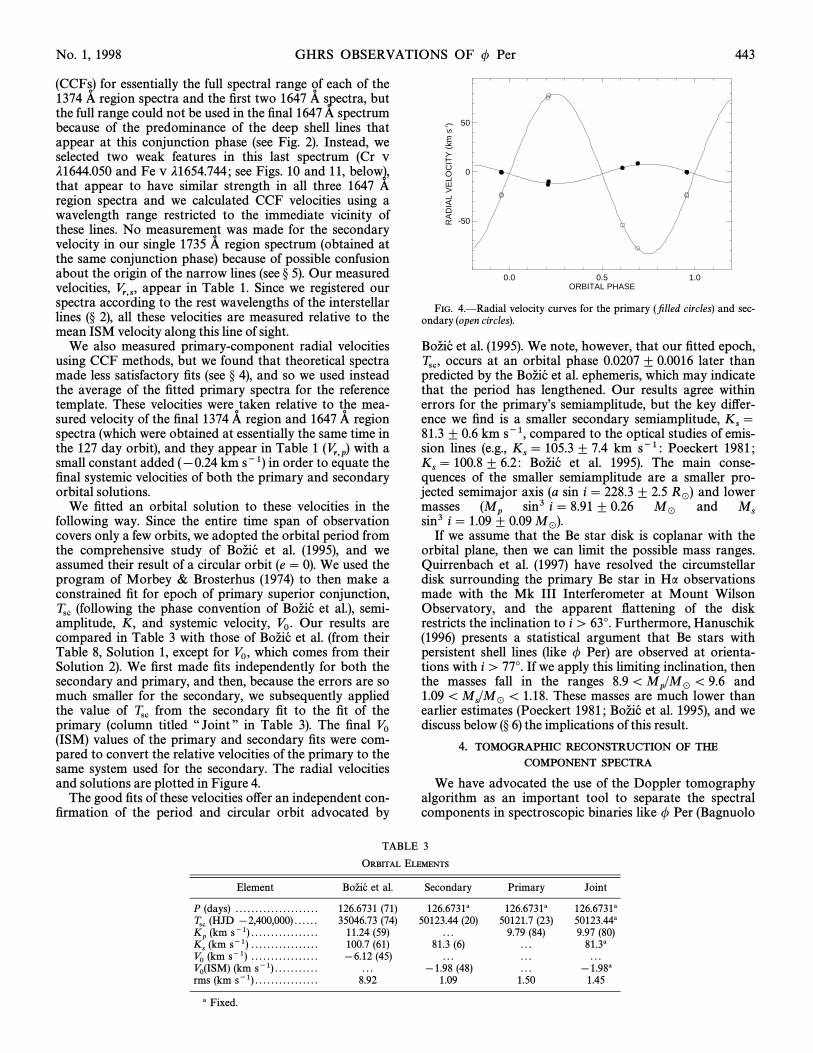
FIG. 4.ÈRadial velocity curves for the primary ( Ðlled circles) and sec-ondary (open circles).
et al. We note, however, that our Ðtted epoch,Boz— ic� (1995).occurs at an orbital phase 0.0207 ^ 0.0016 later thanTsc,predicted by the Boz— ic� et al. ephemeris, which may indicate
that the period has lengthened. Our results agree withinerrors for the primaryÏs semiamplitude, but the key di†er-ence we Ðnd is a smaller secondary semiamplitude, K
s\
81.3^ 0.6 km s~1, compared to the optical studies of emis-sion lines (e.g., km s~1 :K
s\ 105.3^ 7.4 Poeckert 1981 ;
et al. The main conse-Ks\ 100.8^ 6.2 : Boz— ic� 1995).
quences of the smaller semiamplitude are a smaller pro-jected semimajor axis (a sin i\ 228.3^ 2.5 and lowerR
_)
masses sin3 i\ 8.91^ 0.26 and(Mp
M_
Mssin3 i \ 1.09^ 0.09 M
_).
If we assume that the Be star disk is coplanar with theorbital plane, then we can limit the possible mass ranges.
et al. have resolved the circumstellarQuirrenbach (1997)disk surrounding the primary Be star in Ha observationsmade with the Mk III Interferometer at Mount WilsonObservatory, and the apparent Ñattening of the diskrestricts the inclination to i [ 63¡. Furthermore, Hanuschik
presents a statistical argument that Be stars with(1996)persistent shell lines (like / Per) are observed at orienta-tions with i [ 77¡. If we apply this limiting inclination, thenthe masses fall in the ranges and8.9\M
p/M
_\ 9.6
These masses are much lower than1.09\Ms/M
_\ 1.18.
earlier estimates et al. and we(Poeckert 1981 ; Boz— ic� 1995),discuss below the implications of this result.(° 6)
4. TOMOGRAPHIC RECONSTRUCTION OF THE
COMPONENT SPECTRA
We have advocated the use of the Doppler tomographyalgorithm as an important tool to separate the spectralcomponents in spectroscopic binaries like / Per (Bagnuolo
TABLE 3
ORBITAL ELEMENTS
Element Boz— ic� et al. Secondary Primary Joint
P (days) . . . . . . . . . . . . . . . . . . . . . 126.6731 (71) 126.6731a 126.6731a 126.6731aTsc (HJD [2,400,000) . . . . . . 35046.73 (74) 50123.44 (20) 50121.7 (23) 50123.44aK
p(km s~1) . . . . . . . . . . . . . . . . . 11.24 (59) . . . 9.79 (84) 9.97 (80)
Ks(km s~1) . . . . . . . . . . . . . . . . . 100.7 (61) 81.3 (6) . . . 81.3a
V0 (km s~1) . . . . . . . . . . . . . . . . . [6.12 (45) . . . . . . . . .V0(ISM) (km s~1) . . . . . . . . . . . . . . [1.98 (48) . . . [1.98arms (km s~1) . . . . . . . . . . . . . . . . 8.92 1.09 1.50 1.45
a Fixed.
1639.5 1640.0 1640.5 1641.0 1641.5WAVELENGTH (ANGSTROMS)
0.4
0.6
0.8
1.0
RE
LAT
IVE
FLU
X
444 GIES ET AL. Vol. 493
et al. et al. and we apply it here with1994 ; Thaller 1995),some cautionary notes. First, / Per presents a special casein which the stars appear to have very di†erent line widths,and we used this fact in the previous section to make arudimentary separation of components for each observedspectrum. However, it is possible that the secondary staralso has somewhat broader spectral features that are artiÐ-cially eliminated by the spline-Ðtting method describedabove, and therefore it is desirable to extract the componentspectra using an objective technique like tomography(which makes no special assumptions about the form orfrequency content of the reconstructed spectra). Second, ourearlier tomographic analysis of / Per et al.(Thaller 1995)demonstrated the importance of using a realistic startingmodel for the brighter component in systems with faintcompanions. Thus, we applied a ““ shift-and-add ÏÏ algorithmto the spline-Ðt extracted spectra described above to arriveat initial estimates for the primary and secondary spectra.Third, our previous applications of tomography were basedon a relatively large number of composite spectra (n [ 10)to reconstruct the two component spectra, and in this inves-tigation we have only three and two spectra available in the1374 and 1647 regions, respectively. Tests indicated thatA�high-frequency noise in the reconstructions was minimizedat approximately 10 iterations of the algorithm (for a gainof 0.8), and further iterations only increased the noise level.Thus, we limited the algorithm to 10 iterations. The Ðnalreconstructions based on the calculated radial velocityshifts from are presented below in Figures (the° 3 6È11secondaryÏs spectrum) and in Figures and (the13, 14, 15primaryÏs spectrum).
These portions of the UV spectra contain hundreds ofsigniÐcant spectral lines, and so we have studied the maincharacteristics of the reconstructed spectra through com-parison with synthetic model spectra for the two stars.These model spectra were calculated using the non-LTE(NLTE) model atmospheres code TLUSTY &(HubenyLanz and the companion spectrum synthesis program1995)SYNSPEC & Harmanec(Hubeny, S‹ teÑ, 1985 ; Hubeny,Lanz, & Je†ery 1994).
We constructed model atmospheres for the secondaryusing parameters very similar to those presented by Hubeny& Lanz for their model of a hot subdwarf. Our(1995)models, however, treat only H, He, C, N, and O in NLTE,and populations for other atoms are calculated assumingLTE (and thus our models do not account for potentiallyimportant NLTE e†ects in Fe ; see & LanzHubeny 1995).The models were calculated for a range in e†ective tem-perature and gravity, and we assumed solar abundancesand a uniform microturbulence (m \ 1 km s~1) throughout.These model atmospheres were then used as input toSYNSPEC together with atomic line lists from &KuruczBell The version of SYNSPEC we used accounts for(1995).atoms up to and including atomic number 30 (Zn). All thetransitions in the observed UV regions were treatedassuming LTE populations with the important exceptionsof O V j1371, He II j1640, and several other weaker C andN lines, where the NLTE populations from TLUSTY wereadopted. The Stark broadening of He II j1640 was calcu-lated at each depth point using detailed line proÐles from
& ButlerScho� ning (1989).The synthetic spectra from SYNSPEC were then modi-
Ðed into a form for direct comparison with the observ-ations. This process required rectiÐcation to unit
continuum (by division by a continuous spectrum calcu-lated by SYNSPEC), binning onto the same log j grid usedfor the observations, optionally convolving the spectrumwith a rotational broadening function (using linear limb-darkening coefficients from & Rucinski con-Wade 1985),volving the spectrum with the instrumental line-spreadfunction and then cross-correlating the(Gilliland 1994),model and reconstructed spectra to check the wavelengthregistration. The observed secondary lines are generallyunresolved in the reconstructed spectra, and the projectedrotational velocity of the secondary lines is so small (V sini \ 10 km s~1) that we neglected rotational broadening inthe Ðnal models.
Our goal was to calculate a representative model spec-trum for the secondary in order to investigate the basicproperties of the star (in particular, its fractional contribu-tion to the total UV Ñux). Our Ðnal model may not rep-resent a unique Ðt of the observed spectrum, but until theUV Ñux ratio of the components is better established (whichis directly related to the inferred secondary line depths), awider investigation is probably premature. For example, theabundances of subdwarf O stars are quite diverse &(BauerHusfeld and so our arbitrary choice of adopting solar1995),abundances is not an unreasonable starting point. Further-more, our choice of microturbulent velocity, m \ 1 km s~1,falls in the range (m \ 0È10 km s~1) found in hot subdwarfs
& Husfeld (although larger microturbulent(Bauer 1995)velocities might occur in mass transfer binaries).
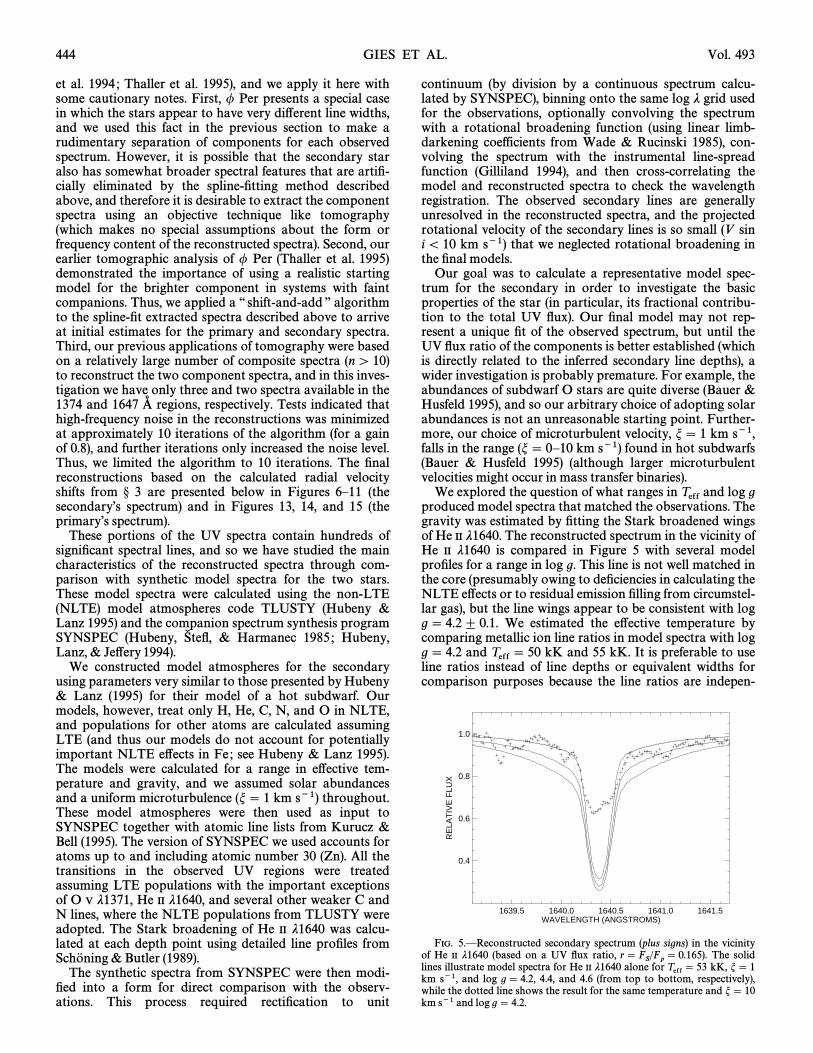
We explored the question of what ranges in and log gTeffproduced model spectra that matched the observations. Thegravity was estimated by Ðtting the Stark broadened wingsof He II j1640. The reconstructed spectrum in the vicinity ofHe II j1640 is compared in with several modelFigure 5proÐles for a range in log g. This line is not well matched inthe core (presumably owing to deÐciencies in calculating theNLTE e†ects or to residual emission Ðlling from circumstel-lar gas), but the line wings appear to be consistent with logg \ 4.2^ 0.1. We estimated the e†ective temperature bycomparing metallic ion line ratios in model spectra with logg \ 4.2 and kK and 55 kK. It is preferable to useTeff \ 50line ratios instead of line depths or equivalent widths forcomparison purposes because the line ratios are indepen-
FIG. 5.ÈReconstructed secondary spectrum (plus signs) in the vicinityof He II j1640 (based on a UV Ñux ratio, The solidr \ F
S/F
p\ 0.165).
lines illustrate model spectra for He II j1640 alone for kK, m \ 1Teff \ 53km s~1, and log g \ 4.2, 4.4, and 4.6 (from top to bottom, respectively),while the dotted line shows the result for the same temperature and m \ 10km s~1 and log g \ 4.2.
1358 1360 1362 1364 1366 1368WAVELENGTH (ANGSTROMS)
0.6
0.8
1.0
1.2
RE
LAT
IVE
FLU
X
Fe
V
1357
.679
Fe
V
1357
.854
Fe
V
1358
.565
Fe
V
1358
.967
Fe
V
1359
.006
Fe
V
1359
.405
Ni V
13
60.2
24
Fe
V
1361
.257
Fe
V
1361
.274
Fe
V
1361
.278
Fe
V
1361
.446
Fe
V
1361
.659
Fe
V
1361
.691
Fe
V
1361
.826
Fe
V
1362
.864
Fe
V
1363
.076
Fe
V
1363
.364
Fe
V
1363
.644
Fe
V
1363
.879
Fe
V
1364
.821
Fe
V
1365
.115
Fe
V
1365
.575
Fe
V
1365
.868
Fe
V
1366
.122
Fe
V
1367
.174
Ni V
13
68.3
69
1368 1370 1372 1374 1376 1378 1380WAVELENGTH (ANGSTROMS)
0.6
0.8
1.0
1.2
RE
LAT
IVE
FLU
X
Fe
V
1370
.302
Fe
VI
1370
.734
Fe
V
1370
.943
Fe
V
1371
.215
O V
13
71.2
96
Ni I
V
1371
.778
Fe
V
1371
.983
Fe
V
1372
.653
Fe
V
1373
.589
Fe
V
1373
.679
Fe
V
1373
.683
Fe
V
1373
.964
Fe
V
1374
.119
Fe
VI
1374
.629
Fe
V
1374
.788
Fe
V
1375
.790
Fe
V
1376
.337
Fe
V
1376
.451
Fe
V
1377
.718
Fe
V
1378
.088
Fe
V
1378
.561
Fe
V
1378
.578
Fe
V
1379
.040
1380 1382 1384 1386 1388 1390WAVELENGTH (ANGSTROMS)
0.6
0.8
1.0
1.2
RE
LAT
IVE
FLU
X
Fe
V
1380
.112
C II
I 13
81.6
52
Fe
V
1382
.420
Fe
V
1384
.058
Fe
V
1384
.200
Fe
V
1385
.312
Fe
V
1385
.684
Fe
V
1385
.694
Fe
V
1387
.095
Fe
V
1387
.095
N II
I 13
87.3
03N
III
1387
.382
Fe
V
1387
.403
Fe
V
1387
.937
N II
I 13
87.9
94F
e V
13
88.0
44F
e V
13
88.1
95F
e V
13
88.3
24
Fe
V
1388
.974
Fe
V
1389
.005
Fe
V
1390
.714
1630 1632 1634 1636 1638 1640 1642WAVELENGTH (ANGSTROMS)
0.2
0.4
0.6
0.8
1.0
1.2
1.4
RE
LAT
IVE
FLU
X
S IV
16
29.1
87F
e IV
162
9.20
3F
e IV
162
9.29
1F
e IV
163
0.11
0F
e IV
163
0.17
8F
e IV
163
0.36
8F
e IV
163
0.67
8F
e IV
163
1.07
7F
e IV
163
1.09
1F
e IV
163
1.55
7F
e IV
163
1.66
7F
e IV
163
2.08
2F
e IV
163
2.40
8
Fe
IV 1
633.
896
Si I
V
1634
.569
Si I
V
1634
.621
Fe
IV 1
634.
757
Fe
IV 1
635.
399
Fe
IV 1
635.
832
Fe
IV 1
638.
297
Cr
V
1638
.504
Cr
V
1639
.395
Fe
IV 1
639.
400
Fe
IV 1
640.
042
Fe
IV 1
640.
155
He
II 16
40.3
91F
e IV
164
0.78
4
Fe
IV 1
641.
864
No. 1, 1998 GHRS OBSERVATIONS OF / Per 445
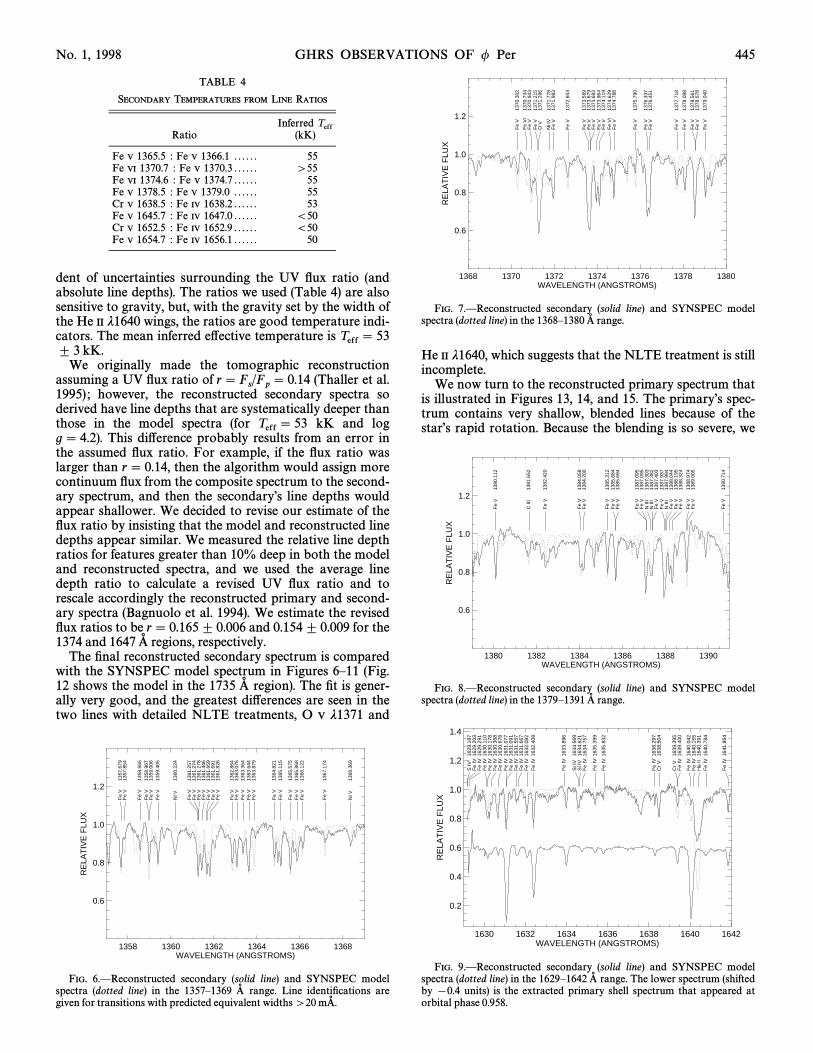
TABLE 4
SECONDARY TEMPERATURES FROM LINE RATIOS
Inferred TeffRatio (kK)
Fe V 1365.5 : Fe V 1366.1 . . . . . . 55Fe VI 1370.7 : Fe V 1370.3 . . . . . . [55Fe VI 1374.6 : Fe V 1374.7 . . . . . . 55Fe V 1378.5 : Fe V 1379.0 . . . . . . 55Cr V 1638.5 : Fe IV 1638.2 . . . . . . 53Fe V 1645.7 : Fe IV 1647.0 . . . . . . \50Cr V 1652.5 : Fe IV 1652.9 . . . . . . \50Fe V 1654.7 : Fe IV 1656.1 . . . . . . 50
dent of uncertainties surrounding the UV Ñux ratio (andabsolute line depths). The ratios we used are also(Table 4)sensitive to gravity, but, with the gravity set by the width ofthe He II j1640 wings, the ratios are good temperature indi-cators. The mean inferred e†ective temperature is Teff \ 53
kK.^ 3We originally made the tomographic reconstruction
assuming a UV Ñux ratio of et al.r \Fs/F
p\ 0.14 (Thaller
however, the reconstructed secondary spectra so1995) ;derived have line depths that are systematically deeper thanthose in the model spectra (for kK and logTeff \ 53g \ 4.2). This di†erence probably results from an error inthe assumed Ñux ratio. For example, if the Ñux ratio waslarger than r \ 0.14, then the algorithm would assign morecontinuum Ñux from the composite spectrum to the second-ary spectrum, and then the secondaryÏs line depths wouldappear shallower. We decided to revise our estimate of theÑux ratio by insisting that the model and reconstructed linedepths appear similar. We measured the relative line depthratios for features greater than 10% deep in both the modeland reconstructed spectra, and we used the average linedepth ratio to calculate a revised UV Ñux ratio and torescale accordingly the reconstructed primary and second-ary spectra et al. We estimate the revised(Bagnuolo 1994).Ñux ratios to be r \ 0.165^ 0.006 and 0.154^ 0.009 for the1374 and 1647 regions, respectively.A�
The Ðnal reconstructed secondary spectrum is comparedwith the SYNSPEC model spectrum in Figures 6È11 (Fig.
shows the model in the 1735 region). The Ðt is gener-12 A�ally very good, and the greatest di†erences are seen in thetwo lines with detailed NLTE treatments, O V j1371 and
FIG. 6.ÈReconstructed secondary (solid line) and SYNSPEC modelspectra (dotted line) in the 1357È1369 range. Line identiÐcations areA�given for transitions with predicted equivalent widths [20 mA� .
FIG. 7.ÈReconstructed secondary (solid line) and SYNSPEC modelspectra (dotted line) in the 1368È1380 range.A�
He II j1640, which suggests that the NLTE treatment is stillincomplete.
We now turn to the reconstructed primary spectrum thatis illustrated in Figures and The primaryÏs spec-13, 14, 15.trum contains very shallow, blended lines because of thestarÏs rapid rotation. Because the blending is so severe, we
FIG. 8.ÈReconstructed secondary (solid line) and SYNSPEC modelspectra (dotted line) in the 1379È1391 range.A�
FIG. 9.ÈReconstructed secondary (solid line) and SYNSPEC modelspectra (dotted line) in the 1629È1642 range. The lower spectrum (shiftedA�by [0.4 units) is the extracted primary shell spectrum that appeared atorbital phase 0.958.
1642 1644 1646 1648 1650 1652WAVELENGTH (ANGSTROMS)
0.2
0.4
0.6
0.8
1.0
1.2
1.4R
ELA
TIV
E F
LUX
Fe
IV 1
641.
864
Fe
IV 1
642.
179
Fe
IV 1
642.
776
Fe
IV 1
642.
875
Fe
V
1643
.426
Cr
V
1644
.050
Fe
IV 1
644.
939
C II
I 16
45.0
33
Fe
V
1645
.741
Fe
IV 1
647.
093
Fe
V
1649
.599
Fe
IV 1
649.
996
Fe
IV 1
650.
749
Fe
IV 1
651.
576
Cr
V
1652
.598
Fe
IV 1
652.
902
1652 1654 1656 1658 1660 1662 1664WAVELENGTH (ANGSTROMS)
0.2
0.4
0.6
0.8
1.0
1.2
1.4
RE
LAT
IVE
FLU
X
Cr
V
1652
.598
Fe
IV 1
652.
902
Fe
V
1653
.251
Fe
IV 1
653.
407
Fe
V
1654
.744
Cr
V
1655
.640
Fe
IV 1
656.
111
Fe
IV 1
656.
652
Fe
IV 1
657.
370
Fe
IV 1
657.
828
Fe
IV 1
658.
246
Fe
IV 1
658.
433
Fe
IV 1
659.
004
Fe
IV 1
660.
103
O II
I 16
60.8
09
Fe
IV 1
661.
573
Fe
IV 1
662.
319
Fe
IV 1
662.
519
Fe
IV 1
663.
543
1720 1725 1730 1735 1740 1745 1750WAVELENGTH (ANGSTROMS)
0.2
0.4
0.6
0.8
1.0
1.2
1.4
RE
LAT
IVE
FLU
X
Fe
IV 1
717.
895
Fe
IV 1
718.
163
Fe
IV 1
718.
407
N IV
17
18.5
50F
e IV
171
9.46
7F
e IV
172
0.49
4F
e IV
172
1.65
7S
i IV
17
22.5
26S
i IV
17
22.5
62F
e IV
172
2.71
0F
e IV
172
4.05
5F
e IV
172
4.26
3F
e IV
172
5.62
7S
i IV
17
27.3
76N
III
1729
.834
N II
I 17
29.8
97N
III
1729
.945
N II
I 17
30.0
02F
e IV
173
0.33
1F
e V
17
30.8
64F
e IV
173
1.23
3F
e IV
173
2.93
5
Mg
III17
38.8
34
S IV
17
45.4
14
Mg
III17
47.5
55N
III
1747
.848
N II
I 17
51.2
18F
e IV
175
1.29
0N
III
1751
.657
1360 1370 1380 1390WAVELENGTH (ANGSTROMS)
0.0
0.2
0.4
0.6
0.8
1.0
1.2
RE
LAT
IVE
FLU
X
Si I
II13
61.5
96S
i III
1362
.361
Si I
II13
63.4
59S
i III
1363
.504
Si I
II13
65.2
53S
i III
1365
.292
Si I
II13
67.0
47
Si I
II13
69.4
32
Si I
II13
73.0
27S
III
1374
.013
S II
I 13
75.0
17
Al I
II13
79.6
70
C II
13
83.9
96A
l III
1384
.132
C II
13
84.3
55
Si I
II13
88.0
11
Si I
V
1393
.755
1630 1640 1650 1660WAVELENGTH (ANGSTROMS)
0.0
0.2
0.4
0.6
0.8
1.0
1.2R
ELA
TIV
E F
LUX
S IV
16
29.1
87
Fe
IV 1
631.
077
Fe
IV 1
632.
408
Fe
IV 1
640.
042
Fe
IV 1
640.
155
He
II 16
40.3
91
C II
I 16
45.0
33
Fe
IV 1
647.
093
Ni I
II16
49.7
72
Fe
IV 1
651.
576
Ni I
II16
52.8
65F
e IV
165
2.90
2N
i III
1653
.122
Ni I
II16
56.1
28F
e IV
165
6.65
2F
e IV
165
7.82
8
Fe
IV 1
660.
103
O II
I 16
60.8
09N
i III
1661
.784
Fe
IV 1
662.
319
Fe
IV 1
663.
543
1720 1725 1730 1735 1740 1745 1750WAVELENGTH (ANGSTROMS)
0.0
0.2
0.4
0.6
0.8
1.0
1.2
RE
LAT
IVE
FLU
X
Ni I
II17
18.8
77N
i III
1719
.454
Ni I
II17
19.8
86C
II
1720
.456
Ni I
II17
20.7
10C
II
1721
.012
Ni I
II17
21.2
43C
II
1721
.682
Ni I
II17
22.2
74S
i IV
17
22.5
26F
e III
1722
.841
Ni I
II17
23.7
80F
e IV
172
4.05
5N
i III
1724
.297
Ni I
II17
24.5
18F
e IV
172
5.62
7S
i IV
17
27.3
76N
i III
1729
.386
Ni I
II17
30.4
82F
e III
1730
.844
Ni I
II17
33.1
24N
i III
1733
.761
Ni I
II17
38.2
50F
e III
1738
.465
Ni I
II17
38.7
96
Ni I
II17
41.9
99
Fe
III17
44.2
21F
e III
1745
.635
Ni I
II17
47.0
05F
e III
1747
.258
Ni I
II17
47.6
74N
III
1747
.848
Fe
III17
48.1
74F
e III
1749
.040
N II
I 17
49.6
74N
III
1751
.218
N II
I 17
51.6
57
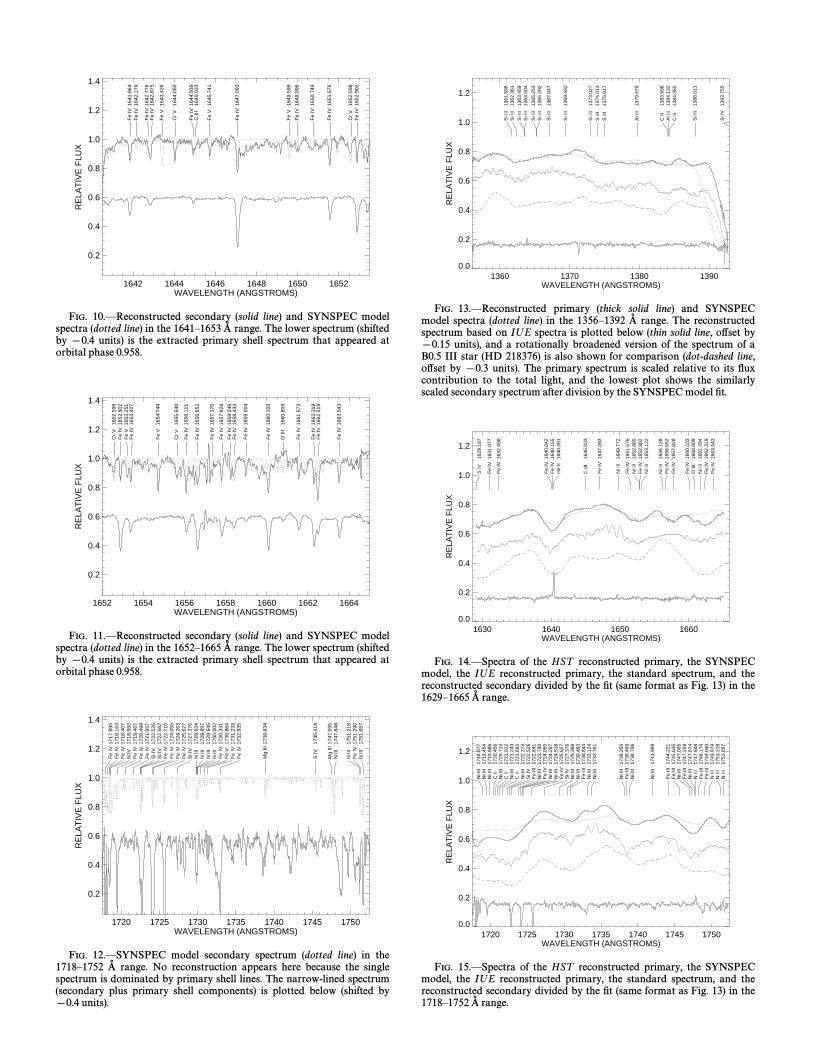
FIG. 10.ÈReconstructed secondary (solid line) and SYNSPEC modelspectra (dotted line) in the 1641È1653 range. The lower spectrum (shiftedA�by [0.4 units) is the extracted primary shell spectrum that appeared atorbital phase 0.958.
FIG. 11.ÈReconstructed secondary (solid line) and SYNSPEC modelspectra (dotted line) in the 1652È1665 range. The lower spectrum (shiftedA�by [0.4 units) is the extracted primary shell spectrum that appeared atorbital phase 0.958.
FIG. 12.ÈSYNSPEC model secondary spectrum (dotted line) in the1718È1752 range. No reconstruction appears here because the singleA�spectrum is dominated by primary shell lines. The narrow-lined spectrum(secondary plus primary shell components) is plotted below (shifted by[0.4 units).
FIG. 13.ÈReconstructed primary (thick solid line) and SYNSPECmodel spectra (dotted line) in the 1356È1392 range. The reconstructedA�spectrum based on IUE spectra is plotted below (thin solid line, o†set by[0.15 units), and a rotationally broadened version of the spectrum of aB0.5 III star (HD 218376) is also shown for comparison (dot-dashed line,o†set by [0.3 units). The primary spectrum is scaled relative to its Ñuxcontribution to the total light, and the lowest plot shows the similarlyscaled secondary spectrum after division by the SYNSPEC model Ðt.
FIG. 14.ÈSpectra of the HST reconstructed primary, the SYNSPECmodel, the IUE reconstructed primary, the standard spectrum, and thereconstructed secondary divided by the Ðt (same format as in theFig. 13)1629È1665 range.A�
FIG. 15.ÈSpectra of the HST reconstructed primary, the SYNSPECmodel, the IUE reconstructed primary, the standard spectrum, and thereconstructed secondary divided by the Ðt (same format as in theFig. 13)1718È1752 range.A�
.00
.25
.50
.75
GHRS OBSERVATIONS OF / Per 447
decided to calculate a synthetic spectrum with TLUSTYand SYNSPEC using parameters based on the spectral typeof the primary rather than trying to Ðt models for a range inparameters. Based on the UV appearance et al.(Thaller
the classiÐcation is B0.5 IIIÈVe, which is somewhat1995),earlier than the optical types of B2 Vep R. F.(Lesh 1968 ;Garrison 1997, private communication) or B1.5 (V :)e-shell
A temperature for a B0.5 V star of(Slettebak 1982). Teff \29,300 K occupies the midrange from a variety of cali-brations et al.(Lesh 1977 ; Underhill 1979 ; Bo� hm-Vitense
Garmany, & Shull The gravity is log1981 ; Vacca, 1996).g \ 3.7 for the mass found above and a radius of(° 3)
We calculated a model atmo-RpD 7 R
_(Harmanec 1988).
sphere for these parameters (plus solar abundances andm \ 0) using a TLUSTY model similar to the one describedby & Lanz for a B supergiant in which onlyHubeny (1995)H and He are treated in NLTE. The synthetic spectrum wasconvolved with a rotational broadening function for V sini\ 450 km s~1 (Poeckert 1981).
The reconstructed and model primary spectra are com-pared in Figures and (the spectrum in the 173513, 14, 15 A�region, is the spline Ðt to the broad component inFig. 15,this region ; see Individual lines with calculated equiva-° 3).lent widths [30 are marked above the spectrum. WemA�also show the reconstruction based on IUE spectra (Thalleret al. which are generally in good agreement with1995),GHRS results except for an apparent disappearance in thelatter of several emission lines (near 1649 and 1733 andA� )weak shell absorption lines in the 1735 region. TheA�weakening of these features in the modern spectra is prob-ably consistent with the secular decrease in the strength ofall the spectral features related to the disk surrounding theprimary et al. A third comparison is made in(Boz— ic� 1995).these Ðgures with an IUE spectrum (SWP05362) of the B0.5III star, HD 218376 \ 1 Cas & Sonneborn(Rountree 1993).This is a relatively slowly rotating star (V sin i \ 44 km s~1 ;
& Lambert and we have convolved its spectrumGies 1992),with a rotational broadening function for V sin i \ 450 kms~1 for comparison with the primaryÏs spectrum (note thatthe IUE spectra were interpolated across the interstellar C I
j1657 feature and are not reliable in that vicinity). The goodagreement between the ““ spun-up ÏÏ spectrum of HD 218376and the reconstructed spectrum of the primary star indi-cates that the primaryÏs spectrum in these UV sectionsappears normal for a star of its spectral classiÐcation andprojected rotational velocity.
5. SHELL LINES AT CONJUNCTION
We noted in the remarkable appearance of deep,° 2narrow lines in the 1647 region at orbital phase 0.958 (seeA�
The spectrum made at the same time in the 1374Fig. 2). A�region shows no such change The extreme depth of(Fig. 1).these lines (some remove more than 50% of the Ñux) indi-cates that additional material is absorbing the light of themuch brighter primary star at that phase, and because oftheir narrow appearance, we will refer to them as primarystar ““ shell ÏÏ lines. We attempted to isolate this additionalshell spectrum by Ðrst subtracting the reconstructed sec-ondary spectrum (shifted to the secondaryÏs velocity at thatphase) and then dividing by the reconstructed primary spec-trum (again shifted to the appropriate velocity) to produce anormalized version of the shell spectrum. We cross-correlated the shell spectrum with a synthetic spectrum (for
kK, log g \ 4.0, and solar abundances), and weTeff \ 40
found that the spectrum displays a radial velocity of [11.7km s~1 (again relative to the mean ISM velocity along thisline of sight). This shell spectrum (shifted to the rest frame)appears as the lower plot in Figures and and9, 10, 11,almost all the lines appear to be transitions of Fe IV. Wereexamined the archival IUE spectra available near thisorbital phase, but unfortunately the low S/N ratio of thesespectra precludes any statement about the visibility of theshell lines at that time.
Several strong absorption lines are also present in the1735 region which was observed at this sameA� (Fig. 3),phase. However, because we have only a single spectrum ofthis region, it is difficult to associate the narrow lines witheither the secondary or the shell spectrum. We assumed forthe purposes of illustration that the secondary is featurelessin this region, and we then subtracted its Ñux (for anextrapolated Ñux ratio of r \ 0.151 in this region) anddivided by the spline Ðt of the primaryÏs broadened spec-trum (see to yield again a ““ shell ÏÏ spectrum as we did for° 3)the 1647 region. The cross-correlation velocity for thisA�shell spectrum relative to the model secondary spectrum is[7.4 km s~1 (similar to that found for the 1647 region),A�and we plot in the predicted SYNSPEC spectrumFigure 12for the secondary together with the derived shell spectrum(shifted to the rest frame). Some of the predicted secondarylines appear to be present in the composite narrow-linedspectrum (e.g., Si IV j1727), but most of the strong lines areagain Fe IV transitions that presumably have a commonorigin with the shell lines in the 1647 region.A�
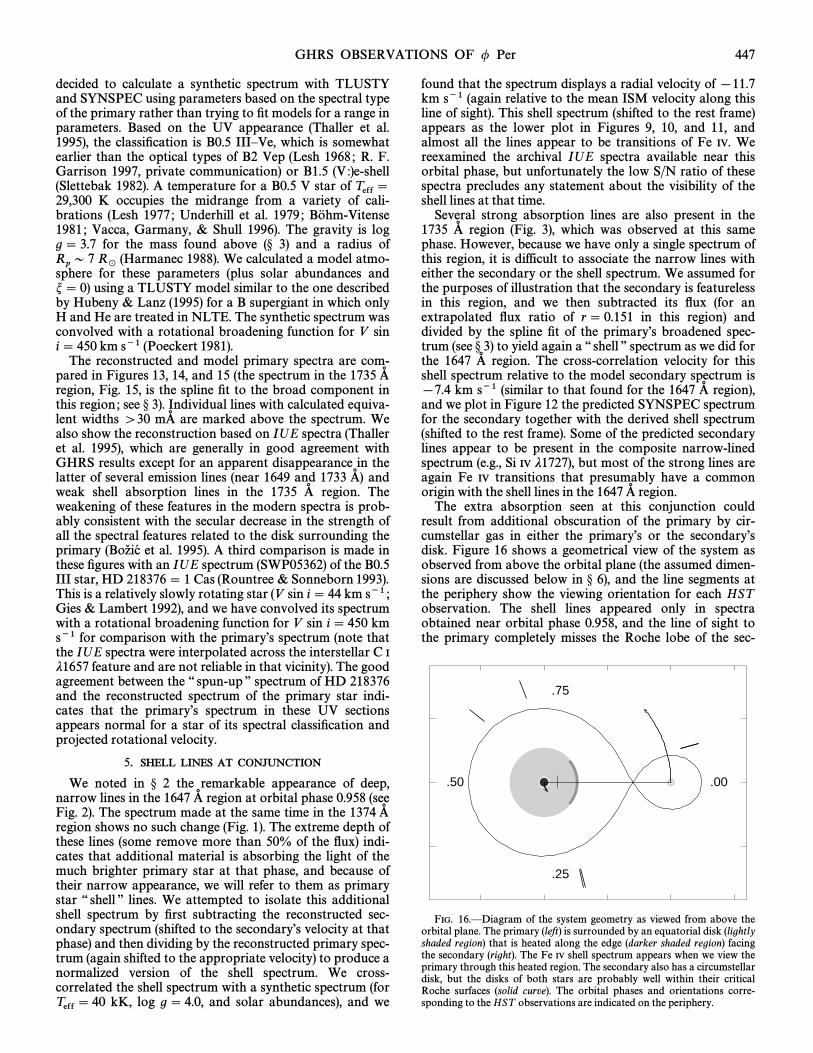
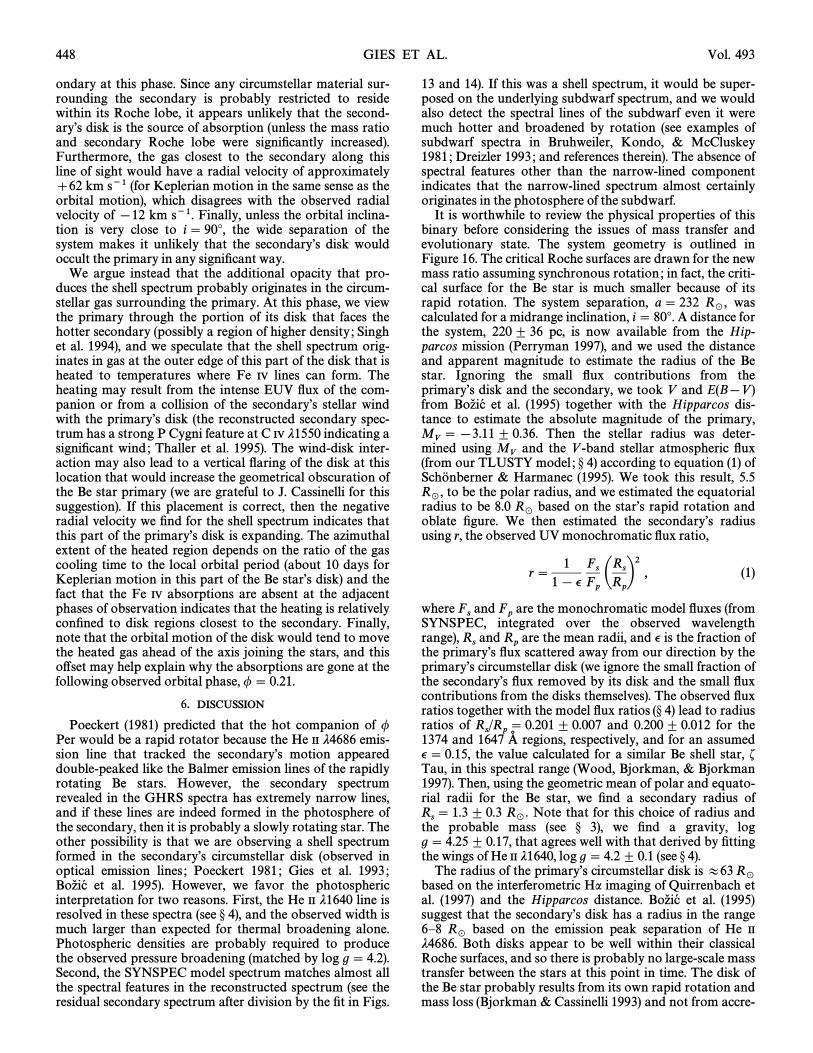
The extra absorption seen at this conjunction couldresult from additional obscuration of the primary by cir-cumstellar gas in either the primaryÏs or the secondaryÏsdisk. shows a geometrical view of the system asFigure 16observed from above the orbital plane (the assumed dimen-sions are discussed below in and the line segments at° 6),the periphery show the viewing orientation for each HSTobservation. The shell lines appeared only in spectraobtained near orbital phase 0.958, and the line of sight tothe primary completely misses the Roche lobe of the sec-
FIG. 16.ÈDiagram of the system geometry as viewed from above theorbital plane. The primary (left) is surrounded by an equatorial disk (lightlyshaded region) that is heated along the edge (darker shaded region) facingthe secondary (right). The Fe IV shell spectrum appears when we view theprimary through this heated region. The secondary also has a circumstellardisk, but the disks of both stars are probably well within their criticalRoche surfaces (solid curve). The orbital phases and orientations corre-sponding to the HST observations are indicated on the periphery.
448 GIES ET AL. Vol. 493
ondary at this phase. Since any circumstellar material sur-rounding the secondary is probably restricted to residewithin its Roche lobe, it appears unlikely that the second-aryÏs disk is the source of absorption (unless the mass ratioand secondary Roche lobe were signiÐcantly increased).Furthermore, the gas closest to the secondary along thisline of sight would have a radial velocity of approximately]62 km s~1 (for Keplerian motion in the same sense as theorbital motion), which disagrees with the observed radialvelocity of [12 km s~1. Finally, unless the orbital inclina-tion is very close to i\ 90¡, the wide separation of thesystem makes it unlikely that the secondaryÏs disk wouldoccult the primary in any signiÐcant way.
We argue instead that the additional opacity that pro-duces the shell spectrum probably originates in the circum-stellar gas surrounding the primary. At this phase, we viewthe primary through the portion of its disk that faces thehotter secondary (possibly a region of higher density ; Singhet al. and we speculate that the shell spectrum orig-1994),inates in gas at the outer edge of this part of the disk that isheated to temperatures where Fe IV lines can form. Theheating may result from the intense EUV Ñux of the com-panion or from a collision of the secondaryÏs stellar windwith the primaryÏs disk (the reconstructed secondary spec-trum has a strong P Cygni feature at C IV j1550 indicating asigniÐcant wind ; et al. The wind-disk inter-Thaller 1995).action may also lead to a vertical Ñaring of the disk at thislocation that would increase the geometrical obscuration ofthe Be star primary (we are grateful to J. Cassinelli for thissuggestion). If this placement is correct, then the negativeradial velocity we Ðnd for the shell spectrum indicates thatthis part of the primaryÏs disk is expanding. The azimuthalextent of the heated region depends on the ratio of the gascooling time to the local orbital period (about 10 days forKeplerian motion in this part of the Be starÏs disk) and thefact that the Fe IV absorptions are absent at the adjacentphases of observation indicates that the heating is relativelyconÐned to disk regions closest to the secondary. Finally,note that the orbital motion of the disk would tend to movethe heated gas ahead of the axis joining the stars, and thiso†set may help explain why the absorptions are gone at thefollowing observed orbital phase, /\ 0.21.
6. DISCUSSION
predicted that the hot companion of /Poeckert (1981)Per would be a rapid rotator because the He II j4686 emis-sion line that tracked the secondaryÏs motion appeareddouble-peaked like the Balmer emission lines of the rapidlyrotating Be stars. However, the secondary spectrumrevealed in the GHRS spectra has extremely narrow lines,and if these lines are indeed formed in the photosphere ofthe secondary, then it is probably a slowly rotating star. Theother possibility is that we are observing a shell spectrumformed in the secondaryÏs circumstellar disk (observed inoptical emission lines ; et al.Poeckert 1981 ; Gies 1993 ;
et al. However, we favor the photosphericBoz— ic� 1995).interpretation for two reasons. First, the He II j1640 line isresolved in these spectra (see and the observed width is° 4),much larger than expected for thermal broadening alone.Photospheric densities are probably required to producethe observed pressure broadening (matched by log g \ 4.2).Second, the SYNSPEC model spectrum matches almost allthe spectral features in the reconstructed spectrum (see theresidual secondary spectrum after division by the Ðt in Figs.
and If this was a shell spectrum, it would be super-13 14).posed on the underlying subdwarf spectrum, and we wouldalso detect the spectral lines of the subdwarf even it weremuch hotter and broadened by rotation (see examples ofsubdwarf spectra in Kondo, & McCluskeyBruhweiler,
and references therein). The absence of1981 ; Dreizler 1993 ;spectral features other than the narrow-lined componentindicates that the narrow-lined spectrum almost certainlyoriginates in the photosphere of the subdwarf.
It is worthwhile to review the physical properties of thisbinary before considering the issues of mass transfer andevolutionary state. The system geometry is outlined in
The critical Roche surfaces are drawn for the newFigure 16.mass ratio assuming synchronous rotation ; in fact, the criti-cal surface for the Be star is much smaller because of itsrapid rotation. The system separation, a \ 232 wasR
_,
calculated for a midrange inclination, i \ 80¡. A distance forthe system, 220 ^ 36 pc, is now available from the Hip-parcos mission and we used the distance(Perryman 1997),and apparent magnitude to estimate the radius of the Bestar. Ignoring the small Ñux contributions from theprimaryÏs disk and the secondary, we took V and E(B[V )from et al. together with the Hipparcos dis-Boz— ic� (1995)tance to estimate the absolute magnitude of the primary,
Then the stellar radius was deter-MV
\[3.11 ^ 0.36.mined using and the V -band stellar atmospheric ÑuxM
V(from our TLUSTY model ; according to equation (1) of° 4)& Harmanec We took this result, 5.5Scho� nberner (1995).
to be the polar radius, and we estimated the equatorialR_
,radius to be 8.0 based on the starÏs rapid rotation andR
_oblate Ðgure. We then estimated the secondaryÏs radiususing r, the observed UV monochromatic Ñux ratio,
r \ 11 [ v
Fs
Fp
ARs
Rp
B2, (1)
where and are the monochromatic model Ñuxes (fromFs
FpSYNSPEC, integrated over the observed wavelength
range), and are the mean radii, and v is the fraction ofRs
Rpthe primaryÏs Ñux scattered away from our direction by the
primaryÏs circumstellar disk (we ignore the small fraction ofthe secondaryÏs Ñux removed by its disk and the small Ñuxcontributions from the disks themselves). The observed Ñuxratios together with the model Ñux ratios lead to radius(° 4)ratios of and 0.200 ^ 0.012 for theR
s/R
p\ 0.201^ 0.007
1374 and 1647 regions, respectively, and for an assumedA�v\ 0.15, the value calculated for a similar Be shell star, fTau, in this spectral range Bjorkman, & Bjorkman(Wood,
Then, using the geometric mean of polar and equato-1997).rial radii for the Be star, we Ðnd a secondary radius of
Note that for this choice of radius andRs\ 1.3 ^ 0.3 R
_.
the probable mass (see we Ðnd a gravity, log° 3),g \ 4.25^ 0.17, that agrees well with that derived by Ðttingthe wings of He II j1640, log g \ 4.2^ 0.1 (see ° 4).
The radius of the primaryÏs circumstellar disk is B63 R_based on the interferometric Ha imaging of etQuirrenbach
al. and the Hipparcos distance. et al.(1997) Boz— ic� (1995)suggest that the secondaryÏs disk has a radius in the range6È8 based on the emission peak separation of He IIR
_j4686. Both disks appear to be well within their classicalRoche surfaces, and so there is probably no large-scale masstransfer between the stars at this point in time. The disk ofthe Be star probably results from its own rapid rotation andmass loss & Cassinelli and not from accre-(Bjorkman 1993)
No. 1, 1998 GHRS OBSERVATIONS OF / Per 449
tion from the companion. et al. suggest thatBoz— ic� (1995)there may be active mass transfer from the subdwarf to theBe star at present, but we doubt this for several reasons. Thesubdwarf appears to be rotating much too slowly to create aBe-type disk, and this suggests that its disk is formedinstead by matter trickling in from the primaryÏs extensivedisk. This picture is reinforced by our observation that theshell lines formed in the outer parts of the primaryÏs diskthat face the subdwarf display an apparent outÑow (see ° 5),and gas originating here could cross the gap between thestars to create a disk around the subdwarf.
The results presented here indicate that / Per is a postÈmass transfer binary in which the initially more massive starhas transferred much of its mass and angular momentum toits companion. Thus, / Per o†ers one key example in whicha Be star has formed as the result of close binary evolution.
has outlined an evolutionary scenarioVanbeveren (1996)for / Per that starts with a 10 pair with a 4.4M
_] 9 M
_day orbital period. The system undergoes a Ðrst phase ofCase B Roche lobe overÑow that reverses the mass ratioand increases the orbital period by an order of magnitude (bLyr may represent a binary at this stage of evolution ;
et al. Then, either a second Roche lobeBalachandran 1986).overÑow phase begins (Case BB; & ThomasDelgado 1981)or the mass loser enters a phase of vigorous mass loss bystellar wind to lengthen the orbital period to the observedvalue. Vanbeveren notes that the mass gainer, the Be star,may su†er accretion-induced mixing that would lead to alarge overluminosity for its mass. We can compare theprimaryÏs mass with those determined from well-studiedbinary systems in the diagram presented by(log Teff,MV
)& Harmanec their Fig. 2). For logScho� nberner (1995 ;
(from both the spectral classiÐcation andTeff \ 4.47 ^ 0.03intrinsic color) and we would expect aM
V\ [3.11^ 0.36,
stellar mass of much larger than ourMp/M
_\ 14 ^ 2,
result, so we suspect that the Be star is8.9\Mp/M
_\ 9.6,
indeed overluminous for its mass.The chemical abundances of the stars may also o†er a
clue to their mass transfer history. Unfortunately, the Bestar spectrum is so broadened by rotation that measure-ments of individual line strengths are very difficult becauseof blending ; however, simple inspection of the recon-structed primary and standard spectra (Figs. and13, 14, 15)indicates no obviously unusual line strengths. More work isneeded to measure abundances in the subdwarf spectrum
(especially better NLTE treatment of O V j1371 and He II
j1640), but we note that some C and O lines appear weakerthan predicted for solar abundances (C III jj1381.652,1645.033 ; O III j1660.809) while N looks stronger (N III
jj1387.303, 1387.382, 1387.994) in accordance with expec-tations for CNO processed material.
The GHRS spectra have revealed the companion to bethe brightest sdO star in the sky and perhaps also the mostmassive (see the cases of the binaries HD 49798 : et al.Israel
and HD 128220 : & Heber The exten-1997 ; Howarth 1990).sive mass loss that led to its creation was probably thesource of much of the increased mass and angular momen-tum we Ðnd now in the Be star (which is rotating at close toits critical break-up speed). The hot companion star is prob-ably destined to become a white dwarf since its mass is wellbelow the Chandrasekhar limit. However, when the Be stareventually swells and begins a phase of reverse mass trans-fer, the system will likely enter a common envelope phasewhose outcome is very uncertain. Observations of / Pero†er us a unique opportunity to study the outcome of closebinary processes at a critical point in the evolutionarysequence.
We are grateful to Ivan Hubeny for sharing with us hiscodes TLUSTY and SYNSPEC and for his frequent adviceon their use. We also thank R. Kurucz for sending us hisatomic line data on CD-ROM. We would like to expressour gratitude to J. Bjorkman, J. Cassinelli, and D. Vanbe-veren for their helpful comments. We thank also DeniseTaylor and the sta† of the Space Telescope Science Institutefor their help in obtaining these observations. This researchhas made use of the SIMBAD database, operated at CDS,Strasbourg, France.
Support for this work was provided by NASA throughgrant numbers GO-06046 and GO-06714 from the SpaceTelescope Science Institute, which is operated by theAssociation of Universities for Research in Astronomy, Inc.,under NASA contract NAS 5-26555. Institutional supporthas been provided by the Georgia State University Collegeof Arts and Sciences and by the Research ProgramEnhancement fund of the Board of Regents of the Uni-versity System of Georgia administered through theGeorgia State University office of the Vice President forResearch and Sponsored Programs. We gratefully acknow-ledge all this support.
REFERENCESW. G., Jr., Gies, D. R., Hahula, M. E., Wiemker, R., & Wiggs,Bagnuolo,
M. S. 1994, ApJ, 423, 446S., Lambert, D. L., Tomkin, J., & Parthasarathy, M. 1986,Balachandran,
MNRAS, 219, 479F., & Husfeld, D. 1995, A&A, 300,Bauer, 481
J. E., & Cassinelli, J. P. 1993, ApJ, 409,Bjorkman, 429E. 1981, ARA&A, 19,Bo� hm-Vitense, 295
H., Harmanec, P., Horn, J., Koubsky� , P., Scholz, G., McDavid, D.,Boz— ic� ,Hubert, A. M., & Hubert, H. 1995, A&A, 304, 235
F. C., Kondo, Y., & McCluskey, G. E. 1981, ApJS, 46,Bruhweiler, 255A. J., & Thomas, H.-C. 1981, A&A, 96,Delgado, 142S. 1993, A&A, 273,Dreizler, 212
D. R., & Lambert, D. L. 1992, ApJ, 387,Gies, 673D. R., Willis, C. Y., Penny, L. R., & McDavid, D. 1993, PASP, 105,Gies,
281R. L. 1994, GHRS Instrument Science Report 63 (Baltimore :Gilliland,
STScI)R. W. 1996, A&A, 308,Hanuschik, 170P. 1988, Bull. Astron. Inst. Czechoslovakia, 39,Harmanec, 329P., & Kr— iz— , S. 1976, in IAU Symp. 70, Be and Shell Stars, ed.Harmanec,
A. Slettebak (Dordrecht : Reidel), 385I. D., & Heber, U. 1990, PASP, 102,Howarth, 912
I., & Lanz, T. 1995, ApJ, 439,Hubeny, 875
I., Lanz, T., & Je†ery, C. S. 1994, Newsl. Anal. Astron. Spectra, 20,Hubeny,30
I., S., & Harmanec, P. 1985, Bull. Astron. Inst. Czechoslo-Hubeny, S‹ teÑ,vakia, 36, 214
G. L., Stella, L., Angelini, L., White, N. E., Kallman, T. R., Giommi,Israel,P., & Treves, A. 1997, ApJ, 474, L53
S., & Harmanec, P. 1975, Bull. Astron. Inst. Czechoslovakia, 26,Kr— iz— , 65R. L., & Bell, B. 1995, Atomic Line List, Kurucz CD-ROM 23Kurucz,
(Cambridge : Smithsonian Astrophysical Observatory)J. R. 1968, ApJS, 17,Lesh, 371
1977, Highlights Astron., 4,ÈÈÈ. 339C., Bruhweiler, F. C., & Smith, A. M. 1995, ApJ, 447,Lyu, 880
E. J. A., et al. 1992, A&A, 265,Meurs, L41C. L., & Brosterhus, E. B. 1974, PASP, 86,Morbey, 455D. C. 1991, ApJS, 77,Morton, 119
M. A. C. 1997, The Hipparcos and Tycho Catalogues, ESAPerryman,SP-1200 (Noordwijk : ESA/ESTEC)
R. 1981, PASP, 93,Poeckert, 297O. R., Cote� , J., Waters, L. B., & Heise, J. 1991, A&A, 241,Pols, 419
Zwart, S. F. 1995, A&A, 296,Portegies 691A., et al. 1997, ApJ, 479,Quirrenbach, 477
S. A., & van den Heuvel, E. P. J. 1982, in IAU Symp. 98, BeRappaport,Stars, ed. M. Jaschek & H. Groth (Dordrecht : Reidel), 327
450 GIES ET AL.
J., & Sonneborn, G. 1993, Spectral ClassiÐcation with the Inter-Rountree,national Ultraviolet Explorer : An Atlas of B-Type Spectra, NASARP-1312 (Washington, DC: NASA)
D., & Harmanec, P. 1995, A&A, 294,Scho� nberner, 509T., & Butler, K. 1989, A&AS, 78,Scho� ning, 51
M., Mon, M., Kogure, T., & Suzuki, M. 1994, PASJ, 46,Singh, 27A. 1982, ApJS, 50,Slettebak, 55
D. R., Sherbert, L. E., & Hulbert, S. J. 1994, GHRS InstrumentSoderblom,Science Report 53 (Baltimore : STScI)
M. L., Bagnuolo, W. G., Jr., Gies, D. R., & Penny, L. R. 1995, ApJ,Thaller,448, 878
A. B., Divan, L., Pre� vot-Burnichon, M.-L., & Doazan, V. 1979,Underhill,MNRAS, 189, 601
W. D., Garmany, C. D., & Shull, J. S. 1996, ApJ, 460,Vacca, 914
Bever, J., & Vanbeveren, D. 1997, A&A, 322,Van 116D. 1996, in Evolutionary Processes in Binary Stars, ed.Vanbeveren,
R. A. M. J. Wijers, M. B. Davies, & C. A. Tout, NATO ASI Ser. C,vol. 477 (Dordrecht : Kluwer Academic), 155
den Heuvel, E. P. J., & Rappaport, S. A. 1987, in IAU Colloq. 92,vanPhysics of Be Stars, ed. A. Slettebak & T. P. Snow (Cambridge : Cam-bridge Univ. Press), 291
der Linden, T. J. 1987, A&A, 178,van 170R. A., & Rucinski, S. M. 1985, A&AS, 60,Wade, 471L. B. F. M., Cote� , J., & Pols, O. R. 1991, A&A, 250,Waters, 437L. B. F. M., Pols, O. R., Hogeveen, S. J., Cote� , J., & van denWaters,
Heuvel, E. P. J. 1989, A&A, 220, L1K., Bjorkman, K. S., & Bjorkman, J. E. 1997, ApJ, 477,Wood, 926
Related Documents