The Effects of Changes in Population Density on River Baseflow for the Midwestern United States http://www.tcdailyplanet.net/sites/tcdailyplanet.net/files/Rust%20belt_jpg_full_600.jpg by Catherine Konieczny, Joshua Galster Department of Earth and Environmental Science, Montclair State University

Welcome message from author
This document is posted to help you gain knowledge. Please leave a comment to let me know what you think about it! Share it to your friends and learn new things together.
Transcript
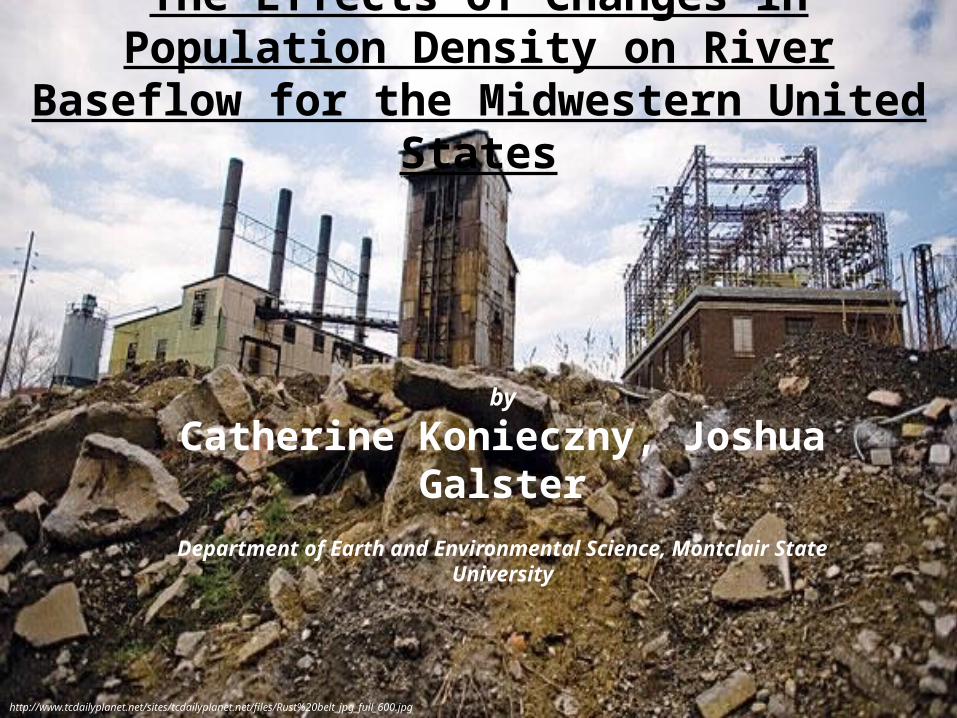
The Effects of Changes in Population Density on River Baseflow for the Midwestern United States
http://www.tcdailyplanet.net/sites/tcdailyplanet.net/files/Rust%20belt_jpg_full_600.jpg
by
Catherine Konieczny, Joshua Galster
Department of Earth and Environmental Science, Montclair State University
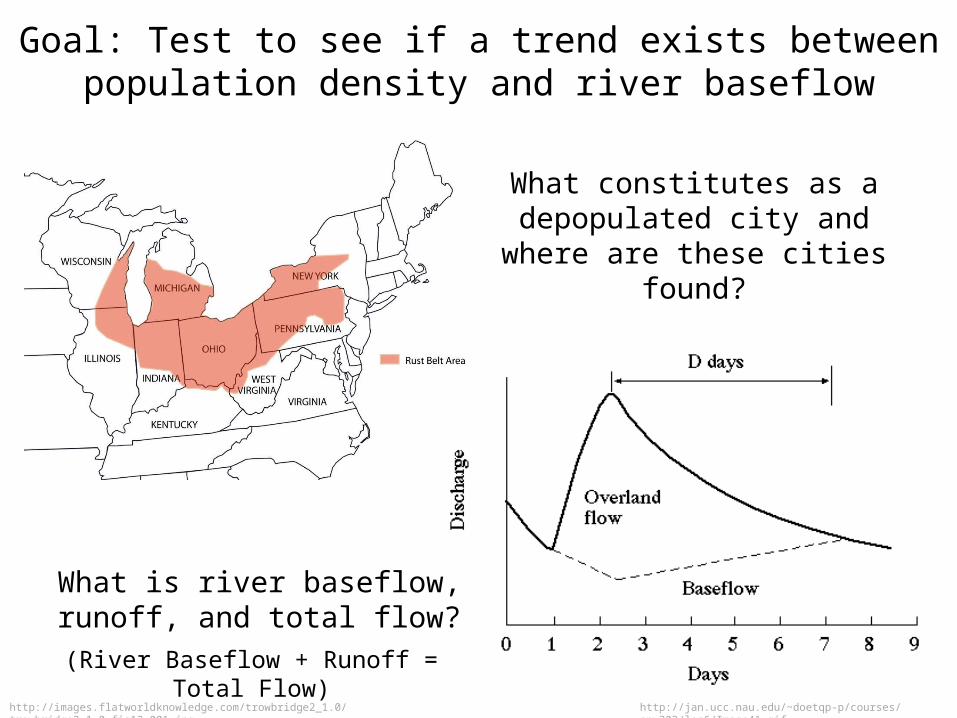
Goal: Test to see if a trend exists between population density and river baseflow
http://images.flatworldknowledge.com/trowbridge2_1.0/trowbridge2_1.0-fig12_001.jpg http://jan.ucc.nau.edu/~doetqp-p/courses/env302/lec6/Image41.gif
What constitutes as a depopulated city and where are these cities
found?
What is river baseflow, runoff, and total flow?
(River Baseflow + Runoff = Total Flow)
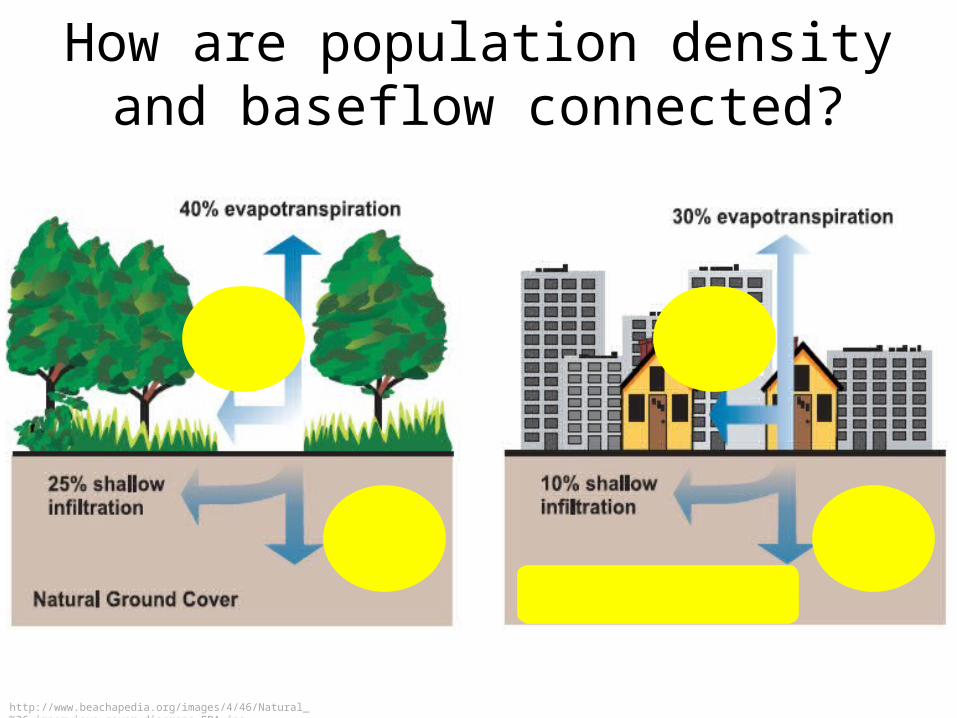
How are population density and baseflow connected?
http://www.beachapedia.org/images/4/46/Natural_%26_impervious_cover_diagrams_EPA.jpg
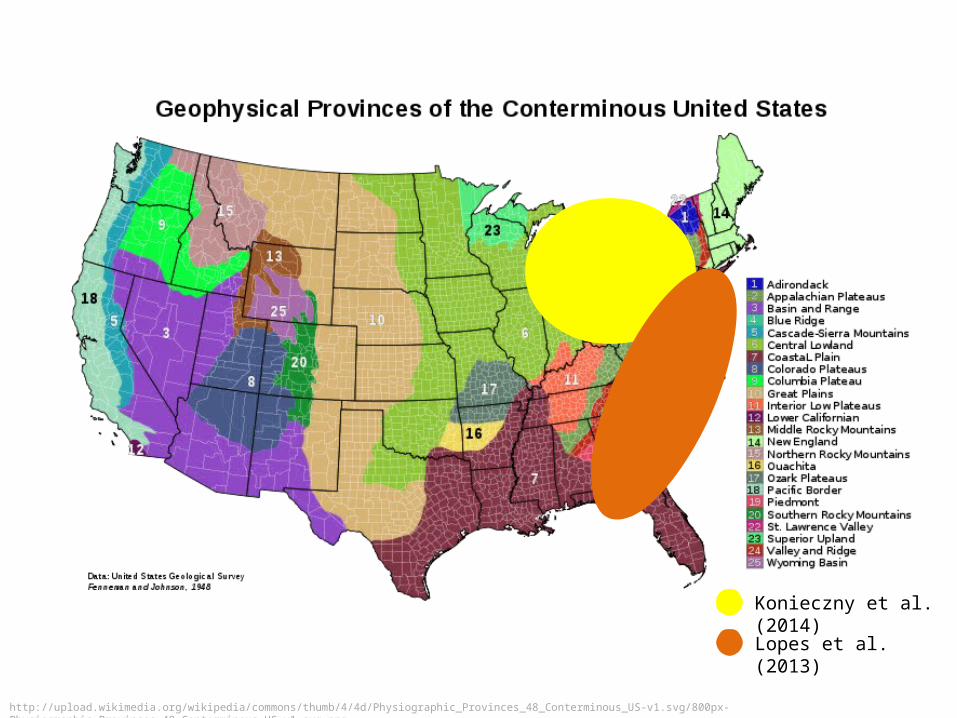
http://upload.wikimedia.org/wikipedia/commons/thumb/4/4d/Physiographic_Provinces_48_Conterminous_US-v1.svg/800px-Physiographic_Provinces_48_Conterminous_US-v1.svg.png
Konieczny et al. (2014)
Lopes et al. (2013)
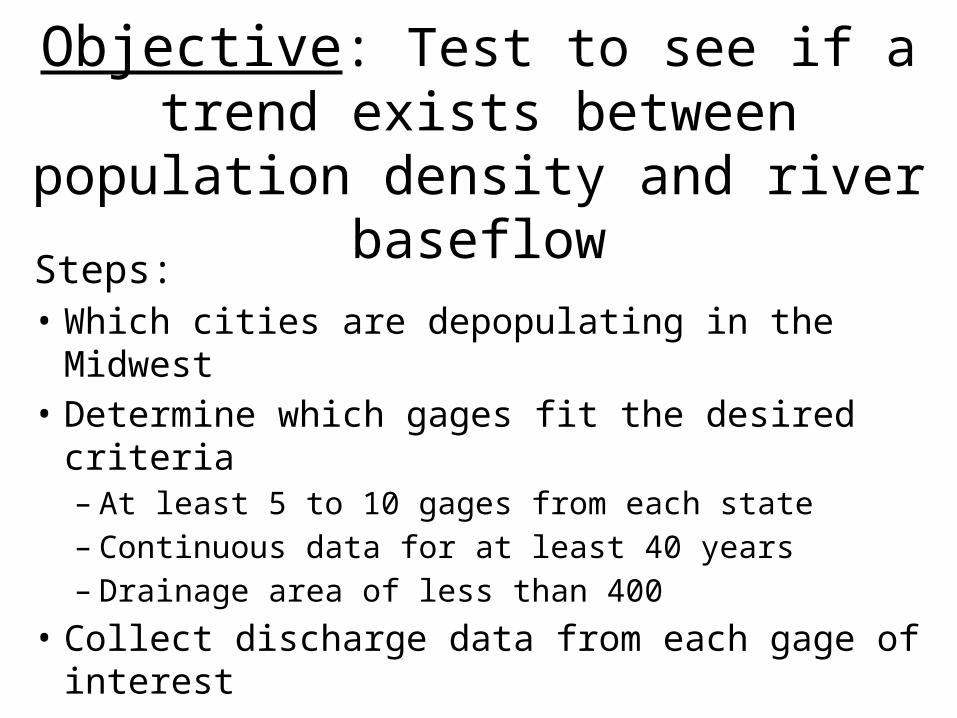
Steps:• Which cities are depopulating in the Midwest• Determine which gages fit the desired criteria– At least 5 to 10 gages from each state– Continuous data for at least 40 years– Drainage area of less than 400
• Collect discharge data from each gage of interest
Objective: Test to see if a trend exists between population density and river
baseflow

How is the goal going to be accomplished?
http://upload.wikimedia.org/wikipedia/commons/thumb/6/6b/Census_Bureau_seal.svg/220px-Census_Bureau_seal.svg.png
http://www.eia.gov/emeu/recs/cendivco.gif
http://upload.wikimedia.org/wikipedia/commons/f/f0/Northfield_Mountain_Tailrace_Tunnel_-_USGS_map.jpghttp://pubs.usgs.gov/of/1999/ofr-99-0364/usgs.gif
Lim et. al, 2010
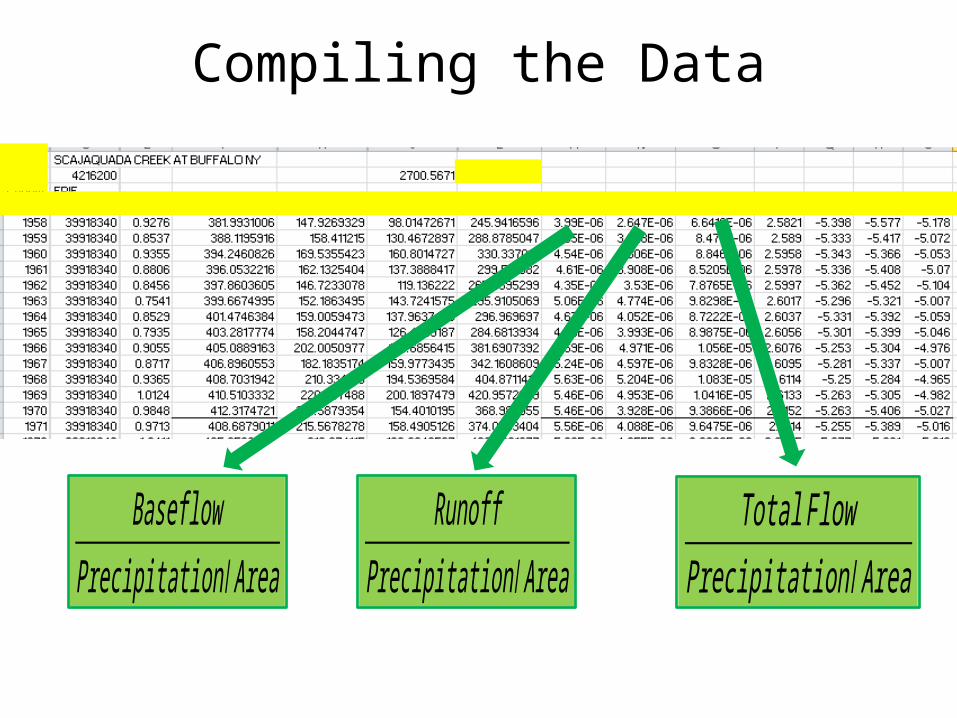
Compiling the Data
RunoffPrecipitation/Area
Total FlowPrecipitation/Area
BaseflowPrecipitation/Area
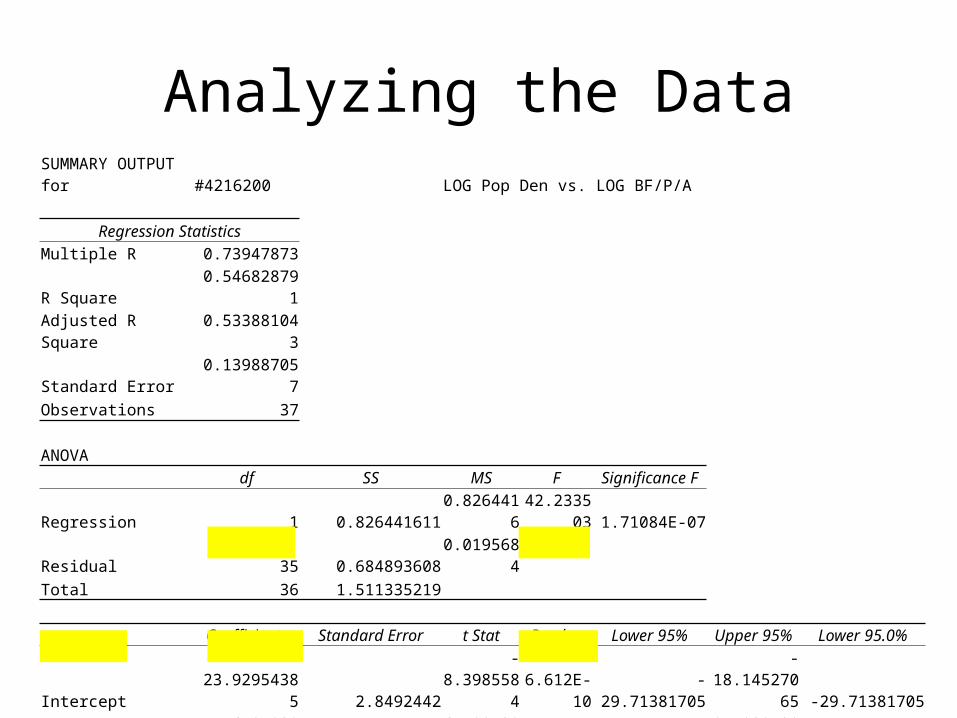
Analyzing the DataSUMMARY OUTPUT for #4216200 LOG Pop Den vs. LOG BF/P/A
Regression StatisticsMultiple R 0.73947873R Square 0.546828791Adjusted R Square 0.533881043Standard Error 0.139887057Observations 37
ANOVA df SS MS F Significance F
Regression 1 0.826441611 0.8264416 42.233503 1.71084E-07
Residual 35 0.684893608 0.0195684Total 36 1.511335219
Coefficients Standard Error t Stat P-value Lower 95% Upper 95% Lower 95.0%
Intercept -23.92954385 2.8492442 -8.3985584 6.612E-10 -29.71381705 -18.14527065 -29.71381705
X Variable 1 7.164849305 1.102499768 6.4987309 1.711E-07 4.926655799 9.403042812 4.926655799
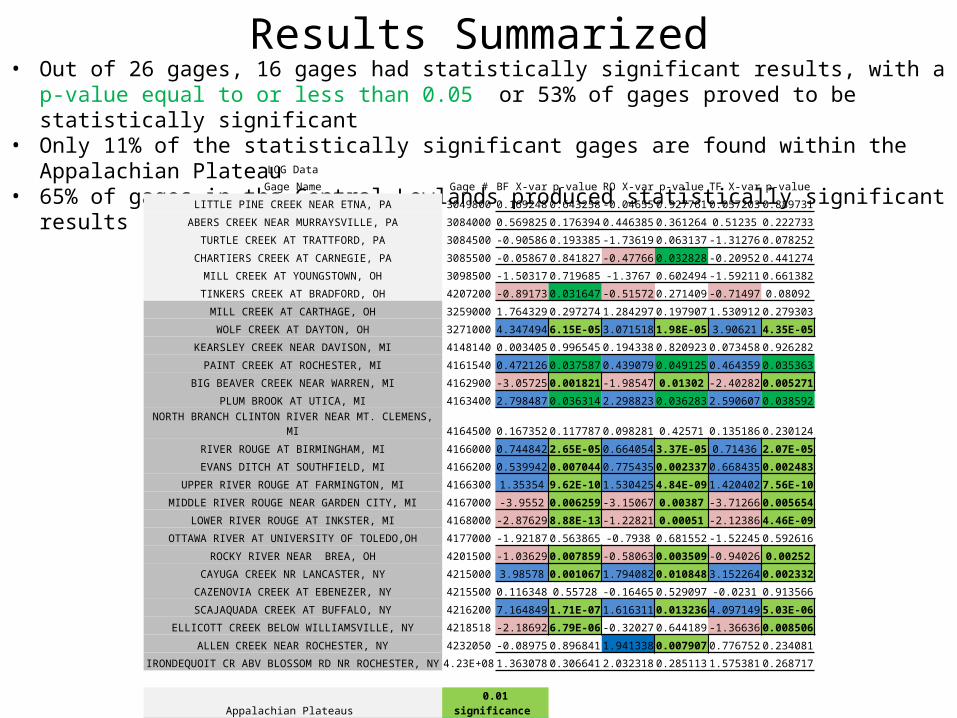
• Out of 26 gages, 16 gages had statistically significant results, with a p-value equal to or less than 0.05 or 53% of gages proved to be statistically significant
• Only 11% of the statistically significant gages are found within the Appalachian Plateau• 65% of gages in the Central Lowlands produced statistically significant results
Results Summarized
LOG Data
Gage Name Gage # BF X-var p-value RO X-var p-value TF X-var p-value
LITTLE PINE CREEK NEAR ETNA, PA 3049800 0.169248 0.643258 -0.04655 0.927761 0.057203 0.889731
ABERS CREEK NEAR MURRAYSVILLE, PA 3084000 0.569825 0.176394 0.446385 0.361264 0.51235 0.222733
TURTLE CREEK AT TRATTFORD, PA 3084500 -0.90586 0.193385 -1.73619 0.063137 -1.31276 0.078252
CHARTIERS CREEK AT CARNEGIE, PA 3085500 -0.05867 0.841827 -0.47766 0.032828 -0.20952 0.441274
MILL CREEK AT YOUNGSTOWN, OH 3098500 -1.50317 0.719685 -1.3767 0.602494 -1.59211 0.661382
TINKERS CREEK AT BRADFORD, OH 4207200 -0.89173 0.031647 -0.51572 0.271409 -0.71497 0.08092
MILL CREEK AT CARTHAGE, OH 3259000 1.764329 0.297274 1.284297 0.197907 1.530912 0.279303
WOLF CREEK AT DAYTON, OH 3271000 4.347494 6.15E-05 3.071518 1.98E-05 3.90621 4.35E-05
KEARSLEY CREEK NEAR DAVISON, MI 4148140 0.003405 0.996545 0.194338 0.820923 0.073458 0.926282
PAINT CREEK AT ROCHESTER, MI 4161540 0.472126 0.037587 0.439079 0.049125 0.464359 0.035363
BIG BEAVER CREEK NEAR WARREN, MI 4162900 -3.05725 0.001821 -1.98547 0.01302 -2.40282 0.005271
PLUM BROOK AT UTICA, MI 4163400 2.798487 0.036314 2.298823 0.036283 2.590607 0.038592
NORTH BRANCH CLINTON RIVER NEAR MT. CLEMENS, MI 4164500 0.167352 0.117787 0.098281 0.42571 0.135186 0.230124
RIVER ROUGE AT BIRMINGHAM, MI 4166000 0.744842 2.65E-05 0.664054 3.37E-05 0.71436 2.07E-05
EVANS DITCH AT SOUTHFIELD, MI 4166200 0.539942 0.007044 0.775435 0.002337 0.668435 0.002483
UPPER RIVER ROUGE AT FARMINGTON, MI 4166300 1.35354 9.62E-10 1.530425 4.84E-09 1.420402 7.56E-10
MIDDLE RIVER ROUGE NEAR GARDEN CITY, MI 4167000 -3.9552 0.006259 -3.15067 0.00387 -3.71266 0.005654
LOWER RIVER ROUGE AT INKSTER, MI 4168000 -2.87629 8.88E-13 -1.22821 0.00051 -2.12386 4.46E-09
OTTAWA RIVER AT UNIVERSITY OF TOLEDO,OH 4177000 -1.92187 0.563865 -0.7938 0.681552 -1.52245 0.592616
ROCKY RIVER NEAR BREA, OH 4201500 -1.03629 0.007859 -0.58063 0.003509 -0.94026 0.00252
CAYUGA CREEK NR LANCASTER, NY 4215000 3.98578 0.001067 1.794082 0.010848 3.152264 0.002332
CAZENOVIA CREEK AT EBENEZER, NY 4215500 0.116348 0.55728 -0.16465 0.529097 -0.0231 0.913566
SCAJAQUADA CREEK AT BUFFALO, NY 4216200 7.164849 1.71E-07 1.616311 0.013236 4.097149 5.03E-06
ELLICOTT CREEK BELOW WILLIAMSVILLE, NY 4218518 -2.18692 6.79E-06 -0.32027 0.644189 -1.36636 0.008506
ALLEN CREEK NEAR ROCHESTER, NY 4232050 -0.08975 0.896841 1.941338 0.007907 0.776752 0.234081
IRONDEQUOIT CR ABV BLOSSOM RD NR ROCHESTER, NY 4.23E+08 1.363078 0.306641 2.032318 0.285113 1.575381 0.268717
Appalachian Plateaus 0.01 significance
Central Lowland 0.05 significance
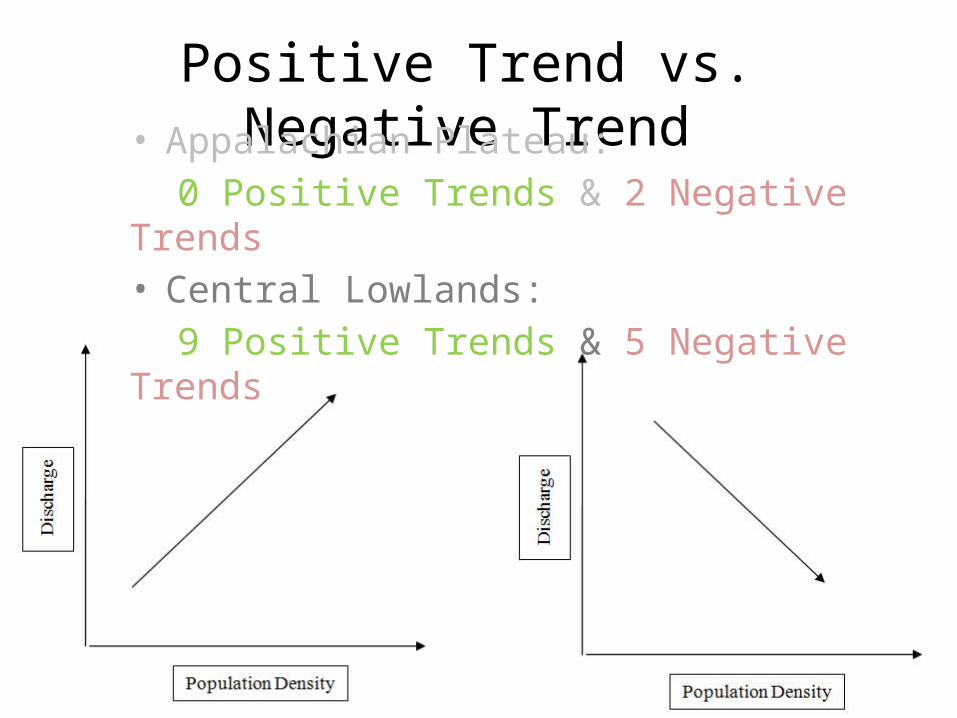
Positive Trend vs. Negative Trend• Appalachian Plateau:
0 Positive Trends & 2 Negative Trends• Central Lowlands:
9 Positive Trends & 5 Negative Trends

What does this imply?Urban Karstification.
http://academic.emporia.edu/aberjame/field/flint/rock02.jpg
http://1.bp.blogspot.com/_JRp7TJWTx4A/S8Zvpncq70I/AAAAAAAAAVU/HPmQaOgb0d8/s1600/KarstDiagram-70pct-730206.jpg
http://www.kwhpipe.ca/Link.aspx?id=1112003
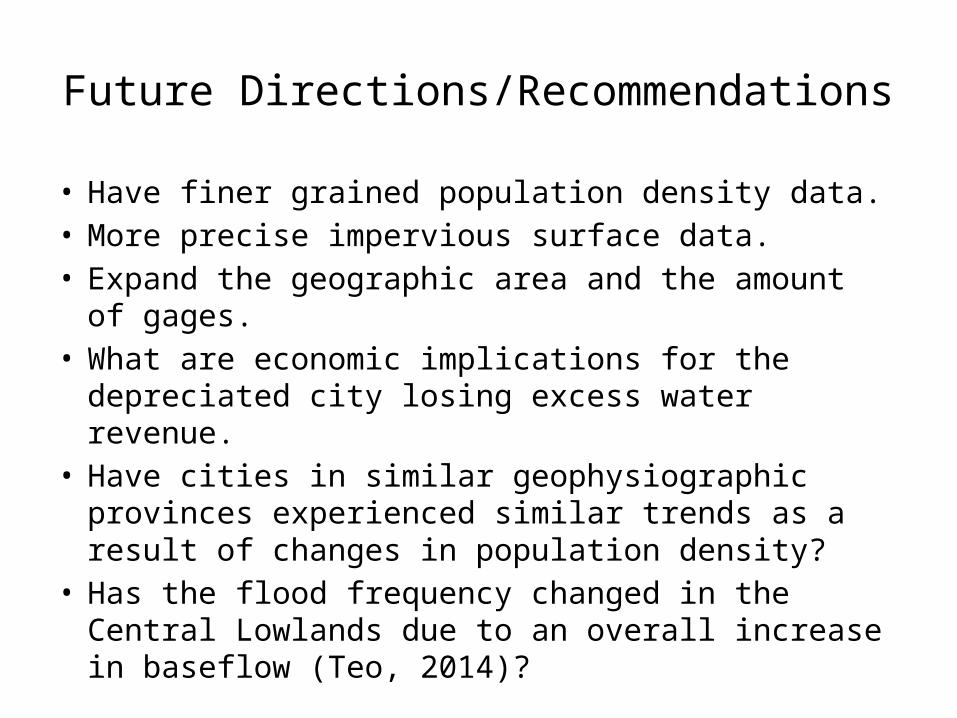
Future Directions/Recommendations
• Have finer grained population density data.• More precise impervious surface data.• Expand the geographic area and the amount of gages.• What are economic implications for the depreciated
city losing excess water revenue.• Have cities in similar geophysiographic provinces
experienced similar trends as a result of changes in population density?
• Has the flood frequency changed in the Central Lowlands due to an overall increase in baseflow (Teo, 2014)?

Questions?
http://static.panoramio.com/photos/large/18637974.jpg http://img.geocaching.com/cache/large/5b64dd91-ba09-4fdf-aa2a-2aae1604be97.jpg
Related Documents