http://www.hdpaperwall.com/sunlig “State of Solar” Energy in the U.S. Kathy Jack Environmental Science University of North Texas October 4, 2014

Http:// “State of Solar” Energy in the U.S. Kathy Jack Environmental Science University of North Texas October 4, 2014.
Dec 14, 2015
Welcome message from author
This document is posted to help you gain knowledge. Please leave a comment to let me know what you think about it! Share it to your friends and learn new things together.
Transcript
http://www.hdpaperwall.com/sunlight/
“State of Solar” Energy in the U.S.
Kathy JackEnvironmental Science
University of North TexasOctober 4, 2014

Solar Energy Technologies
Soalr One, Barstow, CA. http://solartribune.com/solar-power-plants/
http://solartribune.com
Jarlanbah EcoVillage, Nimbin, Australia.
Red Oak Subdivtision. Boulder,CO. http://www.lighthousesolar.com/

U.S. Primary Energy Consumption by Source (2000-2013)
U.S. Energy Information Administration. Monthly Energy Review. September 2014. http://www.eia.gov/totalenergy/data/monthly/#summary
2000 2001 2002 2003 2004 2005 2006 2007 2008 2009 2010 2011 2012 20130
20
40
60
80
100
120
Biomass
Wind
Solar/PV
Geothermal
Hydroelectric
Nuclear
Petroleum
Natural Gas
Coal
YEAR
QU
ADRI
LLIO
N B
TU (Q
UAD
)
.3% Solar as % total.03% .06% .1%
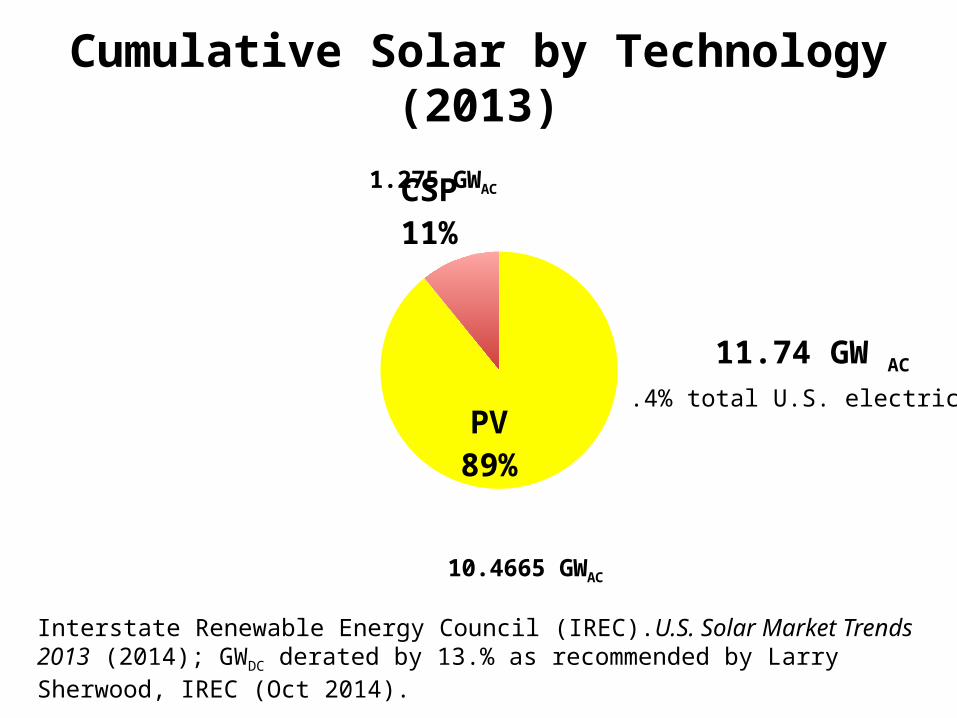
Cumulative Solar by Technology (2013)
PV89%
CSP11%
1.275 GWAC
10.4665 GWAC
Interstate Renewable Energy Council (IREC).U.S. Solar Market Trends 2013 (2014); GWDC derated by 13.% as recommended by Larry Sherwood, IREC (Oct 2014).
11.74 GW AC
.4% total U.S. electricity

2012 2013
New Electric Generation by Technology
USEIA and IREC in U.S. Solar Market Trends 2012. 2013:5 and U.S. Solar Market Trends 2013, 2014: 6.
Solar31%
Natural Gas45%
Wind7%
Coal 10%
Other7%
Solar12%
Natural Gas30%
Wind41%
Coal 11%
Other6%
PTC was slated to end 12/12, but extended by American Taxpayer Relief Act 0f 2012
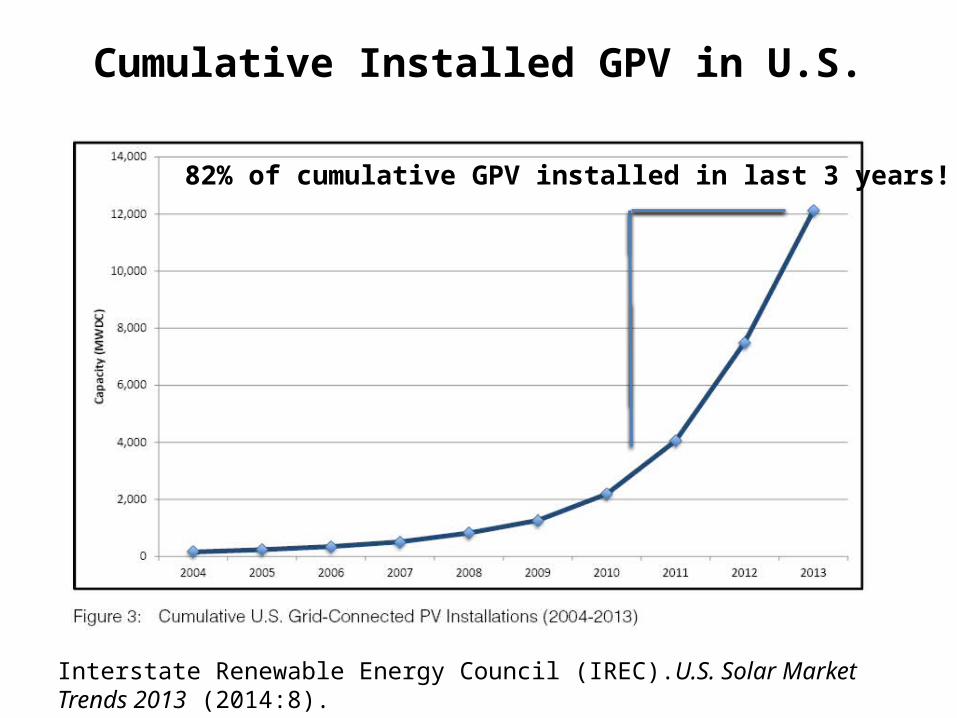
Cumulative Installed GPV in U.S.
Interstate Renewable Energy Council (IREC).U.S. Solar Market Trends 2013 (2014:8).
82% of cumulative GPV installed in last 3 years!
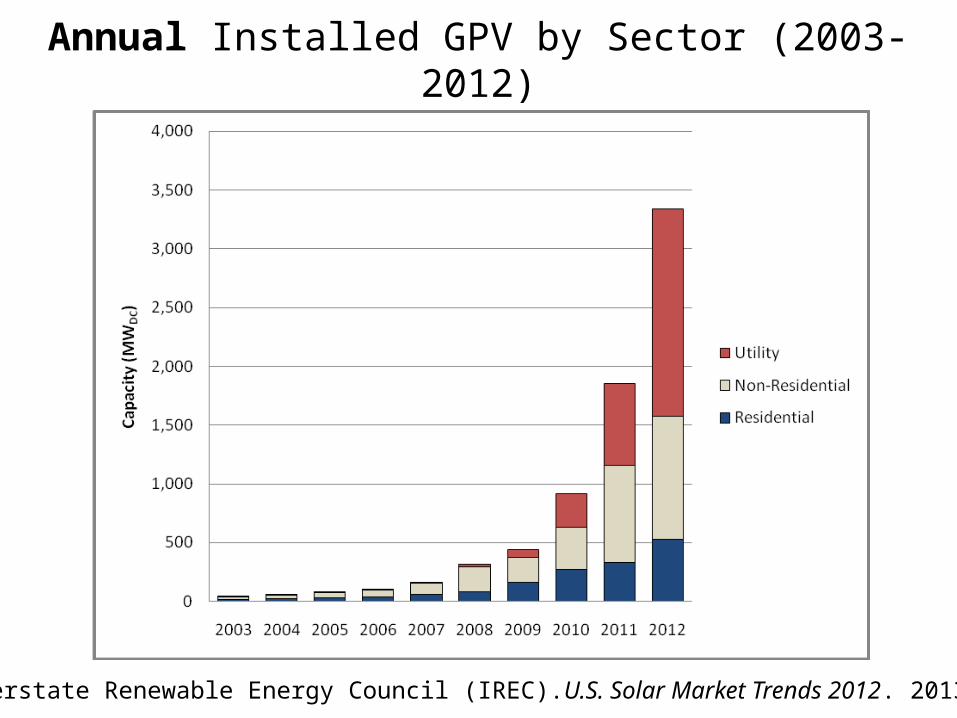
Annual Installed GPV by Sector (2003-2012)
Interstate Renewable Energy Council (IREC).U.S. Solar Market Trends 2012. 2013: 12.
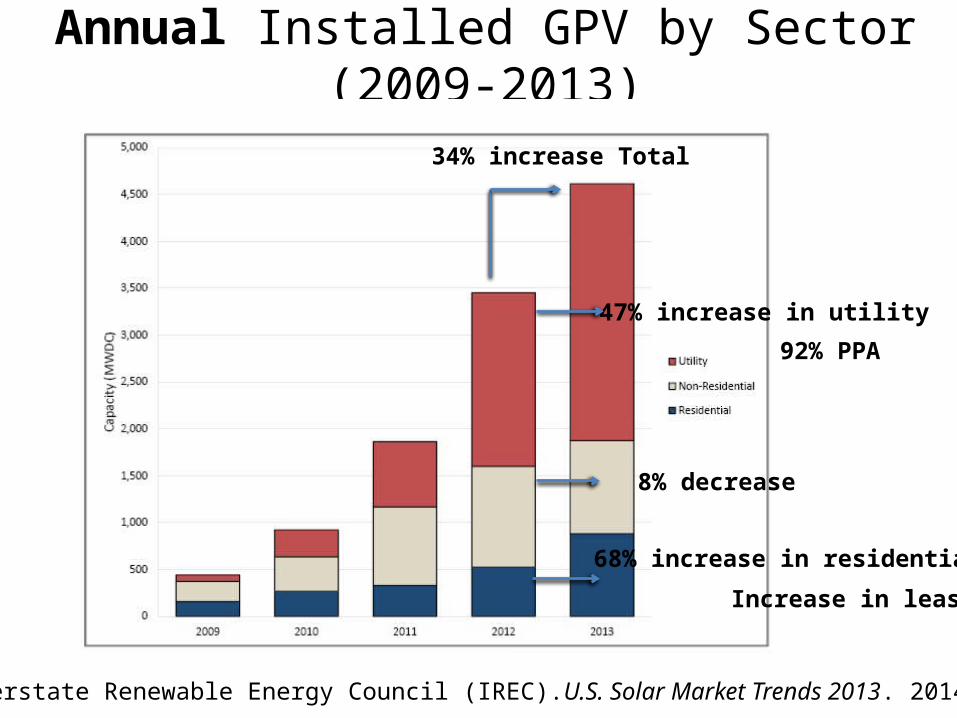
Annual Installed GPV by Sector (2009-2013)
Interstate Renewable Energy Council (IREC).U.S. Solar Market Trends 2013. 2014: 12
34% increase Total
47% increase in utility
68% increase in residential
92% PPA
Increase in leases
8% decrease
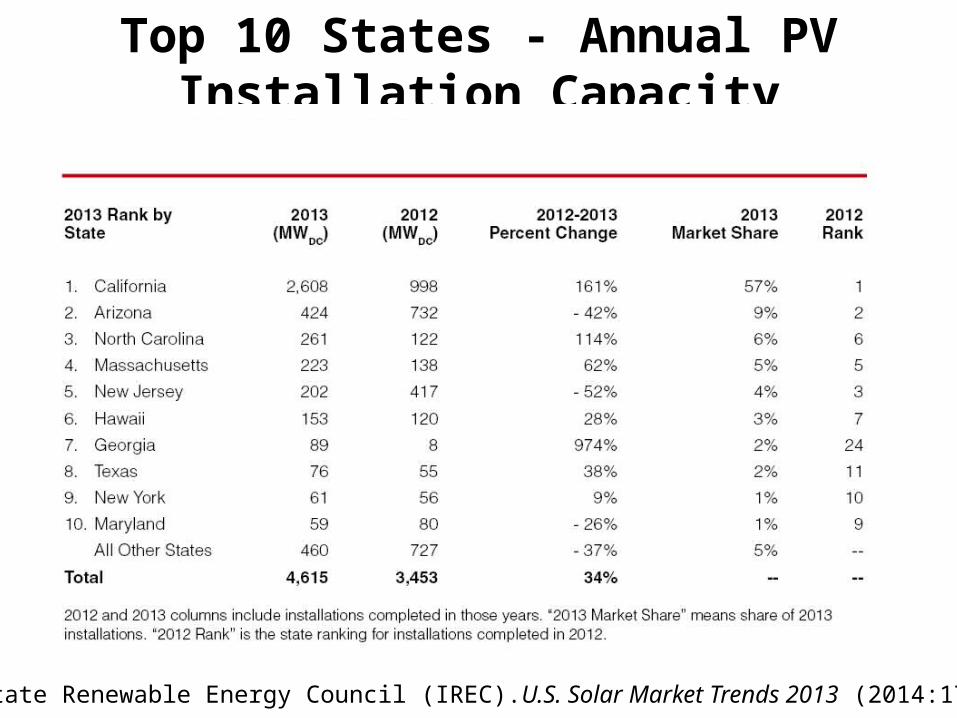
Top 10 States - Annual PV Installation Capacity
Interstate Renewable Energy Council (IREC).U.S. Solar Market Trends 2013 (2014:17).
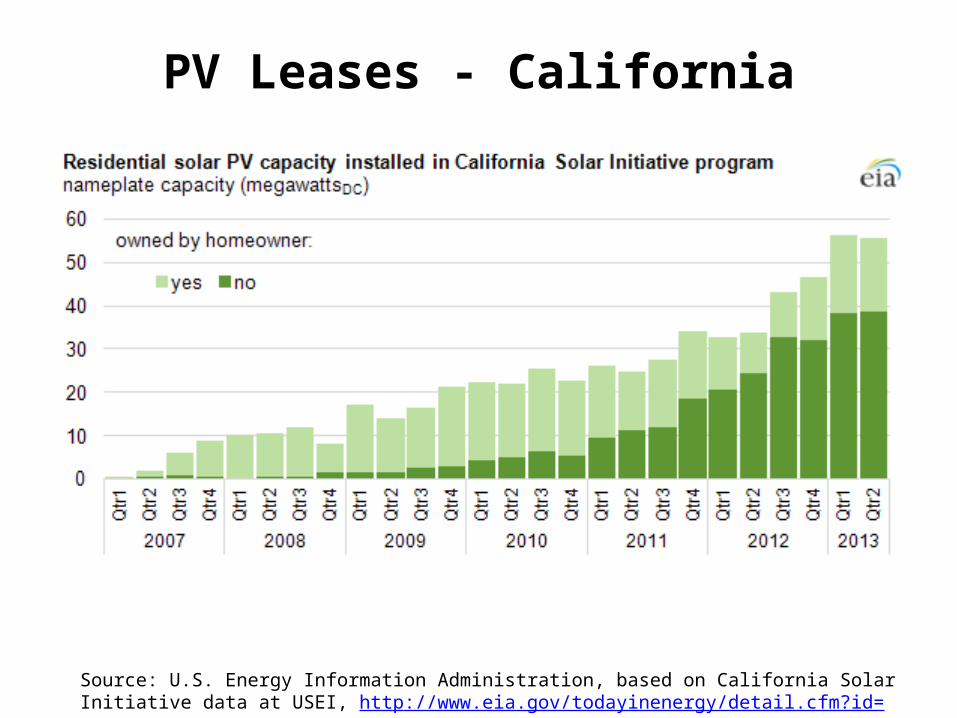
PV Leases - California
Source: U.S. Energy Information Administration, based on California Solar Initiative data at USEI, http://www.eia.gov/todayinenergy/detail.cfm?id=12991.
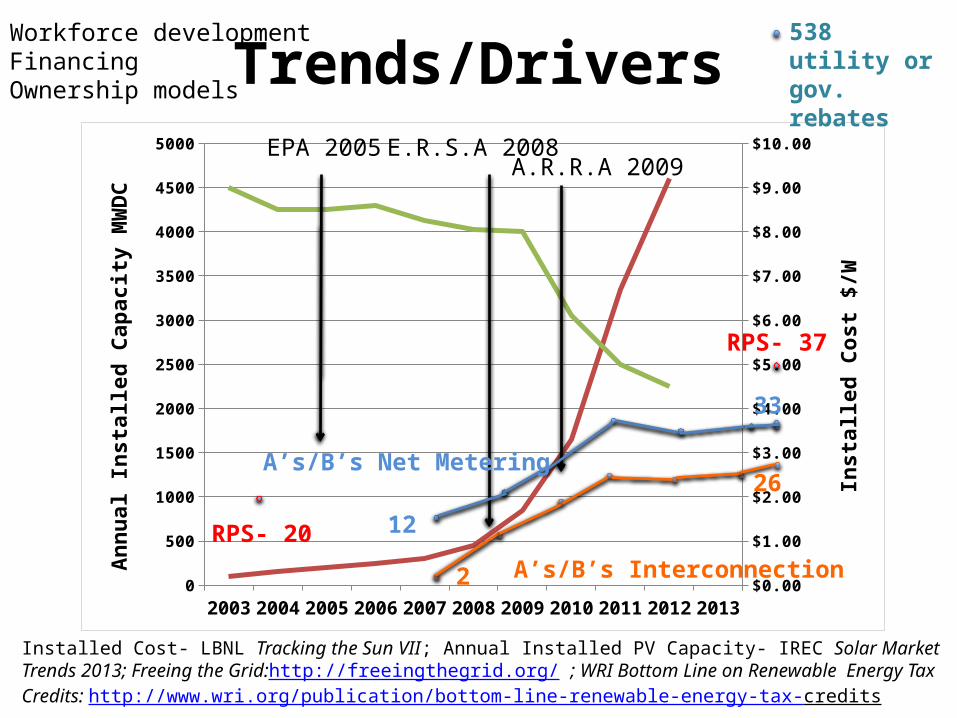
Trends/Drivers
2003 2004 2005 2006 2007 2008 2009 2010 2011 2012 20130
500
1000
1500
2000
2500
3000
3500
4000
4500
5000
$0.00
$1.00
$2.00
$3.00
$4.00
$5.00
$6.00
$7.00
$8.00
$9.00
$10.00An
nual
Inst
alle
d Ca
paci
ty M
WDC
Inst
alle
d Co
st $
/W
Installed Cost- LBNL Tracking the Sun VII; Annual Installed PV Capacity- IREC Solar Market Trends 2013; Freeing the Grid:http://freeingthegrid.org/ ; WRI Bottom Line on Renewable Energy Tax Credits: http://www.wri.org/publication/bottom-line-renewable-energy-tax-credits
A.R.R.A 2009E.R.S.A 2008
12
33
2
26A’s/B’s Net Metering
A’s/B’s InterconnectionRPS- 20
RPS- 37
538 utility or gov. rebates
• Workforce development• Financing• Ownership models
EPA 2005
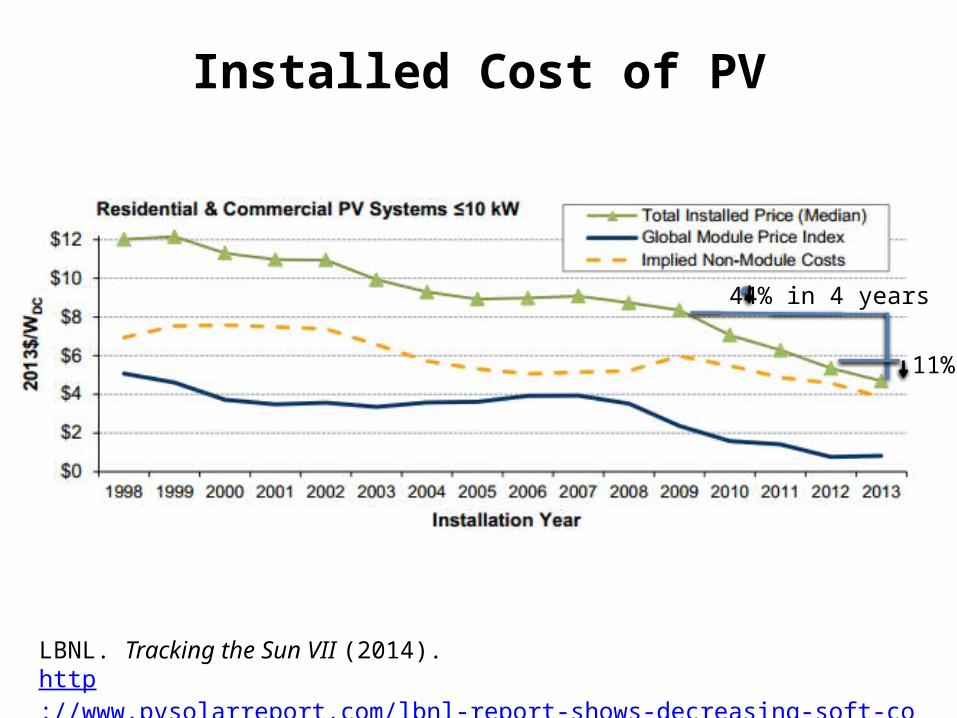
Installed Cost of PV
LBNL. Tracking the Sun VII (2014).http://www.pvsolarreport.com/lbnl-report-shows-decreasing-soft-costs-of-solar/
44% in 4 years
11%
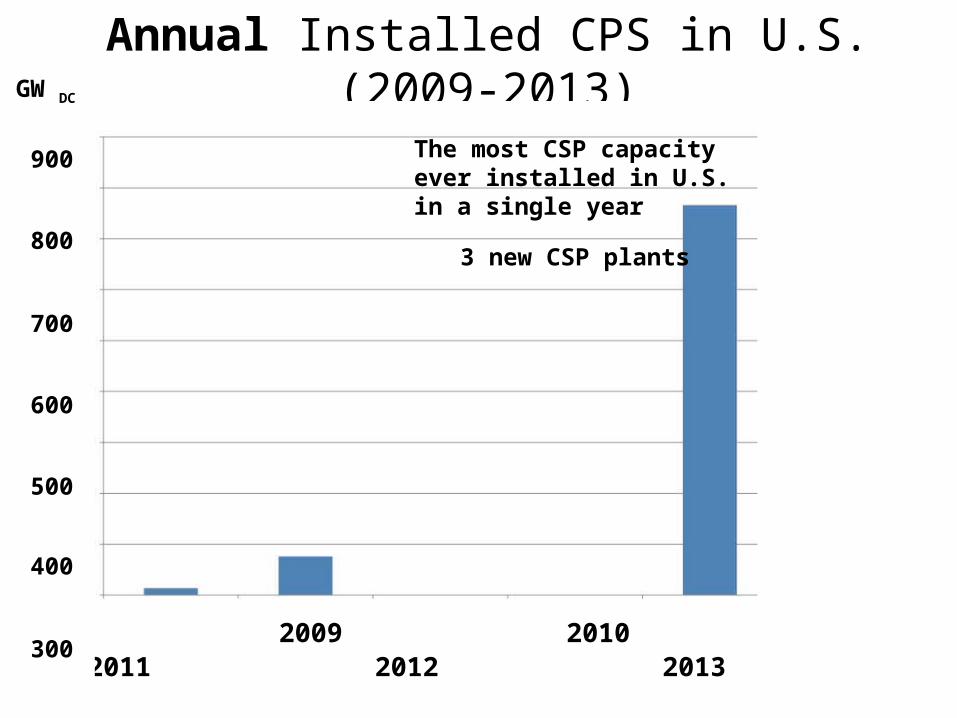
Annual Installed CPS in U.S. (2009-2013)
The most CSP capacity ever installed in U.S. in a single year
3 new CSP plants
2009 2009 2010 2011 2012 2013
900
800
700
600
500
400
300
200
100
0
GW DC
On the Horizon
• Continued work on Soft Costs
• Continued Growth expected
• Grid Saturation– Technical– Loss revenue
Key Sources
• Interstate Renewable Energy Council (IREC).– www.irec.com– U.S. Solar Market Trends 2013. (also 2009-20012)
• Database for State Incentives for Renewables and Efficiency (DSIRE). IREC, USDOE, NCSC. – http://www.dsireusa.org/
• U.S. Energy Information Administration.– www.eia.gov – Monthly Energy Review.
• Freeing the Grid: http://freeingthegrid.org/
Related Documents