A World Malaria Map: Plasmodium falciparum Endemicity in 2007 Simon I. Hay 1,2* , Carlos A. Guerra 1,2 , Peter W. Gething 2,3 , Anand P. Patil 2 , Andrew J. Tatem 1,2,4,5 , Abdisalan M. Noor 1,6 , Caroline W. Kabaria 1 , Bui H. Manh 7 , Iqbal R. F. Elyazar 8 , Simon Brooker 1,9 , David L. Smith 5,10 , Rana A. Moyeed 11 , Robert W. Snow 1,6 1 Malaria Public Health and Epidemiology Group, Centre for Geographic Medicine, Kenya Medical Research Institute (KEMRI)–University of Oxford–Wellcome Trust Collaborative Programme, Nairobi, Kenya, 2 Spatial Ecology and Epidemiology Group, Department of Zoology, University of Oxford, Oxford, United Kingdom, 3 Centre for Geographical Health Research, School of Geography, University of Southampton, Highfield, Southampton, United Kingdom, 4 Department of Geography, University of Florida, Gainesville, Florida, United States of America, 5 Emerging Pathogens Institute, University of Florida, Gainesville, Florida, United States of America, 6 Centre for Tropical Medicine, Nuffield Department of Clinical Medicine, University of Oxford, Centre for Clinical Vaccinology and Tropical Medicine (CCVTM), Oxford, United Kingdom, 7 Oxford University Clinical Research Unit, Bach Mai Hospital, National Institute of Infectious and Tropical Diseases, Ha Noi, Vietnam, 8 Eijkman-Oxford Clinical Research Unit, Jakarta, Indonesia, 9 Department of Infectious and Tropical Diseases, London School of Hygiene and Tropical Medicine, United Kingdom, 10 Department of Zoology, University of Florida, Gainesville, Florida, United States of America, 11 School of Mathematics and Statistics, University of Plymouth, Plymouth, Devon, United Kingdom Competing Interests: The authors have declared that no competing interests exist. Academic Editor: Ivo Mueller, Papua New Guinea Institute of Medical Research, Papua New Guinea Citation: Hay SI, Guerra CA, Gething PW, Patil AP, Tatem AJ, et al. (2009) A world malaria map: Plasmodium falciparum endemicity in 2007. PLoS Med 6(3): e1000048. doi:10.1371/ journal.pmed.1000048 Received: October 10, 2008 Accepted: February 2, 2009 Published: March 24, 2009 Copyright: Ó 2009 Hay et al. This is an open-access article distributed under the terms of the Creative Commons Attribution License, which permits unrestricted use, distribution, and reproduction in any medium, provided the original author and source are credited. Abbreviations: Africa þ, Africa, Yemen, and Saudi Arabia; AUC, area- under-curve; CSE Asia, Central and South and East Asia; GRUMP, Global Rural Urban Mapping Project; ITN, insecticide treated net; MAP, Malaria Atlas Project; MBG, model-based geostatistics; PA, per annum; PAR, population at risk; PfAPI, P. falciparum annual parasite incidence; Pf PR, P. falciparum parasite rate; UE, urban extent * To whom correspondence should be addressed. E-mail: simon.hay@ zoo.ox.ac.uk ABSTRACT Background Efficient allocation of resources to intervene against malaria requires a detailed under- standing of the contemporary spatial distribution of malaria risk. It is exactly 40 y since the last global map of malaria endemicity was published. This paper describes the generation of a new world map of Plasmodium falciparum malaria endemicity for the year 2007. Methods and Findings A total of 8,938 P. falciparum parasite rate (Pf PR) surveys were identified using a variety of exhaustive search strategies. Of these, 7,953 passed strict data fidelity tests for inclusion into a global database of Pf PR data, age-standardized to 2–10 y for endemicity mapping. A model- based geostatistical procedure was used to create a continuous surface of malaria endemicity within previously defined stable spatial limits of P. falciparum transmission. These procedures were implemented within a Bayesian statistical framework so that the uncertainty of these predictions could be evaluated robustly. The uncertainty was expressed as the probability of predicting correctly one of three endemicity classes; previously stratified to be an informative guide for malaria control. Population at risk estimates, adjusted for the transmission modifying effects of urbanization in Africa, were then derived with reference to human population surfaces in 2007. Of the 1.38 billion people at risk of stable P. falciparum malaria, 0.69 billion were found in Central and South East Asia (CSE Asia), 0.66 billion in Africa, Yemen, and Saudi Arabia (Africa þ ), and 0.04 billion in the Americas. All those exposed to stable risk in the Americas were in the lowest endemicity class (Pf PR 2 10 5%). The vast majority (88%) of those living under stable risk in CSE Asia were also in this low endemicity class; a small remainder (11%) were in the intermediate endemicity class (Pf PR 2 10 . 5 to , 40%); and the remaining fraction (1%) in high endemicity (Pf PR 2 10 40%) areas. High endemicity was widespread in the Africa þ region, where 0.35 billion people are at this level of risk. Most of the rest live at intermediate risk (0.20 billion), with a smaller number (0.11 billion) at low stable risk. Conclusions High levels of P. falciparum malaria endemicity are common in Africa. Uniformly low endemic levels are found in the Americas. Low endemicity is also widespread in CSE Asia, but pockets of intermediate and very rarely high transmission remain. There are therefore significant opportunities for malaria control in Africa and for malaria elimination elsewhere. This 2007 global P. falciparum malaria endemicity map is the first of a series with which it will be possible to monitor and evaluate the progress of this intervention process. The Editors’ Summary of this article follows the references. PLoS Medicine | www.plosmedicine.org March 2009 | Volume 6 | Issue 3 | e1000048 0286 P L o S MEDICINE

Document
Mar 25, 2016
http://www.cddep.org/sites/cddep.org/files/publication_files/Hay.Guerra.etal_.2009.WorldMalariaMap.pdf
Welcome message from author
This document is posted to help you gain knowledge. Please leave a comment to let me know what you think about it! Share it to your friends and learn new things together.
Transcript

A World Malaria Map:Plasmodium falciparum Endemicity in 2007Simon I. Hay
1,2*, Carlos A. Guerra
1,2, Peter W. Gething
2,3, Anand P. Patil
2, Andrew J. Tatem
1,2,4,5, Abdisalan M. Noor
1,6,
Caroline W. Kabaria1
, Bui H. Manh7
, Iqbal R. F. Elyazar8
, Simon Brooker1,9
, David L. Smith5,10
, Rana A. Moyeed11
,
Robert W. Snow1,6
1 Malaria Public Health and Epidemiology Group, Centre for Geographic Medicine, Kenya Medical Research Institute (KEMRI)–University of Oxford–Wellcome Trust
Collaborative Programme, Nairobi, Kenya, 2 Spatial Ecology and Epidemiology Group, Department of Zoology, University of Oxford, Oxford, United Kingdom, 3 Centre for
Geographical Health Research, School of Geography, University of Southampton, Highfield, Southampton, United Kingdom, 4 Department of Geography, University of
Florida, Gainesville, Florida, United States of America, 5 Emerging Pathogens Institute, University of Florida, Gainesville, Florida, United States of America, 6 Centre for
Tropical Medicine, Nuffield Department of Clinical Medicine, University of Oxford, Centre for Clinical Vaccinology and Tropical Medicine (CCVTM), Oxford, United Kingdom, 7
Oxford University Clinical Research Unit, Bach Mai Hospital, National Institute of Infectious and Tropical Diseases, Ha Noi, Vietnam, 8 Eijkman-Oxford Clinical Research Unit,
Jakarta, Indonesia, 9 Department of Infectious and Tropical Diseases, London School of Hygiene and Tropical Medicine, United Kingdom, 10 Department of Zoology,
University of Florida, Gainesville, Florida, United States of America, 11 School of Mathematics and Statistics, University of Plymouth, Plymouth, Devon, United Kingdom
Competing Interests: The authorshave declared that no competinginterests exist.
Academic Editor: Ivo Mueller,Papua New Guinea Institute ofMedical Research, Papua NewGuinea
Citation: Hay SI, Guerra CA, GethingPW, Patil AP, Tatem AJ, et al. (2009) Aworld malaria map: Plasmodiumfalciparum endemicity in 2007. PLoSMed 6(3): e1000048. doi:10.1371/journal.pmed.1000048
Received: October 10, 2008Accepted: February 2, 2009Published: March 24, 2009
Copyright: � 2009 Hay et al. This isan open-access article distributedunder the terms of the CreativeCommons Attribution License, whichpermits unrestricted use,distribution, and reproduction in anymedium, provided the originalauthor and source are credited.
Abbreviations: Africaþ, Africa,Yemen, and Saudi Arabia; AUC, area-under-curve; CSE Asia, Central andSouth and East Asia; GRUMP, GlobalRural Urban Mapping Project; ITN,insecticide treated net; MAP, MalariaAtlas Project; MBG, model-basedgeostatistics; PA, per annum; PAR,population at risk; PfAPI, P.falciparum annual parasiteincidence; Pf PR, P. falciparumparasite rate; UE, urban extent
* To whom correspondence shouldbe addressed. E-mail: [email protected]
A B S T R A C T
Background
Efficient allocation of resources to intervene against malaria requires a detailed under-standing of the contemporary spatial distribution of malaria risk. It is exactly 40 y since the lastglobal map of malaria endemicity was published. This paper describes the generation of a newworld map of Plasmodium falciparum malaria endemicity for the year 2007.
Methods and Findings
A total of 8,938 P. falciparum parasite rate (Pf PR) surveys were identified using a variety ofexhaustive search strategies. Of these, 7,953 passed strict data fidelity tests for inclusion into aglobal database of Pf PR data, age-standardized to 2–10 y for endemicity mapping. A model-based geostatistical procedure was used to create a continuous surface of malaria endemicitywithin previously defined stable spatial limits of P. falciparum transmission. These procedureswere implemented within a Bayesian statistical framework so that the uncertainty of thesepredictions could be evaluated robustly. The uncertainty was expressed as the probability ofpredicting correctly one of three endemicity classes; previously stratified to be an informativeguide for malaria control. Population at risk estimates, adjusted for the transmission modifyingeffects of urbanization in Africa, were then derived with reference to human populationsurfaces in 2007. Of the 1.38 billion people at risk of stable P. falciparum malaria, 0.69 billionwere found in Central and South East Asia (CSE Asia), 0.66 billion in Africa, Yemen, and SaudiArabia (Africaþ), and 0.04 billion in the Americas. All those exposed to stable risk in theAmericas were in the lowest endemicity class (Pf PR2�10 � 5%). The vast majority (88%) of thoseliving under stable risk in CSE Asia were also in this low endemicity class; a small remainder(11%) were in the intermediate endemicity class (Pf PR2�10 . 5 to , 40%); and the remainingfraction (1%) in high endemicity (Pf PR2�10 � 40%) areas. High endemicity was widespread inthe Africaþ region, where 0.35 billion people are at this level of risk. Most of the rest live atintermediate risk (0.20 billion), with a smaller number (0.11 billion) at low stable risk.
Conclusions
High levels of P. falciparum malaria endemicity are common in Africa. Uniformly low endemiclevels are found in the Americas. Low endemicity is also widespread in CSE Asia, but pockets ofintermediate and very rarely high transmission remain. There are therefore significantopportunities for malaria control in Africa and for malaria elimination elsewhere. This 2007global P. falciparum malaria endemicity map is the first of a series with which it will be possibleto monitor and evaluate the progress of this intervention process.
The Editors’ Summary of this article follows the references.
PLoS Medicine | www.plosmedicine.org March 2009 | Volume 6 | Issue 3 | e10000480286
PLoSMEDICINE

Introduction
Maps are essential for all aspects of the coordination ofmalaria control [1]. In an international policy environmentwhere the malaria control community has been challenged torethink the plausibility of malaria elimination [2–4], malariacartography will become an increasingly important tool forplanning, implementing, and measuring the impact ofmalaria interventions worldwide. The last global map of P.falciparum endemicity was published in 1968 [5]. In commonwith all previous maps of the global distribution of malaria[6–10], and to a large extent those that followed [11–16], themap (i) suffered from an incomplete description of the inputdata used; (ii) defined contours of ‘‘risk’’ using subjective andpoorly explained expert-opinion rules; and (iii) provided noquantification of the uncertainty around predictions. Herewe describe the generation of a new global map of malariaendemicity that overcomes these major deficiencies.
Geographic Scope of the ModellingThe global spatial limits of P. falciparum malaria trans-
mission have been mapped recently by triangulating nation-ally reported case incidence data, other medical intelligence,and biological rules of transmission exclusion, derived fromtemperature and aridity limits to the bionomics of locallydominant Anopheles vectors [17,18]. The results of this exercisestratified the world into three classes: the spatial representa-tion of no risk, unstable risk (P. falciparum annual parasiteincidence [PfAPI] , 0.1 per 1,000 people per annum [pa]),and stable risk (PfAPI � 0.1 per 1,000 people pa) of P.falciparum transmission for 2007. These classes are shown inFigure 1. The stable-unstable classification of PfAPI was basedon a review of the statistical, logistical, programmatic, andpragmatic reasons underpinning the PfAPI levels used todefine action points during the global malaria eradicationcampaign [19–21].
The mapping exercise described here extends this worksubstantively. The largest ever global assembly of malario-metric surveys is used to predict P. falciparum malariaprevalence values at every point within the stable spatiallimits of transmission to make a continuous P. falciparumendemicity surface. To facilitate this process the spatial limitsrequired majority resampling to a 5 3 5 km grid usingArcView GIS 3.2 (ESRI, 1999) because the computer-intensivemapping techniques adopted, and described next, could notbe implemented at 1 3 1 km spatial resolution at a globalscale.
Recent Approaches to Malaria Endemicity MappingNumerous approaches exist for the production of contin-
uous endemicity maps using data from malariometric surveys,all of which require the use of a model to predict endemicityvalues at locations where survey data are unavailable [22–26].The maps resulting from such models have an inherentuncertainty and its quantification is a primary concern indisease mapping.A number of recent studies have adopted a predictive
framework known as model-based geostatistics (MBG) [27] forthe spatial prediction of malaria endemicity [28–33] and theprevalence of other vector-borne and intermediate host-borne diseases [34–38]. MBG provides a formal statisticalinterpretation of classical geostatistical tools for spatialprediction [39–41] and allows the incorporation of Bayesianmethods of statistical inference [42,43]. The principaladvantage of MBG for disease mapping is the rigoroushandling of uncertainty introduced at different stages in themodelling process [27]. By modelling the interaction of thesedifferent sources of uncertainty, a probability distribution isgenerated for each predicted location, which can besummarised to provide robust metrics of confidence aroundpredicted values. This resulting map will therefore provide anevidence-based contemporary benchmark of global malaria
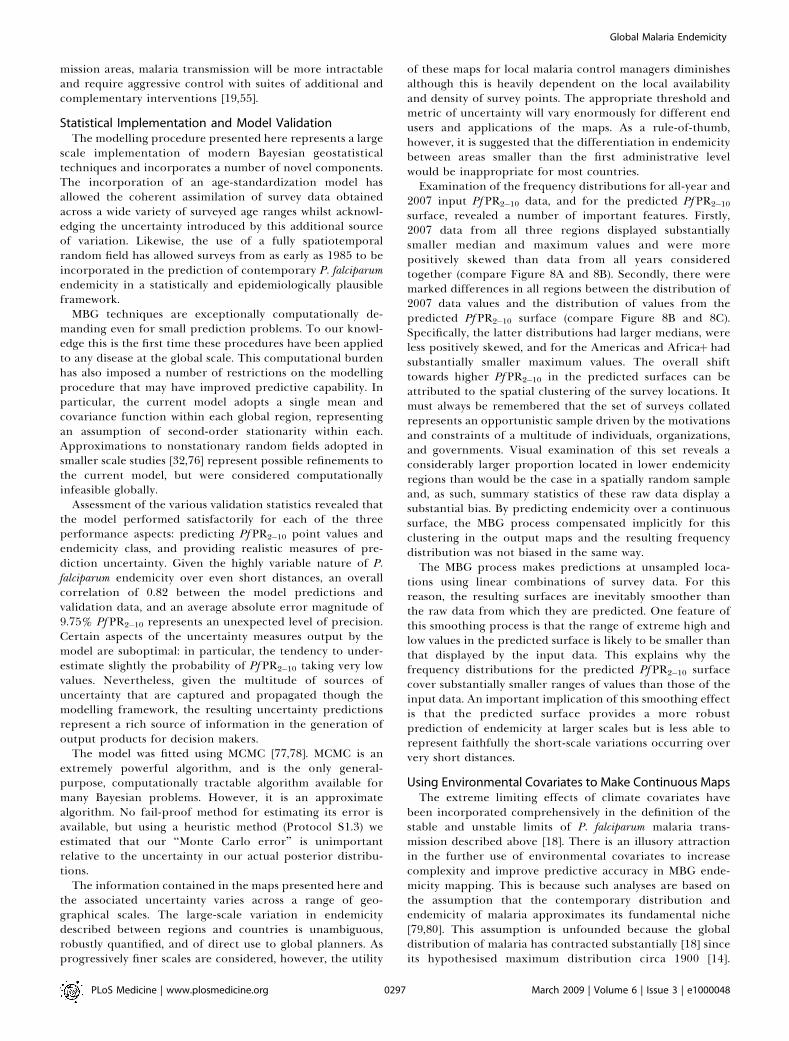
Figure 1. The Spatial Limits of P. falciparum Malaria Risk Defined by PfAPI with Further Medical Intelligence, Temperature, and Aridity Masks
Areas were defined as stable (dark grey areas, where PfAPI � 0.1 per 1,000 pa), unstable (medium grey areas, where PfAPI , 0.1 per 1,000 pa), or no risk(light grey, where PfAPI¼ 0 per 1,000 pa) [17–19]. The community surveys of P. falciparum prevalence conducted between January 1, 1985 and July 31,2008 are plotted. Of the 8,938 surveys collected, 7,953 satisfied our inclusion criteria for modelling (see Methods and Protocol S1.2) and are shown here.The survey data shown are age-standardized [51] (Pf PR2�10) and shown as a continuum of yellow to red from 0%–100% (see map legend). The dashedlines separate the America; Africaþ; and the CSE Asia regions.doi:10.1371/journal.pmed.1000048.g001
PLoS Medicine | www.plosmedicine.org March 2009 | Volume 6 | Issue 3 | e10000480287
Global Malaria Endemicity

endemicity, using MBG techniques to assess the confidence inthe predictions, and provide those who utilize the map a clearestimate of the fidelity of the predictions [36].
An underlying principle of geostatistics is that a mappedprediction becomes increasingly uncertain as the density ofand proximity to nearby data points decreases. When data arecollected at different times, as well as different locations, thisprinciple is as applicable through time as it is across space.Examples of epidemiological studies that extend spatialgeostatistics to incorporate time are rare [44–47], but in thisstudy a full spatiotemporal geostatistical modelling frame-work was developed. Incorporating the dimension of timeallows for unambiguous comparison of this benchmark withfuture map iterations. The map will thus provide an explicitgeographical framework for monitoring and evaluation of theimpact of the malaria control community on P. falciparummalaria worldwide.
Methods
Analysis OutlineThe objective of these analyses is to use a contemporary
database of P. falciparum parasite rate (PfPR) surveys to makea continuous, global, P. falciparum malaria endemicity surfacefor 2007, implemented with transparent and reproduciblemethods, and which documents robustly the uncertaintyassociated with its predictions.
The main steps used to define the continuous global map ofP. falciparum prevalence within our analytic framework are
outlined in Figure 2. First, it was necessary to search for andpreprocess the PfPR data in order to create a robustly geo-positioned, geographically extensive dataset of malariometricsurveys for mapping and examine potential environmentalcovariates (Protocol S1) and the influence of human settle-ment patterns (Protocol S2) [48–50]. Second, the refined PfPRdatabase was used to make a continuous, age-standardizedand urban-corrected malaria prevalence surface with MBG ina Bayesian statistical framework (Protocol S3). Third, exten-sive validation procedures were implemented to assess theaccuracy of endemicity predictions and uncertainty metrics(Protocol S4). Finally, populations at risk (PAR) of P.falciparum malaria estimates were extracted globally andpresented at the regional level, stratified by age class.
Assembling a Global Database of P. falciparum ParasitePrevalenceOf all the potential metrics available to measure malaria
endemicity, the parasite rate (the proportion of peoplesampled showing detectable parasites in the peripheralblood) was preferred as a basis for mapping, due to its globalubiquity [18] and its sensitivity across a wide range of the P.falciparum malaria transmission spectrum [19]. A categoriza-tion of the malaria endemicity spectrum in the epidemiolog-ically informative 2 (2.00)- up to 10 (9.99)-y age group hasbeen suggested [51], guided by the potential impact onmalaria endemicity using the most widely deployed contem-porary malaria intervention—insecticide treated bed nets(ITNs) [19]. The lowest class of PfPR in the 2- up to 10-y age
Figure 2. Schematic Overview of the Mapping Procedures and Methods
Blue diamonds describe input data. Orange boxes denote models and experimental procedures; S1, Protocol S1; S2, Protocol S2; S3, Protocol S3; and S4,Protocol S4. Green rods indicate output data; dashed lines intermediate output, solid lines final outputs. U, urban; PU, peri-urban; and R, rural extents.doi:10.1371/journal.pmed.1000048.g002
PLoS Medicine | www.plosmedicine.org March 2009 | Volume 6 | Issue 3 | e10000480288
Global Malaria Endemicity

group (hereafter PfPR2�10), corresponds to �5%. This is thepoint below which PfPR surveys require sample sizes of thepopulation that become prohibitive logistically, to measuringendemicity accurately and surveillance-based malariometricsare therefore favoured [52–54]. We regard intermediate,stable transmission as represented by PfPR2�10 . 5% to ,
40%, since a range of mathematical models predict that theinterruption of malaria transmission could be achieved withuniversal coverage of ITNs in all areas with PfPR2�10 , 40%[19,55]. Despite being subject to some uncertainty owing tothe behaviour and bionomics of the dominant local Anophelesvectors [56], the PfPR2�10 , 40% level is considered aconservative benchmark, since ITNs are rarely deployedindependently of other interventions that will further reducetransmission. The areas of high stable transmission, wheremixed intervention suites need to be considered if theinterruption of transmission is ever to be achieved, areidentified as all prevalences above this level: PfPR2�10 � 40%.This malaria classification is used to guide the interpretationof the predicted endemicity surface throughout and is adeparture from traditional endemicity benchmarks [57] thathave been shown not to scale meaningfully with opportu-nities for control and elimination in most models [19,55].
The process of identifying, assembling, and geo-locatingcommunity-based survey estimates of parasite prevalenceundertaken since 1985 has been described [58]. Searches forPfPR data are an ongoing activity of the Malaria Atlas Project(MAP, http://www.map.ox.ac.uk) and were completed on July31, 2008 for this 2007 iteration of the global endemicity map(Protocol S1.1). A total of 8,938 cross-sectional surveyestimates of PfPR were assembled from 78 of the 87 P.falciparum malaria endemic countries (PfMECs) [18]. Thosecountries not represented in the database were Bangladesh,Belize, Bhutan, Djibouti, Dominican Republic, Guyana, Iran,Kyrgyzstan, and Panama.
After six levels of exclusion (removing surveys located onlyto large [.100 km2] and small [.25 km2] polygons [58];removing those surveys that could not be, or were only geo-positioned imprecisely; and removing those that could not betemporally disaggregated into independent surveys or forwhich the date was unknown), 7,991 PfPR surveys remained(Figure S1.2 in Protocol S1).
All PfPR data were then age-standardized to the 2- to 10-yage range before mapping using an algorithm based oncatalytic conversion models first adapted for malaria by Pulland Grab [59]. This algorithm was found to perform best outof a set of candidate standardization procedures and isdescribed in detail elsewhere (Protocol S1.3) [51].
The final dataset was stratified into three major globalregions (Figure 1): the Americas; Africa, Yemen, and SaudiArabia (Africaþ); and Central and South and East Asia (CSEAsia) (Protocol S1.4). This division allowed these biogeo-graphically, entomologically, and epidemiologically distinctregions [8,16] to be considered separately, whilst retainingsufficient data in each region for meaningful analysis. Theseglobal divisions were further supported by observing thedistinct spatial structure of the PfPR2�10 data in each region,illustrated by their semi-variograms (Figure S1.1 in ProtocolS1).
Malaria transmission-specific approaches to mappingurban, peri-urban, and rural extents were developed, therationale for which is described in detail elsewhere (Protocol
S2) [50]. In brief, all urban extents (UEs) defined by the GlobalRural Urban Mapping Project (GRUMP) alpha version UEmask (GRUMP UE) [60,61] were identified at 13 1 km spatialresolution (Protocol S2.1) [50]. Within these extents, thoseareas containing population densities greater than 1,000people per km2 according to the Gridded Population of theWorld version 3 population density surface [60,61] were thenmapped [48]. All surveys were then assigned as either urban(Gridded Population of the World version 3 � 1,000 km2
within GRUMP UE), peri-urban (Gridded Population of theWorld version 3 , 1,000 km2 within GRUMP UE), or rural(outside GRUMP UE) (Protocol S2.2).Extreme statistical outliers in the rural PfPR2�10 data were
then identified using a geostatistical filter (Protocol S1.5).This process used semi-variogram statistics to assess whethereach point differed significantly from neighbouring pointsgiven their separation distances and regional patterns ofspatial variation. This procedure identified 38 nonurbanPfPR2�10 records, which were removed from the datasetbefore further modelling. Details of these surveys areavailable on request.The final set of PfPR2�10 data (n ¼ 7,953) used is shown in
Figure 1. The attributes of this PfPR2�10 database aredescribed (Table S1.2 in Protocol S1), along with a plot ofthe median PfPR2�10 by year for the observation period(Figure S1.3 in Protocol S1), indicating that time was animportant source of variation to include in the MBG model.Similar preliminary explorations of the relationships of thesedata with a range of climate [62] and remotely sensed [63]environmental covariates showed no strong relationships(Figure S1.5 and S1.6 in Protocol S1), supporting thepredominantly univariate approach to the analyses.There is a common misconception that malariometric
surveys are only conducted in areas of high prevalence. Infact, an increasing tendency to conduct national surveyspowered to be representative of all regions of a country, andthe confirmation of the absence of P. falciparum transmissionwhen sampling for P. vivax, result in many zero prevalencevalues being recorded in surveys. In total, 119 of 261 surveysreport zero values in America, 1,010 of 5,307 surveys reportzero values in Africaþ, and 775 of 2,385 surveys report zerovalues in the CSE Asia region (Figure 1).
Statistical DetailsGeostatistical algorithms generate continuous maps by
predicting values at unsampled locations using linearcombinations of the available sample data. In the mappingtask described in this study, it is intuitive that the confidenceattached to a prediction of PfPR2�10 at a given unsampledlocation will be affected by (i) the distribution of surveypoints around that location (the spatial density of thetraining data), (ii) the extent to which PfPR2�10 variessmoothly across space (the spatial heterogeneity of thetraining data), and (iii) the number of people sampled ineach survey (the precision of the component surveys in thetraining data). An MBG approach [27] was implemented in aBayesian statistical framework to incorporate these factors inthe generation of continuous maps of PfPR2�10 (Protocol S3).Because the data were collected at different times throughoutthe study period 1985–2008, it was important to extend thespatial-only geostatistical approach to a space-time frame-work that accounted simultaneously for the density and
PLoS Medicine | www.plosmedicine.org March 2009 | Volume 6 | Issue 3 | e10000480289
Global Malaria Endemicity

heterogeneity of the data in both space and time. The age-standardization algorithm was incorporated as a submodel inthe framework to allow the errors inherent in this process tobe estimated and propagated into the MBG stage (ProtocolS3).
For each region, a Bayesian geostatistical model wasconstructed in which the underlying value of PfPR2�10 in2007, PfPR2�10(xi), at each location xi was modelled as atransformation g(�) of a spatiotemporally structured fieldsuperimposed with unstructured (random) variation e(xi). Thenumber of P. falciparum positive responses Ni
þ from a totalsample of Ni at each survey location was modelled as aconditionally independent binomial variate given the unob-served underlying age-standardized PfPR2�10 value [36]. Thespatiotemporal component was represented by a stationaryGaussian process f(xi,ti) with mean l and covariance definedby a spatially anisotropic version of the space-time cova-riance function proposed by Stein [64]. A modification wasmade to the Stein covariance function to allow the time-marginal model to include a periodic component of wave-length 12 mo, providing the capability to model seasonaleffects in the observed temporal covariance structure. Theseeffects arise when studies performed in different years butduring similar calendar months have a tendency to be moresimilar to each other than would be expected in the absenceof seasonality. The mean component l was modelled as alinear function of time t and whether the prediction locationx was urban, or peri-urban (denoted by the indicator variables1u(x) and 1p(x), respectively) rather than rural: l ¼ bx þ btt þbu1u(x)þ bp1p(x). Each survey was referenced temporally usingthe mid-point (in decimal years) between the recorded startand end months. Urban, peri-urban, or rural status wasassigned to each prediction location using the modifiedGRUMP UE surface described previously (Protocol S2.2),resampled to a 5 3 5 km grid. The unstructured componente(xi) was represented as Gaussian with zero mean and varianceV. Bayesian inference was implemented using Markov ChainMonte Carlo (MCMC) to generate samples from the posteriordistribution of: the Gaussian field f(xi,ti) at each data location;the unobserved parameters bx, bt, bu, bp, and V as stated aboveand further unobserved parameters defining the structureand anisotropy of the exponential space-time covariancefunction (Protocol S3.4). Distances between locations werecomputed in great-circle distance to incorporate the effect ofthe curvature of the Earth, which becomes important at theregional scale. Samples were generated from the 2007 annualmean of the posterior distribution of f(xi,ti) at each predictionlocation. For each sample of the joint posterior, predictionswere made using space-time conditional simulation over the12 mo of 2007 ft ¼ 2007Jan, . . ., 2007Decg [44,65]. Thesepredictions were made at points on a regular 53 5 km spatialgrid within the spatial limits of stable P. falciparum trans-mission. Model output therefore consisted of samples fromthe predicted posterior distribution of the 2007 annual meanPfPR2�10 at each grid location, which were used to generatepoint estimates (computed as the mean of each set ofposterior samples), endemicity class membership probabil-ities, and standard variance estimates (Protocol S3.4). Furtherdescription of how geostatistical outputs were used togenerate the various maps described is provided (ProtocolS3.5).
Model ValidationAn assessment of the plausibility of the mapped surface was
essential and several nontrivial descriptive methods wereimplemented (Protocol S4). The ability of the model topredict point-values of PfPR2�10 and the most probableendemicity class was tested using a hold-out procedure. Avalidation set was generated by the selection via spatiallydeclustered stratified random sampling of 10% of the data (n¼ 800), which were then removed from the dataset (ProtocolS4.1). The model was then run in full using the remaining7,153 data points to generate predictive posterior distribu-tions of PfPR2�10 for comparison with known values at thelocations of the 800 held-out data. In contrast to the mainmodel run, in which annual means were predicted for 2007,the validation run predicted Pf PR2�10 for the monthcorresponding to the mid-point of each held-out survey, toprovide temporally comparable values. Given the large size ofthe dataset, a single validation set was considered sufficient togenerate validation statistics with the required level ofprecision.The ability to predict known values of PfPR2�10 was
summarised using mean error as a measure of overall bias,mean absolute error as a measure of overall accuracy, and thecorrelation coefficient as a measure of linear association[44,66]. These statistics were presented as both absolutevalues and as a proportion of the mean PfPR2�10 in eachregion as calculated from the validation set. The ability topredict endemicity class membership was tested using thearea-under-curve (AUC) statistic derived from receiver-operating-characteristic curves, which plot sensitivity versus1-specificity for each endemicity class [34,67]. AUC valuesabove 0.9 indicate excellent agreement between actual andpredicted class membership, values above 0.7 indicate amoderately good agreement, and values of 0.5 indicate thatthe model performs no better than a random allocation ofclass membership [34,67]. A procedure was also implemented[44,68] to test the extent to which predicted posteriordistributions at each prediction location provided a suitablemeasure of uncertainty. This procedure allowed the proba-bility assigned to predicted values of PfPR2�10 at eachprediction location to be compared to the correspondingobserved probabilities within each region. Further details ofthis procedure are provided (Protocol S4.2).Frequency distributions of PfPR2�10 were visualised for
both input data and the output predicted surface using violinplots [69]. These plots display a smoothed approximation ofthe frequency distribution (a kernel density plot) of PfPR2�10for each region overlaid on a central bar showing median andinter-quartile range values. Separate plots were computedusing age-standardized PfPR2�10 data from all years in thedatabase and for 2007 only, and a further plot was computedusing point estimates for every location on the predictedoutput PfPR2�10 surface for 2007.
Estimating Human Population Density in 2007The GRUMP alpha version provides gridded population
counts and population density estimates at 1 3 1 km spatialresolution for the years 1990, 1995, and 2000, both adjustedand unadjusted to the United Nations’ national populationestimates (Protocol S2.3) [60,61]. The adjusted populationcounts for the year 2000 were projected to 2007 by applyingthe relevant national, medium variant, inter-censal growth
PLoS Medicine | www.plosmedicine.org March 2009 | Volume 6 | Issue 3 | e10000480290
Global Malaria Endemicity

rates by country [70] using methods described previously(Protocol S2.4) [71]. These population counts were thenstratified nationally by age group using United Nations-defined [72] population age structures for the year 2005 toobtain 0–4 years, 5–14 y, and�15 y population count surfaces.
Digital boundaries of the 87 P. falciparum malaria endemiccountries were overlaid on the urban-adjusted endemicityclass surface (reprojected to an equal area projection), andareas of each endemicity class were extracted using ArcViewGIS 3.2 (ESRI, 1999) (Protocol S2.4). These layers were alsooverlaid on the GRUMP data [60,61] to extract urban adjustedestimates of PAR of P. falciparum by endemicity and age class(Protocol S2.4). Finally these surfaces were combined with the
uncertainty maps to provide a population-weighted index ofuncertainty (the product of the log of population density andthe reciprocal of the probability of correct class assignment).
Results
Accuracy of the Predicted P. falciparum MalariaEndemicity MapThe continuous predicted surface of P. falciparum malaria
endemicity is shown in Figure 3. The control relatedendemicity class for which membership is most probable isshown in Figure 4. The actual probability of predicting eachclass correctly is given in Figure 5A. A detailed description ofthe regional variation of the area at these different levels of
Figure 3. The Spatial Distribution of P. falciparum Malaria Endemicity
The data are the model-based geostatistical point estimates of the annual mean Pf PR2�10 for 2007 within the stable spatial limits of P. falciparummalaria transmission, displayed as a continuum of yellow to red from 0%–100% (see map legend). The rest of the land area was defined as unstable risk(medium grey areas, where PfAPI , 0.1 per 1,000 pa) or no risk (light grey, where PfAPI¼ 0 per 1,000 pa) [17–19].doi:10.1371/journal.pmed.1000048.g003
Figure 4. The Spatial Distribution of P. falciparum Malaria Pf PR2�10 Predictions Stratified by Endemicity Class
They are categorized as low risk Pf PR2�10 � 5%, light red; intermediate risk Pf PR2�10 . 5% to , 40%, medium red; and high risk Pf PR2�10 � 40%, darkred. The map shows the class to which Pf PR2�10 has the highest predicted probability of membership. The rest of the land area was defined as unstablerisk (medium grey areas, where PfAPI , 0.1 per 1,000 pa) or no risk (light grey) [17–19].doi:10.1371/journal.pmed.1000048.g004
PLoS Medicine | www.plosmedicine.org March 2009 | Volume 6 | Issue 3 | e10000480291
Global Malaria Endemicity

stable risk and the associated PAR, follows a description ofthe accuracy of the predictions in the text. Alternativemeasures of the uncertainty of the predictions are provided(Protocol S4.3).
Predicting Point-Values of Pf PR2�10
Examination of the mean error in the generation of the P.falciparum malaria endemicity surface (Figure 3) revealedminimal overall bias in predicted PfPR2�10 values with aglobal value of 0.91 revealing an overall tendency tooverestimate PfPR2�10 by less than 1% (Americas ¼ 0.63,Africaþ¼ 0.80, CSE Asia¼ 1.18) (Table 1). Examination of themean absolute error revealed an average magnitude of errorin PfPR2�10 predictions of 9.75 (Americas ¼ 3.52, Africaþ¼11.02, CSE Asia ¼ 7.71) (Table 1). The global correlationcoefficient between actual and predicted values was 0.82,indicating excellent linear agreement at the global level andthis was further illustrated in the scatter plot (Figure 6A;
Table 1). The regional level correlations for the Americas andCSE Asia were generally weaker (Americas ¼ 0.03, Africaþ¼0.82, CSE Asia ¼ 0.70) (Table 1). A semi-variogram ofstandardised model residuals (Figure 6B) showed someevidence of very weak spatial autocorrelation, up to lags ofaround two decimal degrees, although comparison with asimulated null-envelope revealed that this was not statisticallysignificant (Protocol S4.2).
Predicting Endemicity ClassThe receiver-operating-characteristic curves and AUC
statistics for each endemicity class are shown (Figure 6C;Table 2). Global AUC values for all three endemicity classesexceeded the 0.7 threshold for fair to good discrimination,whilst those for both the PfPR2�10 � 5% and PfPR2�10 � 40%classes exceeded the 0.9 threshold for excellent discrimina-tion. Overall, 70.8% of points were classified correctly(Americas ¼ 80.0%, Africaþ ¼ 70.6%, CSE Asia ¼ 69.9%)
Figure 5. Maps of Model Uncertainty
(A) The probability of Pf PR2�10 being in the class to which it was assigned is mapped and shown as a yellow to blue continuum from 0.3� 1. Any valueabove 0.3 is better than a chance allocation. The rest of the land area was defined as unstable risk (medium grey areas, where PfAPI , 0.1 per 1,000 pa)or no risk (light grey) [17–19].(B) The population-weighted index of uncertainty. This index shows the likely importance of uncertainty assessed by the product of the log ofpopulation density (Protocol S2.3) and the reciprocal of the probability of correct class assignment, rescaled from 0–1. The index is shown for the mostprobable Pf PR2�10 endemicity class. Unstable and no risk are as (A).doi:10.1371/journal.pmed.1000048.g005
PLoS Medicine | www.plosmedicine.org March 2009 | Volume 6 | Issue 3 | e10000480292
Global Malaria Endemicity

Table 1. Summary of the Validation Statistics for Predicting Continuous Pf PR2�10 by Region
Validation Measure Americas Africaþ CSE Asia World
Mean error 0.627 (20.401) 0.805 (3.070) 1.184 (9.203) 0.912 (4.267)
Mean absolute error 3.522 (114.639) 11.023 (42.024) 7.705 (59.860) 9.750 (45.625)
Correlation 0.032 0.822 0.699 0.823
The mean of each predicted posterior distribution was used as the point estimate of Pf PR2�10 for comparison with observed values. Values in parentheses indicate the percentage of theregional mean represented by the corresponding error value. See text for a full explanation on the derivation of these statistics and interpretation of results.doi:10.1371/journal.pmed.1000048.t001
Figure 6. Model Validation Plots
(A) Scatter plot of actual versus predicted point-values of Pf PR2�10.(B) Sample semi-variogram of standardized model Pearson residuals estimated at discrete lags (circles) and compared to a Monte Carlo envelope(dashed lines) representing the range of values expected by chance in the absence of spatial autocorrelation.(C) Receiver-Operating-Characteristic curves for each Pf PR2�10 endemicity class (black line, Pf PR2�10 � 5%; red line, Pf PR2�10 . 5% to , 40%; greenline, Pf PR2�10 � 40%) and associated AUC statistics.(D) Probability-probability plot comparing predicted probability thresholds with the actual percentage of true values exceeding those thresholds. In the top leftand bottom left plots the 1:1 line is also shown (dashed line) for reference. See text for full explanation of validation procedures and interpretation of results.doi:10.1371/journal.pmed.1000048.g006
PLoS Medicine | www.plosmedicine.org March 2009 | Volume 6 | Issue 3 | e10000480293
Global Malaria Endemicity

and importantly, only 1.1% of points were grossly misclassi-fied to a nonadjacent class (Americas¼ 0.0%, Africaþ¼ 0.6%,CSE Asia¼ 2.5%) (Table 2). A full contingency table for eachclass is provided (Protocol S4.3).
Providing Realistic Measures of Uncertainty for EachPrediction
The probability-probability plot comparing predictedprobability thresholds with observed coverage probabilities(Figure 6D) shows generally close correspondence betweenthese two measures, suggesting that the model provides areasonably faithful representation of the uncertainty in thepoint predictions. However, the plotted line falls slightlyabove the 1:1 line across most threshold values, mostsubstantially for probability thresholds between 0.00 andaround 0.25. This means that a predicted probability thresh-old of, for example, 0.1, is likely to relate to an ‘‘actualprobability threshold’’ of around 0.2. In other words, themodel has a tendency to underestimate the probability ofPfPR2�10 taking low values (Figure S4.1A in Protocol S4). Thistendency may have led, in turn, to overestimates of PfPR2�10in some low endemicity areas.
Global P. falciparum Malaria Endemicity MapIn 2007 the global area at risk of stable P. falciparum malaria
was 29.73 million km2, distributed between the Americas (6.03million km2, 20.30%), Africaþ (18.17 million km2, 61.10%),and CSE Asia regions (5.53 million km2, 18.60%) (Table 3). Wehave estimated previously that there are 2.37 billion people atany risk of P. falciparum transmission worldwide and that 0.98billion of these live where the risk is unstable [17,18]. Thoseexposed to stable risk, 1.383 billion, are distributed betweenthe Americas (0.041 billion, 2.94%), Africaþ (0.657 billion,47.48%), and CSE Asia (0.686 billion, 49.58%) (Figure 7; Table4). The regional variation in stable P. falciparum risk, stratified
by the low (PfPR2�10 � 5%), intermediate (PfPR2�10 . 5 to ,
40%), and high (Pf PR2�10 � 40%) endemicity classesfacilitated by these analyses are described below. In theAmericas and CSE Asia, children (the 0–4 y and 5–14 y agegroupings) approach a third (32% each) of the total PAR. InAfricaþ this proportion rises to 43%.
The AmericasThe stable P. falciparum transmission area of the Americas is
characterised by a uniformly low endemicity (PfPR2�10 � 5%)(Figures 3 and 4). The total area at stable risk covers 6.03million km2, mostly located in the Amazon basin (Figures 3and 4). All the 40.64 million people in this region are exposedto this low risk. The median prevalence was 2.17% with thelowest and highest predicted PfPR2�10 values 0.31% and8.81%, respectively (Figure 8C). Examination of the fre-quency distributions for the region showed predicted valuesdistributed approximately symmetrically around this medianvalue (Figure 8C). The input data for 2007 (Figure 8B) showeda similar range but were positively skewed, whilst those for allyears included values over a larger range (max¼ 21.30%) anddisplayed a pronounced positive skew (Figure 8A). Theprobability of correct endemicity class assignments was highin the Americas (Figure S4.1A in Protocol S4), due mainly tothe relative uniformity of the low PfPR2�10 value survey data[17,18], rather than any strong spatial structure (Figure S1.1in Protocol S1). This result, combined with the relatively lowpopulation density of the region, led to the lowest values ofthe population weighted index of uncertainty (Figure 5B).
AfricaþThe stable P. falciparum transmission area in the Africaþ
region covers 18.17 million km2, which contains 656.61million people at risk and spans a wide range in transmissionintensity. Over 4.03 million km2 (22.18%) of this area and
Table 2. Summary of the Validation Statistics for Predicting Pf PR2�10 Endemicity Class by Region
Validation Measure Americas Africaþ CSE Asia World
AUC (� 5%) 0.452 0.927 0.885 0.915
AUC (.5% to , 40%) 0.452 0.758 0.813 0.779
AUC (� 40%) — 0.921 0.842 0.927
Overall % correct 80.000 70.621 69.874 70.750
� 5% classed as � 40% (%) 0.000 0.188 0.418 0.250
� 40% classed as � 5% (%) 0.000 0.377 2.092 0.875
See text for a full explanation on the derivation of these statistics and interpretation of results.doi:10.1371/journal.pmed.1000048.t002
Table 3. Area at Risk of P. falciparum Malaria in 2007
Region Unstable Risk Stable Risk Pf PR2�10 � 5% Pf PR2�10.5 to ,40% Pf PR2�10 � 40% Total
Americas 2.13 6.03 6.03 0.00 0.00 8.17
Africaþ 4.21 18.17 4.03 5.63 8.50 22.37
CSE Asia 3.40 5.53 4.72 0.69 0.11 8.93
World 9.74 29.72 14.79 6.32 8.61 39.46
Areas are in millions of km2. Unstable risk (PfAPI , 0.1 per 1,000 people pa) and stable risk (PfAPI � 0.1 per 1,000 people pa). Stable risk is subdivided into three age-standardized [51] andcontrol-related PfPR2�10 endemicity classes [19].doi:10.1371/journal.pmed.1000048.t003
PLoS Medicine | www.plosmedicine.org March 2009 | Volume 6 | Issue 3 | e10000480294
Global Malaria Endemicity

114.50 million people (17.44%) experience PfPR2�10 � 5%.These areas are located in the central and eastern extents ofthe southern and northern most latitudes (Figures 3 and 4).This endemicity class was relatively confidently predicted(Figure S4.1A in Protocol S4). The high transmission regionswhere PfPR2�10 � 40% dominate West Africa and large areasof Central Africa, covering 8.50 million km2, in which 345.28million people are at risk. The probability of correctendemicity class prediction was high in West Africa andmuch lower in Central Africa (Figure S4.1C in Protocol S4),due to the relative abundance of contemporary PfPR2�10survey data in the former region and paucity in the latter(Figure 1). A significant area of the continent (5.63 millionkm2) has intermediate endemicity values, PfPR2�10 . 5% to, 40%, and contains 196.83 million PAR. This endemicityclass was predicted with the least confidence (Figure S4.1B inProtocol S4).
The median predicted prevalence for the stable endemicityarea of the continent was 33.34%, with the lowest and highestpredicted PfPR2�10 values 0.20% and 75.40%, respectively
(Figure 8C). The frequency distribution of predicted values(Figure 8) was centred on this median value, with a much lesspronounced secondary mode centred at around 15% (Figure8C). This distribution was very different to those of the all-yearand 2007 input data, which were both positively skewed withmaximum values of 99.78% and 98.70%, respectively (Figure8A and 8B, respectively). The population weighted index ofuncertainty shows a mixed picture for the region, with highvalues evident in Ethiopia for the low endemicity class andhigh values evident in Nigeria for the high endemicity class(Figure 5B), reflecting the co-occurrence of both low densityof PfPR2�10 surveys and large populations in each country.
CSE AsiaThe stable P. falciparum transmission area of the CSE Asia
region is characterised by low malaria endemicity (PfPR2�10 �5%), with geographically small but epidemiologically impor-tant patches of intermediate (PfPR2�10 . 5 to , 40%) andhigh risk (PfPR2�10 � 40%) in for example, Orissa state,eastern India, western Myanmar, and the lowlands of NewGuinea. The total area at stable risk covers 5.53 million km2,
Figure 7. Pie Charts Showing the PAR of P. falciparum Malaria in 2007
The charts show the proportion of the population living in each predicted Pf PR2�10 endemicity classes for the America, Africaþ, CSE Asia regions, andworldwide. The charts are scaled proportionally to the total population at risk in each region and the segments are coloured to match the endemicityclasses shown in Figure 4.doi:10.1371/journal.pmed.1000048.g007
Table 4. PAR of P. falciparum Malaria in 2007
Region Age Range Unstable Riska Stable Riska Pf PR2�10 � 5% Pf PR2�10 . 5 to , 40% Pf PR2�10 � 40% Total
Americas 0–4 5.62 4.51 4.51 0.00 0.00 10.14
5–14 10.66 8.66 8.66 0.00 0.00 19.32
15þ 33.78 27.47 27.47 0.00 0.00 61.25
Total 50.06 40.64 40.64 0.00 0.00 90.71
Africaþ 0–4 3.29 108.64 15.48 32.90 60.26 111.93
5–14 5.64 170.80 25.35 51.48 93.98 176.44
15þ 12.95 377.17 73.67 112.45 191.05 390.12
Total 21.88 656.61 114.50 196.83 345.28 678.49
CSE Asia 0–4 99.69 73.70 64.98 8.10 0.62 173.38
5–14 195.40 143.20 126.26 15.67 1.27 338.60
15þ 616.17 468.75 412.37 51.52 4.86 1,084.93
Total 911.26 685.65 603.61 75.29 6.75 1,596.91
World 0–4 108.60 186.85 84.97 41.00 60.88 301.31
5–14 211.70 322.66 160.26 67.15 95.25 560.40
15þ 662.90 873.40 513.51 163.97 195.91 1,504.41
Total 983.20 1,382.91 758.75 272.13 352.04 2,366.11
Populations are in millions. Unstable risk (PfAPI , 0.1 per 1,000 people pa) and stable risk (PfAPI � 0.1 per 1,000 people pa). Stable risk is subdivided into three age-standardized [51] andcontrol-related Pf PR2�10 endemicity classes [19]. For each region PAR is further subdivided by 0–4 y, 5–14 y, and 15þ age group.aIt should be noted that the computing constraints that required the resampling of the spatial limits to a 5 3 5 km spatial resolution will inevitably result in very slight changes to the totalglobal PAR, estimated previously at 1 3 1 km [18].doi:10.1371/journal.pmed.1000048.t004
PLoS Medicine | www.plosmedicine.org March 2009 | Volume 6 | Issue 3 | e10000480295
Global Malaria Endemicity

which contains 685.65 million PAR, mostly located in Indiaand Indonesia (Figures 3 and 4). Over 4.72 million km2
(85.54%) of this area and 603.61 million (88.03%) peopleexperience PfPR2�10 � 5%. The median predicted prevalencewas 9.99%, with the lowest and highest predicted PfPR2�10values 0.006% and 45.40%, respectively. The frequencydistribution of predicted PfPR2�10 values was positively
skewed (Figure 8C). The frequency distribution of the 2007input data spanned a similar range of values, but displayed amore pronounced positive skew (Figure 8B). The plot for datafrom all years was also positively skewed but covered a muchlarger range of values, with a maximum of 93.91% (Figure 8A).The probability of correct endemicity class assignments wasrelatively high in the CSE Asia region, but with considerableuncertainty in the border areas between the low andintermediate endemicity classes (Figure S4.1A in ProtocolS4). This result, combined with the high population density ofthe region, led to highest values of the population weightedindex of uncertainty, notable particularly in India (Figure 5B).
Discussion
We have to our knowledge, for the first time in 40 yprovided a contemporary map of P. falciparum malariaendemicity at the global scale. The map addresses the keydeficiencies of older maps of the global distribution ofmalaria risk outlined previously and therefore is unique inthe following ways. First, it is based on a heavily documentedand geographically extensive malariometric survey database(Protocol S1) [58] that will be released in the public domain(where permission has been granted for individual surveys)for all to use and evaluate in 2009 [1]. Second, the MBGmethods (Protocol S3) and validation procedures (ProtocolS4) have also been documented in exhaustive detail and therelevant code been made available in the public domain. Theentire mapping process should therefore be reproducible bythose with access to the requisite computing resources. Third,a rigorous assessment of the uncertainty associated with themapped outputs has been undertaken so that the confidencein the results can be evaluated objectively (Figure 5).
The World Malaria Situation in 2007The world is substantially less malarious than would be
predicted from the inspection of historical maps [5,14], boththrough a shrinking of the spatial limits and through areduction in endemicity within this range. There is a strikingglobal transition to a lower risk malaria ecology that will beexplored in more detail in future work.Of the 1.382 billion people exposed to stable malaria risk
worldwide in 2007, 0.759 billion live in conditions ofextremely low malaria endemicity with PfPR2�10 � 5% inthe CSE Asia (0.604 billion, 79.55%), Africaþ (0.115 billion,15.09%), and America (0.041 billion, 5.36%) regions (Figure 7;Table 4). These populations live under conditions where thebiological prospects for sustained control at very low levels ofmalaria transmission is achievable and are ultimately com-patible with a long-term movement toward elimination [19].Specific subregional and national recommendations shouldof course, however, be shaped by a sober assessment of otherenvironmental, logistical, financial, and political factorsaffecting the efficiency with which intervention plans mightbe implemented [73–75]. To a good approximation, the restof the global population at stable malaria risk are Africans:0.197 billion live under conditions of intermediate risk(PfPR2�10 . 5 to , 40%) and 0.345 billion under conditionsof high risk (PfPR2�10 � 40%) (Figure 7; Table 4). In the areasof intermediate risk, mathematical modelling suggests that bytaking ITNs to scale, the interruption of P. falciparum malariatransmission might be achieved, whereas in the high trans-
Figure 8. Violin Plots Showing for Each Region Frequency Distributions
of Pf PR2�10 data
(A) For all years, (B) for 2007, and (C) for the predicted 2007 surface. Thewidth of each polygon illustrates the relative frequency of differentPf PR2�10 values within each region. The background is coloured to matchthe endemicity classes shown in Figure 4. The black central bar indicates theinter-quartile range and white circles indicate the median values (see text).doi:10.1371/journal.pmed.1000048.g008
PLoS Medicine | www.plosmedicine.org March 2009 | Volume 6 | Issue 3 | e10000480296
Global Malaria Endemicity
mission areas, malaria transmission will be more intractableand require aggressive control with suites of additional andcomplementary interventions [19,55].
Statistical Implementation and Model ValidationThe modelling procedure presented here represents a large
scale implementation of modern Bayesian geostatisticaltechniques and incorporates a number of novel components.The incorporation of an age-standardization model hasallowed the coherent assimilation of survey data obtainedacross a wide variety of surveyed age ranges whilst acknowl-edging the uncertainty introduced by this additional sourceof variation. Likewise, the use of a fully spatiotemporalrandom field has allowed surveys from as early as 1985 to beincorporated in the prediction of contemporary P. falciparumendemicity in a statistically and epidemiologically plausibleframework.
MBG techniques are exceptionally computationally de-manding even for small prediction problems. To our knowl-edge this is the first time these procedures have been appliedto any disease at the global scale. This computational burdenhas also imposed a number of restrictions on the modellingprocedure that may have improved predictive capability. Inparticular, the current model adopts a single mean andcovariance function within each global region, representingan assumption of second-order stationarity within each.Approximations to nonstationary random fields adopted insmaller scale studies [32,76] represent possible refinements tothe current model, but were considered computationallyinfeasible globally.
Assessment of the various validation statistics revealed thatthe model performed satisfactorily for each of the threeperformance aspects: predicting PfPR2�10 point values andendemicity class, and providing realistic measures of pre-diction uncertainty. Given the highly variable nature of P.falciparum endemicity over even short distances, an overallcorrelation of 0.82 between the model predictions andvalidation data, and an average absolute error magnitude of9.75% PfPR2�10 represents an unexpected level of precision.Certain aspects of the uncertainty measures output by themodel are suboptimal: in particular, the tendency to under-estimate slightly the probability of PfPR2�10 taking very lowvalues. Nevertheless, given the multitude of sources ofuncertainty that are captured and propagated though themodelling framework, the resulting uncertainty predictionsrepresent a rich source of information in the generation ofoutput products for decision makers.
The model was fitted using MCMC [77,78]. MCMC is anextremely powerful algorithm, and is the only general-purpose, computationally tractable algorithm available formany Bayesian problems. However, it is an approximatealgorithm. No fail-proof method for estimating its error isavailable, but using a heuristic method (Protocol S1.3) weestimated that our ‘‘Monte Carlo error’’ is unimportantrelative to the uncertainty in our actual posterior distribu-tions.
The information contained in the maps presented here andthe associated uncertainty varies across a range of geo-graphical scales. The large-scale variation in endemicitydescribed between regions and countries is unambiguous,robustly quantified, and of direct use to global planners. Asprogressively finer scales are considered, however, the utility
of these maps for local malaria control managers diminishesalthough this is heavily dependent on the local availabilityand density of survey points. The appropriate threshold andmetric of uncertainty will vary enormously for different endusers and applications of the maps. As a rule-of-thumb,however, it is suggested that the differentiation in endemicitybetween areas smaller than the first administrative levelwould be inappropriate for most countries.Examination of the frequency distributions for all-year and
2007 input PfPR2�10 data, and for the predicted PfPR2�10surface, revealed a number of important features. Firstly,2007 data from all three regions displayed substantiallysmaller median and maximum values and were morepositively skewed than data from all years consideredtogether (compare Figure 8A and 8B). Secondly, there weremarked differences in all regions between the distribution of2007 data values and the distribution of values from thepredicted PfPR2�10 surface (compare Figure 8B and 8C).Specifically, the latter distributions had larger medians, wereless positively skewed, and for the Americas and Africaþ hadsubstantially smaller maximum values. The overall shifttowards higher PfPR2�10 in the predicted surfaces can beattributed to the spatial clustering of the survey locations. Itmust always be remembered that the set of surveys collatedrepresents an opportunistic sample driven by the motivationsand constraints of a multitude of individuals, organizations,and governments. Visual examination of this set reveals aconsiderably larger proportion located in lower endemicityregions than would be the case in a spatially random sampleand, as such, summary statistics of these raw data display asubstantial bias. By predicting endemicity over a continuoussurface, the MBG process compensated implicitly for thisclustering in the output maps and the resulting frequencydistribution was not biased in the same way.The MBG process makes predictions at unsampled loca-
tions using linear combinations of survey data. For thisreason, the resulting surfaces are inevitably smoother thanthe raw data from which they are predicted. One feature ofthis smoothing process is that the range of extreme high andlow values in the predicted surface is likely to be smaller thanthat displayed by the input data. This explains why thefrequency distributions for the predicted PfPR2�10 surfacecover substantially smaller ranges of values than those of theinput data. An important implication of this smoothing effectis that the predicted surface provides a more robustprediction of endemicity at larger scales but is less able torepresent faithfully the short-scale variations occurring oververy short distances.
Using Environmental Covariates to Make Continuous MapsThe extreme limiting effects of climate covariates have
been incorporated comprehensively in the definition of thestable and unstable limits of P. falciparum malaria trans-mission described above [18]. There is an illusory attractionin the further use of environmental covariates to increasecomplexity and improve predictive accuracy in MBG ende-micity mapping. This is because such analyses are based onthe assumption that the contemporary distribution andendemicity of malaria approximates its fundamental niche[79,80]. This assumption is unfounded because the globaldistribution of malaria has contracted substantially [18] sinceits hypothesised maximum distribution circa 1900 [14].
PLoS Medicine | www.plosmedicine.org March 2009 | Volume 6 | Issue 3 | e10000480297
Global Malaria Endemicity

Moreover, it is not known to what extent the environmentaldeterminants of the remaining distribution reflect thisfundamental niche, how these relationships might varyspatially, and therefore, what artefacts might be introducedby their inclusion in the analyses. In addition, it is not trivialto obtain ‘‘adequate’’ environmental covariates at a globallevel with the required spatial and temporal fidelity [63,81].Finally, the degree to which these relations would be furtherobscured by ongoing and spatially variable interventionefforts is also unquantified. An increasing body of evidencepoints to these intervention effects being substantial, to haveaccelerated in the post 2000 period, and to represent a spatialmosaic of influence that would act to confound substantiallyany modelled relationships [82–90]. Unsurprisingly, nostatistical support was found for the inclusion of a range ofclimate [62] and remotely sensed [63] environmental cova-riates (Protocol S1.7).
In eschewing the use of environmental covariates in thisanalysis framework, the output maps are determined only bythe input survey data and the assumptions of the modelling.This choice ensures a maximally parsimonious baseline,against which future changes may be audited.
Potential Geostatistical ImprovementsIn embracing the MBG approach, the rationale for
excluding surveys with a sample size below 50 is diminished,as the uncertainty in relation to the population sampled isexplicitly modelled by the technique (Protocol S3). Thisexclusion rule was devised at a time before MBG could beapplied at a global scale and will be revised in futureiterations of the map.
The spatial resolution with which these MBG techniquescould be reasonably implemented on a computer cluster wason a 53 5 km grid. The entire process took an average of onemonth at this spatial resolution and has been estimated totake one year to run on a 13 1 km spatial grid. There are noplans to increase the spatial resolution of the output maps atthe global scale because they are robust for the regionalplanning purposes for which they are intended. For smallerareas, such as PfPR data rich countries where higher spatialresolution maps may be desirable to support national controlplans, however, MBG outputs to 1 3 1 km grids can beconsidered [33]. Moreover, at these national scales, the fidelityof the geo-positioning of the input PfPR survey data mayhave an important influence on the uncertainty of thepredictions, so procedures that can help incorporate theseeffects into the modelling may also need to be investigated[91–93]. In this study, the uncertainty likely to be contributedby geo-positioning errors was thought to be trivial in relationto the scales of spatial variation in observed endemicity andgiven the global scale of model outputs.
We were not able to improve the age-correction model’spredictive performance by modelling the age-dependentsensitivities of microscopy and rapid diagnostic tests sepa-rately or by modelling diagnostic specificity. The accuracy inthe determination of PfPR by microscopy or rapid diagnostictests were assumed to be equivalent in these analyses, but thesensitivity of the diagnostic technique [94–98] could beincluded into a future iterations of this MBG framework.
No solution could be found to applying these MBGtechniques across large tracts of ocean (for example in theCaribbean, Madagascar, and the Indonesian archipelago),
given the global distribution of the PfPR data and the lack ofdata in some regions (Figure 1). Potential biogeographicalinfluences on malaria transmission on islands are ignored bythese analyses. Future map iterations would ideally havesufficient data to treat islands separately or sufficientinformation on the distribution of Anopheles vectors to helpinform the predictions [56].We have incorporated the ability for the analyses to be
cognisant of secular trends in the PfPR data and of annualvariations in transmission. This map does not provide a fulldescription of seasonal malaria dynamics [99–101], however,and further information on the global variation of malariaseasonality might inform future map iterations.
The Road Ahead: Public Domain and Dynamic MapsThese mapped surfaces are made available in the public
domain with the publication of this article. The underlyingdata used in their predictions are due for public release in2009 [1], and the online infrastructure to host this service isunder development. The MAP team anticipate providingannual updates of this P. falciparum global malaria endemicitymap and the accompanying PfPR database. Annual updateswill also be required to reflect the changing spatial limits ofstable and unstable P. falciparum malaria transmission [18] inorder to define accurately the limits within which endemicitypredictions need to be made. If the international communityis successful in rolling back malaria, informed decisions willneed to be made about the temporal discontinuity betweenthe spatial limits of P. falciparum malaria transmission(defined, where possible, by the average PfAPI in the threemost recently recorded years [18]) and the endemicity data(PfPR collected since 1985).It is obvious that the predicted map represents a snapshot
of the year 2007 from a malaria endemicity that changesthrough time. No degree of statistical sophistication cancircumvent the fact that additional data will increase thefidelity of the map, by either increasing the spatial resolutionof the malariometric surveys or updating an existing surveylocation with more recent information. The methods havebeen devised specifically so that these surfaces can be updatedrapidly. The predominantly univariate approach adopted alsomeans changes in future maps’ iterations can be attributedreliably to finding more data in areas of high uncertainty(changes in space) or to changes brought about throughintervention success or disease recession (changes in time),rather than any temporal and spatial mix of the relationshipof the PfPR2�10 data and the environmental covariates.We encourage the submission of additional existing data to
improve the map in areas where we have least spatial accuracy,and new data to sustain future production of updatedcontemporary maps. Current areas of highest uncertaintyare indicated to a good approximation by the inverse of theclass prediction probability (Figure 5), although future work isaimed at refining this information. Therefore, an immediatepriority is to generate regional maps showing the optimallocation of new surveys that would need to be implemented tomaximally reduce the variance in the existing endemicitysurface for the minimum cost. These solutions are substan-tially more involved than the list of areas with highest varianceprovided here because (i) each new survey will change thestructure of the spatial variance and affect the optimallocation of the next survey; (ii) both the number and spatial
PLoS Medicine | www.plosmedicine.org March 2009 | Volume 6 | Issue 3 | e10000480298
Global Malaria Endemicity

distribution of surveys will affect the outcome and requiremultiple simulations to converge on optimal solutions; and(iii) potential survey locations will need to be weightedappropriately by the distribution of the human population.
Immediate MAP GoalsThe initial focus of the MAP has been P. falciparum [1] due
to its global epidemiological significance [102] and its betterprospects for control and local elimination [19]. We have notyet addressed the significant problem of P. vivax burden [103]despite its increasingly recognised clinical importance [104–106], but have archived over 2,500 P. vivax parasite ratesurveys with which to start this process. Another immediategoal is in refining global burden of disease estimates for P.falciparum (both morbidity [102] and mortality [48,107,108]) tosupport global estimation of antimalarial intervention andcommodity needs. The statistical methods used in this analysiswill allow the next iteration of burden estimates to representmore holistically and robustly the uncertainty in predictions.In the medium term, combinations of these global endemicitymaps with forthcoming maps of the distribution of thedominant Anopheles vectors of human malaria [56] shouldempower malaria control managers to make more informeddecisions regarding interventions appropriate to the bio-nomics of their local suite of vectors. In the long term wehope to not only monitor and evaluate progress with thesemaps, but to increase our ability to model future malariaendemicity and support objective assessment of where in theworld it might be possible to eliminate malaria.
ConclusionsThe state of the P. falciparum malaria world in 2007
represents an enormous opportunity for the internationalcommunity to act [109,110], but these actions remainconsiderably under-resourced [111]. Regardless of whethernations champion sustained, intensive control or reach forthe higher ambition of malaria elimination [2–4,74,112–114],the intermediate intervention paths are similar [19]. Thiscartographic resource will help countries determine theirneeds and serve as a baseline to monitor and evaluateprogress towards interventional goals. We wish to continue towork alongside individuals, countries, and regions to improvefuture iterations of this map and document hopefully theseintervention successes.
Supporting Information
Alternative Language Text S1. Translation of the Article into Frenchby Frederic Piel and Stephanie Loute
Found at doi:10.1371/journal.pmed.1000048.sd001 (1.04 MB DOC).
Alternative Language Text S2. Translation of the Article intoChinese by Robert Li
Found at doi:10.1371/journal.pmed.1000048.sd002 (438 KB DOC).
Alternative Language Text S3. Translation of the Article intoIndonesian by Iqbal R.F. Elyazar and Siti Nurlela
Found at doi:10.1371/journal.pmed.1000048.sd003 (1.08 MB DOC).
Alternative Language Text S4. Translation of the Article intoVietnamese by Bui H. Manh
Found at doi:10.1371/journal.pmed.1000048.sd004 (549 KB DOC).
Alternative Language Text S5. Translation of the Article intoSpanish by Carlos A. Guerra
Found at doi:10.1371/journal.pmed.1000048.sd005 (796 KB DOC).
Protocol S1. The Pf PR Malariometric Survey Database
S1.1 Summary of Data Search and Data Abstraction ProceduresS1.2 Data Exclusion RulesS1.3 Age-StandardisationS1.4 Semi-Variograms of Pf PR2�10 Data by RegionS1.5 Geostatistical Filter for the Detection of Extreme OutliersS1.6 Malariometric Survey Data Summary and Descriptive StatisticsS1.7 Relationships with Environmental Covariates
Found at doi:10.1371/journal.pmed.1000048.sd006 (3.4 MB DOC).
Protocol S2. Demographic Databases and Procedures
S2.1 Parasite Rate Survey Urban/Peri-Urban/Rural ClassificationRulesS2.2 Urban/Peri-Urban/Rural Status and PrevalenceS2.3 GRUMP alpha Human Population SurfaceS2.4 PAR Derivation
Found at doi:10.1371/journal.pmed.1000048.sd007 (2.5 MB DOC).
Protocol S3. Model Based Geostatistical Procedures
S3.1 Overview of the Statistical ModelS3.2 Prior SpecificationS3.3 Age-StandardizationS3.4 Implementation DetailsS3.5 Overview of Map Generation
Found at doi:10.1371/journal.pmed.1000048.sd008 (23 MB DOC).
Protocol S4. Model Validation Procedures
S4.1 Creation of the Validation SetsS4.2 Procedures for Testing Model PerformanceS4.3 Additional ResultsFound at doi:10.1371/journal.pmed.1000048.sd009 (26 MB DOC).
Acknowledgments
The large global assembly of parasite prevalence surveys wasdependent critically on the generous contributions of data made bya large number of people in the malaria research and controlcommunities, and these individuals are listed on the MAP website(http://www.map.ac.uk/acknowledgements.html). We also thank Ar-chie Clements for comments on the manuscript. The authorsacknowledge the support of the Kenyan Medical Research Institute(KEMRI), and this paper is published with the permission of thedirector of KEMRI.
Author contributions. SIH and RWS conceived the experiments.SB and RAM had a statistical advisory role throughout. PWG, APP,and AJT refined and implemented the experimental protocols. DLSdevised the age-standardization procedures. SIH, CAG, AMN, CWK,BHM, IRFE, and RWS compiled and mapped the PfPR data. SIHwrote the first draft of the manuscript. SIH, CAG, PWG, APP, AJT,AMN, CWK, BHM, IRFE, SB, DLS, RAM, and RWS commented on thefinal draft of the manuscript.
Funding: SIH is funded by a Senior Research Fellowship from theWellcome Trust (number 079091), which also supports CAG, AJT, andPWG. AMN is supported by the Wellcome Trust as a ResearchTraining Fellow (number 081829). BHM and IRFE acknowledge thesupport of the Li Ka Shing foundation. SB is funded by the WellcomeTrust as a Career Development Fellow (number 081673). RWS is aWellcome Trust Principal Research Fellow (number 079080). Thisgrant also supports APP. This work forms part of the output of theMalaria Atlas Project (MAP, http://www.map.ox.ac.uk), principallyfunded by the Wellcome Trust, U.K. The funders had no role in studydesign, data collection and analysis, decision to publish, orpreparation of the manuscript.
References1. Hay SI, Snow RW (2006) The Malaria Atlas Project: developing global maps
of malaria risk. PLoS Med 3: e473. doi:10.1371/journal.pmed.00304732. Horton (2007) Is malaria eradication possible? Lancet 370: 1459.3. Roberts L, Enserink M (2007) Did they really say . . . eradication? Science
318: 1544–1545.4. Feachem R, Sabot O (2008) A new global malaria eradication strategy.
Lancet 10: 1633–1635.5. Lysenko AJ, Semashko IN (1968) Geography of malaria. A medico-
geographic profile of an ancient disease [in Russian].Lebedew AW editor.Itogi Nauki: Medicinskaja Geografija. Moscow: Academy of Sciences, USSR.pp. 25–146.
6. Boyd MF (1930) An introduction to malariology. Cambridge (Massachu-setts): Harvard University Press.
PLoS Medicine | www.plosmedicine.org March 2009 | Volume 6 | Issue 3 | e10000480299
Global Malaria Endemicity

7. Pampana EJ, Russell PF (1955) Le paludisme: probleme mondial. Geneva:World Health Organization. pp. 317–321.
8. Macdonald G (1957) Local features of malaria. The epidemiology andcontrol of malaria. London: Oxford University Press. pp. 63–99.
9. WHO (1966) Malaria eradication in 1965. World Health Organ Chron 20:286–300.
10. Dutta HM, Dutt AK (1978) Malarial ecology: a global perspective. Soc SciMed 12: 69–84.
11. WHO (1977) Information on the world malaria situation. Wkly EpidemiolRec 52.:
12. WHO (1994) World malaria situation in 1992. Part II. Wkly Epidemiol Rec69: 317–324.
13. WHO (1997) World malaria situation in 1994. Part I. Wkly Epidemiol Rec72: 269–274.
14. Hay SI, Guerra CA, Tatem AJ, Noor AM, Snow RW (2004) The globaldistribution and population at risk of malaria: past, present, and future.Lancet Infect Dis 4: 327–336.
15. Kiszewski A, Mellinger A, Spielman A, Malaney P, Sachs SE, et al. (2004) Aglobal index representing the stability of malaria transmission. Am J TropMed Hyg 70: 486–498.
16. Mouchet J, Carnevale P, Coosemans M, Julvez J, Manguin S, et al. (2004)Paludisme et grandes regions biogeographiques. Biodiversite du paludismedans le monde. Montrouge (France): John Libbey Eurotext.
17. Guerra CA (2007) Mapping the contemporary global distribution limits ofmalaria using empirical data and expert opinion [Doctoral thesis]. Oxford:University of Oxford. 258 p.
18. Guerra CA, Gikandi PW, Tatem AJ, Noor AM, Smith DL, et al. (2008) Thelimits and intensity of Plasmodium falciparum transmission: implications formalaria control and elimination worldwide. PLoS Med 5: e38. doi:10.1371/journal.pmed.0050038
19. Hay SI, Smith DL, Snow RW (2008) Measuring malaria endemicity fromintense to interrupted transmission. Lancet Infect Dis 8: 369–378.
20. Yekutiel P (1980) III The Global Malaria Eradication Campaign.KlingbergMA editor. Eradication of infectious diseases: a critical study. Basel:Karger. pp. 34–88.
21. Pampana E (1969) A textbook of malaria eradication. London: OxfordUniversity Press.
22. Kleinschmidt I, Bagayoko M, Clarke GPY, Craig M, Le Sueur D (2000) Aspatial statistical approach to malaria mapping. Int J Epidemiol 29: 355–361.
23. Kleinschmidt I, Omumbo J, Briet O, van de Giesen N, Sogoba N, et al.(2001) An empirical malaria distribution map for West Africa. Trop MedInt Health 6: 779–786.
24. Rogers DJ, Randolph SE, Snow RW, Hay SI (2002) Satellite imagery in thestudy and forecast of malaria. Nature 415: 710–715.
25. Omumbo JA, Hay SI, Snow RW, Tatem AJ, Rogers DJ (2005) Modellingmalaria risk in East Africa at high-spatial resolution. Trop Med Int Health10: 557–566.
26. Rogers DJ (2006) Models for vectors and vector-borne diseases. AdvParasitol 62: 1–35.
27. Diggle PJ, Tawn JA, Moyeed RA (1998) Model-based geostatistics. J Roy StatSoc C-App 47: 299–326.
28. Diggle P, Moyeed R, Rowlingson B, Thomson M (2002) Childhood malariain The Gambia: a case-study in model-based geostatistics. J Roy Stat Soc C-App 51: 493–506.
29. Gemperli A, Vounatsou P, Kleinschmidt I, Bagayoko M, Lengeler C, et al.(2004) Spatial patterns of infant mortality in Mali: the effect of malariaendemicity. Am J Epidemiol 159: 64–72.
30. Gemperli A, Vounatsou P, Sogoba N, Smith T (2006) Malaria mappingusing transmission models: application to survey data from Mali. Am JEpidemiol 163: 289–297.
31. Rattanasiri S, Bohning D, Rojanavipart P, Athipanyakom S (2004) Amixture model application in disease mapping of malaria. Southeast AsianJ Trop Med Public Health 35: 38–47.
32. Gosoniu L, Vounatsou P, Sogoba N, Smith T (2006) Bayesian modelling ofgeostatistical malaria risk data. Geospat Health 1: 127–139.
33. Noor AM, Clements ACA, Gething PW, Moloney G, Borle M, et al. (2008)Spatial prediction of Plasmodium falciparum prevalence in Somalia. Malar J7: 159.
34. Clements ACA, Lwambo NJS, Blair L, Nyandindi U, Kaatano G, et al. (2006)Bayesian spatial analysis and disease mapping: tools to enhance planningand implementation of a schistosomiasis control programme in Tanzania.Trop Med Int Health 11: 490–503.
35. Clements ACA, Moyeed R, Brooker S (2006) Bayesian geostatisticalprediction of the intensity of infection with Schistosoma mansoni in EastAfrica. Parasitology 133: 711–719.
36. Diggle PJ, Thomson MC, Christensen OF, Rowlingson B, Obsomer V, et al.(2007) Spatial modelling and the prediction of Loa loa risk: decisionmaking under uncertainty. Ann Trop Med Parasitol 101: 499–509.
37. Beck-Worner C, Raso G, Vounatsou P, N’Goran EK, Rigo G, et al. (2007)Bayesian spatial risk prediction of Schistosoma mansoni infection in westernCote d’Ivoire using a remotely-sensed digital elevation model. Am J TropMed Hyg 76: 956–963.
38. Raso G, Matthys B, N’Goran EK, Tanner M, Vounatsou P, et al. (2005)Spatial risk prediction and mapping of Schistosoma mansoni infections
among schoolchildren living in western Cote d’Ivoire. Parasitology 131:97–108.
39. Chiles J-P, Delfiner P (1999) Geostatistics: modeling spatial uncertainty.Toronto: John Wiley and Sons. 720 p.
40. Goovaerts P (1997) Geostatistics for natural resource evaluation. NewYork: Oxford University Press. 483 p.
41. Matheron G (1971) The theory of regionalized variables and itsapplications. Fontainebleau (France): Ecole Nationale Superieure desMines de Paris. 211 p.
42. Lawson AB (2001) Statistical methods in spatial epidemiology. Chichester:John Wiley and Sons. 277 p.
43. Best N, Richardson S, Thomson A (2005) A comparison of Bayesian spatialmodels for disease mapping. Stat Methods Med Res 14: 35–59.
44. Gething PW, Noor AM, Gikandi PW, Hay SI, Nixon MS, et al. (2008)Developing geostatistical space-time models to predict outpatient treat-ment burdens from incomplete national data. Geogr Anal 40: 167–188.
45. Gething PW, Noor AM, Goodman CA, Gikandi PW, Hay SI, et al. (2007)Information for decision making from imperfect national data: trackingmajor changes in health care use in Kenya using geostatistics. BMC Med 5:37.
46. Wang XH, Zhou XN, Vounatsou P, Chen Z, Utzinger J, et al. (2008)Bayesian spatio-temporal modeling of Schistosoma japonicum prevalencedata in the absence of a diagnostic ‘gold’ standard. PLoS Negl Trop Dis 2:e250. doi:10.1371/journal.pntd.0000250
47. Yang GJ, Vounatsou P, Zhou XN, Tanner M, Utzinger J (2005) A Bayesian-based approach for spatio-temporal modeling of county level prevalenceof Schistosoma japonicum infection in Jiangsu province, China. Int J Parasitol35: 155–162.
48. Hay SI, Guerra CA, Tatem AJ, Atkinson PM, Snow RW (2005) Urban-ization, malaria transmission and disease burden in Africa. Nat RevMicrobiol 3: 81–90.
49. Robert V, MacIntyre K, Keating J, Trape JF, Duchemin JB, et al. (2003)Malaria transmission in urban sub-Saharan Africa. Am J Trop Med Hyg 68:169–176.
50. Tatem AJ, Guerra CA, Kabaria CW, Noor AM, Hay SI (2008) Humanpopulation, urban settlement patterns and their impact Plasmodiumfalciparum malaria endemicity. Malar J 7: 218.
51. Smith DL, Guerra CA, Snow RW, Hay SI (2007) Standardizing estimates ofthe Plasmodium falciparum parasite rate. Malar J 6: 131.
52. Swaroop S (1959) Statistical considerations and methodology in malariaeradication. Part I. Statistical considerations. WHO/Mal/240. Geneva:World Health Organization.
53. Swaroop S (1959) Statistical considerations and methodology in malariaeradication. Part II. Statistical methodology. WHO/Mal/240. Geneva: WorldHealth Organization.
54. Swaroop S, Gilroy AB, Uemura K (1966) Statistical methods in malariaeradication. Geneva: World Health Organization. 164 p.
55. Smith DL, Smith T, Hay SI (2009) Measuring malaria for elimination.Chapter 7. Shrinking the malaria map: a prospectus on malariaelimination. Santa Cruz (California): Malaria Elimination Group, Univer-sity of California Santa Cruz. In press.
56. Hay SI, Sinka ME, Tatem AJ, Patil AP, Guerra CA, et al. (2009) Developingglobal maps of the dominant Anopheles vectors of human malaria. PLoSMed. In press.
57. Metselaar D, Van Thiel PH (1959) Classification of malaria. Trop GeogrMed 11: 157–161.
58. Guerra CA, Hay SI, Lucioparedes LS, Gikandi PW, Tatem AJ, et al. (2007)Assembling a global database of malaria parasite prevalence for theMalaria Atlas Project. Malar J 6: 17.
59. Pull JH, Grab B (1974) Simple epidemiological model for evaluatingmalaria inoculation rate and risk of infection in infants. Bull World HealthOrgan 51: 507–516.
60. Balk DL, Deichmann U, Yetman G, Pozzi F, Hay SI, et al. (2006)Determining global population distribution: methods, applications anddata. Adv Parasitol 62: 119–156.
61. Center for International Earth Science Information Network, ColumbiaUniversity/International Food Policy Research Institute/The World Bank/and Centro Internacional de Agricultura Tropical (2007) Global RuralUrban Mapping Project (GRUMP) alpha: Gridded Population of theWorld, version 2, with urban reallocation (GPW-UR). Available: http://sedac.ciesin.columbia.edu/gpw. Palisades (New York): Center for Interna-tional Earth Science Information Network, Columbia University/Interna-tional Food Policy Research Institute/The World Bank/and CentroInternacional de Agricultura Tropical.
62. New M, Lister D, Hulme M, Makin I (2002) A high-resolution data set ofsurface climate over global land areas. Clim Res 21: 1–25.
63. Scharlemann JPW, Benz D, Hay SI, Purse BV, Tatem AJ, et al. (2008) Globaldata for ecology and epidemiology: a novel algorithm for temporal Fourierprocessing MODIS data. PLoS One 3: e1408. doi:10.1371/journal.pone.0001408
64. Stein ML (2005) Space-time covariance functions. J Am Stat Assoc 100:310–321.
65. Gething PW, Noor AM, Gikandi PW, Ogara EAA, Hay SI, et al. (2006)Improving imperfect data from health management information systems
PLoS Medicine | www.plosmedicine.org March 2009 | Volume 6 | Issue 3 | e10000480300
Global Malaria Endemicity
in Africa using space-time geostatistics. PLoS Med 3: e271. doi:10.1371/journal.pmed.0030271
66. Saito H, Goovaerts P (2000) Geostatistical interpolation of positivelyskewed and censored data in a dioxin-contaminated site. Environ SciTechnol 34: 4228–4235.
67. Brooker S, Hay SI, Bundy DA (2002) Tools from ecology: useful forevaluating infection risk models? Trends Parasitol 18: 70–74.
68. Moyeed RA, Papritz A (2002) An empirical comparison of kriging methodsfor nonlinear spatial point prediction. Math Geol 34: 365–386.
69. Hintze JL, Nelson RD (1998) Violin plots: a box plot-density tracesynergism. Am Stat 52: 181–184.
70. UNPD (2005) World urbanization prospects: population database. http://esa.un.org/unup/. New York: United Nations Population Division.
71. Hay SI, Noor AM, Nelson A, Tatem AJ (2005) The accuracy of humanpopulation maps for public health application. Trop Med Int Health 10:1073–1086.
72. U.N.P.D. (2006) World population prospects: the 2006 revision populationdatabase. http://esa.un.org/unpp/. New York: United Nations PopulationDivision.
73. WHO (2007) Malaria elimination: a field manual for low and moderateendemic countries. Geneva: World Health Organization. 85 p.
74. Lines J, Whitty CJM, Hanson K (2007) Prospects for eradication andelimination of malaria: a technical briefing for DFID. London: LondonSchool of Hygiene & Tropical Medicine.
75. WHO. (2006) Informal consultation on malaria elimination: setting up theWHO agenda. WHO/HTM/MAL/2006.1114. Geneva: World Health Organ-ization. 68 p.
76. Raso G, Vounatsou P, Gosoniu L, Tanner M, N’Goran EK, et al. (2006) Riskfactors and spatial patterns of hookworm infection among schoolchildrenin a rural area of western Cote d’Ivoire. Int J Parasitol 36: 201–210.
77. Gelman A, Carlin JB, Stern HS (2003) Bayesian Data Analysis. Texts inStatistical Science. Boca Raton (Florida): Chapman & Hall/CRC Press LLC.696 p.
78. Gilks WR, Spiegelhalter DJ (1999) Markov Chain Monte Carlo in Practice.Interdisciplinary statistics. Boca Raton (Florida): Chapman & Hall/CRCPress LLC.
79. Hutchinson GE (1957) Concluding remarks. Cold Spring Harbor SympQuant Biol 22: 415–427.
80. Southwood TRE (1977) Habitat, templet for ecological strategies?Presidential address to British Ecological Society, 5 January 1977. J AnimEcol 46: 337–365.
81. Hay SI, Tatem AJ, Graham AJ, Goetz SJ, Rogers DJ (2006) Globalenvironmental data for mapping infectious disease distribution. AdvParasitol 62: 37–77.
82. Barat LM (2006) Four malaria success stories: how malaria burden wassuccessfully reduced in Brazil, Eritrea, India, and Vietnam. Am J Trop MedHyg 74: 12–16.
83. Barnes KI, Watkins WM, White NJ (2008) Antimalarial dosing regimensand drug resistance. Trends Parasitol 24: 127–134.
84. Bhattarai A, Ali AS, Kachur SP, Martensson A, Abbas AK, et al. (2007)Impact of artemisinin-based combination therapy and insecticide-treatednets on malaria burden in Zanzibar. PLoS Med 4: e309. doi:10.1371/journal.pmed.0040309
85. Fegan GW, Noor AM, Akhwale WS, Cousens S, Snow RW (2007) Effect ofexpanded insecticide-treated bednet coverage on child survival in ruralKenya: a longitudinal study. Lancet 370: 1035–1039.
86. Noor AM, Amin AA, Akhwale WS, Snow RW (2007) Increasing coverageand decreasing inequity in insecticide-treated bed net use among ruralKenyan children. PLoS Med 4: e255. doi:10.1371/journal.pmed.0040255
87. Nyarango PM, Gebremeskel T, Mebrahtu G, Mufunda J, Abdulmumini U,et al. (2006) A steep decline of malaria morbidity and mortality trends inEritrea between 2000 and 2004: the effect of combination of controlmethods. Malar J 5: 33.
88. Okiro EA, Hay SI, Gikandi PW, Sharif SK, Noor AM, et al. (2007) Thedecline in paediatric malaria admissions on the coast of Kenya. Malar J 6:151.
89. Schellenberg D, Menendez C, Aponte J, Guinovart C, Mshinda H, et al.(2004) The changing epidemiology of malaria in Ifakara Town, southernTanzania. Trop Med Int Health 9: 68–76.
90. Noor AM, Moloney G, Borle M, Fegan GW, Shewchuk T, et al. (2008) Theuse of mosquito nets and the prevalence of Plasmodium falciparum infection
in rural South Central Somalia. PLoS One 3: e2081. doi:10.1371/journal.pone.0002081
91. Chapman AD, Wieczorek J (2006) Guide to best practices for georeferenc-ing. Copenhagen: Global Biodiversity Information Facility.
92. Guralnick RP, Wieczorek J, Beaman R, Hijmans RJ (2006) BioGeomancer:automated georeferencing to map the world’s biodiversity data. PLoS Biol4: e381. doi:10.1371/journal.pbio.0040381
93. Wieczorek J, Guo Q, Hijmans RJ (2004) The point-radius method forgeoreferencing locality descriptions and calculating associated uncer-tainty. Int J Geogr Inf Sci 18: 745–767.
94. O’Meara WP, Collins WE, McKenzie FE (2007) Parasite prevalence: a staticmeasure of dynamic infections. Am J Trop Med Hyg 77: 246–249.
95. Wongsrichanalai C, Barcus MJ, Muth S, Sutamihardja A, Wernsdorfer WH(2007) A review of malaria diagnostic tools: microscopy and rapiddiagnostic test (RDT). Am J Trop Med Hyg 77: 119–127.
96. Zurovac D, Midia B, Ochola SA, English M, Snow RW (2006) Microscopyand outpatient malaria case management among older children and adultsin Kenya. Trop Med Int Health 11: 432–440.
97. Fogg C, Twesigye R, Batwala V, Piola P, Nabasumba C, et al. (2008)Assessment of three new parasite lactate dehydrogenase (pan-pLDH) testsfor diagnosis of uncomplicated malaria. Trans R Soc Trop Med Hyg 102:25–31.
98. Metzger WG, Vivas-Martinez S, Rodriguez I, Goncalves J, Bongard E, et al.(2008) Malaria diagnosis under field conditions in the Venezuelan Amazon.Trans R Soc Trop Med Hyg 102: 20–24.
99. Hay SI, Omumbo JA, Craig MH, Snow RW (2000) Earth observation,geographic information systems and Plasmodium falciparum malaria in sub-Saharan Africa. Adv Parasitol 47: 173–215.
100. Hay SI, Snow RW, Rogers DJ (1998) Predicting malaria seasons in Kenyausing multitemporal meteorological satellite sensor data. Trans R SocTrop Med Hyg 92: 12–20.
101. Hay SI, Snow RW, Rogers DJ (1998) From predicting mosquito habitat tomalaria seasons using remotely sensed data: Practice, problems andperspectives. Parasitol Today 14: 306–313.
102. Snow RW, Guerra CA, Noor AM, Myint HY, Hay SI (2005) The globaldistribution of clinical episodes of Plasmodium falciparum malaria. Nature434: 214–217.
103. Price RN, Tjitra E, Guerra CA, Yeung S, White NJ, et al. (2007) Vivaxmalaria: neglected and not benign. Am J Trop Med Hyg 77: 79–87.
104. Tjitra E, Anstey NM, Sugiarto P, Warikar N, Kenangalem E, et al. (2008)Multidrug-resistant Plasmodium vivax associated with severe and fatalmalaria: a prospective study in Papua, Indonesia. PLoS Med 5: e128. doi:10.1371/journal.pmed.0050128
105. Rogerson SJ, Carter R (2008) Severe vivax malaria: newly recognised orrediscovered. PLoS Med 5: e136. doi:10.1371/journal.pmed.0050136
106. Genton B, D’Acremont V, Rare L, Baea K, Reeder JC, et al. (2008)Plasmodium vivax and mixed infections are associated with severe malaria inchildren: a prospective cohort study from Papua New Guinea. PLoS Med 5:e127. doi:10.1371/journal.pmed.0050127
107. Rowe AK, Rowe SY, Snow RW, Korenromp EL, Schellenberg JRA, et al.(2006) The burden of malaria mortality among African children in the year2000. Int J Epidemiol 35: 691–704.
108. Snow RW, Craig M, Deichmann U, Marsh K (1999) Estimating mortality,morbidity and disability due to malaria among Africa’s non-pregnantpopulation. Bull World Health Organ 77: 624–640.
109. The Global Fund to Fight AIDS, Tuberculosis and Malaria (GFTAM) (2007)The Global Fund. Who we are what we do. Geneva: The Global Fund toFight AIDS, Tuberculosis and Malaria (GFTAM). 36 p.
110. Grabowsky M (2008) The billion-dollar malaria moment. Nature 451:1051–1052.
111. Snow RW, Guerra CA, Mutheu JJ, Hay SI (2008) International funding formalaria control in relation to populations at risk of stable Plasmodiumfalciparum transmission. PLoS Med 5: e142. doi:10.1371/journal.pmed.0050142
112. Tanner M, de Savigny D (2008) Malaria eradication back on the table. BullWorld Health Organ 86: 82.
113. Greenwood BM, Fidock DA, Kyle DE, Kappe SH, Alonso PL, et al. (2008)Malaria: progress, perils, and prospects for eradication. J Clin Investig 118:1266–1276.
114. Roll Back Malaria Partnership (R.B.M.P) (2008) The global malaria actionplan for a malaria free world. Geneva: Roll Back Malaria Partnership(R.B.M.P), World Health Organization. 274 p.
PLoS Medicine | www.plosmedicine.org March 2009 | Volume 6 | Issue 3 | e10000480301
Global Malaria Endemicity
Editors’ Summary
Background. Malaria is one of the most common infectious diseases inthe world and one of the greatest global public health problems. ThePlasmodium falciparum parasite causes approximately 500 million caseseach year and over one million deaths in sub-Saharan Africa. More than40% of the world’s population is at risk of malaria. The parasite istransmitted to people through the bites of infected mosquitoes. Theseinsects inject a life stage of the parasite called sporozoites, which invadehuman liver cells where they reproduce briefly. The liver cells thenrelease merozoites (another life stage of the parasite), which invade redblood cells. Here, they multiply again before bursting out and infectingmore red blood cells, causing fever and damaging vital organs. Theinfected red blood cells also release gametocytes, which infectmosquitoes when they take a blood meal. In the mosquito, thegametocytes multiply and develop into sporozoites, thus completingthe parasite’s life cycle. Malaria can be prevented by controlling themosquitoes that spread the parasite and by avoiding mosquito bites bysleeping under insecticide-treated bed nets. Effective treatment withantimalarial drugs also helps to decrease malaria transmission.
Why Was This Study Done? In 1998, the World Health Organization andseveral other international agencies launched Roll Back Malaria, a globalpartnership that aims to reduce the human and socioeconomic costs ofmalaria. Targets have been continually raised since this time and haveculminated in the Roll Back Malaria Global Malaria Action Plan of 2008,where universal coverage of locally appropriate interventions is called forby 2010 and the long-term goal of malaria eradication again tabled forthe international community. For malaria control and eliminationinitiatives to be effective, financial resources must be concentrated inregions where they will have the most impact, so it is essential to haveup-to-date and accurate maps to guide effort and expenditure. In 2008,researchers of the Malaria Atlas Project constructed a map that stratifiedthe world into three levels of malaria risk: no risk, unstable transmissionrisk (occasional focal outbreaks), and stable transmission risk (endemicareas where the disease is always present). Now, researchers extend thiswork by describing a new evidence-based method for generatingcontinuous maps of P. falciparum endemicity within the area of stablemalaria risk over the entire world’s surface. They then use this method toproduce a P. falciparum endemicity map for 2007. Endemicity isimportant as it is a guide to the level of morbidity and mortality apopulation will suffer, as well as the intensity of the interventions thatthat will be required to bring the disease under control or additionally tointerrupt transmission.
What Did the Researchers Do and Find? The researchers identifiednearly 8,000 surveys of P. falciparum parasite rates (Pf PR; the percentageof a population with parasites detectable in their blood) completed since1985 that met predefined criteria for inclusion into a global database ofPf PR data. They then used ‘‘model-based geostatistics’’ to build a worldmap of P. falciparum endemicity for 2007 that took into account whereand, importantly, when and all these surveys were done. Predictionswere comprehensive (for every area of stable transmission globally) andcontinuous (predicted as a endemicity value between 0% and 100%).The population at risk of three levels of malaria endemicity wereidentified to help summarize these findings: low endemicity, where Pf PRis below 5% and where it should be technically feasible to eliminatemalaria; intermediate endemicity where Pf PR is between 5% and 40%and it should be theoretically possible to interrupt transmission with the
universal coverage of bed nets; high endemicity is where Pf PR is above40% and suites of locally appropriate intervention will be needed tobring malaria under control. The global level of malaria endemicity ismuch reduced when compared with historical maps. Nevertheless, theresulting map indicates that in 2007 almost 60% of the 2.4 billion peopleat malaria risk were living in areas with a stable risk of P. falciparumtransmission—0.69 billion people in Central and South East Asia (CSEAsia), 0.66 billion in Africa, Yemen, and Saudi Arabia (Africaþ), and 0.04billion in the Americas. The people of the Americas were all in the lowendemicity class. Although most people exposed to stable risk in CSEAsia were also in the low endemicity class (88%), 11% were in theintermediate class, and 1% were in the high endemicity class. By contrast,high endemicity was most common and widespread in the Africaþregion (53%), but with significant numbers in the intermediate (30%),and low (17%) endemicity classes.
What Do These Findings Mean? The accuracy of this new world map ofP. falciparum endemicity depends on the assumptions made in itsconstruction and critically on the accuracy of the data fed into it, butbecause of the statistical methods used to construct this map, it ispossible to quantify the uncertainty in the results for all users. Thus, thismap (which, together with the data used in its construction, will be freelyavailable) represents an important new resource that clearly indicatesareas where malaria control can be improved (for example, Africa) andother areas where malaria elimination may be technically possible. Inaddition, planned annual updates of the global P. falciparum endemicitymap and the Pf PR database by the Malaria Atlas Project will help public-health experts to monitor the progress of the malaria control communitytowards international control and elimination targets.
Additional Information. Please access these Web sites via the onlineversion of this summary at http://dx.doi.org/10.1371/journal.pmed.1000048.
� A PLoS Medicine Health in Action article (Hay SI, Snow RW (2006) TheMalaria Atlas Project: Developing Global Maps of Malaria Risk. PLoSMed 3(12): e473) and a Research Article (Guerra CA, Gikandi PW, TatemAJ, Noor AM, Smith DL, et al. (2008) The Limits and Intensity ofPlasmodium falciparum Transmission: Implications for Malaria Controland Elimination Worldwide. PLoS Med 5(2): e38) also provide furtherdetails about the global mapping of malaria risk, and a furtherResearch Article (Snow RW, Guerra CA, Mutheu JJ, Hay SI (2008)International Funding for Malaria Control in Relation to Populations atRisk of Stable Plasmodium falciparum Transmission. PLoS Med 5(7):e142) discusses the financing of malaria control in relation to this risk� Additional national and regional level maps and more information on
the global mapping of malaria are available at the Malaria Atlas Project� The MedlinePlus encyclopedia contains a page on malaria (in English
and Spanish)� Information is available from the World Health Organization on malaria
(in several languages)� The US Centers for Disease Control and Prevention provide informa-
tion on malaria (in English and Spanish)� Information is available from the Roll Back Malaria Partnership on its
approach to the global control of malaria, and on malaria controlefforts in specific parts of the world
PLoS Medicine | www.plosmedicine.org March 2009 | Volume 6 | Issue 3 | e10000480302
Global Malaria Endemicity
Related Documents