http://bit.ly/shrug_jan10 http://bit.ly/shrug_jan10 1 GIS Activities of the State Emergency Response Team Richard Butgereit GIS Administrator 850-413-9907 [email protected] da.com

Http://bit.ly/shrug_jan10 1 GIS Activities of the State Emergency Response Team Richard Butgereit GIS Administrator 850-413-9907 [email protected].
Dec 27, 2015
Welcome message from author
This document is posted to help you gain knowledge. Please leave a comment to let me know what you think about it! Share it to your friends and learn new things together.
Transcript
http://bit.ly/shrug_jan10 http://bit.ly/shrug_jan10
1
GIS Activities of the State Emergency Response Team
Richard ButgereitGIS [email protected]

http://bit.ly/shrug_jan10 http://bit.ly/shrug_jan10
Some activities to cover…
1. Virtual USA2. Geospatial Assessment Tool for
Operations and Response – GATOR3. KML for Google Earth4. Incident Mapper
http://bit.ly/shrug_jan10
http://bit.ly/shrug_jan10
• An information sharing initiative (not an application, nor a website)
• A “metasystem” – “a system about the systems”
• Florida State Emergency Response Team participates, creates new mapping website, KML network links, and GeoRSS feeds
Virtual USA

http://bit.ly/shrug_jan10
• EMForum.org-http://www.emforum.org/vforum/091118.htm
• DHS Secretary Napolitano Unveils Virtual USAhttp://www.dhs.gov/ynews/releases/pr_1260375414161.shtm
Virtual USA

http://bit.ly/shrug_jan10
• Regional Operational Pilot Platform between southeastern states from Feb – Nov 2009
• Regional Operational Pilot Platform phase II Jan – May 2010
Virtual USA
http://bit.ly/shrug_jan10
http://map.floridadisaster.org/GATOR
Geospatial Assessment Tool for Operations and Response
• web mapping application
• real-time data like weather radar, watches, storm reports
• base map and event data
GATOR

http://bit.ly/shrug_jan10 http://bit.ly/shrug_jan10
GATOR

http://bit.ly/shrug_jan10
GATOR

http://bit.ly/shrug_jan10
GATOR

http://bit.ly/shrug_jan10 http://bit.ly/shrug_jan10
REST Serviceshttp://map.floridadisaster.org/ArcGIS/rest/services
• Critical Facilities “Excepted Facilities”
• Missions from EM Constellation
• USNG layers
• Primary Indicators of Response
• Storm surge zones
• Event data
http://bit.ly/shrug_jan10
• USGS – – River Conditions/Forecasted Conditions
Advanced Hydrologic Prediction Service
http://www.nws.noaa.gov/oh/ahps
– Earthquakes/Hurricanes/Warnings/RadarNatural Hazard Support System
http://nhss.cr.usgs.gov
External Data Sources

http://bit.ly/shrug_jan10
• NWS – – Storm Reports
Storm Prediction Center
http://www.spc.noaa.gov/climo/online
– Quantitative Prediction Forecast, Flooding Outlook Potential, Flash Flood Guidance
National Weather Service GIS Portal
http://www.nws.noaa.gov/gis
External Data Sources
http://bit.ly/shrug_jan10
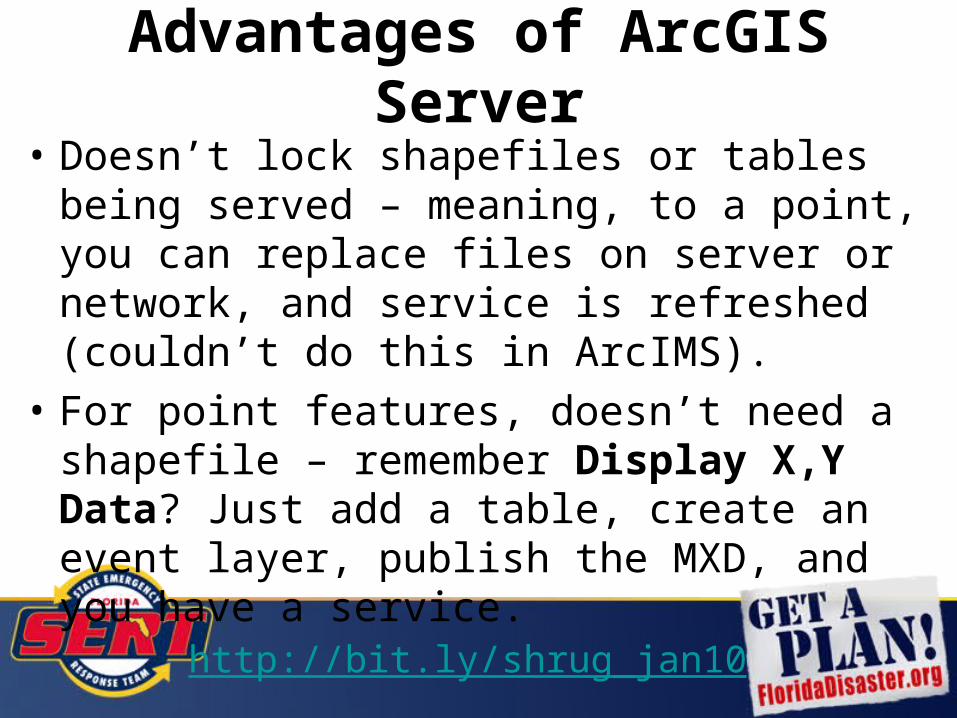
• Doesn’t lock shapefiles or tables being served – meaning, to a point, you can replace files on server or network, and service is refreshed (couldn’t do this in ArcIMS).
• For point features, doesn’t need a shapefile – remember Display X,Y Data? Just add a table, create an event layer, publish the MXD, and you have a service.
Advantages of ArcGIS Server
http://bit.ly/shrug_jan10
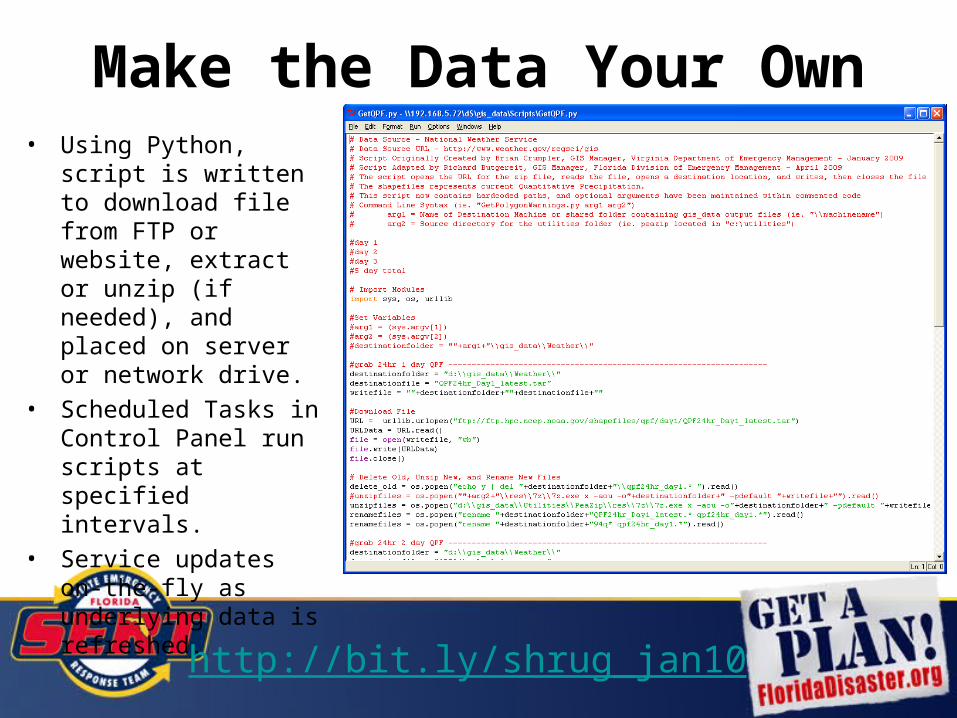
Make the Data Your Own• Using Python, script is
written to download file from FTP or website, extract or unzip (if needed), and placed on server or network drive.
• Scheduled Tasks in Control Panel run scripts at specified intervals.
• Service updates on-the-fly as underlying data is refreshed.

http://bit.ly/shrug_jan10 http://bit.ly/shrug_jan10
Preparing Data for KML

http://bit.ly/shrug_jan10 http://bit.ly/shrug_jan10

http://bit.ly/shrug_jan10 http://bit.ly/shrug_jan10

http://bit.ly/shrug_jan10 http://bit.ly/shrug_jan10

http://bit.ly/shrug_jan10 http://bit.ly/shrug_jan10
KMLhttp://map.floridadisaster.org/ArcGIS/KML
• Critical Facilities
• “Excepted Facilities”
• Missions from EM Constellation
• USNG layers
• Primary Indicators of Response
http://bit.ly/shrug_jan10 http://bit.ly/shrug_jan10
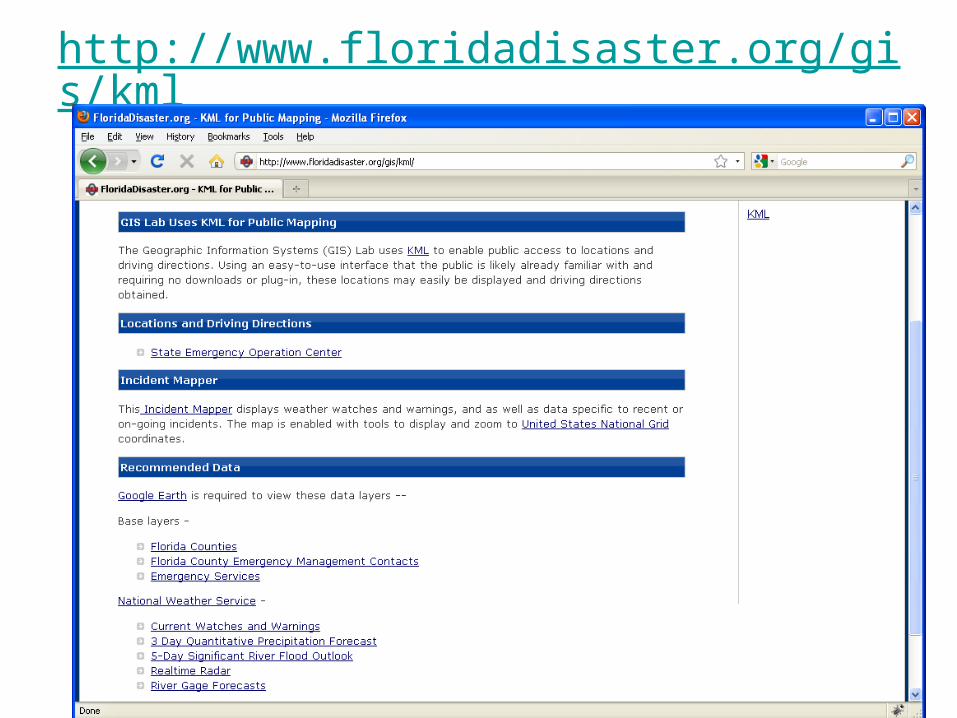
http://www.floridadisaster.org/gis/kml
http://bit.ly/shrug_jan10 http://bit.ly/shrug_jan10
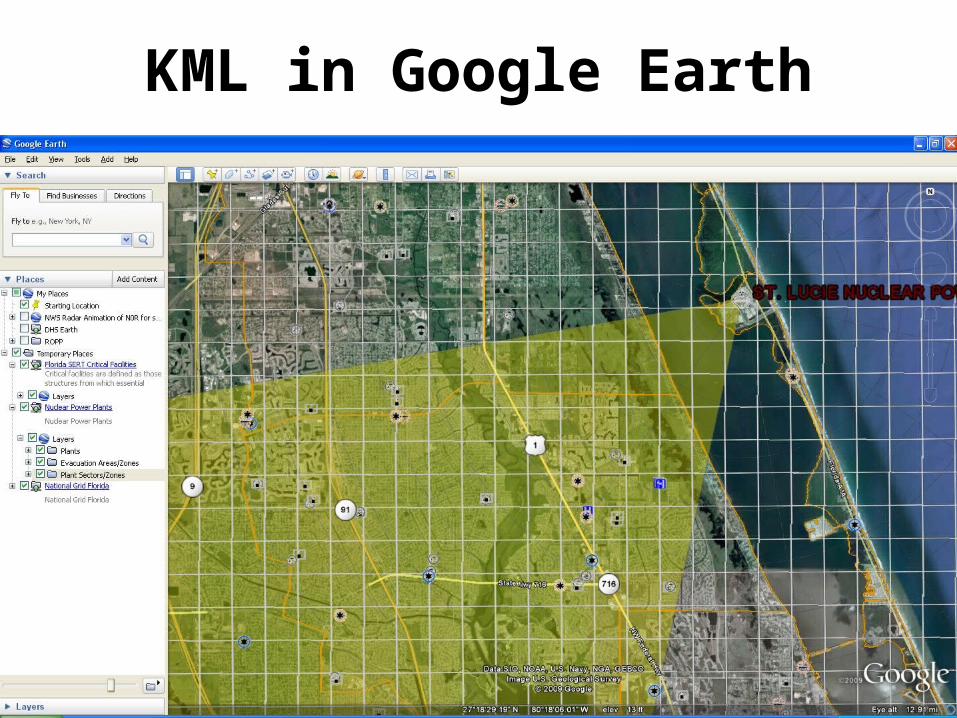
KML in Google Earth

http://bit.ly/shrug_jan10
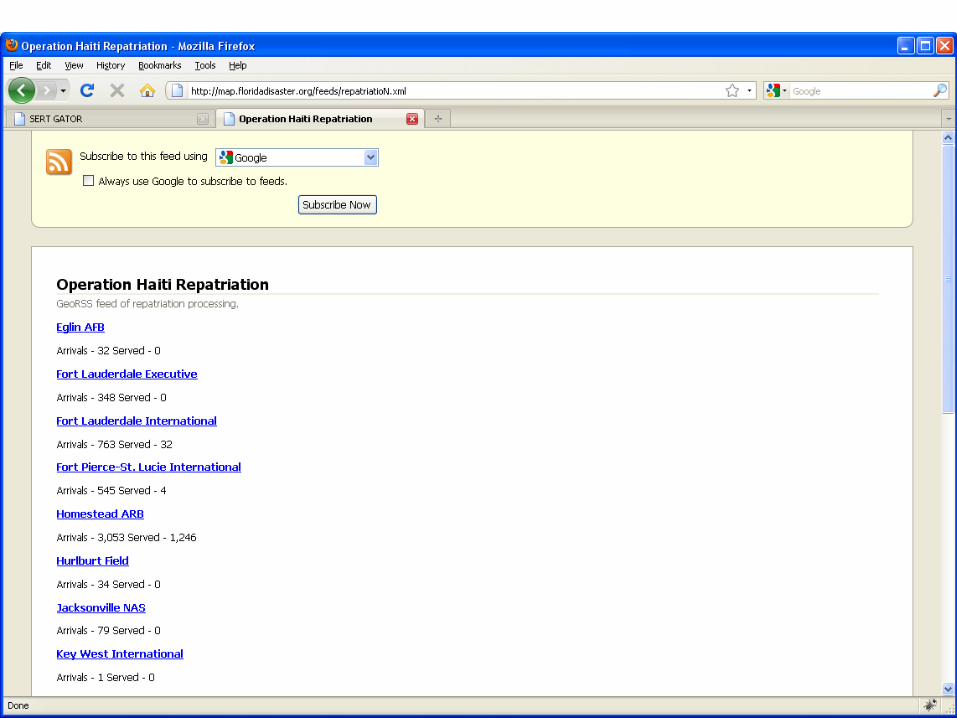
• What is GeoRSS?
http://georss.org – GeoRSS is an emerging standard for encoding location as part of an Web feed. (Web
feeds are used to describe feeds ("channels") of content, such as news articles, Audio blogs, video blogs and text blog entries. These web feeds are rendered by programs such as aggregators and web browsers.) The name "GeoRSS" is derived from RSS, the most known Web feed and syndication format.
– In GeoRSS, location content consists of geographical points, lines, and polygons of interest and related feature descriptions. GeoRSS feeds are designed to be consumed by geographic software such as map generators. By building these encodings on a common information model, the GeoRSS collaboration is promoting interoperability and "upwards-compatibility" across encodings.
GeoRSS

http://bit.ly/shrug_jan10
http://bit.ly/shrug_jan10

http://bit.ly/shrug_jan10

http://bit.ly/shrug_jan10
• Advantages– easy to create feeds
– usable by a wide variety of application• Flex Viewer• Google Earth• ArcGIS Explorer
– may also be used with non-spatial readers
GeoRSS
http://bit.ly/shrug_jan10
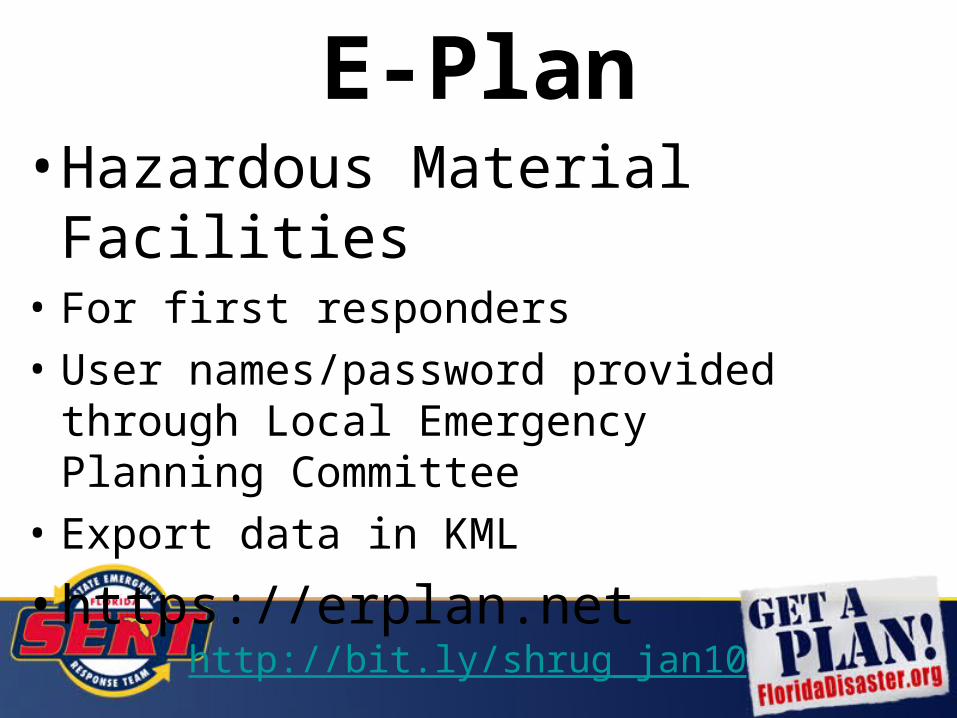
• Hazardous Material Facilities • For first responders
• User names/password provided through Local Emergency Planning Committee
• Export data in KML
• https://erplan.net
E-Plan

http://bit.ly/shrug_jan10

http://bit.ly/shrug_jan10

http://bit.ly/shrug_jan10

http://bit.ly/shrug_jan10
http://www.floridadisaster.org/gis/kml/viewer.htm
• simple Google Maps mashup with USNG tools
• real-time data like weather radar, watches, storm reports
• will be transitioning to GATOR
Incident Mapper

http://bit.ly/shrug_jan10 http://bit.ly/shrug_jan10 32

http://bit.ly/shrug_jan10 http://bit.ly/shrug_jan10
Bonus Round…
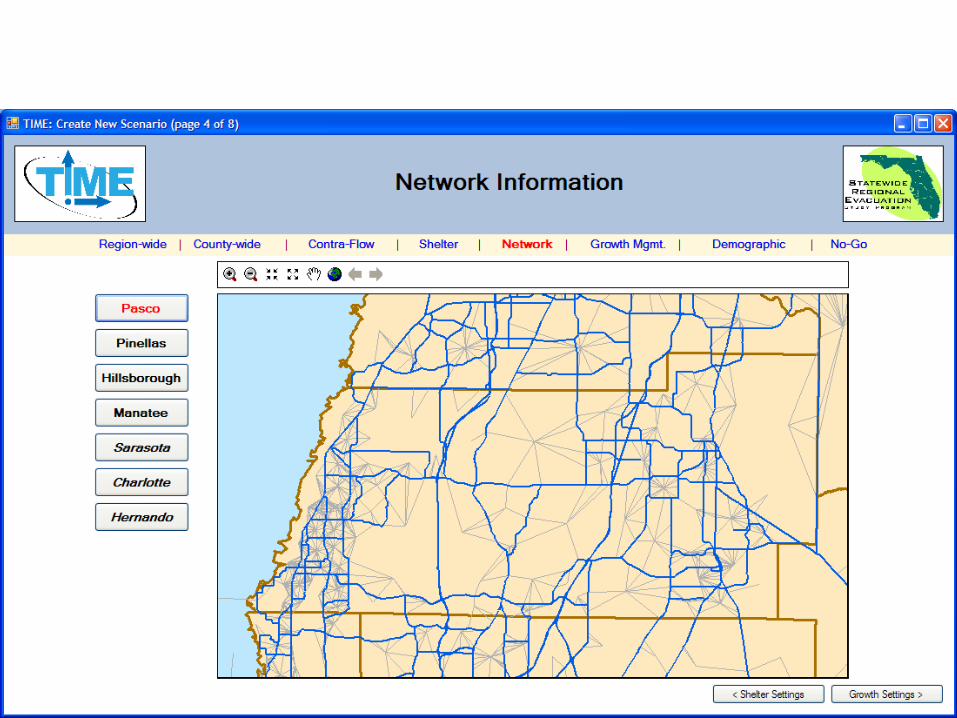
1. Mapping for Blackberry2. State Regional Evacuation Studies (Coastal
LiDAR/SLOSH Project)

http://bit.ly/shrug_jan10 http://bit.ly/shrug_jan10
Maps for Blackberry
• light-weight web mapping application
• real-time data like weather radar, watches, storm reports
• more to come…

http://bit.ly/shrug_jan10 http://bit.ly/shrug_jan10
35
Regional Evacuation Studies
• Study and Update Regional Hurricane Evacuation in light of new legislation (HB 1359 – SB 7121)
• Utilize New LIDAR data combined with updated SLOSH modeling
• Utilize Consistent methodology and format
to ensure complete transparency and visibility• Expected completion in 2010
http://bit.ly/shrug_jan10 http://bit.ly/shrug_jan10
02040
6080
100
Pe
rce
nt
Co
mp
lete
Pe
rce
nt
Co
mp
lete
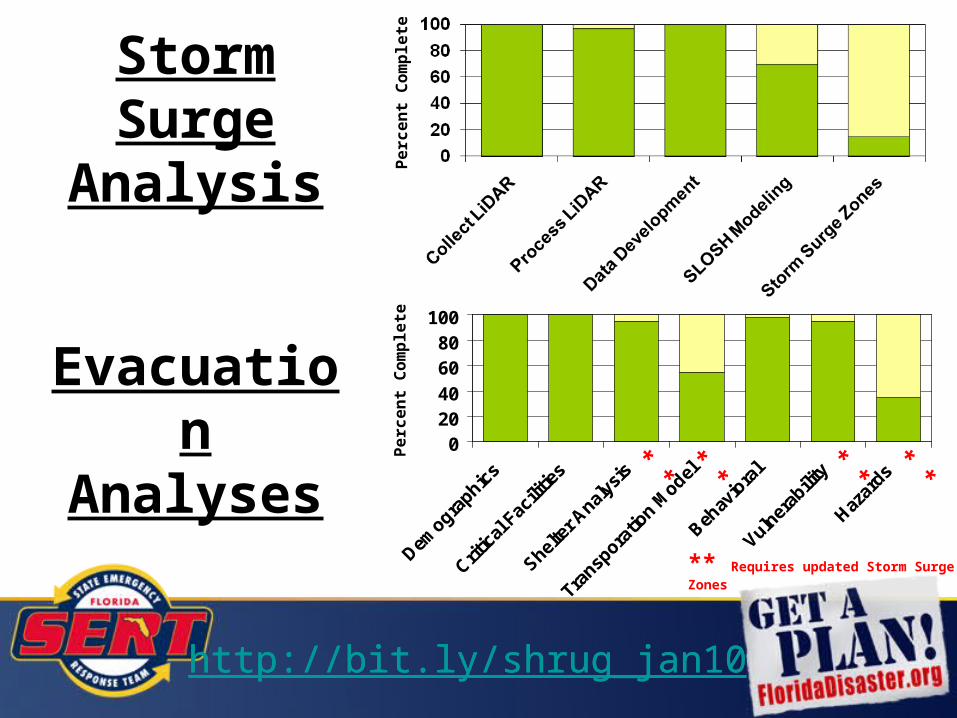
Evacuation Analyses
Storm Surge Analysis
**
** Requires updated Storm Surge Zones
**** **

http://bit.ly/shrug_jan10
Transporation Model

http://bit.ly/shrug_jan10 http://bit.ly/shrug_jan10
http://bit.ly/shrug_jan10 http://bit.ly/shrug_jan10

http://bit.ly/shrug_jan10
Previously Existing Data
HB7121 - New Data
HB7121 - Improve Existing Data
FEMA - New Data
Partnering Agencies - New Data
8,60014,600
1,3002,200
1,40036,500 total square miles
NWFWMD - New Data8,400
Previously Existing Data
HB7121 - New Data
HB7121 - Improve Existing Data
FEMA - New Data
Partnering Agencies - New Data
8,60014,600
1,3002,200
1,40036,500 total square miles
NWFWMD - New Data8,400
LiDAR Projects

http://bit.ly/shrug_jan10
38 - Accepted
Status of Deliverables
FDEM Coastal LiDAR

http://bit.ly/shrug_jan10 http://bit.ly/shrug_jan10
Questions?FloridaDisaster.org/gis
Related Documents