Vol. 12 no. 1 1996 Pages 41-48 HTP: a neural network-based method for predicting the topology of helical transmembrane domains in proteins Piero Fariselli and Rita Casadio 1 Abstract In this paper we describe a microcomputer program (HTP) for predicting the location and orientation of a-helical transmembrane segments in integral membrane proteins. HTP is a neural network-based tool which gives as output the protein membrane topology based on the statistical propensity of residues to be located in external and internal loops. This method, which uses single protein sequences as input to the network system, correctly predicts the topology of 71 out of 92 membrane proteins of putative membrane orientation, independently of the protein source. Introduction The database of membrane proteins known at atomic or nearly atomic resolution currently contains only a few examples as compared to ~300 globular proteins (Berstein et al., 1977). This paucity is due to difficulties in the crystallization procedure of membrane proteins (Michel et al., 1986), and is in contrast to the large and exponentially growing number of residue sequences pertaining to this protein class (as well as to the globular class) (Chothia, 1992). Efficient predictive methods can therefore help to model the structure of membrane proteins starting from the amino acid sequence, as obtained with DNA recombinant techniques. Except for the 16 strands of the /3-barrel porins (Weiss et al., 1991; Cowan et al., 1992), the transmembrane segments of the other proteins in the database consist of typical apolar helices of some 20 residues perpendicular or partially tilted with respect to the normal to the membrane bilayer (Michel et al., 1986). The topography and topology of membrane proteins is in turn determined via experimental approaches, such as gene fusion analysis and biochemical probes (Manoil et al., 1986; McGovern et al., 1991; Traxler et al., 1993). Following these criteria, the transmembrane organization of some 90 membrane proteins is presently known and available in the SWISS-PROT data base (Bairoch and Boeckmann, 1992). Laboratory of Biophysics. Department of Biology, University of Bologna, 1-40126 Bologna. Italy 1 To whom correspondence should be addressed. E-mail:[email protected] Most of the theoretical methods so far developed to predict membrane proteins are essentially aimed at the recognition of the hydrophobic membrane-spanning stretches distributed throughout the amino acid sequence (Traxler et al., 1993), and implicitly assume that the predicted segments are a-helices associated with the peaks found in the hydrophobicity plot, which displays the average hydrophobicity of each residue versus its position along the protein sequence. The most evident sequence pattern which correlates with the topology of the membrane-spanning segments is the prevalence of positively charged residues in the cytoplasmic loops of polytopic (multiple spanning) mem- brane proteins (von Heijne, 1992). The theoretical search for membrane-spanning seg- ments along a protein sequence is usually performed by evaluating a running-average hydrophobicity over a sliding window of appropriate length on the basis of hydrophobicity scales (Kyte and Doolittle. 1982; Engel- man et al., 1986); by calculating the statistical propensities for each residue to be buried in the membrane phase (Kuhn and Leigh, 1985; Klein et al., 1985; Rao and Argos, 1986); and, for amphipathic structures, by computing the periodicity of the hydrophobicity (Eisenberg et al., 1984; Cornette et al., 1987). Several hydrophobicity scales have been calculated (Schultz, 1988; Fasman, 1989; Fasman and Gilbert, 1990; Degli Esposti et al., 1990; von Heijne, 1994; White, 1994). However, the window length and the decision functions, which are crucial to the accuracy of the prediction, are empirically tailored for specific functional classes of membrane proteins and are of no general use. An exception is a quadratic minimization procedure evaluated on the membrane proteins known at atomic resolution (Edelman, 1993). The average values of the hydrophobicity and a consensus procedure, which combines the predictions of several methods, seem to improve the accuracy of the prediction (Degli Esposti et al., 1990; Parodi et al., 1994), and this approach has recently been argued on the basis of comparison of the prediction with structural models obtained with NMR (Turner and Weiner, 1993). Prediction scores improve considerably by using evolutionary information derived by multiple alignments © Oxford University Press 41 by guest on July 13, 2011 bioinformatics.oxfordjournals.org Downloaded from

Welcome message from author
This document is posted to help you gain knowledge. Please leave a comment to let me know what you think about it! Share it to your friends and learn new things together.
Transcript
Vol. 12 no. 1 1996Pages 41-48
HTP: a neural network-based method forpredicting the topology of helicaltransmembrane domains in proteins
Piero Fariselli and Rita Casadio1
Abstract
In this paper we describe a microcomputer program (HTP)for predicting the location and orientation of a-helicaltransmembrane segments in integral membrane proteins.HTP is a neural network-based tool which gives as outputthe protein membrane topology based on the statisticalpropensity of residues to be located in external and internalloops. This method, which uses single protein sequences asinput to the network system, correctly predicts the topologyof 71 out of 92 membrane proteins of putative membraneorientation, independently of the protein source.
Introduction
The database of membrane proteins known at atomic ornearly atomic resolution currently contains only a fewexamples as compared to ~300 globular proteins (Bersteinet al., 1977). This paucity is due to difficulties in thecrystallization procedure of membrane proteins (Michel et al.,1986), and is in contrast to the large and exponentiallygrowing number of residue sequences pertaining to thisprotein class (as well as to the globular class) (Chothia, 1992).
Efficient predictive methods can therefore help to modelthe structure of membrane proteins starting from theamino acid sequence, as obtained with DNA recombinanttechniques.
Except for the 16 strands of the /3-barrel porins (Weisset al., 1991; Cowan et al., 1992), the transmembranesegments of the other proteins in the database consist oftypical apolar helices of some 20 residues perpendicular orpartially tilted with respect to the normal to the membranebilayer (Michel et al., 1986).
The topography and topology of membrane proteins isin turn determined via experimental approaches, such asgene fusion analysis and biochemical probes (Manoil etal., 1986; McGovern et al., 1991; Traxler et al., 1993).Following these criteria, the transmembrane organizationof some 90 membrane proteins is presently known andavailable in the SWISS-PROT data base (Bairoch andBoeckmann, 1992).
Laboratory of Biophysics. Department of Biology, University of Bologna,1-40126 Bologna. Italy1 To whom correspondence should be addressed. E-mail:[email protected]
Most of the theoretical methods so far developed topredict membrane proteins are essentially aimed at therecognition of the hydrophobic membrane-spanningstretches distributed throughout the amino acid sequence(Traxler et al., 1993), and implicitly assume that thepredicted segments are a-helices associated with the peaksfound in the hydrophobicity plot, which displays theaverage hydrophobicity of each residue versus its positionalong the protein sequence.
The most evident sequence pattern which correlateswith the topology of the membrane-spanning segmentsis the prevalence of positively charged residues in thecytoplasmic loops of polytopic (multiple spanning) mem-brane proteins (von Heijne, 1992).
The theoretical search for membrane-spanning seg-ments along a protein sequence is usually performed byevaluating a running-average hydrophobicity over asliding window of appropriate length on the basis ofhydrophobicity scales (Kyte and Doolittle. 1982; Engel-man et al., 1986); by calculating the statistical propensitiesfor each residue to be buried in the membrane phase(Kuhn and Leigh, 1985; Klein et al., 1985; Rao and Argos,1986); and, for amphipathic structures, by computing theperiodicity of the hydrophobicity (Eisenberg et al., 1984;Cornette et al., 1987).
Several hydrophobicity scales have been calculated(Schultz, 1988; Fasman, 1989; Fasman and Gilbert, 1990;Degli Esposti et al., 1990; von Heijne, 1994; White, 1994).However, the window length and the decision functions,which are crucial to the accuracy of the prediction, areempirically tailored for specific functional classes ofmembrane proteins and are of no general use. Anexception is a quadratic minimization procedure evaluatedon the membrane proteins known at atomic resolution(Edelman, 1993).
The average values of the hydrophobicity and aconsensus procedure, which combines the predictions ofseveral methods, seem to improve the accuracy of theprediction (Degli Esposti et al., 1990; Parodi et al., 1994),and this approach has recently been argued on the basis ofcomparison of the prediction with structural modelsobtained with NMR (Turner and Weiner, 1993).
Prediction scores improve considerably by usingevolutionary information derived by multiple alignments
© Oxford University Press 41
by guest on July 13, 2011bioinform
atics.oxfordjournals.orgD
ownloaded from
P.Fariselli and R.Casadio
of amino acid sequences. In this case, the protein to bepredicted is modified according to the residue frequency inthe aligned sequences (Rost et al., 1993; Persson andArgos, 1994).
A step forward in the automatic extraction of theinformation from the database of known structures wasmade by using supervised feed-forward neural networks(Hirst and Sternberg, 1992; Presnell and Cohen, 1993).This computational system provides a very efficientpredictive method for protein secondary structures (Rostand Sander, 1993; Rost et al., 1994).
Using a neural network as a pattern classifier andevolutionary information as input code, the structure oftransmembrane helices was recently predicted with 95%accuracy (Rost et al., 1995). Alternatively, a statisticalmethod based on a model recognition approach couldpredict both the structure and the topology of all-helicalmembrane proteins (Jones et al., 1994).
In this paper we describe HTP, a method based onneural networks and running on microcomputers. HTP istrained on a set comprising 11 membrane proteins ofknown topology, uses as input to the network system thesingle protein code, and does not rely on multiple sequencealignment. HTP nevertheless performs at a 91% level ofpredictive accuracy when tested on a set of 69 proteinswith no homology with those of the training set.Moreover, by using a set of rules derived from thestatistical propensity of each residue to be located in acytoplasmic or extra-cytoplasmic loop, HTP also correctlyevaluates the topology of 48 of the 69 testing proteins.When evaluating a larger set, which included 92 proteins(as described in the SWISS-PROT database), HTPcorrectly predicts the location and topology of the
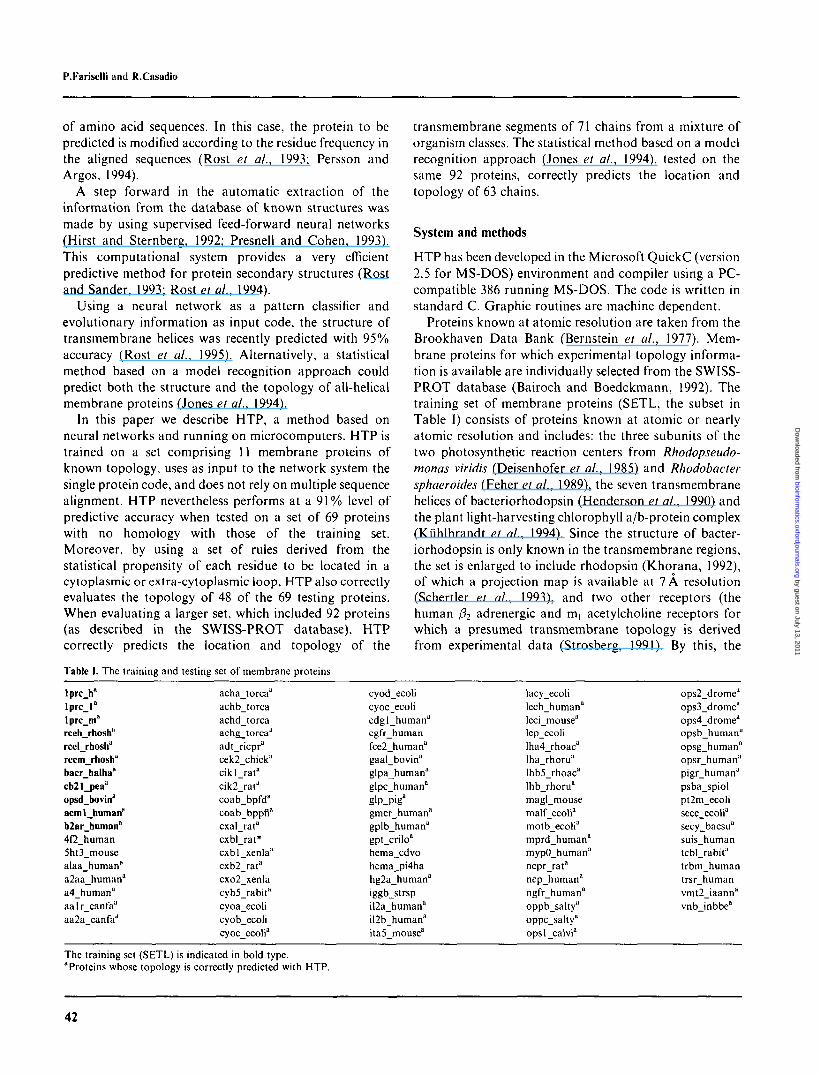
Table I. The training and testing set of membrane proteins
transmembrane segments of 71 chains from a mixture oforganism classes. The statistical method based on a modelrecognition approach (Jones et al., 1994), tested on thesame 92 proteins, correctly predicts the location andtopology of 63 chains.
System and methods
HTP has been developed in the Microsoft QuickC (version2.5 for MS-DOS) environment and compiler using a PC-compatible 386 running MS-DOS. The code is written instandard C. Graphic routines are machine dependent.
Proteins known at atomic resolution are taken from theBrookhaven Data Bank (Bernstein et al., 1977). Mem-brane proteins for which experimental topology informa-tion is available are individually selected from the SWISS-PROT database (Bairoch and Boedckmann, 1992). Thetraining set of membrane proteins (SETL, the subset inTable I) consists of proteins known at atomic or nearlyatomic resolution and includes: the three subunits of thetwo photosynthetic reaction centers from Rhodopseudo-monas viridis (Deisenhofer et al., 1985) and Rhodobactersphaeroides (Feher et al., 1989), the seven transmembranehelices of bacteriorhodopsin (Henderson et al., 1990) andthe plant light-harvesting chlorophyll a/b-protein complex(Kuhlbrandt et al., 1994). Since the structure of bacter-iorhodopsin is only known in the transmembrane regions,the set is enlarged to include rhodopsin (Khorana, 1992),of which a projection map is available at 7 A resolution(Schertler et al., 1993), and two other receptors (thehuman /32 adrenergic and ni] acetylcholine receptors forwhich a presumed transmembrane topology is derivedfrom experimental data (Strosberg, 1991). By this, the
lprcji"lprc_l°lprc_ma
rceh_rhoshu
rcel_rhosh"rcem_rhosh"bacrhalha"cb2l_peaa
opsd_bovin"acml_humana
b2ar_human"4f2_human5ht3_mousealaa_human"a2aa_humana
a4_humana
aalr_canfa"aa2a_canfaa
The training set"Proteins whose
acha_torcaa
achb_torcaachdtorcaachg_torcaa
adt_ricpra
cek2_chicka
cikl_rata
cik2_rata
coab_bpfda
coab_bppfla
cxalrat"cxblrat*cxbl_xenla"cxb2_rata
cxo2_xenlacyb5_rabita
cyoa_ecolicyob_ecolicyoc_ecolia
(SETL) is indicated in bold type.topology is correctly predicted with HTP.
cyod_ecolicyoe_ecoliedglhuman"egfr humanfce2_humana
gaal_bovina
glpa human"glpc human"
glp_piga
gmcr_humana
gplb_human"gpt_criloa
hema_cdvohema_pi4hahg2a_humana
iggb_strspil2a_humana
il2b_human"ita5_mousea
lacy_ecolilech_humana
leci_mousea
lep_ecoliIha4_rhoac"lha_rhoru"Ihb5_rhoaca
lhb_rhorua
magl_mousemalf_ecolia
motb_ecolia
mprdhuman"mypO_humana
ncpr_rata
nep_humana
ngfr_humana
oppb_salty"oppc_saltya
opsl_calvia
ops2_dromea
ops3_dromea
ops4_dromea
opsb_human"opsg_human"opsr_humana
pigr_humana
psba_spiolpt2m_ecolisece_ecolia
secy_bacsua
suis_humantcbl_rabita
trbm_humantrsr_humanvmt2_iaanna
vnb_inbbea
42
by guest on July 13, 2011bioinform
atics.oxfordjournals.orgD
ownloaded from
Prediction of all-helical membrane protein topology
average level of homology existing between the proteins ofthe two different functional groups included in the trainingset is balanced. During validation of HTP, care was takenthat the proteins of the training set had little or nohomology with those of the testing set. Homology wasdetected with the FASTP program for comparingsequences (Lipman and Pearson, 1985).
Algorithms
Artificial neural networks
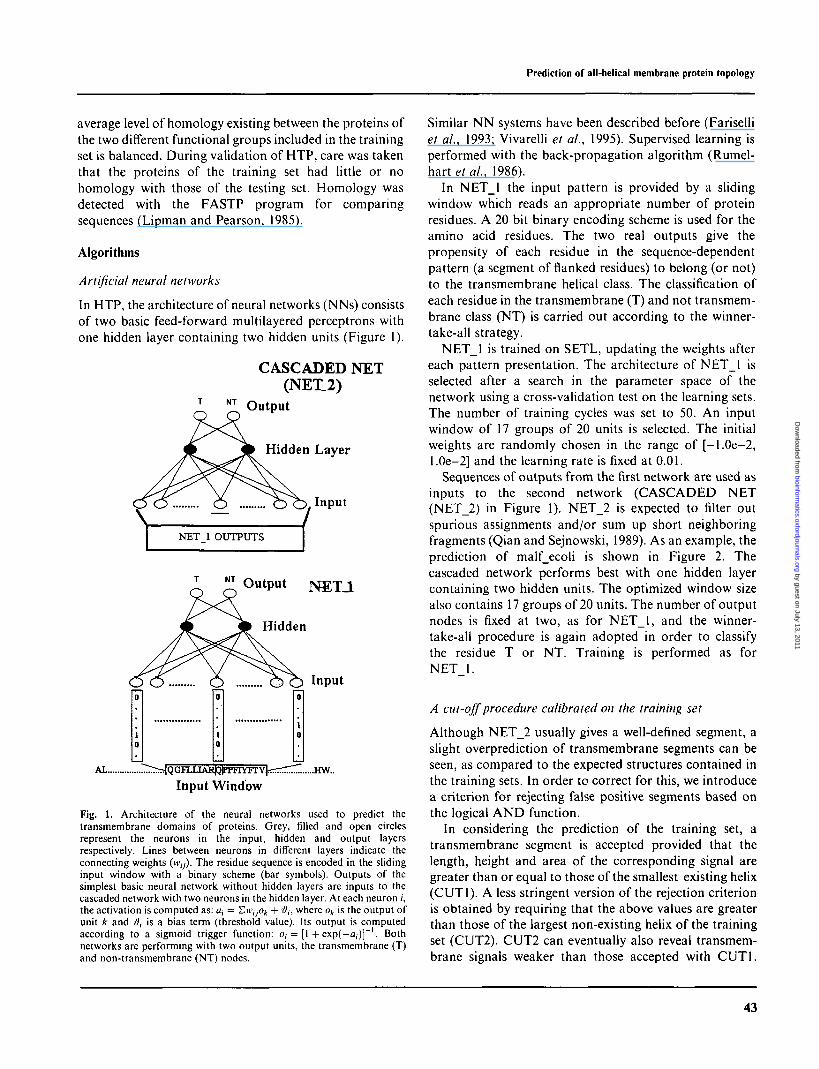
In HTP, the architecture of neural networks (NNs) consistsof two basic feed-forward multilayered perceptrons withone hidden layer containing two hidden units (Figure 1).
CASCADED NET(NET.2)
T NT Output
Hidden Layer
Input
AL . : ^ |Input Window
Fig. 1. Architecture of the neural networks used to predict thetransmembrane domains of proteins. Grey, filled and open circlesrepresent the neurons in the input, hidden and output layersrespectively. Lines between neurons in different layers indicate theconnecting weights (w-,j). The residue sequence is encoded in the slidinginput window with a binary scheme (bar symbols). Outputs of thesimplest basic neural network without hidden layers are inputs to thecascaded network with two neurons in the hidden layer. At each neuron /,the activation is computed as: a, = Evi'yo* + i?,-, where ok is the output ofunit k and $, is a bias term (threshold value). Its output is computedaccording to a sigmoid trigger function: o, = [1 + exp(-a,)]" ' . Bothnetworks are performing with two output units, the transmembrane (T)and non-transmembrane (NT) nodes.
Similar NN systems have been described before (Fariselliet al., 1993; Vivarelli et al., 1995). Supervised learning isperformed with the back-propagation algorithm (Rumel-hart et al., 1986).
In NET_1 the input pattern is provided by a slidingwindow which reads an appropriate number of proteinresidues. A 20 bit binary encoding scheme is used for theamino acid residues. The two real outputs give thepropensity of each residue in the sequence-dependentpattern (a segment of flanked residues) to belong (or not)to the transmembrane helical class. The classification ofeach residue in the transmembrane (T) and not transmem-brane class (NT) is carried out according to the winner-take-all strategy.
NET_1 is trained on SETL, updating the weights aftereach pattern presentation. The architecture of NET_1 isselected after a search in the parameter space of thenetwork using a cross-validation test on the learning sets.The number of training cycles was set to 50. An inputwindow of 17 groups of 20 units is selected. The initialweights are randomly chosen in the range of [-1.0e-2,1.0e-2] and the learning rate is fixed at 0.01.
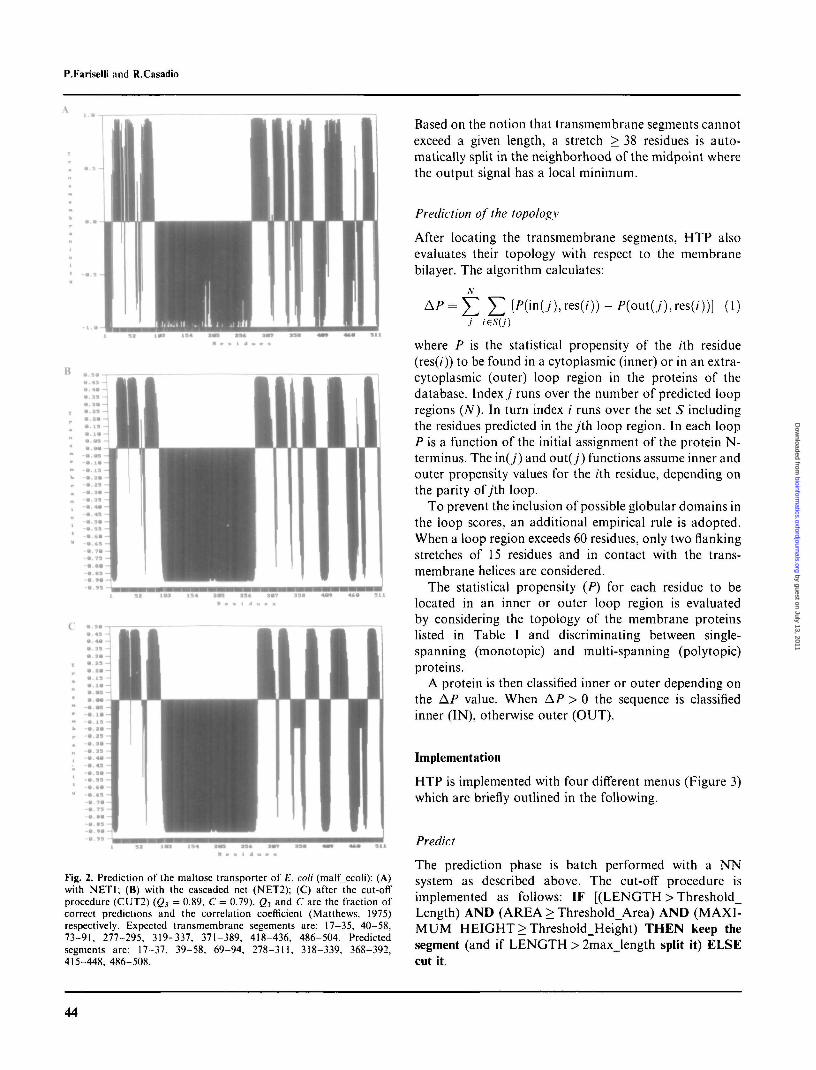
Sequences of outputs from the first network are used asinputs to the second network (CASCADED NET(NET_2) in Figure 1). NET_2 is expected to filter outspurious assignments and/or sum up short neighboringfragments (Qian and Sejnowski, 1989). As an example, theprediction of malf_ecoli is shown in Figure 2. Thecascaded network performs best with one hidden layercontaining two hidden units. The optimized window sizealso contains 17 groups of 20 units. The number of outputnodes is fixed at two, as for NET_1, and the winner-take-all procedure is again adopted in order to classifythe residue T or NT. Training is performed as forNET_1.
A cut-off procedure calibrated on the training set
Although NET_2 usually gives a well-defined segment, aslight overprediction of transmembrane segments can beseen, as compared to the expected structures contained inthe training sets. In order to correct for this, we introducea criterion for rejecting false positive segments based onthe logical AND function.
In considering the prediction of the training set, atransmembrane segment is accepted provided that thelength, height and area of the corresponding signal aregreater than or equal to those of the smallest existing helix(CUT1). A less stringent version of the rejection criterionis obtained by requiring that the above values are greaterthan those of the largest non-existing helix of the trainingset (CUT2). CUT2 can eventually also reveal transmem-brane signals weaker than those accepted with CUT1.
43
by guest on July 13, 2011bioinform
atics.oxfordjournals.orgD
ownloaded from
P.Fariselli and R.Casadio
Fig. 2. Prediction of the maltose transporter of E. coli (malfecoli): (A)with NET1; (B) with the cascaded net (NET2); (C) after the cut-offprocedure (CUT2) (Qj = 0.89, C = 0.79). g3 and C are the fraction ofcorrect predictions and the correlation coefficient (Matthews, 1975)respectively. Expected transmembrane segements are: 17-35, 40-58,73-91, 277-295, 319-337. 371-389, 418-436. 486-504. Predictedsegments are: 17-37, 39-58, 69-94, 278-311, 318-339. 368-392,415^448, 486-508.
Based on the notion that transmembrane segments cannotexceed a given length, a stretch > 38 residues is auto-matically split in the neighborhood of the midpoint wherethe output signal has a local minimum.
Prediction of the topology
After locating the transmembrane segments, HTP alsoevaluates their topology with respect to the membranebilayer. The algorithm calculates:
(1)
where P is the statistical propensity of the ;th residue(res(/)) to be found in a cytoplasmic (inner) or in an extra-cytoplasmic (outer) loop region in the proteins of thedatabase. Index j runs over the number of predicted loopregions (N). In turn index / runs over the set 5 includingthe residues predicted in theyth loop region. In each loopP is a function of the initial assignment of the protein N-terminus. The in(y) and out( /') functions assume inner andouter propensity values for the ;'th residue, depending onthe parity ofyth loop.
To prevent the inclusion of possible globular domains inthe loop scores, an additional empirical rule is adopted.When a loop region exceeds 60 residues, only two flankingstretches of 15 residues and in contact with the trans-membrane helices are considered.
The statistical propensity (P) for each residue to belocated in an inner or outer loop region is evaluatedby considering the topology of the membrane proteinslisted in Table I and discriminating between single-spanning (monotopic) and multi-spanning (polytopic)proteins.
A protein is then classified inner or outer depending onthe AP value. When AP > 0 the sequence is classifiedinner (IN), otherwise outer (OUT).
Implementation
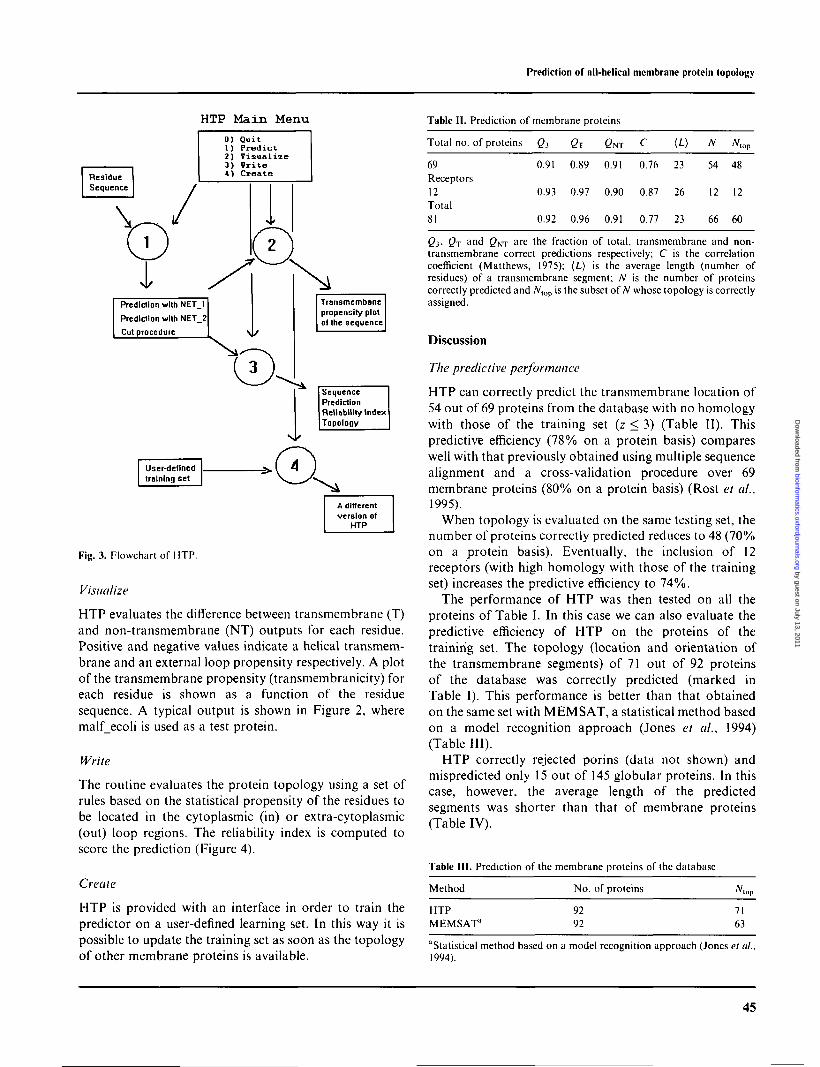
HTP is implemented with four different menus (Figure 3)which are briefly outlined in the following.
Predict
The prediction phase is batch performed with a NNsystem as described above. The cut-off procedure isimplemented as follows: IF [(LENGTH > Threshold_Length) AND (AREA > Threshold_Area) AND (MAXI-MUM HEIGHT > Threshold_Height) THEN keep thesegment (and if LENGTH > 2max_length split it) ELSEcut it.
44
by guest on July 13, 2011bioinform
atics.oxfordjournals.orgD
ownloaded from
Prediction of all-helical membrane protein topology
HTP Main Menu Table II. Prediction of membrane proteins
ResidueSequence
0 )1 )2 )3 )*)
QuitPredictVisualizeVriteCreate
\
©1
Prediction with NETJ
Prediction with NET_2
Cut procedure
Transmembanepropensity plotof the sequence
SequencePredictionReliability IndexTopology
User-definedtraining set
A differentversion of
HTP
Fig. 3. Flowchart of HTP.
Visualize
HTP evaluates the difference between transmembrane (T)and non-transmembrane (NT) outputs for each residue.Positive and negative values indicate a helical transmem-brane and an external loop propensity respectively. A plotof the transmembrane propensity (transmembranicity) foreach residue is shown as a function of the residuesequence. A typical output is shown in Figure 2, wheremalf_ecoli is used as a test protein.
Write
The routine evaluates the protein topology using a set ofrules based on the statistical propensity of the residues tobe located in the cytoplasmic (in) or extra-cytoplasmic(out) loop regions. The reliability index is computed toscore the prediction (Figure 4).
Create
HTP is provided with an interface in order to train thepredictor on a user-defined learning set. In this way it ispossible to update the training set as soon as the topologyof other membrane proteins is available.
Total no. of proteins Q3 QT QNr C (L) N N,,op
69Receptors12Total81
0.91 0.89 0.91 0.76 23 54 48
0.93 0.97 0.90 0.87 26 12 12
0.92 0.96 0.91 0.77 23 66 60
Qi, Qj and QNT are the fraction of total, transmembrane and non-transmembrane correct predictions respectively; C is the correlationcoefficient (Matthews, 1975); (Z.) is the average length (number ofresidues) of a transmembrane segment; N is the number of proteinscorrectly predicted and N{op is the subset of N whose topology is correctlyassigned.
Discussion
The predictive performance
HTP can correctly predict the transmembrane location of54 out of 69 proteins from the database with no homologywith those of the training set (z < 3) (Table II). Thispredictive efficiency (78% on a protein basis) compareswell with that previously obtained using multiple sequencealignment and a cross-validation procedure over 69membrane proteins (80% on a protein basis) (Rost et al.,1995).
When topology is evaluated on the same testing set, thenumber of proteins correctly predicted reduces to 48 (70%on a protein basis). Eventually, the inclusion of 12receptors (with high homology with those of the trainingset) increases the predictive efficiency to 74%.
The performance of HTP was then tested on all theproteins of Table I. In this case we can also evaluate thepredictive efficiency of HTP on the proteins of thetraining set. The topology (location and orientation ofthe transmembrane segments) of 71 out of 92 proteinsof the database was correctly predicted (marked inTable I). This performance is better than that obtainedon the same set with MEMSAT, a statistical method basedon a model recognition approach (Jones et al., 1994)(Table III).
HTP correctly rejected porins (data not shown) andmispredicted only 15 out of 145 globular proteins. In thiscase, however, the average length of the predictedsegments was shorter than that of membrane proteins(Table IV).
Table III. Prediction
Method
HTPMEMSAT3
of the membrane proteins of the database
No. of proteins
9292
<V,op
7163
"Statistical method based on a model recognition approach (Jones et al.,1994).
45
by guest on July 13, 2011bioinform
atics.oxfordjournals.orgD
ownloaded from
P.Fariselli and R.Casadio
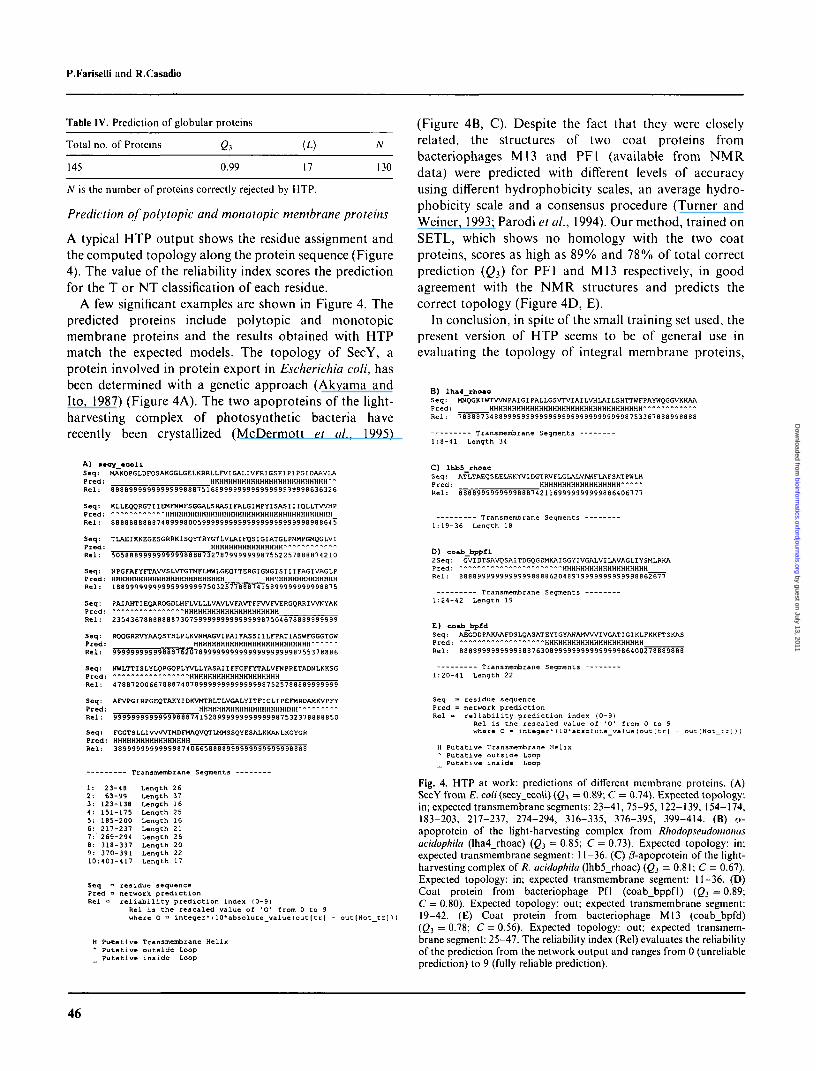
Table IV.
Total no.
145
Prediction of globular proteins
of Proteins Qi
0.99
(L)
17
N
130
N is the number of proteins correctly rejected by HTP.
Prediction of polytopic and monotopic membrane proteins
A typical HTP output shows the residue assignment andthe computed topology along the protein sequence (Figure4). The value of the reliability index scores the predictionfor the T or NT classification of each residue.
A few significant examples are shown in Figure 4. Thepredicted proteins include polytopic and monotopicmembrane proteins and the results obtained with HTPmatch the expected models. The topology of SecY, aprotein involved in protein export in Escherichia coli, hasbeen determined with a genetic approach (Akyama andIto, 1987) (Figure 4A). The two apoproteins of the light-harvesting complex of photosynthetic bacteria haverecently been crystallized (McDermott et at., 1995)
(Figure 4B, C). Despite the fact that they were closelyrelated, the structures of two coat proteins frombacteriophages Ml3 and PF1 (available from NMRdata) were predicted with different levels of accuracyusing different hydrophobicity scales, an average hydro-phobicity scale and a consensus procedure (Turner andWeiner, 1993; Parodi et al., 1994). Our method, trained onSETL, which shows no homology with the two coatproteins, scores as high as 89% and 78% of total correctprediction (Q^) for PF1 and M13 respectively, in goodagreement with the NMR structures and predicts thecorrect topology (Figure 4D, E).
In conclusion, in spite of the small training set used, thepresent version of HTP seems to be of general use inevaluating the topology of integral membrane proteins,
B) Iha4_rhoacS e q : MNQGKIWTWNPAIGIPALLGSVTVIAILVHLAILSHTTWFPAYWQGGVKKAAP r e d : HHHHHHHHHHHHHHHHHHHHHHHHHHHHHHHHHHRel: 76688734889999999999999999999999999998753367868998888
Transmembrane Segments1:8-41 Length 34
A) a«cy__«coliSeq: MAKQPGLDFQSAKGGLGELKRRLLFVIGALIVFRIGSFIPIPGIDAAVLAPeed: HHHHHHHHHHHHHHHHHHHHHHHHHH"Bel: 88889999999999998887516899999999999999953996 63632 6
Seq: KLLEOQRGTIIEMFNMFSGGALSRASIFALGIMPYISASIIIQLLTWHPPred: * " " "HHHHHHHHHHHHHHHHHHHHHHHHHHHHHHHHHHHHH_Rel: 8888 88888 674 8999800599999999999999999999999896864 5
Seq: TLAEIKKEGESGRRKISQYTRYGTLVLAIFQSIGIATGLPNMPGMQGLVIPred: HHHHHHHHHHHHHHHHRel: 50588899999999998868732787999999987552257888874210
Seq: NPGFAFYFTAWSLVTGTMFLMWLGEQITERGIGNGISII1FAGIVAGLPProd: HHKHHHHHHHHHHHHHHHHHHHHHH HHHHHHHHHHHHHHHHRel: 18899999999999999999750325776887415899999999996 675
Seq: PAIAHTIEQARQGDLHFLVLLLVAVLVFAVTFFWFVERGQRRIWNYAKProd: HHHHHHHHHHHHHHHHHHHHHRel: 23543678688888730799999999999999987 504 678869999999
Seq: RQQGRRVYAAQSTHLPLKVNMAGVIPAIFASSIILFPATIASWFGGGTGWProd: HHHHHHHHHHHHHHHHHHHHHHHHHHRel: 9999999999988376207899999999999999999999875537888 6
Seq: NWLTTISLYLQPGQPLYVLLYASAIIFFCFFYTALVFNPRETADNLKKSGPred: * " A ------- -"HHHHHHHHHHHHHHHHHHHHRel: 4788720066788674 0789999999999999987525788869999999
Seq: AFVPGIRPGEQTAKYIDKVMTRLTLVGALYITFICLIPEFMRDAMKVPFYPred: HHHHHHHHHHHHHHHHHHHHHH "Rel: 9999999999999988874152899999999999998753237888 8850
Seq: FGGTSLLIWWIMDFMAQVQTLMMSSQYESALKKANLKGYGRPred: HHHHHHHHHHHHHHHHHRel: 3899999999999987406658888999999999999998888
Transmembrane Segments
23-4863-99123-138151-175185-200217-237269-294318-337370-391
Length 26Length 37Length 16Length 2 5Length 16Length 21Length 2 6Length 20Length 22Length 17
Seq -Pred =Rel •
network predictionreliability prediction index 10-91Rel is the rescaled value of 'O' from 0 to 9where O ° integer*(10*absolute_valuelout(tr) - out[Not_tr]))
C) Ihb5_rhoacSeq: ATLTAEQSEELHKYVIDGTRVFLGLALVAHFLAFSATPWLHPred: HHHHHHHHHHHHHHHHHHRel: 8888999999999B887421169999999999866406777
Transmembrane Segments1:19-36 Length 18
D) coab_bppfl2Seq: GVIDTSAVQSAITDGQGDMKAIGGYIVGALVILAVAGLIYSHLRKAPred: "" HHHHHHHHHHHHHHHHHHHRel: 88869999999999998868 620489799999999999988 62677
Transmembrane Segments1:24-42 Length 19
E) coab_bpfdSeq: AEGDDPAKAAFDSLQASATEYIGYAWAMVWIVGATIGIKLFKKFTSKASPred: AA --------- HHHHHHHHHHHHHHHHHHHHHHRel: 88889999999998887630899999999999999986400278889886
Transmembrane Segments1:20-41 Length 22
Seq = residue sequencePred = network predictionRel = reliability prediction index (0-9)
Rel is the rescaled value of '0'where O = integer*{10'absolute_v<
from 0 to 9lue(out[tr] - outlNot
H Putative Transmembrane Helix* Putative outside Loop_ Putative inside Loop
H Putative Transmembrane Helix~ Putative outside Loop__ Putative inside Loop
Fig. 4. HTP at work: predictions of different membrane proteins. (A)SecY from E. coli (secy_ecoli) (03 = 0.89; C = 0.74). Expected topology:in; expected transmembrane segments: 23-41, 75-95, 122-139, 154-174,183-203, 217-237, 274-294, 316-335, 376-395, 399-414. (B) a-apoprotein of the light-harvesting complex from Rhodopseudomonasacidophila (Iha4_rhoac) (Q3 = 0.85; C = 0.73). Expected topology: in;expected transmembrane segment: 11-36. (C) /3-apoprotein of the light-harvesting complex of R. acidophila (Ihb5_rhoac) (Q} = 0.81; C = 0.67).Expected topology: in; expected transmembrane segment: 11-36. (D)Coat protein from bacteriophage Pfl (coab_bppfl) (Q} = 0.89;C = 0.80). Expected topology: out; expected transmembrane segment:19-42. (E) Coat protein from bacteriophage M13 (coab_bpfd)(Q3 = 0.78; C = 0.56). Expected topology: out; expected transmem-brane segment: 25-47. The reliability index (Rel) evaluates the reliabilityof the prediction from the network output and ranges from 0 (unreliableprediction) to 9 (fully reliable prediction).
46
by guest on July 13, 2011bioinform
atics.oxfordjournals.orgD
ownloaded from
Prediction of all-helical membrane protein topology
independently of their source and organization withrespect to the lipid bilayer.
Acknowledgements
We thank Dr B.Rost (EMBL, Heidelberg, Germany) for discussions. Weare also indebted to Dr D.T.Jones for sending us the MEMSAT program.This work was partially supported by the Italian Consiglio Nazionaledelle Ricerche.
References
Akyama,Y. and Ito,K. (1987) Topology analysis of the SecY protein, anintegral membrane protein involved in protein export in Escherichiacoli. EMBO J., 6, 3465-3470.
Bairoch,A. and Boeckmann,B. (1992) The SWISS-PROT proteinsequence data bank. Nucleic Acids. Res., 20, 2019-2022.
Bernstein,F.C, Koetzle.T.F., Williams.G.J.B., Meyer,E.F., Brice.M.D.,Rodgers,J.R., Kennard.O., Shimanouchi.T. and Tasumi.M. (1977)The protein data bank: a computer-based archival file for macro-molecular structures. J. Mol. Biol., 112, 535-542.
Chothia,C. (1992) One thousand families for the molecular biologist.Nature, 357, 543-544.
Cornette,J.L., Cease.K.B., Margalit,H., Spouge,J.L., Berzofsky,J.A. andDe Lisi,C. (1987) Hydrophobicity scales and computational techniquesfor detecting amphipathic structures in proteins. J. Mol. Biol., 195,659-685.
Cowan.S.W., Schirmer.T., Rummel,G., Steiert,M., Ghosh,R., Pauptit,R.A., Jansonius.J.N. and Rosenbusch,J.P. (1992) Crystal structuresexplain functional properties of two E. coli porins. Nature, 358, 727—733.
Degli Esposti,M.,Crimi,M. and Venturoli.G. (1990) A critical evaluationof the hydropathy profile of membrane proteins. Eur. J. Biochem.. 190,207-219.
Deisenhofer,J., Epp.O., Miki,K., Huber,R. and Michel,H. (1985)Structure of the protein subunits in the photosynthetic reactioncentre of Rhodopseudomonas viridis at 3 A resolution. Nature, 318,618-624.
Edelman.J. (1993) Quadratic minimization of predictors for proteinsecondary structure: application to transmembrane a-helixes. J. Mol.Biol., 232, 165-191.
Eisenberg.D., Schwarz,E., Komaromy.M. and Wall.R. (1984) Analysisof membrane and surface protein sequences with the hydrophobicmoment plot. J. Mol. Biol., 179, 125-142.
Engelman,D.M., Steitz.T.A. and Goldman,A. (1986) Identifying non-polar transbilayer helixes in amino acid sequences of membraneproteins. Annu. Rev. Biophys. Biophys. Chem., 15, 321-353.
Fariselli,P., Compiani,M. and Casadio,R. (1993) Predicting secondarystructures of membrane proteins with neural networks. Eur. Biophys.J., 22, 41-51.
Fasman.G.D. (1989) The development of the prediction of proteinstructure. In Fasman.G.D. (ed.), Prediction of Protein Structure and thePrinciples of Protein Conformation. Plenum Press, New York, pp. 193-316.
Fasman,G.D. and Gilbert, W. A. (1990) The prediction of transmembraneprotein sequences and their conformation: an evaluation. TrendsBiochem. Sci., 15, 89-92.
Feher,G., Allen.J.P., Okamura,M.Y. and Recs,D.C. (1989) Structure andfunction of bacterial photosynthetic reaction centers. Nature, 339,111-116.
Henderson.R., Baldwin,.!.M., Ceska,T.A., Zemlin,F., Beckmann,E. andDowning,K.H. (1990) Model for the structure of bacteriorhodopsinbased on high resolution electron cryo-microscopy. J. Mol. Biol., 213,899-929.
Hirst,J.D. and Sternberg.J.E. (1992) Prediction of structural andfunctional features of proteins and nucleic acid sequences by artificialneural networks. Biochemistry, 31, 7211-7218.
Jones.D.T., Taylor.W.R. and Thornton,.!.M. (1994) A model recognifi-tion approach to the prediction of all-helical membrane proteinstructure and topology. Biochemistry, 33, 3038-3049.
Khorana.H.G. (1992) Rhodopsin, photoreceptor of the rod cell. J. Biol.Chem., 267, 1-4.
Klein,P., Kanehisa.M. and De Lisi,C. (1985) The detection andclassification of membrane-spanning protein. Biochim. Biophys. Acta,815, 468-476.
Kyte,J. and Doolittle,R.F. (1982) A simple method for displaying thehydrophobic character of a protein. J. Mol. Biol., 157, 103-132.
Kuhlbrandt,W., Wang,D.N. and Fujiyoshi, Y. (1994) Atomic model ofplant light-harvesting complex by electron crystallography. Nature,367,614-621.
Kuhn,L.A., Leigh.J.S. (1985) A statistical technique for predictingmembrane protein structure. Biochim. Biophys. Acta, 828, 351-361.
Lipman,D.J. and Pearson.W.L. (1985) Rapid and sensitive proteinsimilarity searches. Science, 227, 1435-1441.
Manoil.C. and Beckwith.J. (1986) A genetic approach to analyzingmembrane protein topology. Science, 233, 1403-1408.
Matthews.B.W. (1975) Comparison of the predicted and observedsecondary structure of T4 phage lysozyme. Biochim. Biophvs. Acta,405,442-451.
McDermott,G., Prince,S.M., Freer.A.A., Hawthornthwaite-Lawless,A.M., Papiz,M.Z., Cogdell,R.J. and isaacs.N.W. (1995) Crystalstructure of an integral membrane light-harvesting complex fromphotosynthetic bacteria. Nature, 374, 517-521.
McGovern.K.., Ehrmann,M.and Beckwith,J. (1991) Decoding signals formembrane proteins using alkaline phosphatase fusions. EMBO J., 10.2773-2782.
Michel,H. (1993) Crystallization of membrane proteins. Trends BiochemSci., 8, 56-59.
Michel,H., Weyer,K.A., Gruenberg.H., Dunger.I., Osterhelt.D. andLottspeich,F. (1986) The light and medium subunits of the photo-synthetic reaction center from Rhodopseudomonas viridis: isolation ofthe genes, nucleotide and amino acid sequence. EMBO J., 5, 1149-1158.
Parodi.L.A., Granatir.C.A. and Maggiora.G.M. (1994) A consensusprocedure for predicting the location of o-helical transmembranesegments in proteins. Comput. Applic. Biosci., 5, 527-535.
Persson.B. and Argos.P. (1994) Prediction of transmembrane segments inproteins utilising multiple sequence alignments. J. Mol. Biol., 237, 182-192.
Presnell,S.R. and Cohen.F.E. (1993) Artificial neural networks forpattern recognition in biochemical sequences. Annu. Rev. Biophvs.Biomol. Struct., 22, 283-298.
Qian.N. and Sejnowski.T.G. (1988) Predicting the secondary structure ofglobular proteins using neural network models. J. Mol. Biol., 202, 865-884.
Rao.J.K.M. and Argos.P. (1986) A conformational preference parameterto predict helices in integral membrane proteins. Biochim. Biophvs.Acta, 869, 197-214.
Rost,B. and Sander,C. (1993) Prediction of protein secondary structureat better than 70% accuracy. J. Mol. Biol., 232, 584-599.
Rost,B., Sander,C. and Schneider.R. (1994) Redefining the goals ofprotein secondary structure prediction. J. Mol. Biol., 235, 13-26.
Rost.B., Casadio,R., Fariselli,P. and Sander,C. (1995) Transmembranehelices predicted at 95% accuracy. Prot. Sci., 4, 521-533.
Rumelhart,D.E., Hinton,G.E. and Williams, R.J. (1986) Learningrepresentation by back-propagation errors. Nature, 323, 533-536.
Schertler.G.F.X., Villa,C. and Henderson,R. (1993) Projection structureof rhodopsin. Nature, 362, 770-772.
Schultz,G.E. (1988) A critical evaluation of methods for prediction ofprotein secondary structures. Annu. Rev. Biophvs. Biophys. Chem., 17,1-21.
Strosberg.A.D. (1991) Structure/function relationship of proteinsbelonging to the family of receptors coupled to GTP-bindingproteins. Eur. J. Biochem., 29, 11009-11023.
Traxler,B., Boyd,D. and Beckwith,J. (1993) The topological analysis ofintegral membrane proteins. J. Membrane Biol., 132, 1 — 11.
Turner,R.J. and Weiner,J.H. (1993) Evaluation of transmembrane helixprediction methods using the recently defined NMR structures of thecoat proteins from bacteriophages M13 and Pfl. Biochim. Biophys.Acta, 1202, 161-168.
47
by guest on July 13, 2011bioinform
atics.oxfordjournals.orgD
ownloaded from
P.Fariselli and R.Casadio
Vivarelli.F., Giusti.G., Villani,M., Campanini.R., Fariselli.P., Compiani,M. and Casadio.R. (1995) LGANN: a parallel system combining alocal genetic algorithm and neural networks for the prediction ofsecondary structure of proteins. Comput. Applic. Biosci.. 11, 253-260.
von Heijne,G. (1992) Hydrophobicity analysis and the positive-insiderule. J. Mot. Biol., 225, 487-494.
von Heijne.G. (1994) Membrane proteins: from sequence to structure.Annu. Rev. Biophvs. Biomol. Struct., 23, 167-192.
Weiss.M.S., Kreush.A., Shiltz,E., Nestel.U.. Welte.W.. Weckesser,J. andSchulZjG.E. (1991) The structure of porin from Rhodobacler capsulalusat 1.8 A resolution. FEBS Lett., 280, 379-382.
White.S.H. (1994) Hydrophaty plots and the prediction of membraneprotein topology. In White,S.H. (ed.). Membrane Protein Structure.Oxford University Press, New York, pp. 97-124.
Received on August 22, 1995; revised and accepted on October 27, 1995
48
by guest on July 13, 2011bioinform
atics.oxfordjournals.orgD
ownloaded from
Related Documents