HSBC HOLDINGS PLC Report of the Directors: The Management of Risk Regulation and supervision 165 Page Regulation and supervision 1 ....................... 165 Risk management 1 ...................................... 170 Credit risk ................................................... 171 Credit risk management 2 ........................ 171 Credit exposure 3 ..................................... 176 Credit quality 3 ......................................... 192 Impairment allowances and charges 3 ...... 197 HSBC Holdings 2 ..................................... 211 Risk elements in the loan portfolio 1 ........ 211 Liquidity and funding management ............ 213 Policies and procedures 2 ......................... 213 Primary sources of funding 3 ................... 213 HSBC Holdings 2 ..................................... 215 Market risk management ............................ 216 Value at risk 3 .......................................... 216 Trading portfolios 2 .................................. 218 Non-trading portfolios 2 ........................... 219 Sensitivity of net interest income 1 ........... 221 Structural foreign exchange exposures 1 . 223 HSBC Holdings 3 ..................................... 223 Residual value risk management 1 ............... 224 Operational risk management 1 ................... 225 Legal litigation risk 1 ............................... 225 Pension risk 1 ............................................... 226 Reputational risk management 1 .................. 227 Sustainability risk management 1 ................ 227 Risk management of insurance operations 2 .............................................. 228 Life insurance business 2 ........................... 228 Non-life insurance business 2 .................... 228 Insurance risk 2 ........................................ 229 Financial risks 2 ....................................... 233 Market risk 2 ............................................. 235 Credit risk 2 ............................................... 237 Liquidity risk 2 ......................................... 240 Present value of in-force long-term insurance business 2 ............................. 241 Capital management and allocation ............ 243 Capital management 2 .............................. 243 Capital measurement and allocation 3 ..... 243 Risk-weighted assets by principal subsidiary 1 ............................................ 247 1 Unaudited. 2 Audited. 3 Audited where indicated. Regulation and supervision (Unaudited) With listings of its ordinary shares in London, Hong Kong, New York, Paris and Bermuda, HSBC Holdings complies with the relevant requirements for listing and trading on each of these exchanges. In the UK, these are the Listing Rules of the Financial Services Authority (‘FSA’); in Hong Kong, The Rules Governing the Listing of Securities on The Stock Exchange of Hong Kong Limited; in the US, where the shares are traded in the form of ADSs, HSBC Holdings’ shares are registered with the US Securities and Exchange Commission. As a consequence of its US listing, HSBC Holdings is also subject to the reporting and other requirements of the US Securities Act of 1933, as amended, the Securities Exchange Act of 1934, as amended, and the New York Stock Exchange’s Listed Company Manual, in each case as applied to foreign private issuers. In France and Bermuda, HSBC Holdings is subject to the listing rules of Euronext, Paris and the Bermuda Stock Exchange applicable to companies with secondary listings. A statement of HSBC’s compliance with the code provisions of the Combined Code on Corporate Governance issued by the Financial Reporting Council and with the Code on Corporate Governance Practices in Appendix 14 to the Rules Governing the Listing of Securities on The Stock Exchange of Hong Kong Limited is set out in the ‘Report of the Directors: Governance’ on page 248. HSBC’s operations throughout the world are regulated and supervised by approximately 510 different central banks and regulatory authorities in those jurisdictions in which HSBC has offices, branches or subsidiaries. These authorities impose a variety of requirements and controls designed to improve financial stability and the transparency of financial markets and their contribution to economic growth. These regulations and controls cover, inter alia, capital adequacy, depositor protection, market liquidity, governance standards, customer protection (for example, fair lending practices, product design, and marketing and documentation standards), and social responsibility obligations (for example, anti- money laundering and anti-terrorist financing measures). In addition, a number of countries in which HSBC operates impose rules that affect, or place limitations on, foreign or foreign-owned or controlled banks and financial institutions. The rules include restrictions on the opening of local offices, branches or subsidiaries and the types of banking and non-banking activities that may be conducted by those local offices, branches or subsidiaries; restrictions on the acquisition of local banks or

Welcome message from author
This document is posted to help you gain knowledge. Please leave a comment to let me know what you think about it! Share it to your friends and learn new things together.
Transcript
H S B C H O L D I N G S P L C
Report of the Directors: The Management of Risk Regulation and supervision
165
PageRegulation and supervision1 ....................... 165Risk management1 ...................................... 170Credit risk ................................................... 171
Credit risk management2 ........................ 171Credit exposure3 ..................................... 176Credit quality3 ......................................... 192Impairment allowances and charges3 ...... 197HSBC Holdings2 ..................................... 211Risk elements in the loan portfolio1 ........ 211
Liquidity and funding management ............ 213Policies and procedures2 ......................... 213Primary sources of funding3 ................... 213HSBC Holdings2 ..................................... 215
Market risk management ............................ 216Value at risk3 .......................................... 216Trading portfolios2 .................................. 218Non-trading portfolios2 ........................... 219Sensitivity of net interest income1 ........... 221Structural foreign exchange exposures1 . 223HSBC Holdings3 ..................................... 223
Residual value risk management1 ............... 224Operational risk management1 ................... 225
Legal litigation risk1 ............................... 225Pension risk1 ............................................... 226Reputational risk management1 .................. 227Sustainability risk management1 ................ 227Risk management of insurance
operations2 .............................................. 228Life insurance business2 ........................... 228Non-life insurance business2 .................... 228Insurance risk2 ........................................ 229Financial risks2 ....................................... 233Market risk2 ............................................. 235Credit risk2 ............................................... 237Liquidity risk2 ......................................... 240Present value of in-force long-term
insurance business2 ............................. 241Capital management and allocation ............ 243
Capital management2 .............................. 243Capital measurement and allocation3 ..... 243Risk-weighted assets by principal
subsidiary1 ............................................ 247
1 Unaudited. 2 Audited. 3 Audited where indicated.
Regulation and supervision (Unaudited)
With listings of its ordinary shares in London, Hong Kong, New York, Paris and Bermuda, HSBC Holdings complies with the relevant requirements for listing and trading on each of these exchanges. In the UK, these are the Listing Rules of the Financial Services Authority (‘FSA’); in Hong Kong, The Rules Governing the Listing of Securities on The Stock Exchange of Hong Kong Limited; in the US, where the shares are traded in the form of ADSs, HSBC Holdings’ shares are registered with the US Securities and Exchange Commission. As a consequence of its US listing, HSBC Holdings is also subject to the reporting and other requirements of the US Securities Act of 1933, as amended, the Securities Exchange Act of 1934, as amended, and the New York Stock Exchange’s Listed Company Manual, in each case as applied to foreign private issuers. In France and Bermuda, HSBC Holdings is subject to the listing rules of Euronext, Paris and the Bermuda Stock Exchange applicable to companies with secondary listings.
A statement of HSBC’s compliance with the code provisions of the Combined Code on Corporate Governance issued by the Financial Reporting Council and with the Code on Corporate Governance Practices in Appendix 14 to the Rules Governing the Listing of Securities on The Stock Exchange of Hong Kong Limited is set out in the ‘Report of the Directors: Governance’ on page 248.
HSBC’s operations throughout the world are regulated and supervised by approximately 510 different central banks and regulatory authorities in those jurisdictions in which HSBC has offices, branches or subsidiaries. These authorities impose a variety of requirements and controls designed to improve financial stability and the transparency of financial markets and their contribution to economic growth. These regulations and controls cover, inter alia, capital adequacy, depositor protection, market liquidity, governance standards, customer protection (for example, fair lending practices, product design, and marketing and documentation standards), and social responsibility obligations (for example, anti-money laundering and anti-terrorist financing measures). In addition, a number of countries in which HSBC operates impose rules that affect, or place limitations on, foreign or foreign-owned or controlled banks and financial institutions. The rules include restrictions on the opening of local offices, branches or subsidiaries and the types of banking and non-banking activities that may be conducted by those local offices, branches or subsidiaries; restrictions on the acquisition of local banks or
H S B C H O L D I N G S P L C
Report of the Directors: The Management of Risk (continued) Regulation and supervision
166
regulations requiring a specified percentage of local ownership; and restrictions on investment and other financial flows entering or leaving the country. The supervisory and regulatory regimes of the countries where HSBC operates will determine to some degree HSBC’s ability to expand into new markets, the services and products that HSBC will be able to offer in those markets and how HSBC structures specific operations.
The FSA supervises HSBC on a consolidated basis. In addition, each operating bank, finance company or insurance operation within HSBC is regulated by local supervisors. The primary regulatory authorities are those in the UK, Hong Kong and the US, the Group’s principal areas of operation.
In June 2004, the Basel Committee on Banking Supervision introduced a new capital adequacy framework to replace the 1988 Basel Capital Accord in the form of a final Accord (commonly known as ‘Basel II’). Details of the EU’s implementation of Basel II and how this will affect HSBC are set out on page 244.
UK regulation and supervision
UK banking and financial services institutions are subject to multiple regulations. The primary UK statute is the Financial Services and Markets Act 2000 (‘FSMA’). Other UK primary and secondary banking legislation is derived from EU directives relating to banking, securities, insurance investment and sales of personal financial services.
The FSA is responsible for authorising and supervising UK financial services institutions and regulates all HSBC’s businesses in the UK which require authorisation under the FSMA. These include retail banking, life and general insurance, pensions, mortgages, custody and branch share-dealing businesses, and treasury and capital markets activity. HSBC Bank is HSBC’s principal authorised institution in the UK.
FSA rules establish the minimum criteria for authorisation for banks and financial services businesses in the UK. They also set out reporting (and, as applicable, consent) requirements with regard to large individual exposures and large exposures to related borrowers. In its capacity as supervisor of HSBC on a consolidated basis, the FSA receives information on the capital adequacy of, and sets requirements for, HSBC as a whole. Further details on capital measurement are included in ‘Capital Management’ on pages 243 to 247. The FSA’s approach to capital requirements for UK insurers is to require minimum capital to be
calculated on two bases. First, firms must calculate their liabilities on a prudent basis and add a statutory solvency margin (Pillar 1). Secondly, firms must calculate their liabilities on a realistic basis then add to this their own calculation of risk-based capital. The sum of realistic reserves and risk-based capital (Pillar 2) is agreed with the FSA. Insurers are required to maintain capital equal to the higher of Pillars 1 and 2. The FSA has the right to object, on prudential grounds, to persons who hold, or intend to hold, 10 per cent or more of the voting power of a financial institution.
The regulatory framework of the UK financial services system has traditionally been based on co-operation between the FSA and authorised institutions. The FSA monitors authorised institutions through ongoing supervision and the review of routine and ad hoc reports relating to financial and prudential matters. The FSA may periodically obtain independent reports, usually from the auditors of the authorised institution, as to the adequacy of internal control procedures and systems as well as procedures and systems governing records and accounting. The FSA meets regularly with HSBC’s senior executives to discuss HSBC’s adherence to the FSA’s prudential guidelines. They also regularly discuss fundamental matters relating to HSBC’s business in the UK and internationally, including areas such as strategic and operating plans, risk control, loan portfolio composition and organisational changes, including succession planning.
UK depositors and investors are covered by the Financial Services Compensation Scheme, which deals with deposits with authorised institutions in the UK, investment business and contracts of insurance. Institutions authorised to accept deposits and conduct investment business are required to contribute to the funding of the scheme. In the event of the insolvency of an authorised institution, depositors are entitled to receive 100 per cent of the first £2,000 (US$3,927) of a claim plus 90 per cent of any further amount up to £33,000 (US$64,794) (the maximum amount payable being £31,700 (US$62,241)). Payments under the scheme in respect of investment business compensation are limited to 100 per cent of the first £30,000 (US$58,903) of a claim plus 90 per cent of any further amount up to £20,000 (US$39,269) (the maximum amount payable being £48,000 (US$94,246)). In addition, the Financial Services Compensation Scheme has been extended to cover mortgage advice and arranging, certain long term and general insurance products, and the provision of general advice and
167
arranging services. Differing levels of compensation limits apply to each of these additional areas.
The EU Savings Directive took effect on 1 July 2005. Under the directive, each member state other than Austria, Belgium, and Luxembourg is required to provide the tax authorities of each other member state with details of payments of interest or other similar income paid by a person within its jurisdiction to individuals resident in such other member state. For a transitional period beginning on the same date, Austria, Belgium, and Luxembourg have imposed a withholding tax on such income. The withholding tax rate is 15 per cent, increasing to 20 per cent from 2008 and 35 per cent from 2011. Subject to future conditions being met, Austria, Belgium, and Luxembourg may cease to apply the withholding tax and instead comply with the automatic exchange of information rules applicable to the other member states. These future conditions will depend on other key financial centres – Switzerland, Liechtenstein, San Marino, Andorra and the US – not exchanging information. These financial centres and several other European countries and related offshore territories have also entered into similar agreements to the Savings Directive with the EU states.
Hong Kong regulation and supervision
Banking in Hong Kong is subject to the provisions of the Banking Ordinance (the ‘Banking Ordinance’), and to the powers, functions and duties ascribed by the Banking Ordinance to the Hong Kong Monetary Authority (the ‘HKMA’). The principal function of the HKMA is to promote the general stability and effective working of the banking system in Hong Kong. The HKMA is responsible for supervising compliance with the provisions of the Banking Ordinance. The Banking Ordinance gives power to the Chief Executive of Hong Kong to give directions to the HKMA and the Financial Secretary with respect to the exercise of their respective functions under the Banking Ordinance.
The HKMA has responsibility for authorising banks, and has discretion to attach conditions to its authorisation. The HKMA requires that banks or their holding companies file regular prudential returns, and holds regular discussions with the management of the banks to review their operations. The HKMA may also conduct ‘on site’ examinations of banks, and in the case of banks incorporated in Hong Kong, of any local and overseas branches and subsidiaries. The HKMA requires all authorised institutions to have adequate systems of internal control and requires the institutions’ external
auditors, upon request, to report on those systems and other matters such as the accuracy of information provided to the HKMA. In addition, the HKMA may from time to time conduct tripartite discussions with banks and their external auditors.
The HKMA, which may deny the acquisition of voting power of over 10 per cent in a bank, and may attach conditions to its approval thereof, can effectively control changes in the ownership and control of Hong Kong-incorporated financial institutions. In addition, the HKMA has the power to divest controlling interests in a bank from persons if they are no longer deemed to be fit and proper, if they may otherwise threaten the interests of depositors or potential depositors, or if they have contravened any conditions specified by the HKMA. The HKMA may revoke authorisation in the event of an institution’s non-compliance with the provisions of the Banking Ordinance. These provisions require, among other things, the furnishing of accurate reports.
The Banking Ordinance requires that banks submit to the HKMA certain returns and other information and establishes certain minimum standards and ratios relating to capital adequacy (see below), liquidity, capitalisation, limitations on shareholdings, exposure to any one customer, unsecured advances to persons affiliated with the bank and holdings of interests in land, with which banks must comply.
Hong Kong fully implemented the capital adequacy standards established by the 1988 Basel Capital Accord. The Banking Ordinance currently provides that banks incorporated in Hong Kong maintain a capital adequacy ratio (calculated as the ratio, expressed as a percentage, of the bank’s capital base to its risk-weighted exposure) of at least 8 per cent. For banks with subsidiaries, the HKMA is empowered to require that the ratio be calculated on a consolidated basis, or on both consolidated and unconsolidated bases. If circumstances require, the HKMA is empowered to increase the minimum capital adequacy ratio (to up to 16 per cent), after consultation with the bank.
A deposit protection scheme came into force during 2006 pursuant to the Deposit Protection Scheme Ordinance. The Scheme only covers standard deposits held with licensed banks in Hong Kong subject to a maximum of HK$100,000 (US$12,860).
The marketing of, dealing in and provision of advice and asset management services in relation to securities in Hong Kong are subject to the provisions of the Securities and Futures Ordinance of Hong
H S B C H O L D I N G S P L C
Report of the Directors: The Management of Risk (continued) Regulation and supervision
168
Kong (the ‘Securities and Futures Ordinance’). Entities engaging in activities regulated by the Securities and Futures Ordinance are required to be licensed. The HKMA is the primary regulator for banks involved in the securities business, while the Securities and Futures Commission is the regulator for non-banking entities.
In Hong Kong, insurance business is regulated under the Insurance Companies Ordinance and by the Insurance Authority of Hong Kong (‘IA’). The IA is responsible for the licensing of insurers and insurance brokers, although insurance business can also be licensed by the Confederation of Insurance Brokers (the ‘CIB’). Separately, insurance agents are licensed by the Hong Kong Federation of Insurers (the ‘HKFI’). Both the HKFI and the CIB have enacted Codes of Conduct for insurance agents and brokers respectively and can impose sanctions for misbehaviour or breach.
HSBC Insurance (Asia-Pacific) Holdings Limited (‘INAH’) is licensed by the IA as an insurer. The Hongkong and Shanghai Banking Corporation, which is authorised by the HKFI, acts as an agent for INAH, and HSBC Insurance Brokers (Asia-Pacific) Limited act as insurance brokers licensed by the CIB.
US regulation and supervision
HSBC is subject to extensive federal and state supervision and regulation in the US. Banking laws and regulations of the Federal Reserve Board, the Office of the Comptroller of the Currency (‘OCC’) and the Federal Deposit Insurance Corporation (‘FDIC’) govern many aspects of HSBC’s US business.
HSBC and its US operations are subject to supervision, regulation and examination by the Federal Reserve Board because HSBC is a ‘bank holding company’ under the US Bank Holding Company Act of 1956 (the ‘BHCA’). HSBC and HSBC North America Holdings Inc. (‘HNAH’), formed to hold all of its North American operations, are ‘bank holding companies’ by virtue of their ownership and control of HSBC Bank USA, N.A. (‘HSBC Bank USA’), HSBC National Bank USA (‘HSBC Bank Maryland’), and HSBC Trust Company (Delaware), N.A. (‘HSBC Bank Delaware’). These three banks are nationally chartered commercial banks and members of the Federal Reserve System. HSBC Bank Maryland is a new bank that opened for business on 30 October 2006. HSBC Bank Delaware opened on 1 July 2005, as an institution limited to trust activities. On 24 November 2006, having received federal deposit
insurance, it expanded to become a full-service commercial bank. HSBC also owns HSBC Bank Nevada, N.A. (‘HSBC Bank Nevada’), a nationally chartered bank limited to credit card activities which is also a member of the Federal Reserve System. These four banks are subject to regulation, supervision and examination by the OCC and, as their deposits are insured by the FDIC, they are subject to relevant FDIC regulation. Both HSBC and HNAH are registered as financial holding companies (‘FHCs’) under the BHCA, enabling them to offer a broad range of financial products and services through their subsidiaries. HSBC’s and HNAH’s ability to engage in expanded financial activities as FHCs depend upon HSBC and HNAH continuing to meet certain criteria set forth in the BHCA, including requirements that their US depository institution subsidiaries, HSBC Bank USA, HSBC Bank Maryland, HSBC Bank Nevada and HSBC Bank Delaware, be ‘well capitalised’ and ‘well managed’, and that such institutions have achieved at least a satisfactory record in meeting community credit needs during their most recent examinations pursuant to the Community Reinvestment Act. These requirements also apply to Wells Fargo HSBC Trade Bank, N.A., in which HSBC and HNAH have a 20 per cent voting interest in equity capital and a 40 per cent economic interest. Each of these depository institutions achieved at least the required rating during their most recent examinations. At 31 December 2006, HSBC Bank USA, HSBC Bank Maryland, HSBC Bank Nevada, HSBC Bank Delaware and Wells Fargo HSBC Trade Bank, N.A. were each well capitalised and well managed under Federal Reserve Board regulations.
In general under the BHCA, an FHC would be required, upon notice by the Federal Reserve Board, to enter into an agreement with the Federal Reserve Board to correct any failure to comply with the requirements to maintain FHC status. Until such deficiencies are corrected, the Federal Reserve Board may impose limitations on the US activities of an FHC and depository institutions under its control. If such deficiencies are not corrected, the Federal Reserve Board may require an FHC to divest its control of any subsidiary depository institution or to desist from certain financial activities in the US.
HSBC and HNAH are generally prohibited under the BHCA from acquiring, directly or indirectly, ownership or control of more than 5 per cent of any class of voting shares of, or substantially all the assets of, or exercising control over, any US bank, bank holding company or many other types of depository institutions and/or their holding companies without the prior approval of the Federal
169
Reserve Board and potentially other US banking regulatory agencies.
The Gramm-Leach-Bliley Act of 1999 (‘GLBA’) and the regulations issued thereunder contain a number of other provisions that could affect HSBC’s operations and the operations of all financial institutions. One such provision relates to the financial privacy of consumers. In addition, the so-called ‘push-out’ provisions of GLBA narrow the exclusion of banks (including HSBC Bank USA, N.A. from the definitions of ‘broker’ and ‘dealer’ under the Exchange Act of 1934, as amended (‘Exchange Act’). The SEC has granted a series of temporary exemptions to delay the required implementation of these push-out provisions. The narrowed ‘dealer’ definition took effect in September 2003, and the narrowed ‘broker’ definition is currently expected to take effect no earlier than July 2007. As a result, it is likely that certain securities activities currently conducted by HSBC Bank USA will need to be restructured or transferred to one or more US-registered broker-dealer affiliates.
The US is party to the 1988 Basel Capital Accord, and US banking regulatory authorities have adopted risk-based capital requirements for US banks and bank holding companies that are generally consistent with the Accord. In addition, US regulatory authorities have adopted ‘leverage’ capital requirements that generally require US banks and bank holding companies to maintain a minimum amount of capital in relation to their balance sheet assets (measured on a non-risk-weighted basis).
The Federal Deposit Insurance Corporation Improvement Act of 1991 provides for extensive regulation of insured depository institutions (such as HSBC Bank USA, HSBC Bank Maryland, HSBC Bank Delaware, HSBC Bank Nevada and Wells Fargo HSBC Trade Bank, N.A.), including requiring federal banking regulators to take ‘prompt corrective action’ with respect to FDIC-insured banks that do not meet minimum capital requirements.
HSBC Bank USA, HSBC Bank Maryland, HSBC Bank Delaware, HSBC Bank Nevada and Wells Fargo HSBC Trade Bank, N.A., like other FDIC-insured banks, may be required to pay assessments to the FDIC for deposit insurance under the FDIC’s Bank Insurance Fund. Under the FDIC’s risk-based system for setting deposit insurance assessments, an institution’s assessments vary according to the level of capital an institution holds, its deposit levels and other factors.
The USA Patriot Act (‘Patriot Act’) imposes significant record keeping and customer identity requirements, expands the US federal government’s
powers to freeze or confiscate assets and increases the available penalties that may be assessed against financial institutions for failure to comply with obligations imposed on such institutions to detect, prevent and report money laundering and terrorist financing. Pursuant to the Patriot Act, final regulations are in effect which impose anti-money laundering compliance obligations on financial institutions (a term which, for this purpose, includes insured US depository institutions, US branches and agencies of foreign banks, US broker-dealers and numerous other entities). Many of the anti-money laundering compliance requirements imposed by the Patriot Act and these implementing regulations are generally consistent with the anti-money laundering compliance obligations existing for banks prior to the Patriot Act. These include requirements to adopt and implement an anti-money laundering programme, report suspicious transactions and implement due diligence procedures for certain correspondent and private banking accounts. Certain other specific requirements of the Patriot Act were new compliance obligations. The passage of the Patriot Act and other recent events have resulted in heightened scrutiny of the Bank Secrecy Act and anti-money laundering compliance by federal and state bank examiners.
If HSBC were to fail to maintain and implement adequate programmes to combat money laundering and terrorist financing and to comply with economic sanctions, or was found to be in breach of relevant laws and regulations, including by failing to observe economic sanctions, serious legal and reputational consequences for the Group could arise.
HSBC takes its obligations to prevent money laundering and terrorist financing very seriously. HSBC has policies, procedures and training intended to ensure that its employees know and understand HSBC’s criteria for when a client relationship or business should be evaluated as higher risk. As part of its continuing evaluation of risk, HSBC monitors activities relating to Cuba, Iran, Myanmar, North Korea, Sudan and Syria. HSBC’s business activities include correspondent banking services to banks located in some of these countries and private banking services for nationals of, and clients domiciled in, some of the above countries. The Group has a small representative office in Tehran, Iran.
The US State Department has designated such countries as state sponsors of terrorism, and US law generally prohibits US persons from doing business with such countries. HSBC is aware of initiatives by governmental entities and institutions in the US to adopt rules, regulations or policies prohibiting
H S B C H O L D I N G S P L C
Report of the Directors: The Management of Risk (continued) Regulation and supervision / Risk management / Credit risk
170
transactions with or investments in entities doing business with such countries. HSBC does not believe its business activities with counterparties in, or directly relating to, such countries are material to its business, and such activities represented a very small part of total assets as of 31 December 2006 and total revenues for the year ended 31 December 2006.
HSBC’s US insurance agency and underwriting operations are subject to regulatory supervision under the laws of the states in which they operate. Insurance laws and regulations vary from state to state but generally require forms and rates to be filed with, and approved by, the state insurance departments, and cover licensing of insurance companies; corporate governance; premiums and loss rates; dividend restrictions; types of insurance that may be sold; underwriting processes; permissible investments; reserve requirements; and insurance advertising and marketing practices. Each HSBC US insurance subsidiary undergoes periodic market conduct and financial examinations by the relevant state insurance departments, and HSBC’s insurance agencies and agents are subject to state licensing and registration requirements. Additionally, with respect to credit insurance, because it is sold in connection with a loan, state loan laws often contain requirements related to offering, cancelling and refunding credit insurance. Although insurance is not generally regulated by the federal government, certain federal regulations related to lending disclosures apply to the sale and cancellation of credit insurance.
HSBC’s US consumer finance operations are subject to extensive state-by-state regulation in the US, and to laws relating to consumer protection (both in general, and in respect of ‘sub-prime’ lending operations, which have been subject to enhanced regulatory scrutiny); discrimination in extending credit; use of credit reports; privacy matters; disclosure of credit terms; and correction of billing errors. They also are subject to regulations and legislation that limit operations in certain jurisdictions. For example, limitations may be placed on the amount of interest or fees that a loan may bear, the amount that may be borrowed, the types of actions that may be taken to collect or foreclose upon delinquent loans or the information about a customer that may be shared. HSBC’s US consumer finance branch lending offices are generally licensed in those jurisdictions in which they operate. Such licences have limited terms but are renewable, and are revocable for cause. Failure to comply with applicable laws and regulations may limit the ability of these licensed lenders to collect or enforce loan agreements made with consumers and may cause the
consumer finance lending subsidiary and/or its control person to be liable for damages and penalties.
HSBC’s US credit insurance operations are subject to regulatory supervision under the laws of the states in which they operate. Regulations vary from state to state but generally cover licensing of insurance companies; premiums and loss rates; dividend restrictions; types of insurance that may be sold; permissible investments; policy reserve requirements; and insurance marketing practices.
Certain US source payments to foreign persons may be subject to US withholding tax unless the foreign person is a ‘qualified intermediary’. A qualified intermediary is a financial intermediary which is qualified under the US Internal Revenue Code of 1986 and has completed the Qualified Intermediary Withholding Agreement with the Internal Revenue Service. Various HSBC operations outside the US are qualified intermediaries.
Risk management (Unaudited)
All HSBC’s activities involve analysis, evaluation, acceptance and management of some degree of risk or combination of risks. The most important types of risk are credit risk (which includes country and cross-border risk), liquidity risk, market risk, residual value risk, reputational risk, operational risk, pension risk, insurance risk and sustainability (environmental or social) risks. Market risk includes foreign exchange, interest rate and equity price risk.
HSBC’s risk management policies are designed to identify and analyse these risks, to set appropriate risk limits and controls, and to monitor the risks and adherence to limits by means of reliable and up-to-date administrative and information systems. HSBC regularly reviews its risk management policies and systems to reflect changes in markets, products and emerging best practice. Individual responsibility and accountability, instilled through training, are designed to deliver a disciplined, conservative and constructive culture of risk management and control.
The Group Management Board formulates high level Group risk management policy under authority delegated by the Board of Directors. A separately convened Risk Management Meeting of the Group Management Board monitors risk and receives reports which allow it to review the effectiveness of HSBC’s risk management policies.
The management of all risks that are significant to HSBC is discussed below. Given the distinct characteristics of the Group’s insurance businesses
171
the management of their credit, liquidity and market risk along with insurance risk, is discussed separately in ‘Risk management of insurance operations’ section.
Credit risk
Credit risk management (Audited)
Credit risk is the risk of financial loss if a customer or counterparty fails to meet an obligation under a contract. It arises principally from lending, trade finance, treasury and leasing business. Credit risk also arises when issuers of debt securities are downgraded and, as a result, the value of HSBC’s holdings of assets falls. HSBC has standards, policies and procedures dedicated to controlling and monitoring risk from all such activities.
Within Group Head Office, a specialised function, Group Credit and Risk, is mandated to provide high-level centralised management of credit risk for HSBC worldwide. Group Credit and Risk is headed by a Group General Manager who reports to the Group Chief Executive. Its responsibilities include the following:
• Formulating Group credit policies and monitoring compliance with them. These policies are embodied in the HSBC standards with which all HSBC’s operating companies are required to comply, and consistent with which they must formulate and record in instruction manuals their detailed credit policies and procedures.
• Issuing policy guidelines to HSBC’s operating companies on the Group’s attitude toward, and appetite for, credit risk exposure to specified market sectors, activities and banking products. Each HSBC operating company and major business unit is required to base its own lending guidelines on HSBC’s standards, to regularly update them and disseminate them to its credit and lending executives. Group Credit and Risk controls HSBC’s exposures to the automotive and hedge fund sectors, and closely monitors exposures to others such as real estate and securities houses. When necessary, restrictions are imposed on new business or exposures in HSBC’s operating companies are capped.
• Undertaking an independent review and objective assessment of risk. Group Credit and Risk assesses all commercial non-bank credit facilities and exposures – including those embedded in derivatives – that are originated, renewed or reviewed by HSBC’s operating
companies in excess of designated limits, prior to the facilities being committed to customers or transactions being undertaken. Operating companies may not confirm credit approval without this concurrence.
• Monitoring the performance and management of retail portfolios across the Group and reviewing whether any adverse trends are being managed appropriately by Group businesses.
• Controlling centrally exposures to sovereign entities, banks and other financial institutions. HSBC’s credit and settlement risk limits to counterparties in these sectors are approved centrally and globally managed by a dedicated unit within Group Credit and Risk, to optimise the use of credit availability and avoid excessive risk concentration.
• Managing exposures to debt securities by establishing controls in respect of the liquidity of securities held for trading purposes and setting issuer limits for securities not held for trading. Separate portfolio limits are established for asset-backed securities and similar instruments.
• Maintaining HSBC’s policy on large credit exposures, controlling these to ensure that exposure to any individual counterparty or group of closely related counterparties, or to individual geographic areas or industry sectors, does not become excessive in relation to the Group’s capital base and is kept within internal and regulatory limits. The approach is designed to be more conservative than internationally accepted regulatory standards. A dedicated unit within Group Credit and Risk manages this process, and also monitors HSBC’s intra-Group exposures to ensure that they are maintained within regulatory limits. The FSA has announced changes to the regime for managing intra-Group exposures, which will operate by reference to a ‘UK Integrated Group’ and a ‘Wider Integrated Group’. HSBC is developing plans to adopt the new regime in accordance with the FSA’s transition timetable.
• Controlling cross-border exposures, through the imposition of country limits with sub-limits by maturity and type of business. Country limits are determined by taking into account economic and political factors, and applying local business knowledge. Transactions with countries deemed to be high risk are considered case by case.
• Maintaining and developing HSBC’s risk ratings in order to categorise exposures
H S B C H O L D I N G S P L C
Report of the Directors: The Management of Risk (continued) Credit risk > Credit risk management
172
meaningfully and facilitate focused management of the attendant risks. Historically, HSBC’s risk rating framework has consisted of a minimum of seven grades, taking into account the risk of default and the availability of security or other credit risk mitigation. A more sophisticated risk-rating framework for banks and other customers, based on default probability and loss estimates and comprising up to 22 categories, is now used in all major business units for the credit assessment of individually significant customers. It is increasingly being used for credit portfolio reporting at subsidiary level; work continues on integrating the framework into reporting structures to enable Board and external reporting on the new basis in 2008. This approach allows a more granular analysis of risk and trends. Rating methodology is based upon a wide range of financial analytics together with market data-based tools which are core inputs to the assessment of counterparty risk. Although automated risk-rating processes are increasingly in use, for the larger facilities ultimate responsibility for setting risk grades rests in each case with the final approving executive.
• Reviewing the performance and effectiveness of operating companies’ credit approval processes. Regular reports are provided to Group Credit and Risk on the credit quality of local portfolios and corrective action is taken where necessary.
• Reporting to senior executives on aspects of the HSBC credit risk portfolio. These executives, as well as the Risk Management Meeting, the Group Audit Committee and the Board of Directors of HSBC Holdings, receive a variety of regular reports covering:
– risk concentrations and exposure to market sectors;
– large customer group exposures;
– retail portfolio performance on a regional basis;
– specific segments of the portfolio, e.g. real estate, banks, and the automotive and hedge fund sectors, as well as ad hoc reviews;
– emerging market debt and impairment allowances;
– large impaired accounts and impairment allowances;
– country limits, cross-border exposures and impairment allowances; and
– causes of unexpected loss and lessons to be learned.
• Managing and directing credit risk management systems initiatives. HSBC has a centralised database of large corporate, sovereign and bank facilities and is constructing a database covering all the Group’s credit assets. A systems-based credit application process for bank lending is operational throughout the Group and an electronic corporate credit application system is deployed in all of the Group’s major businesses.
• Providing advice and guidance to HSBC’s operating companies in order to promote best practice throughout the Group on credit-related matters such as:
– regulatory developments;
– implementing environmental and social responsibility policies;
– risk modelling;
– collective impairment allowances;
– new products;
– training courses; and
– credit risk reporting.
• Acting on behalf of HSBC Holdings as the primary interface, for credit-related issues, with external parties including the Bank of England, the FSA, rating agencies, corporate analysts, trade associations and counterparts in the world’s major banks and non-bank financial institutions.
Each operating company is required to implement credit policies, procedures and lending guidelines which conform to HSBC Group standards, with credit approval authorities delegated from the Board of Directors of HSBC Holdings to the relevant Chief Executive Officer. In each major subsidiary, management includes a Chief Credit Officer or Chief Risk Officer who reports to the local Chief Executive Officer on credit-related issues and has a functional reporting line to the Group General Manager, Group Credit and Risk. Each operating company is responsible for the quality and performance of its credit portfolios and for monitoring and controlling all credit risks in its portfolios, including those subject to central approval by Group Credit and Risk. This includes managing its own risk concentrations by market sector, geography and product. Local systems are in place throughout the Group to enable operating companies to control and monitor exposures by customer and retail product segments.
173
Special attention is paid to problem loans. When appropriate, specialist units are established by HSBC’s operating companies to provide customers with support in order to help them avoid default wherever possible.
Periodic risk-based audits of operating companies’ credit processes and portfolios are undertaken by HSBC’s Internal Audit function. Audits include a consideration of the completeness and adequacy of credit manuals and lending guidelines; an in-depth analysis of a representative sample of accounts; an overview of homogeneous portfolios of similar assets to assess the quality of the loan book and other exposures; a consideration of any oversight or review work performed by Credit and Risk functions; review of model validation procedures; review of management objectives and a check that Group and local standards and policies are adhered to in the granting and management of credit facilities. Individual accounts are reviewed on a sample basis to ensure that risk grades are appropriate, that credit and collection procedures have been properly followed and that, when an account or portfolio evidences deterioration, impairment allowances are raised in accordance with the Group’s established processes. Internal Audit discusses with management risk ratings it considers to be inappropriate; its subsequent recommendations for revised grades must then normally be adopted.
Collateral and other credit enhancements (Audited)
Loans and advances
It is HSBC’s policy to establish that loans are within the customer’s capacity to repay, rather than to rely excessively on security. Depending on the customer’s standing and the type of product, facilities may be unsecured. Nevertheless, collateral can be an important mitigant of credit risk.
When appropriate, operating companies are required to implement guidelines on the acceptability of specific classes of collateral or credit risk mitigation, and determine suitable valuation parameters. Such parameters are expected to be conservative, reviewed regularly and supported by empirical evidence. Security structures and legal covenants are required to be subject to regular review to ensure that they continue to fulfil their intended purpose and remain in line with local market practice. The principal collateral types are as follows:
• in the personal sector, mortgages over residential properties;
• in the commercial and industrial sector, charges
over business assets such as premises, stock and debtors;
• in the commercial real estate sector, charges over the properties being financed;
• in the financial sector, charges over financial instruments such as debt securities and equities in support of trading facilities; and
• credit derivatives are also used to manage credit risk in the Group’s loan portfolio, but are not significant.
Other financial assets
Collateral held as security for financial assets other than loans and advances is determined by the nature of the instrument. Debt securities, treasury and other eligible bills are generally unsecured with the exception of asset backed securities and similar instruments, which are secured by pools of financial assets.
The ISDA Master Agreement is HSBC’s preferred agreement for documenting derivatives activity. It provides the contractual framework within which dealing activity across a full range of over-the-counter products is conducted, and contractually binds both parties to apply close-out netting across all outstanding transactions covered by an agreement if either party defaults or other pre-agreed termination events occur. It is common, and HSBC’s preferred practice, for the parties to execute a Credit Support Annex (‘CSA’) in conjunction with the ISDA Master Agreement. Under a CSA, collateral is passed between the parties to mitigate the market-contingent counterparty risk inherent in the outstanding positions.
Settlement risk arises in any situation where a payment in cash, securities or equities is made in the expectation of a corresponding receipt in cash, securities or equities. Daily settlement limits are established for each counterparty to cover the aggregate of all settlement risk arising from HSBC’s investment banking and markets transactions on any single day. Settlement risk on many transactions, particularly those involving securities and equities, is substantially mitigated when effected via assured payment systems, or on a delivery versus payment basis.
Credit quality of loans and advances (Audited)
HSBC’s credit risk rating processes are designed to highlight exposures which require closer management attention because of their greater probability of default and potential loss. Risk ratings
H S B C H O L D I N G S P L C
Report of the Directors: The Management of Risk (continued) Credit risk > Credit risk management
174
are reviewed regularly and amendments, where necessary, are implemented promptly.
The credit quality of unimpaired loans is assessed by reference to the Group’s standard credit rating system.
Grades 1 and 2 include corporate facilities demonstrating financial condition, risk factors and capacity to repay that are good to excellent, residential mortgages with low to moderate loan to value ratios and other retail accounts which are maintained within product guidelines.
Grade 3 represents satisfactory risk, and includes corporate facilities that require closer monitoring, mortgages with higher loan to value ratios, credit card exposures and other retail exposures which operate outside product guidelines without being impaired.
Grades 4 and 5 include facilities that require varying degrees of special attention and all retail exposures that are progressively between 30 and 90 days past due.
Grades 6 and 7 relate to impaired loans and advances.
Impaired loans and advances
For individually assessed accounts, loans are treated as impaired as soon as there is objective evidence that an impairment loss has been incurred. The criteria used by HSBC to determine that there is such objective evidence include, inter alia:
• known cash flow difficulties experienced by the borrower;
• overdue contractual payments of either principal or interest;
• breach of loan covenants or conditions;
• the probability that the borrower will enter bankruptcy or other financial realisation; and
• a significant downgrading in credit rating by an external credit rating agency.
For accounts in portfolios of homogeneous loans, impairment allowances are calculated on a collective basis, as set out below.
Impairment assessment (Audited)
It is HSBC’s policy that each operating company make allowance for impaired loans promptly and on a consistent basis.
Management regularly evaluates the adequacy of the established allowances for impaired loans by
conducting a detailed review of the loan portfolio, comparing performance and delinquency statistics with historical trends and assessing the impact of current economic conditions.
Two types of impairment allowance are in place: individually assessed and collectively assessed. These are discussed below.
Individually assessed impairment allowances
These are determined by evaluating the exposure to loss, case by case, on all individually significant accounts and all other accounts that do not qualify for the collective assessment approach outlined below. In determining allowances on individually assessed accounts, the following factors are considered:
• HSBC’s aggregate exposure to the customer;
• the viability of the customer’s business model and their capacity to trade successfully out of financial difficulties, generating sufficient cash flow to service debt obligations;
• the ability of the borrower to obtain, and make payments in, the currency of the loan if not denominated in local currency;
• the amount and timing of expected receipts and recoveries;
• the extent of other creditors’ commitments ranking ahead of, or pari passu with, HSBC and the likelihood of other creditors continuing to support the company;
• the complexity of determining the aggregate amount and ranking of all creditor claims and the extent to which legal and insurance uncertainties are evident;
• the realisable value of security (or other credit mitigants) and likelihood of successful repossession;
• the likely dividend available on liquidation or bankruptcy;
• the likely deduction of any costs involved in recovering amounts outstanding, and
• when available, the secondary market price of the debt.
Group policy requires the level of impairment allowances on individual facilities that are above materiality thresholds to be reviewed at least semi-annually, and more regularly when individual circumstances require. The review normally
175
encompasses collateral held (including re-confirmation of its enforceability) and an assessment of actual and anticipated receipts. For significant commercial and corporate debts, specialised loan ‘work-out’ teams with experience in insolvency and specific market sectors are used to assess likely losses on significant individual exposures. Individually assessed impairment allowances are only reversed when the Group has reasonable and objective evidence of a reduction in the established loss estimate.
Collectively assessed impairment allowances
Impairment is assessed on a collective basis in two circumstances:
• to cover losses which have been incurred but have not yet been identified on loans subject to individual assessment; and
• for homogeneous groups of loans that are not considered individually significant.
Incurred but not yet identified impairment
Individually assessed loans for which no evidence of impairment has been specifically identified on an individual basis are grouped together according to their credit risk characteristics. A collective loan loss allowance is calculated to reflect impairment losses incurred at the balance sheet date which will only be individually identified in the future.
The collective impairment allowance is determined having taken into account:
• historical loss experience in portfolios of similar credit risk characteristics (for example, by industry sector, risk rating or product segment);
• the estimated period between impairment occurring and the loss being identified and evidenced by the establishment of an appropriate allowance against the individual loan; and
• management’s experienced judgement as to whether current economic and credit conditions are such that the actual level of inherent losses is likely to be greater or less than that suggested by historical experience.
The period between a loss occurring and its identification is estimated by local management for each identified portfolio. In general, the periods used vary between four and twelve months although, in exceptional cases, longer periods are warranted.
The basis on which impairment allowances for incurred but not yet identified losses is established in
each reporting entity is documented and reviewed by senior Group Credit and Risk management to ensure conformity with Group policy.
Homogeneous groups of loans
Two methodologies are used to calculate impairment allowances where large numbers of relatively low-value assets are managed using a portfolio approach, typically:
• low-value, homogeneous small business accounts in certain countries or territories;
• residential mortgages that have not been individually assessed;
• credit cards and other unsecured consumer lending products; and
• motor vehicle financing.
When appropriate empirical information is available, the Group uses roll rate methodology. This employs a statistical analysis of historical trends of default and the amount of consequential loss, based on the delinquency of accounts within a portfolio of homogeneous accounts. Other historical data and current economic conditions are also evaluated when calculating the appropriate level of impairment allowance required to cover inherent loss. In certain highly developed markets, models also take into account behavioural and account management trends revealed in, for example, bankruptcy and rescheduling statistics.
When the portfolio size is small, or when information is insufficient or not reliable enough to adopt a roll rate methodology, a formulaic approach is used which allocates progressively higher percentage loss rates the longer a customer’s loan is overdue. Loss rates reflect the discounted expected future cash flows for a portfolio.
In normal circumstances, historical experience is the most objective and relevant information from which to assess inherent loss within each portfolio. In circumstances where historical loss experience provides less relevant information about the inherent loss in a given portfolio at the balance sheet date – for example, where there have been changes in economic conditions or regulations – management considers the more recent trends in the portfolio risk factors which may not be adequately reflected in its statistical models and, subject to guidance from Group Credit and Risk, adjusts impairment allowances accordingly.
Roll rates, loss rates and the expected timing of future recoveries are regularly benchmarked against actual outcomes to ensure they remain appropriate.
H S B C H O L D I N G S P L C
Report of the Directors: The Management of Risk (continued) Credit risk > Credit risk management / Exposure
176
Collectively assessed allowances are generally calculated monthly and charges for new allowances, or reversals of existing allowances, are determined for each separately identified portfolio.
Impairment allowances
When impairment losses occur, HSBC reduces the carrying amount of loans and advances and held-to-maturity financial investments through the use of an allowance account. When impairment of available-for-sale financial assets occurs, the carrying amount of the asset is reduced directly.
Loan write-offs
Loans, and the related impairment allowances, are normally written off, either partially or in full, in the case of that portion of the loan amount not covered by the value of security, when there is no realistic prospect of further recovery; and in the case of secured balances, after proceeds from the realisation of security have been received. Unsecured consumer facilities are normally written off between 150 and 210 days overdue. In HSBC Finance, this period is generally extended to 300 days overdue (240 days for real estate secured products).
Instances of write-off periods exceeding 360 days overdue are few, but can arise where certain consumer finance accounts are deemed collectible beyond this point or where, in a few countries, regulation or legislation constrain earlier write-off.
In the event of bankruptcy, or analogous proceedings, write-off can occur earlier.
Cross-border exposures
Management assesses the vulnerability of countries to foreign currency payment restrictions when considering impairment allowances on cross-border exposures. This assessment includes an analysis of the economic and political factors existing at the time. Economic factors include the level of external indebtedness, the debt service burden and access to external sources of funds to meet the debtor country’s financing requirements. Political factors taken into account include the stability of the country and its government, threats to security, and the quality and independence of the legal system.
Impairment allowances are applied to all qualifying exposures within these countries unless these exposures and the inherent risks are:
• performing, trade-related and of less than one year’s maturity;
• mitigated by acceptable security cover which is, other than in exceptional cases, held outside the country concerned;
• in the form of securities held for trading purposes for which a liquid and active market exists, and which are measured at fair value daily;
• performing facilities with principal (excluding security) of US$1 million or below; or
• performing facilities with maturity dates shorter than three months.
Credit exposure
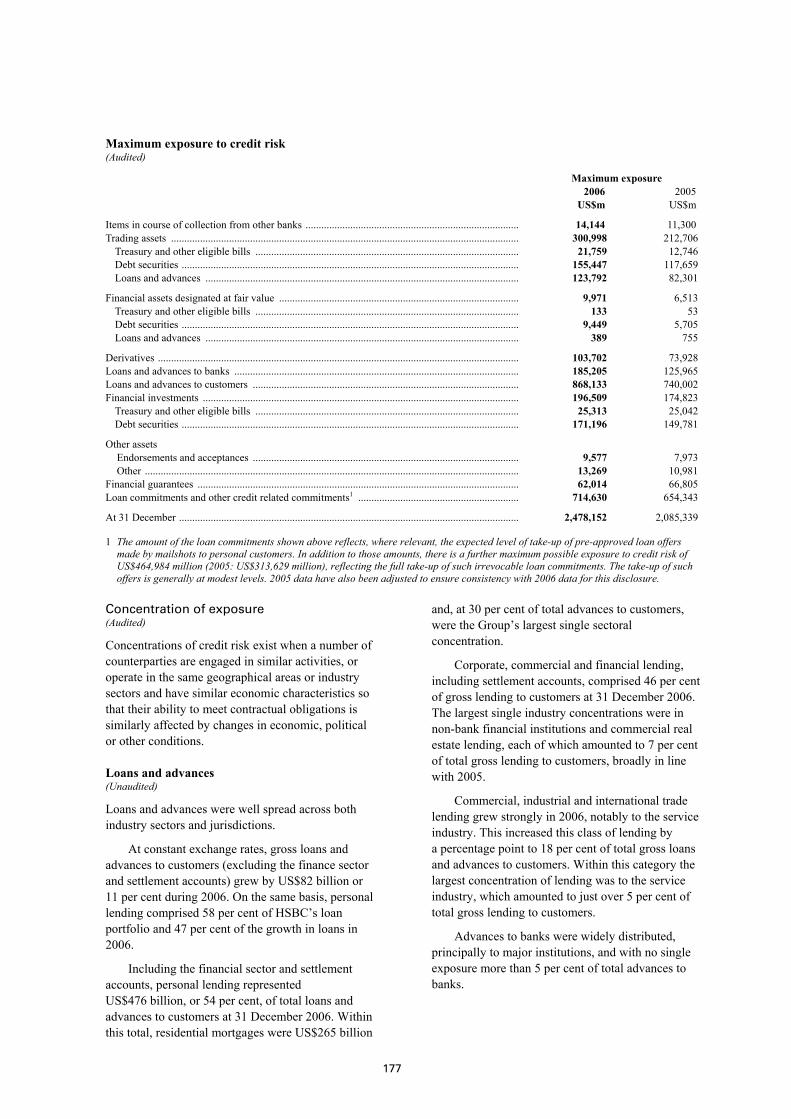
Maximum exposure to credit risk (Audited)
Factors which had a direct impact on changes in HSBC’s maximum exposure to credit risk during 2006 related to the curtailment of growth in mortgage lending in the US in response to deteriorating conditions, and slowed growth in UK personal unsecured lending following an increase in personal bankruptcies and IVAs. Elsewhere, growth reflected underlying economic trends on a geographic basis.
The following table presents the maximum exposure to credit risk of balance sheet and off balance sheet financial instruments, before taking account of any collateral held or other credit enhancements unless such credit enhancements meet offsetting requirements as set out in Note 2(m) on the Financial Statements. For financial assets recognised on the balance sheet, the exposure to credit risk equals their carrying amount. For financial guarantees granted, the maximum exposure to credit risk is the maximum amount that HSBC would have to pay if the guarantees are called upon. For loan commitments and other credit related commitments that are irrevocable over the life of the respective facilities, the maximum exposure to credit risk is the full amount of the committed facilities.
177
Maximum exposure to credit risk (Audited)
Maximum exposure 2006 2005 US$m US$m
Items in course of collection from other banks ................................................................................. 14,144 11,300 Trading assets .................................................................................................................................... 300,998 212,706
Treasury and other eligible bills .................................................................................................... 21,759 12,746Debt securities ................................................................................................................................ 155,447 117,659Loans and advances ....................................................................................................................... 123,792 82,301
Financial assets designated at fair value ........................................................................................... 9,971 6,513Treasury and other eligible bills .................................................................................................... 133 53Debt securities ................................................................................................................................ 9,449 5,705Loans and advances ....................................................................................................................... 389 755
Derivatives ......................................................................................................................................... 103,702 73,928 Loans and advances to banks ............................................................................................................ 185,205 125,965 Loans and advances to customers ..................................................................................................... 868,133 740,002 Financial investments ........................................................................................................................ 196,509 174,823
Treasury and other eligible bills .................................................................................................... 25,313 25,042Debt securities ................................................................................................................................ 171,196 149,781
Other assets Endorsements and acceptances ..................................................................................................... 9,577 7,973 Other .............................................................................................................................................. 13,269 10,981
Financial guarantees .......................................................................................................................... 62,014 66,805 Loan commitments and other credit related commitments1 ............................................................. 714,630 654,343
At 31 December ................................................................................................................................. 2,478,152 2,085,339
1 The amount of the loan commitments shown above reflects, where relevant, the expected level of take-up of pre-approved loan offers made by mailshots to personal customers. In addition to those amounts, there is a further maximum possible exposure to credit risk of US$464,984 million (2005: US$313,629 million), reflecting the full take-up of such irrevocable loan commitments. The take-up of such offers is generally at modest levels. 2005 data have also been adjusted to ensure consistency with 2006 data for this disclosure.
Concentration of exposure (Audited)
Concentrations of credit risk exist when a number of counterparties are engaged in similar activities, or operate in the same geographical areas or industry sectors and have similar economic characteristics so that their ability to meet contractual obligations is similarly affected by changes in economic, political or other conditions.
Loans and advances (Unaudited)
Loans and advances were well spread across both industry sectors and jurisdictions.
At constant exchange rates, gross loans and advances to customers (excluding the finance sector and settlement accounts) grew by US$82 billion or 11 per cent during 2006. On the same basis, personal lending comprised 58 per cent of HSBC’s loan portfolio and 47 per cent of the growth in loans in 2006.
Including the financial sector and settlement accounts, personal lending represented US$476 billion, or 54 per cent, of total loans and advances to customers at 31 December 2006. Within this total, residential mortgages were US$265 billion
and, at 30 per cent of total advances to customers, were the Group’s largest single sectoral concentration.
Corporate, commercial and financial lending, including settlement accounts, comprised 46 per cent of gross lending to customers at 31 December 2006. The largest single industry concentrations were in non-bank financial institutions and commercial real estate lending, each of which amounted to 7 per cent of total gross lending to customers, broadly in line with 2005.
Commercial, industrial and international trade lending grew strongly in 2006, notably to the service industry. This increased this class of lending by a percentage point to 18 per cent of total gross loans and advances to customers. Within this category the largest concentration of lending was to the service industry, which amounted to just over 5 per cent of total gross lending to customers.
Advances to banks were widely distributed, principally to major institutions, and with no single exposure more than 5 per cent of total advances to banks.
H S B C H O L D I N G S P L C
Report of the Directors: The Management of Risk Credit risk > Exposure
178
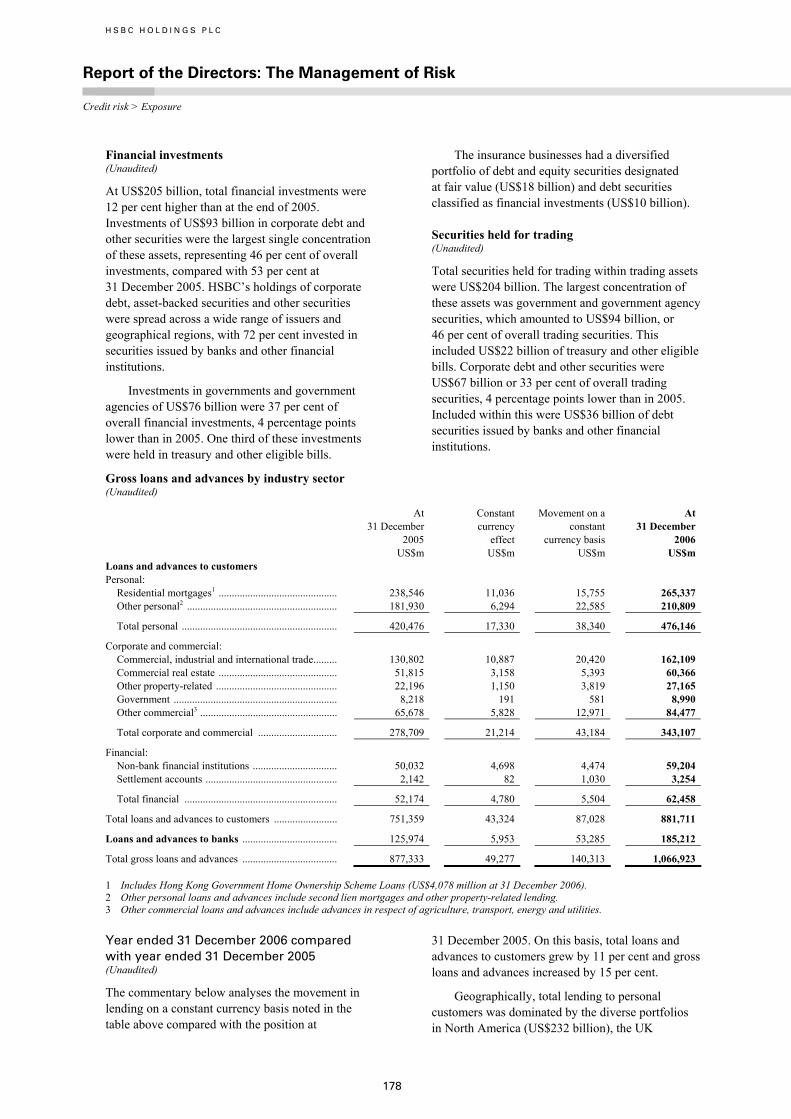
Financial investments (Unaudited)
At US$205 billion, total financial investments were 12 per cent higher than at the end of 2005. Investments of US$93 billion in corporate debt and other securities were the largest single concentration of these assets, representing 46 per cent of overall investments, compared with 53 per cent at 31 December 2005. HSBC’s holdings of corporate debt, asset-backed securities and other securities were spread across a wide range of issuers and geographical regions, with 72 per cent invested in securities issued by banks and other financial institutions.
Investments in governments and government agencies of US$76 billion were 37 per cent of overall financial investments, 4 percentage points lower than in 2005. One third of these investments were held in treasury and other eligible bills.
The insurance businesses had a diversified portfolio of debt and equity securities designated at fair value (US$18 billion) and debt securities classified as financial investments (US$10 billion).
Securities held for trading (Unaudited)
Total securities held for trading within trading assets were US$204 billion. The largest concentration of these assets was government and government agency securities, which amounted to US$94 billion, or 46 per cent of overall trading securities. This included US$22 billion of treasury and other eligible bills. Corporate debt and other securities were US$67 billion or 33 per cent of overall trading securities, 4 percentage points lower than in 2005. Included within this were US$36 billion of debt securities issued by banks and other financial institutions.
Gross loans and advances by industry sector (Unaudited)
At 31 December
2005
Constantcurrency
effect
Movement on a constant
currency basis
At 31 December 2006
US$m US$m US$m US$m Loans and advances to customers Personal:
Residential mortgages1 ............................................. 238,546 11,036 15,755 265,337 Other personal2 ......................................................... 181,930 6,294 22,585 210,809
Total personal ........................................................... 420,476 17,330 38,340 476,146
Corporate and commercial: Commercial, industrial and international trade......... 130,802 10,887 20,420 162,109 Commercial real estate ............................................. 51,815 3,158 5,393 60,366 Other property-related .............................................. 22,196 1,150 3,819 27,165 Government .............................................................. 8,218 191 581 8,990 Other commercial3 .................................................... 65,678 5,828 12,971 84,477
Total corporate and commercial .............................. 278,709 21,214 43,184 343,107
Financial: Non-bank financial institutions ................................ 50,032 4,698 4,474 59,204 Settlement accounts .................................................. 2,142 82 1,030 3,254
Total financial .......................................................... 52,174 4,780 5,504 62,458
Total loans and advances to customers ........................ 751,359 43,324 87,028 881,711
Loans and advances to banks .................................... 125,974 5,953 53,285 185,212
Total gross loans and advances .................................... 877,333 49,277 140,313 1,066,923
1 Includes Hong Kong Government Home Ownership Scheme Loans (US$4,078 million at 31 December 2006). 2 Other personal loans and advances include second lien mortgages and other property-related lending. 3 Other commercial loans and advances include advances in respect of agriculture, transport, energy and utilities.
Year ended 31 December 2006 compared with year ended 31 December 2005 (Unaudited)
The commentary below analyses the movement in lending on a constant currency basis noted in the table above compared with the position at
31 December 2005. On this basis, total loans and advances to customers grew by 11 per cent and gross loans and advances increased by 15 per cent.
Geographically, total lending to personal customers was dominated by the diverse portfolios in North America (US$232 billion), the UK
179
(US$129 billion) and Hong Kong (US$39 billion). Collectively, these lending books accounted for 84 per cent of total lending to the personal sector, 3 percentage points lower than the 87 per cent level reported at 31 December 2005.
Residential mortgages rose by US$16 billion, or 6 per cent, to US$265 billion, representing 30 per cent of total gross loans to customers at 31 December 2006. Residential mortgages include only first lien secured loans. In value terms, growth was greatest in the UK, where residential mortgages increased by 7 per cent to US$83 billion, and in North America, where mortgage balances rose by 6 per cent to US$124 billion. In the US, mortgage balances within HSBC Finance increased by 13 per cent to US$76 billion. In Hong Kong, mortgage balances rose by 1 per cent.
In North America, growth in residential mortgage balances was attributable both to increases in non-prime lending originated through the branch-based consumer lending business and balances acquired from correspondent brokers and banks through the mortgage services business.
In light of emerging evidence of unforeseen deterioration within the US mortgage services business in respect of originations made in 2005 and the first half of 2006, a wide range of initiatives was implemented to mitigate the impact on the affected portions of the business. Consequently, in the second half of the year, growth in real estate lending slowed, as the mortgage services business tightened its underwriting criteria, as detailed on page 189. Prime mortgage balances held in the US banking network also declined, as HSBC sold the majority of its new prime mortgage originations into the secondary market and increased its securitisation programme, which together augmented the normal run-off of balances. In Canada, mortgage balances rose, primarily due to a strong housing market and continued expansion of HSBC’s consumer finance business and core banking distribution channels.
In the UK, mortgage balances rose by 7 per cent, primarily in the form of fixed rate mortgages as customers sought to insulate themselves from rising interest rates. Mortgage lending in France experienced strong growth, benefiting from competitive pricing and a marked improvement in brand awareness following the rebranding of the business in 2005.
Residential mortgage balances in Hong Kong rose as increased marketing and product development contributed to HSBC raising its market share. This occurred despite a subdued housing
market, fierce competition and continuing reduction in assets from the suspended GHOS.
In the Rest of Asia-Pacific, mortgage balances fell by 6 per cent, as the sale of the broker-originated mortgage business in Australia offset modest growth in most other countries.
Other personal lending grew by 12 per cent to US$211 billion at 31 December 2006, representing 24 per cent of gross loans and advances to customers.
In North America, growth in other personal lending was largely driven by credit card activity and increased second lien mortgage balances. In the US, increased uptake of both prime and non-prime credit cards was driven by targeted marketing campaigns and the launch of several new co-branded cards. The credit card market continued to be highly competitive with many competitors relying on zero per cent offers to generate growth. HSBC, by contrast, reduced the amount of its equivalent offers and focused instead on increased marketing. In the first half of 2006, the US mortgage services business significantly increased the levels of second lien mortgages, continuing the growth of this loan type that was instigated in 2005. The rate of growth of the second lien mortgage book slowed in the latter half of the year as the deterioration of credit quality of the portfolio became apparent. This is discussed in further detail under mortgage lending in the US on page 189. The US motor vehicle finance portfolio also grew, due to increased volumes in both the dealer network and the consumer direct loan programme, dampened by the expiration of fixed-term loans and reduction in the level of incentives offered by car manufacturers.
Other personal lending grew by 10 per cent in Europe. In the UK, unsecured personal loan balances declined, reflecting a policy decision to constrain growth to selected segments by tightening underwriting criteria. Credit card balances increased, driven by promotional and marketing campaigns, with strong growth in M&S branded credit cards. In Turkey, unsecured personal lending grew strongly reflecting the success of marketing initiatives and cross-sales with existing credit card clients.
Promotional and marketing activity contributed towards a strengthening of HSBC’s position as the largest credit card issuer in Hong Kong, with over 4.6 million cards in force.
In the Rest of Asia-Pacific, other personal lending rose by 15 per cent. Credit card balances grew rapidly with an increase of over 1.2 million cards in circulation in 2006 following new product
H S B C H O L D I N G S P L C
Report of the Directors: The Management of Risk (continued) Credit risk > Exposure
180
launches in the Middle East, Sri Lanka and Singapore and marketing and incentive campaigns across the region. Other unsecured lending balances rose during 2006, partly as a result of expansion of HSBC’s consumer finance business in India, Australia and Indonesia.
In Latin America, other personal lending showed significant growth, rising by 49 per cent, with cross-sales of the ‘Tu Cuenta’ product generating strong demand for credit cards in Mexico. Personal lending balances, excluding mortgages, rose by 25 per cent in Brazil, with increased vehicle finance lending benefiting from strengthened relationships with car dealers, and higher numbers of credit cards in issue following a number of campaigns designed to improve retention and utilisation.
Loans and advances to corporate and commercial customers grew by 14 per cent to US$343 billion. Lending was primarily in Europe, which accounted for 57 per cent of advances, over three quarters of which was concentrated in the UK.
In Europe, corporate and commercial advances rose by 9 per cent, driven by lending growth in the UK, France and Turkey. In the UK, there was firm growth in lending to the service industry and real estate and related construction businesses. In France, improved retention of existing clients and recruitment of new customers resulted in higher lending balances, while in Turkey expansion of the branch network, including dedicated SME centres, contributed to growth in commercial advances.
In Hong Kong there was strong demand for credit from larger Commercial Banking customers in the property sector and from manufacturers with
operations in mainland China seeking to fund expansion. New initiatives designed to increase commercial lending included a pre-approved lending scheme and a telesales campaign, which led to growth in SME lending and a doubling in the number of lending relationships in this segment. This strong growth in Commercial Banking lending was offset by the repayment of two large facilities by Corporate, Investment Banking and Markets clients.
In the Rest of Asia-Pacific, strong economic expansion in the Middle East led to greater demand for credit and regional lending balances rose in response to increases in regional trade flows and increased marketing activity.
In North America, expansion into new regional markets, higher levels of marketing and the recruitment of additional SME relationship managers to meet customer demand contributed to growth in corporate and commercial lending balances.
HSBC experienced strong growth in lending balances to SME businesses across Latin America due to favourable economic conditions. Additionally, in Mexico, strong demand for credit from the rapidly growing real estate and residential construction sectors contributed to greater levels of lending.
The following tables analyse loans and advances by industry sector and by the location of the principal operations of the lending subsidiary or, in the case of the operations of The Hongkong and Shanghai Banking Corporation, HSBC Bank, HSBC Bank Middle East and HSBC Bank USA, by the location of the lending branch.
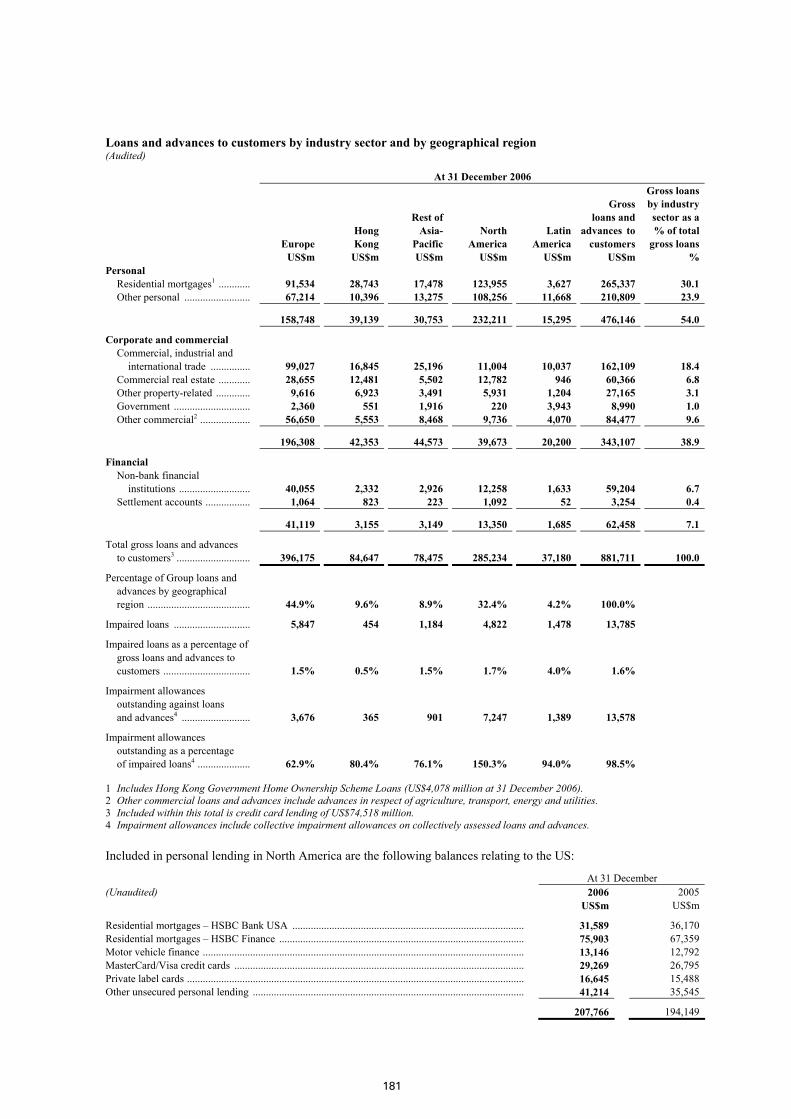
181
Loans and advances to customers by industry sector and by geographical region (Audited)
At 31 December 2006
Europe Hong Kong
Rest of Asia- Pacific
North America
Latin America
Gross loans and advances to customers
Gross loans by industry sector as a % of total gross loans
US$m US$m US$m US$m US$m US$m % Personal
Residential mortgages1 ............ 91,534 28,743 17,478 123,955 3,627 265,337 30.1 Other personal ......................... 67,214 10,396 13,275 108,256 11,668 210,809 23.9
158,748 39,139 30,753 232,211 15,295 476,146 54.0
Corporate and commercial Commercial, industrial and
international trade ............... 99,027 16,845 25,196 11,004 10,037 162,109 18.4 Commercial real estate ............ 28,655 12,481 5,502 12,782 946 60,366 6.8 Other property-related ............. 9,616 6,923 3,491 5,931 1,204 27,165 3.1 Government ............................. 2,360 551 1,916 220 3,943 8,990 1.0 Other commercial2 ................... 56,650 5,553 8,468 9,736 4,070 84,477 9.6
196,308 42,353 44,573 39,673 20,200 343,107 38.9
Financial Non-bank financial
institutions ........................... 40,055 2,332 2,926 12,258 1,633 59,204 6.7 Settlement accounts ................. 1,064 823 223 1,092 52 3,254 0.4
41,119 3,155 3,149 13,350 1,685 62,458 7.1
Total gross loans and advances to customers3 ............................ 396,175 84,647 78,475 285,234 37,180 881,711 100.0
Percentage of Group loans and advances by geographical region ....................................... 44.9% 9.6% 8.9% 32.4% 4.2% 100.0%
Impaired loans ............................. 5,847 454 1,184 4,822 1,478 13,785
Impaired loans as a percentage of gross loans and advances to customers ................................. 1.5% 0.5% 1.5% 1.7% 4.0% 1.6%
Impairment allowances outstanding against loans and advances4 .......................... 3,676 365 901 7,247 1,389 13,578
Impairment allowances outstanding as a percentage of impaired loans4 .................... 62.9% 80.4% 76.1% 150.3% 94.0% 98.5%
1 Includes Hong Kong Government Home Ownership Scheme Loans (US$4,078 million at 31 December 2006). 2 Other commercial loans and advances include advances in respect of agriculture, transport, energy and utilities. 3 Included within this total is credit card lending of US$74,518 million. 4 Impairment allowances include collective impairment allowances on collectively assessed loans and advances.
Included in personal lending in North America are the following balances relating to the US:
At 31 December (Unaudited) 2006
US$m 2005
US$m
Residential mortgages – HSBC Bank USA ........................................................................................ 31,589 36,170 Residential mortgages – HSBC Finance ............................................................................................. 75,903 67,359 Motor vehicle finance .......................................................................................................................... 13,146 12,792 MasterCard/Visa credit cards .............................................................................................................. 29,269 26,795 Private label cards ................................................................................................................................ 16,645 15,488 Other unsecured personal lending ....................................................................................................... 41,214 35,545
207,766 194,149
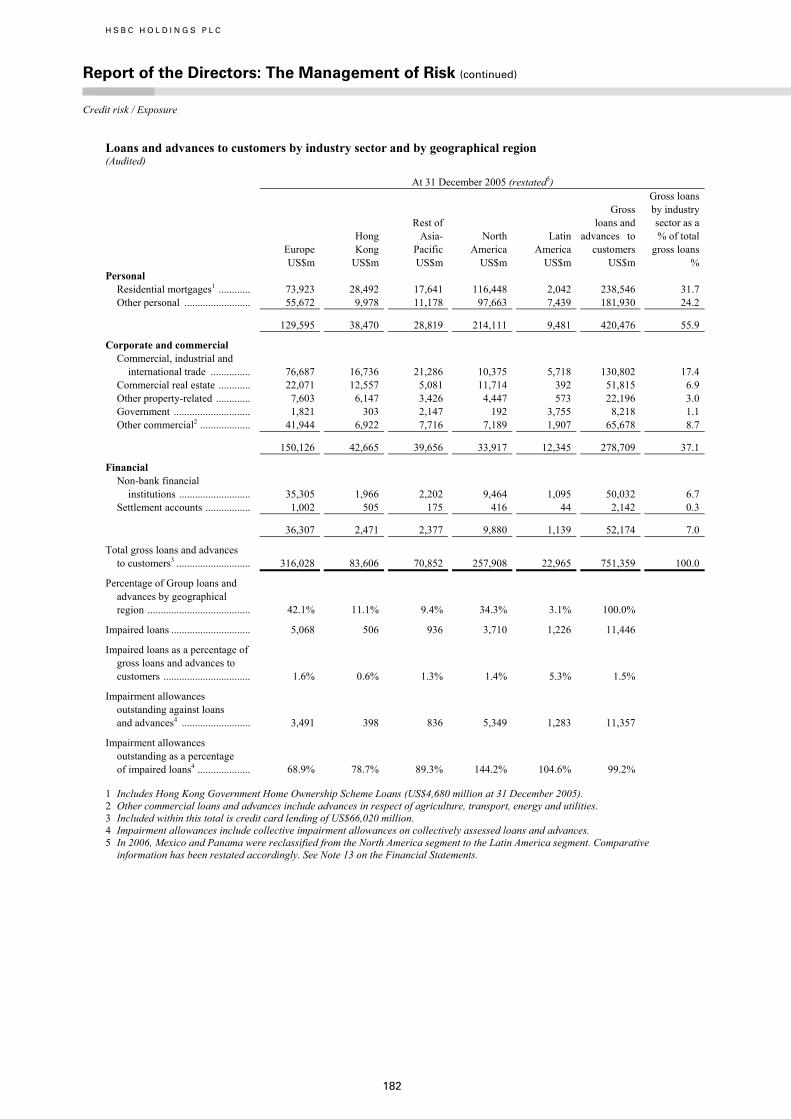
H S B C H O L D I N G S P L C
Report of the Directors: The Management of Risk (continued) Credit risk / Exposure
182
Loans and advances to customers by industry sector and by geographical region (Audited)
At 31 December 2005 (restated5)
Europe Hong Kong
Rest of Asia- Pacific
North America
Latin America
Gross loans and advances to customers
Gross loans by industry sector as a % of total gross loans
US$m US$m US$m US$m US$m US$m % Personal
Residential mortgages1 ............ 73,923 28,492 17,641 116,448 2,042 238,546 31.7 Other personal ......................... 55,672 9,978 11,178 97,663 7,439 181,930 24.2
129,595 38,470 28,819 214,111 9,481 420,476 55.9
Corporate and commercial Commercial, industrial and
international trade ............... 76,687 16,736 21,286 10,375 5,718 130,802 17.4 Commercial real estate ............ 22,071 12,557 5,081 11,714 392 51,815 6.9 Other property-related ............. 7,603 6,147 3,426 4,447 573 22,196 3.0 Government ............................. 1,821 303 2,147 192 3,755 8,218 1.1 Other commercial2 ................... 41,944 6,922 7,716 7,189 1,907 65,678 8.7
150,126 42,665 39,656 33,917 12,345 278,709 37.1
Financial Non-bank financial
institutions ........................... 35,305 1,966 2,202 9,464 1,095 50,032 6.7 Settlement accounts ................. 1,002 505 175 416 44 2,142 0.3
36,307 2,471 2,377 9,880 1,139 52,174 7.0
Total gross loans and advances to customers3 ............................ 316,028 83,606 70,852 257,908 22,965 751,359 100.0
Percentage of Group loans and advances by geographical region ....................................... 42.1% 11.1% 9.4% 34.3% 3.1% 100.0%
Impaired loans .............................. 5,068 506 936 3,710 1,226 11,446
Impaired loans as a percentage of gross loans and advances to customers ................................. 1.6% 0.6% 1.3% 1.4% 5.3% 1.5%
Impairment allowances outstanding against loans and advances4 .......................... 3,491 398 836 5,349 1,283 11,357
Impairment allowances outstanding as a percentage of impaired loans4 .................... 68.9% 78.7% 89.3% 144.2% 104.6% 99.2%
1 Includes Hong Kong Government Home Ownership Scheme Loans (US$4,680 million at 31 December 2005). 2 Other commercial loans and advances include advances in respect of agriculture, transport, energy and utilities. 3 Included within this total is credit card lending of US$66,020 million. 4 Impairment allowances include collective impairment allowances on collectively assessed loans and advances. 5 In 2006, Mexico and Panama were reclassified from the North America segment to the Latin America segment. Comparative
information has been restated accordingly. See Note 13 on the Financial Statements.
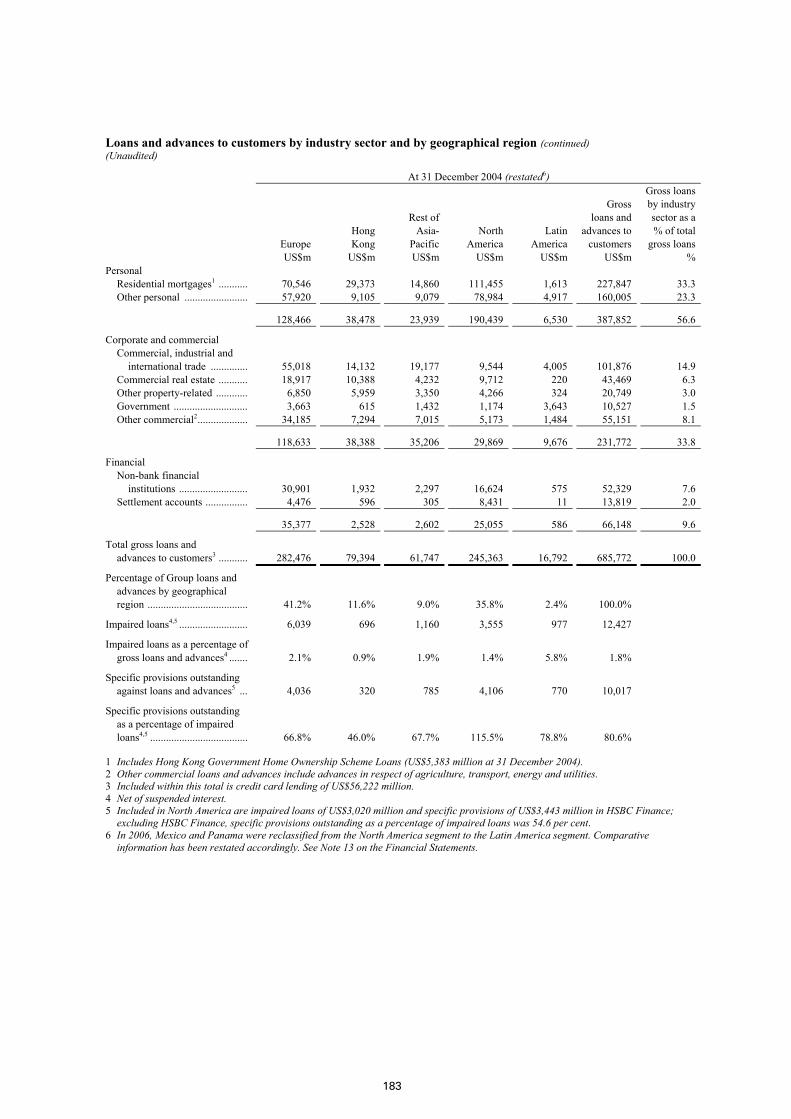
183
Loans and advances to customers by industry sector and by geographical region (continued) (Unaudited)
At 31 December 2004 (restated6)
Europe Hong Kong
Rest ofAsia-
Pacific North
America Latin
America
Gross loans and
advances to customers
Gross loans by industry sector as a % of total gross loans
US$m US$m US$m US$m US$m US$m % Personal
Residential mortgages1 ........... 70,546 29,373 14,860 111,455 1,613 227,847 33.3 Other personal ........................ 57,920 9,105 9,079 78,984 4,917 160,005 23.3
128,466 38,478 23,939 190,439 6,530 387,852 56.6
Corporate and commercial Commercial, industrial and
international trade .............. 55,018 14,132 19,177 9,544 4,005 101,876 14.9 Commercial real estate ........... 18,917 10,388 4,232 9,712 220 43,469 6.3 Other property-related ............ 6,850 5,959 3,350 4,266 324 20,749 3.0 Government ............................ 3,663 615 1,432 1,174 3,643 10,527 1.5 Other commercial2................... 34,185 7,294 7,015 5,173 1,484 55,151 8.1
118,633 38,388 35,206 29,869 9,676 231,772 33.8
Financial Non-bank financial
institutions .......................... 30,901 1,932 2,297 16,624 575 52,329 7.6 Settlement accounts ................ 4,476 596 305 8,431 11 13,819 2.0
35,377 2,528 2,602 25,055 586 66,148 9.6
Total gross loans and advances to customers3 ........... 282,476 79,394 61,747 245,363 16,792 685,772 100.0
Percentage of Group loans and advances by geographical region ...................................... 41.2% 11.6% 9.0% 35.8% 2.4% 100.0%
Impaired loans4,5 .......................... 6,039 696 1,160 3,555 977 12,427
Impaired loans as a percentage of gross loans and advances4 ....... 2.1% 0.9% 1.9% 1.4% 5.8% 1.8%
Specific provisions outstanding against loans and advances5 ... 4,036 320 785 4,106 770 10,017
Specific provisions outstanding as a percentage of impaired loans4,5 ..................................... 66.8% 46.0% 67.7% 115.5% 78.8% 80.6%
1 Includes Hong Kong Government Home Ownership Scheme Loans (US$5,383 million at 31 December 2004). 2 Other commercial loans and advances include advances in respect of agriculture, transport, energy and utilities. 3 Included within this total is credit card lending of US$56,222 million. 4 Net of suspended interest. 5 Included in North America are impaired loans of US$3,020 million and specific provisions of US$3,443 million in HSBC Finance;
excluding HSBC Finance, specific provisions outstanding as a percentage of impaired loans was 54.6 per cent. 6 In 2006, Mexico and Panama were reclassified from the North America segment to the Latin America segment. Comparative
information has been restated accordingly. See Note 13 on the Financial Statements.
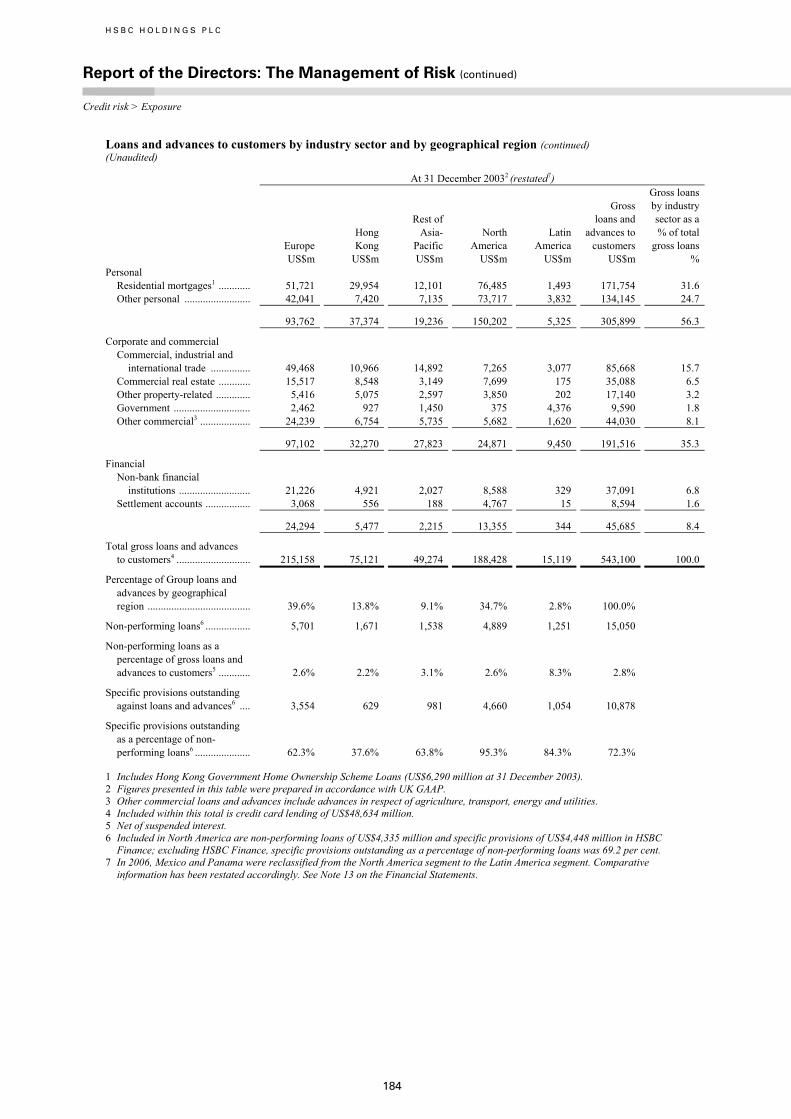
H S B C H O L D I N G S P L C
Report of the Directors: The Management of Risk (continued) Credit risk > Exposure
184
Loans and advances to customers by industry sector and by geographical region (continued) (Unaudited)
At 31 December 20032 (restated7)
Europe Hong Kong
Rest of Asia- Pacific
North America
Latin America
Gross loans and advances to customers
Gross loans by industry sector as a % of total gross loans
US$m US$m US$m US$m US$m US$m % Personal
Residential mortgages1 ............ 51,721 29,954 12,101 76,485 1,493 171,754 31.6 Other personal ......................... 42,041 7,420 7,135 73,717 3,832 134,145 24.7
93,762 37,374 19,236 150,202 5,325 305,899 56.3
Corporate and commercial Commercial, industrial and
international trade ............... 49,468 10,966 14,892 7,265 3,077 85,668 15.7 Commercial real estate ............ 15,517 8,548 3,149 7,699 175 35,088 6.5 Other property-related ............. 5,416 5,075 2,597 3,850 202 17,140 3.2 Government ............................. 2,462 927 1,450 375 4,376 9,590 1.8 Other commercial3 ................... 24,239 6,754 5,735 5,682 1,620 44,030 8.1
97,102 32,270 27,823 24,871 9,450 191,516 35.3
Financial Non-bank financial
institutions ........................... 21,226 4,921 2,027 8,588 329 37,091 6.8 Settlement accounts ................. 3,068 556 188 4,767 15 8,594 1.6
24,294 5,477 2,215 13,355 344 45,685 8.4
Total gross loans and advances to customers4 ............................ 215,158 75,121 49,274 188,428 15,119 543,100 100.0
Percentage of Group loans and advances by geographical region ....................................... 39.6% 13.8% 9.1% 34.7% 2.8% 100.0%
Non-performing loans6 ................. 5,701 1,671 1,538 4,889 1,251 15,050
Non-performing loans as a percentage of gross loans and advances to customers5 ............ 2.6% 2.2% 3.1% 2.6% 8.3% 2.8%
Specific provisions outstanding against loans and advances6 .... 3,554 629 981 4,660 1,054 10,878
Specific provisions outstanding as a percentage of non-performing loans6 ..................... 62.3% 37.6% 63.8% 95.3% 84.3% 72.3%
1 Includes Hong Kong Government Home Ownership Scheme Loans (US$6,290 million at 31 December 2003). 2 Figures presented in this table were prepared in accordance with UK GAAP. 3 Other commercial loans and advances include advances in respect of agriculture, transport, energy and utilities. 4 Included within this total is credit card lending of US$48,634 million. 5 Net of suspended interest. 6 Included in North America are non-performing loans of US$4,335 million and specific provisions of US$4,448 million in HSBC
Finance; excluding HSBC Finance, specific provisions outstanding as a percentage of non-performing loans was 69.2 per cent. 7 In 2006, Mexico and Panama were reclassified from the North America segment to the Latin America segment. Comparative
information has been restated accordingly. See Note 13 on the Financial Statements.
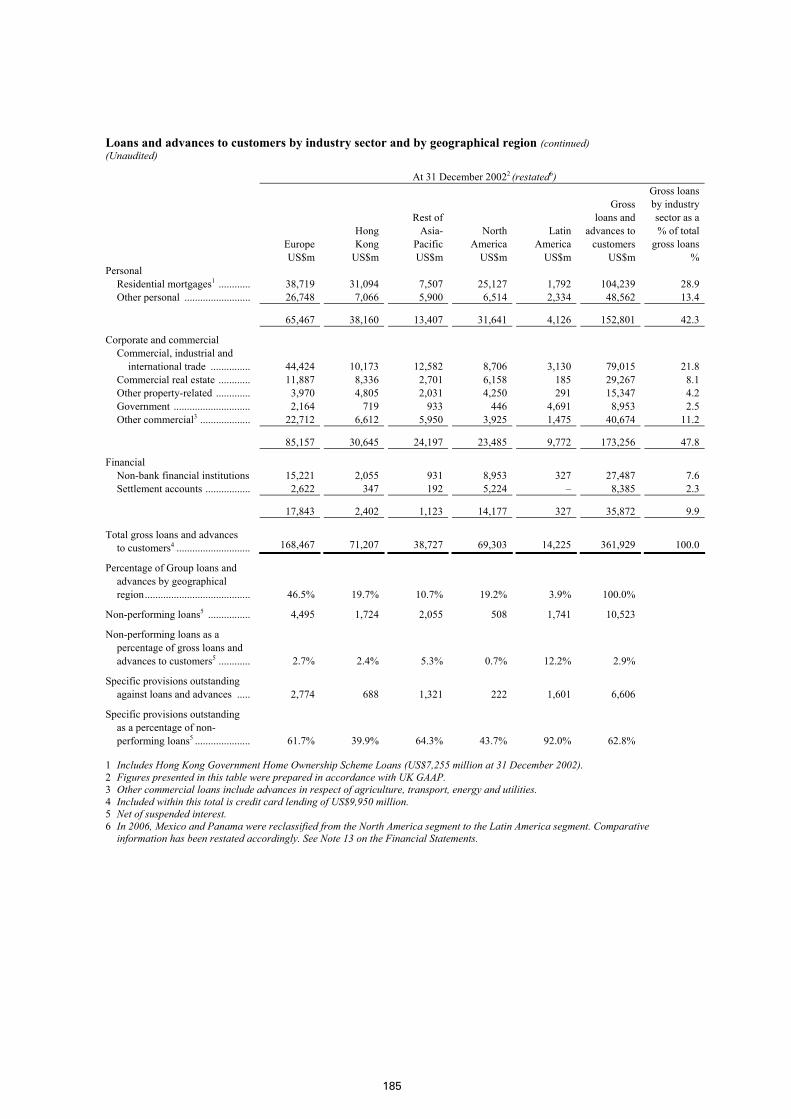
185
Loans and advances to customers by industry sector and by geographical region (continued) (Unaudited)
At 31 December 20022 (restated6)
Europe Hong Kong
Rest of Asia- Pacific
North America
Latin America
Gross loans and advances to customers
Gross loans by industry sector as a % of total gross loans
US$m US$m US$m US$m US$m US$m % Personal
Residential mortgages1 ............ 38,719 31,094 7,507 25,127 1,792 104,239 28.9 Other personal ......................... 26,748 7,066 5,900 6,514 2,334 48,562 13.4
65,467 38,160 13,407 31,641 4,126 152,801 42.3
Corporate and commercial Commercial, industrial and
international trade ...............
44,424 10,173 12,582 8,706 3,130 79,015 21.8 Commercial real estate ............ 11,887 8,336 2,701 6,158 185 29,267 8.1 Other property-related ............. 3,970 4,805 2,031 4,250 291 15,347 4.2 Government ............................. 2,164 719 933 446 4,691 8,953 2.5 Other commercial3 ................... 22,712 6,612 5,950 3,925 1,475 40,674 11.2
85,157 30,645 24,197 23,485 9,772 173,256 47.8
Financial Non-bank financial institutions 15,221 2,055 931 8,953 327 27,487 7.6 Settlement accounts ................. 2,622 347 192 5,224 – 8,385 2.3
17,843 2,402 1,123 14,177 327 35,872 9.9
Total gross loans and advances to customers4 ............................
168,467 71,207 38,727 69,303 14,225
361,929 100.0
Percentage of Group loans and advances by geographical region........................................ 46.5% 19.7% 10.7% 19.2% 3.9% 100.0%
Non-performing loans5 ................ 4,495 1,724 2,055 508 1,741 10,523
Non-performing loans as a percentage of gross loans and advances to customers5 ............ 2.7% 2.4% 5.3% 0.7% 12.2% 2.9%
Specific provisions outstanding against loans and advances ..... 2,774 688 1,321 222 1,601 6,606
Specific provisions outstanding as a percentage of non-performing loans5 ..................... 61.7% 39.9% 64.3% 43.7% 92.0% 62.8%
1 Includes Hong Kong Government Home Ownership Scheme Loans (US$7,255 million at 31 December 2002). 2 Figures presented in this table were prepared in accordance with UK GAAP. 3 Other commercial loans include advances in respect of agriculture, transport, energy and utilities. 4 Included within this total is credit card lending of US$9,950 million. 5 Net of suspended interest. 6 In 2006, Mexico and Panama were reclassified from the North America segment to the Latin America segment. Comparative
information has been restated accordingly. See Note 13 on the Financial Statements.
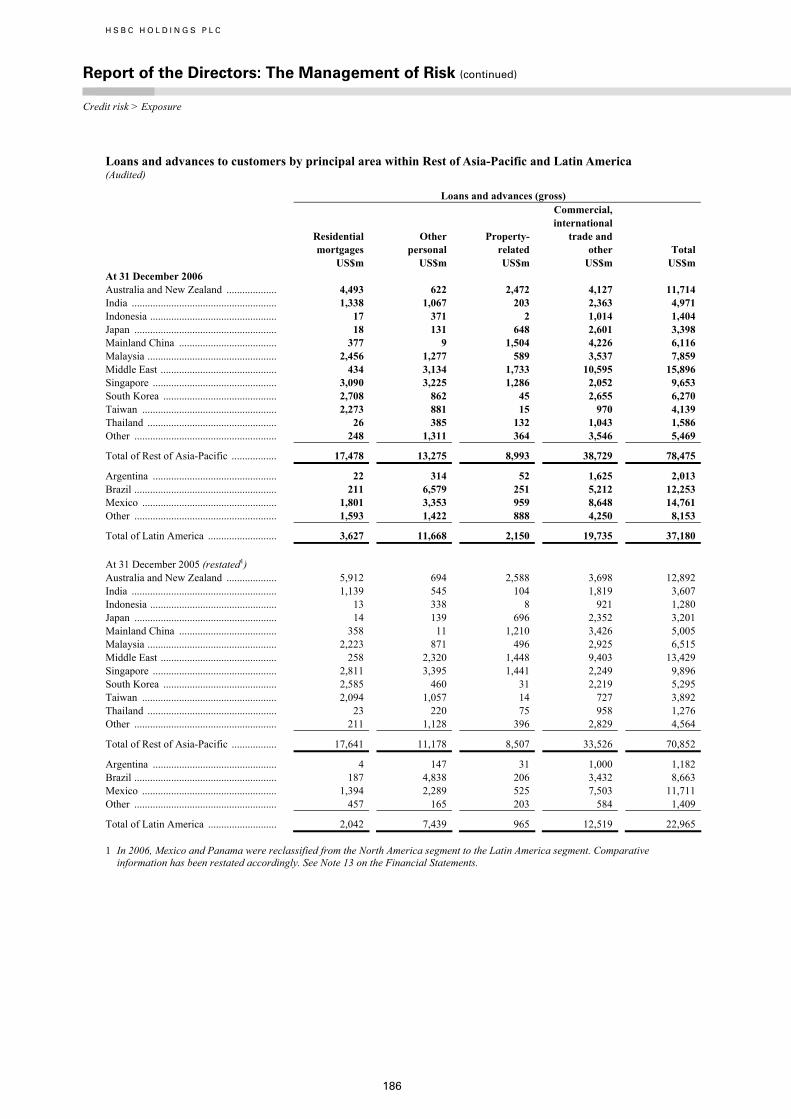
H S B C H O L D I N G S P L C
Report of the Directors: The Management of Risk (continued) Credit risk > Exposure
186
Loans and advances to customers by principal area within Rest of Asia-Pacific and Latin America (Audited)
Loans and advances (gross)
Residential mortgages US$m
Other personal US$m
Property- related US$m
Commercial, international trade and other US$m
Total US$m
At 31 December 2006 Australia and New Zealand ................... 4,493 622 2,472 4,127 11,714 India ....................................................... 1,338 1,067 203 2,363 4,971 Indonesia ................................................ 17 371 2 1,014 1,404 Japan ...................................................... 18 131 648 2,601 3,398 Mainland China ..................................... 377 9 1,504 4,226 6,116 Malaysia ................................................. 2,456 1,277 589 3,537 7,859 Middle East ............................................ 434 3,134 1,733 10,595 15,896 Singapore ............................................... 3,090 3,225 1,286 2,052 9,653 South Korea ........................................... 2,708 862 45 2,655 6,270 Taiwan ................................................... 2,273 881 15 970 4,139 Thailand ................................................. 26 385 132 1,043 1,586 Other ...................................................... 248 1,311 364 3,546 5,469
Total of Rest of Asia-Pacific ................. 17,478 13,275 8,993 38,729 78,475
Argentina ............................................... 22 314 52 1,625 2,013 Brazil ...................................................... 211 6,579 251 5,212 12,253 Mexico ................................................... 1,801 3,353 959 8,648 14,761 Other ...................................................... 1,593 1,422 888 4,250 8,153
Total of Latin America .......................... 3,627 11,668 2,150 19,735 37,180 At 31 December 2005 (restated1) Australia and New Zealand ................... 5,912 694 2,588 3,698 12,892 India ....................................................... 1,139 545 104 1,819 3,607 Indonesia ................................................ 13 338 8 921 1,280 Japan ...................................................... 14 139 696 2,352 3,201 Mainland China ..................................... 358 11 1,210 3,426 5,005 Malaysia ................................................. 2,223 871 496 2,925 6,515 Middle East ............................................ 258 2,320 1,448 9,403 13,429 Singapore ............................................... 2,811 3,395 1,441 2,249 9,896 South Korea ........................................... 2,585 460 31 2,219 5,295 Taiwan ................................................... 2,094 1,057 14 727 3,892 Thailand ................................................. 23 220 75 958 1,276 Other ...................................................... 211 1,128 396 2,829 4,564
Total of Rest of Asia-Pacific ................. 17,641 11,178 8,507 33,526 70,852
Argentina ............................................... 4 147 31 1,000 1,182 Brazil ...................................................... 187 4,838 206 3,432 8,663 Mexico ................................................... 1,394 2,289 525 7,503 11,711 Other ...................................................... 457 165 203 584 1,409
Total of Latin America .......................... 2,042 7,439 965 12,519 22,965
1 In 2006, Mexico and Panama were reclassified from the North America segment to the Latin America segment. Comparative information has been restated accordingly. See Note 13 on the Financial Statements.
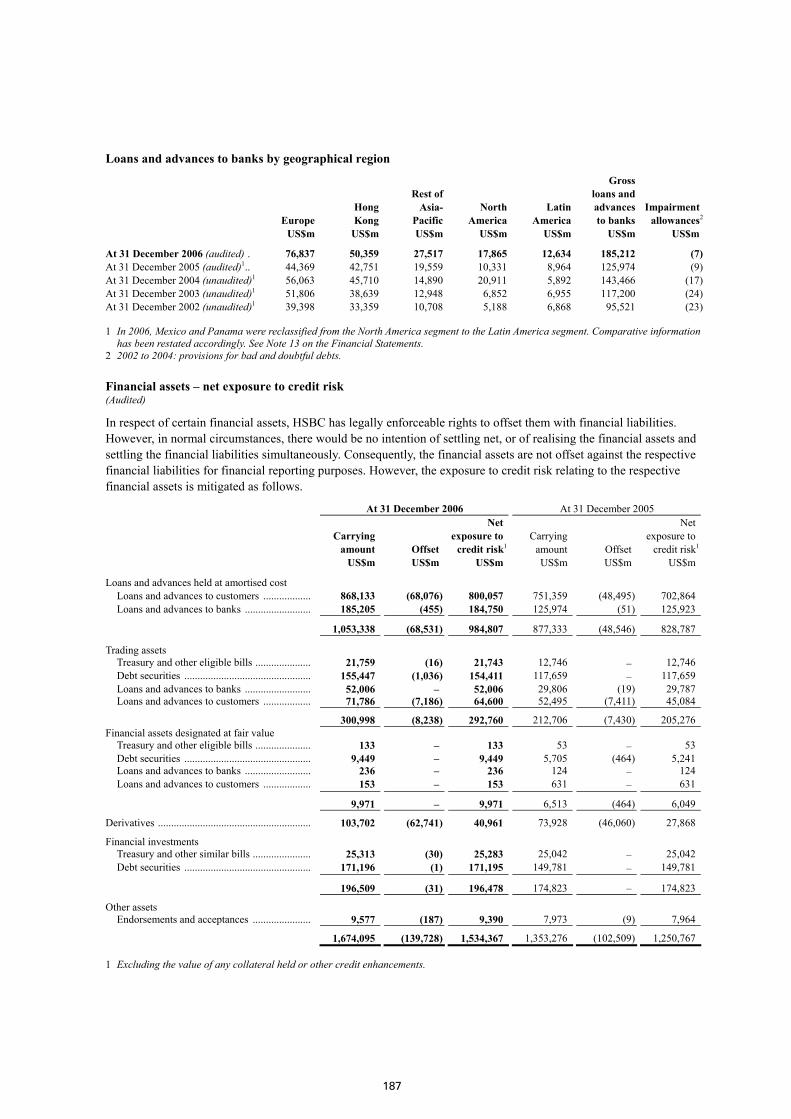
187
Loans and advances to banks by geographical region
Europe Hong Kong
Rest of Asia- Pacific
North America
Latin America
Gross loans and advances to banks
Impairment allowances2
US$m US$m US$m US$m US$m US$m US$m
At 31 December 2006 (audited) . 76,837 50,359 27,517 17,865 12,634 185,212 (7)At 31 December 2005 (audited)1.. 44,369 42,751 19,559 10,331 8,964 125,974 (9)At 31 December 2004 (unaudited)1 56,063 45,710 14,890 20,911 5,892 143,466 (17)At 31 December 2003 (unaudited)1 51,806 38,639 12,948 6,852 6,955 117,200 (24)At 31 December 2002 (unaudited)1 39,398 33,359 10,708 5,188 6,868 95,521 (23)
1 In 2006, Mexico and Panama were reclassified from the North America segment to the Latin America segment. Comparative information has been restated accordingly. See Note 13 on the Financial Statements.
2 2002 to 2004: provisions for bad and doubtful debts.
Financial assets – net exposure to credit risk (Audited)
In respect of certain financial assets, HSBC has legally enforceable rights to offset them with financial liabilities. However, in normal circumstances, there would be no intention of settling net, or of realising the financial assets and settling the financial liabilities simultaneously. Consequently, the financial assets are not offset against the respective financial liabilities for financial reporting purposes. However, the exposure to credit risk relating to the respective financial assets is mitigated as follows.
At 31 December 2006 At 31 December 2005
Carrying amount Offset
Net exposure to credit risk1
Carrying amount Offset
Net exposure to credit risk1
US$m US$m US$m US$m US$m US$m
Loans and advances held at amortised cost Loans and advances to customers .................. 868,133 (68,076) 800,057 751,359 (48,495) 702,864 Loans and advances to banks ......................... 185,205 (455) 184,750 125,974 (51) 125,923
1,053,338 (68,531) 984,807 877,333 (48,546) 828,787 Trading assets
Treasury and other eligible bills ..................... 21,759 (16) 21,743 12,746 – 12,746 Debt securities ................................................ 155,447 (1,036) 154,411 117,659 – 117,659 Loans and advances to banks ......................... 52,006 – 52,006 29,806 (19) 29,787 Loans and advances to customers .................. 71,786 (7,186) 64,600 52,495 (7,411) 45,084
300,998 (8,238) 292,760 212,706 (7,430) 205,276 Financial assets designated at fair value
Treasury and other eligible bills ..................... 133 – 133 53 – 53 Debt securities ................................................ 9,449 – 9,449 5,705 (464) 5,241 Loans and advances to banks ......................... 236 – 236 124 – 124 Loans and advances to customers .................. 153 – 153 631 – 631
9,971 – 9,971 6,513 (464) 6,049
Derivatives .......................................................... 103,702 (62,741) 40,961 73,928 (46,060) 27,868
Financial investments Treasury and other similar bills ...................... 25,313 (30) 25,283 25,042 – 25,042 Debt securities ................................................ 171,196 (1) 171,195 149,781 – 149,781
196,509 (31) 196,478 174,823 – 174,823
Other assets Endorsements and acceptances ...................... 9,577 (187) 9,390 7,973 (9) 7,964
1,674,095 (139,728) 1,534,367 1,353,276 (102,509) 1,250,767
1 Excluding the value of any collateral held or other credit enhancements.
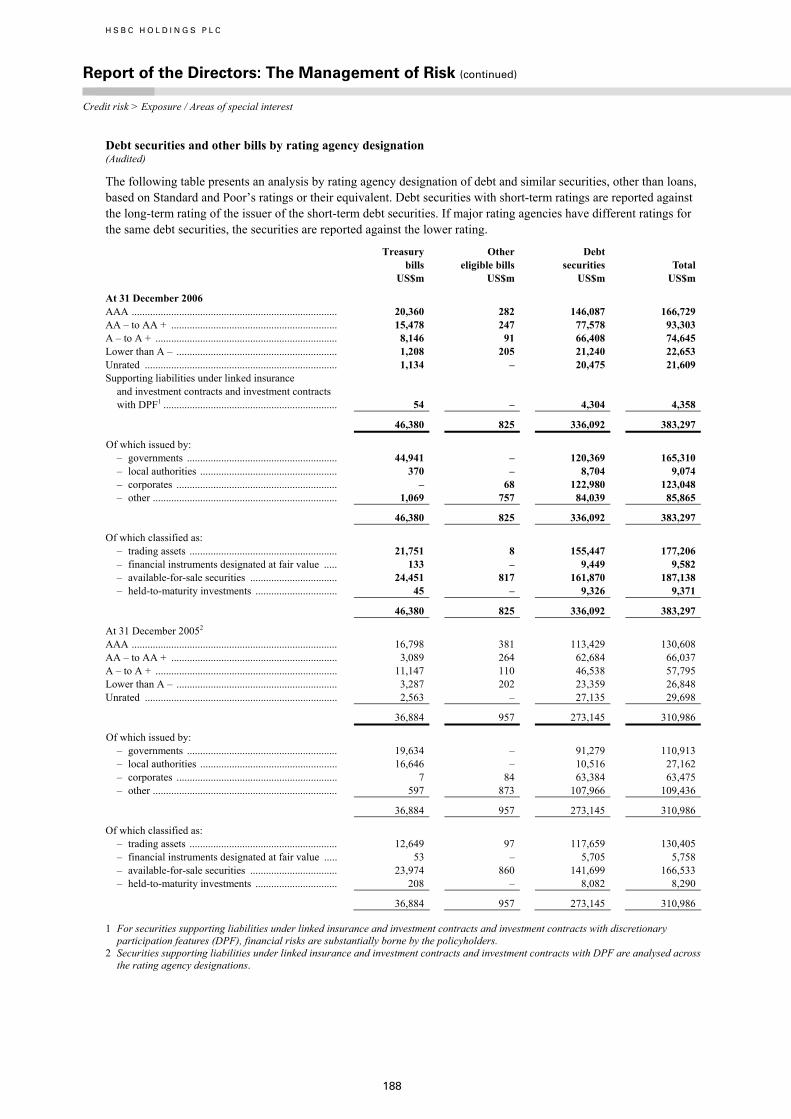
H S B C H O L D I N G S P L C
Report of the Directors: The Management of Risk (continued) Credit risk > Exposure / Areas of special interest
188
Debt securities and other bills by rating agency designation (Audited)
The following table presents an analysis by rating agency designation of debt and similar securities, other than loans, based on Standard and Poor’s ratings or their equivalent. Debt securities with short-term ratings are reported against the long-term rating of the issuer of the short-term debt securities. If major rating agencies have different ratings for the same debt securities, the securities are reported against the lower rating.
Treasury bills
Other eligible bills
Debt securities Total
US$m US$m US$m US$m
At 31 December 2006 AAA .............................................................................. 20,360 282 146,087 166,729 AA – to AA + ............................................................... 15,478 247 77,578 93,303 A – to A + ..................................................................... 8,146 91 66,408 74,645 Lower than A – ............................................................. 1,208 205 21,240 22,653 Unrated ......................................................................... 1,134 – 20,475 21,609 Supporting liabilities under linked insurance
and investment contracts and investment contracts with DPF1 .................................................................. 54 – 4,304 4,358
46,380 825 336,092 383,297
Of which issued by: – governments ......................................................... 44,941 – 120,369 165,310 – local authorities .................................................... 370 – 8,704 9,074 – corporates ............................................................. – 68 122,980 123,048 – other ...................................................................... 1,069 757 84,039 85,865
46,380 825 336,092 383,297
Of which classified as: – trading assets ........................................................ 21,751 8 155,447 177,206 – financial instruments designated at fair value ..... 133 – 9,449 9,582 – available-for-sale securities ................................. 24,451 817 161,870 187,138 – held-to-maturity investments ............................... 45 – 9,326 9,371
46,380 825 336,092 383,297
At 31 December 20052 AAA .............................................................................. 16,798 381 113,429 130,608 AA – to AA + ............................................................... 3,089 264 62,684 66,037 A – to A + ..................................................................... 11,147 110 46,538 57,795 Lower than A – ............................................................. 3,287 202 23,359 26,848 Unrated ......................................................................... 2,563 – 27,135 29,698
36,884 957 273,145 310,986
Of which issued by: – governments ......................................................... 19,634 – 91,279 110,913 – local authorities .................................................... 16,646 – 10,516 27,162 – corporates ............................................................. 7 84 63,384 63,475 – other ...................................................................... 597 873 107,966 109,436
36,884 957 273,145 310,986
Of which classified as: – trading assets ........................................................ 12,649 97 117,659 130,405 – financial instruments designated at fair value ..... 53 – 5,705 5,758 – available-for-sale securities ................................. 23,974 860 141,699 166,533 – held-to-maturity investments ............................... 208 – 8,082 8,290
36,884 957 273,145 310,986
1 For securities supporting liabilities under linked insurance and investment contracts and investment contracts with discretionary participation features (DPF), financial risks are substantially borne by the policyholders.
2 Securities supporting liabilities under linked insurance and investment contracts and investment contracts with DPF are analysed across the rating agency designations.
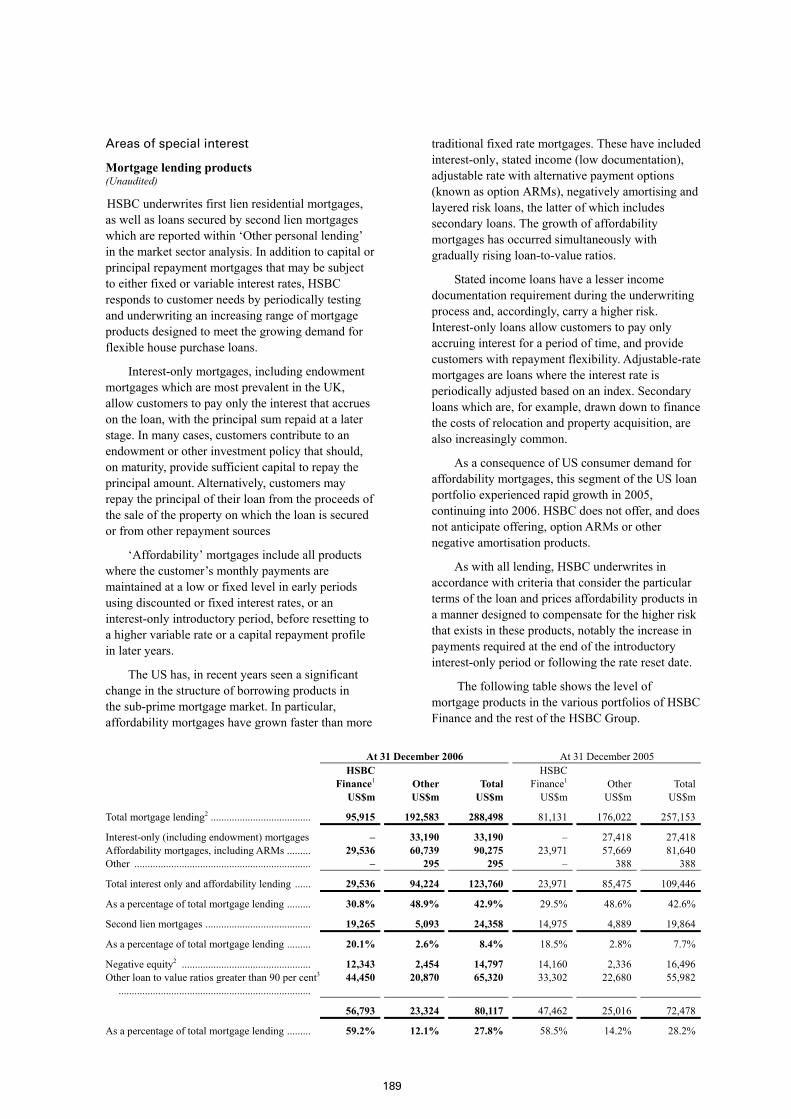
189
Areas of special interest
Mortgage lending products (Unaudited)
HSBC underwrites first lien residential mortgages, as well as loans secured by second lien mortgages which are reported within ‘Other personal lending’ in the market sector analysis. In addition to capital or principal repayment mortgages that may be subject to either fixed or variable interest rates, HSBC responds to customer needs by periodically testing and underwriting an increasing range of mortgage products designed to meet the growing demand for flexible house purchase loans.
Interest-only mortgages, including endowment mortgages which are most prevalent in the UK, allow customers to pay only the interest that accrues on the loan, with the principal sum repaid at a later stage. In many cases, customers contribute to an endowment or other investment policy that should, on maturity, provide sufficient capital to repay the principal amount. Alternatively, customers may repay the principal of their loan from the proceeds of the sale of the property on which the loan is secured or from other repayment sources
‘Affordability’ mortgages include all products where the customer’s monthly payments are maintained at a low or fixed level in early periods using discounted or fixed interest rates, or an interest-only introductory period, before resetting to a higher variable rate or a capital repayment profile in later years.
The US has, in recent years seen a significant change in the structure of borrowing products in the sub-prime mortgage market. In particular, affordability mortgages have grown faster than more
traditional fixed rate mortgages. These have included interest-only, stated income (low documentation), adjustable rate with alternative payment options (known as option ARMs), negatively amortising and layered risk loans, the latter of which includes secondary loans. The growth of affordability mortgages has occurred simultaneously with gradually rising loan-to-value ratios.
Stated income loans have a lesser income documentation requirement during the underwriting process and, accordingly, carry a higher risk. Interest-only loans allow customers to pay only accruing interest for a period of time, and provide customers with repayment flexibility. Adjustable-rate mortgages are loans where the interest rate is periodically adjusted based on an index. Secondary loans which are, for example, drawn down to finance the costs of relocation and property acquisition, are also increasingly common.
As a consequence of US consumer demand for affordability mortgages, this segment of the US loan portfolio experienced rapid growth in 2005, continuing into 2006. HSBC does not offer, and does not anticipate offering, option ARMs or other negative amortisation products.
As with all lending, HSBC underwrites in accordance with criteria that consider the particular terms of the loan and prices affordability products in a manner designed to compensate for the higher risk that exists in these products, notably the increase in payments required at the end of the introductory interest-only period or following the rate reset date.
The following table shows the level of mortgage products in the various portfolios of HSBC Finance and the rest of the HSBC Group.
At 31 December 2006 At 31 December 2005 HSBC
Finance1 Other Total HSBC Finance1 Other Total
US$m US$m US$m US$m US$m US$m
Total mortgage lending2 ...................................... 95,915 192,583 288,498 81,131 176,022 257,153
Interest-only (including endowment) mortgages – 33,190 33,190 – 27,418 27,418 Affordability mortgages, including ARMs ......... 29,536 60,739 90,275 23,971 57,669 81,640 Other ................................................................... – 295 295 – 388 388
Total interest only and affordability lending ...... 29,536 94,224 123,760 23,971 85,475 109,446
As a percentage of total mortgage lending ......... 30.8% 48.9% 42.9% 29.5% 48.6% 42.6%
Second lien mortgages ........................................ 19,265 5,093 24,358 14,975 4,889 19,864
As a percentage of total mortgage lending ......... 20.1% 2.6% 8.4% 18.5% 2.8% 7.7%
Negative equity2 ................................................. 12,343 2,454 14,797 14,160 2,336 16,496 Other loan to value ratios greater than 90 per cent3
......................................................................... 44,450 20,870 65,320 33,302 22,680 55,982
56,793 23,324 80,117 47,462 25,016 72,478
As a percentage of total mortgage lending ......... 59.2% 12.1% 27.8% 58.5% 14.2% 28.2%
H S B C H O L D I N G S P L C
Report of the Directors: The Management of Risk (continued) Credit risk > Areas of special interest / Cross-border distribution
190
1 HSBC Finance includes lending in Canada and the UK and excludes loans transferred to HSBC USA Inc. 2 Total mortgage lending includes residential mortgages and second lien mortgage lending included within ‘Other personal lending’. 3 Loan to value ratios are generally based on values at origination date.
Mortgage lending in the US (Unaudited)
Mortgage lending in the US includes loans and advances to customers with a first lien interest over a property. These balances are secured and are reported within residential mortgages. Loans with only a second lien are reported in other personal lending. The commentary that follows discusses both residential mortgages and second lien loans included within other personal lending.
HSBC continues to monitor a range of trends affecting the US mortgage lending industry. Housing markets in a large part of the US have been affected by a general slowing in the rate of appreciation in property values, or an actual decline in some markets, while the period of time properties remain unsold has increased. In addition, the ability of some borrowers to service their adjustable-rate mortgages (‘ARM’s) has been compromised as interest rates have risen, increasing the amounts payable on their loans as prices reset higher under their contracts. The effect of interest rate adjustments on first mortgages are also estimated to have had a direct impact on borrowers’ ability to repay any additional second lien mortgages taken out on the same properties. Similarly, as interest-only mortgages leave the interest-only payment period, rising payment obligations are expected to strain the ability of borrowers to make the increased payments. Studies published in the US, and HSBC’s own experience, indicate that mortgages originated throughout the industry in 2005 and 2006 are performing worse than loans originated in prior periods.
The effects of these recent trends have been concentrated in the mortgage services business (‘mortgage services’), which purchases first and second lien mortgages from a network of over 220 third party lenders. As detailed in the table below, this business has approximately US$49.5 billion of loans and advances to personal customers, 10.4 per cent of the Group’s gross loans and advances to personal customers.
In 2005 and continuing into the first six months of 2006, second lien mortgage loans in mortgage services increased significantly as a percentage of total loans acquired compared with prior periods. During the second quarter of 2006 HSBC began to experience deterioration in the credit performance of mortgages acquired in 2005 by mortgage services in the second lien and portions of the first lien portfolios. The deterioration continued in the third
quarter of 2006 and began to affect second and first lien loans acquired in that year. Further deterioration in the fourth quarter of 2006 was largely in the first lien adjustable-rate and second lien portfolios. HSBC also determined that a significant number of its second lien customers have underlying adjustable-rate first mortgages that face repricing in the near-term which, based on experience, are estimated to adversely affect the probability of repayment on the related second lien mortgage. As numerous interest rate rises have occurred as credit has tightened and there has been either a slowdown in the rate of appreciation of properties or a decline in their value, it is estimated that the probability of default on adjustable-rate first mortgages subject to repricing, and on any second lien mortgage loans that are subordinate to adjustable-rate first liens, is greater than has been experienced in the past. As a result, loan impairment charges relating to the mortgage services portfolio have increased significantly.
Accordingly, while overall credit performance, as measured by delinquency and write-off rates, has performed broadly in line with industry trends across other parts of the US mortgage portfolio, higher delinquency and losses have been reported in mortgage services, largely in the aforementioned loans originated in 2005 and 2006. A number of steps have been taken to mitigate risk in the affected parts of the portfolio. These include enhanced segmentation and analytics to identify the higher risk portions of the portfolio, and increased collections capacity. HSBC is restructuring or modifying loans in accordance with defined policies if it believes that customers will continue to pay the restructured or modified loan. Also, customers who have adjustable-rate mortgage loans nearing the first reset, and who are expected to be the most affected by a rate adjustment, are being contacted in order to assess their ability to make the higher payment and, as appropriate, refinance or modify their loans. Furthermore, HSBC has slowed growth in this portion of the portfolio by implementing repricing initiatives in selected segments of the originated loans and tightening underwriting criteria, especially for second lien, stated income (low documentation) and other higher risk segments. These actions, combined with normal attrition, resulted in a net reduction in loans and advances in mortgage services during the second half of 2006. It is expected that this portfolio will remain under pressure as the loans originated in 2005 and 2006 season. It is also expected that this portfolio will run off faster than in
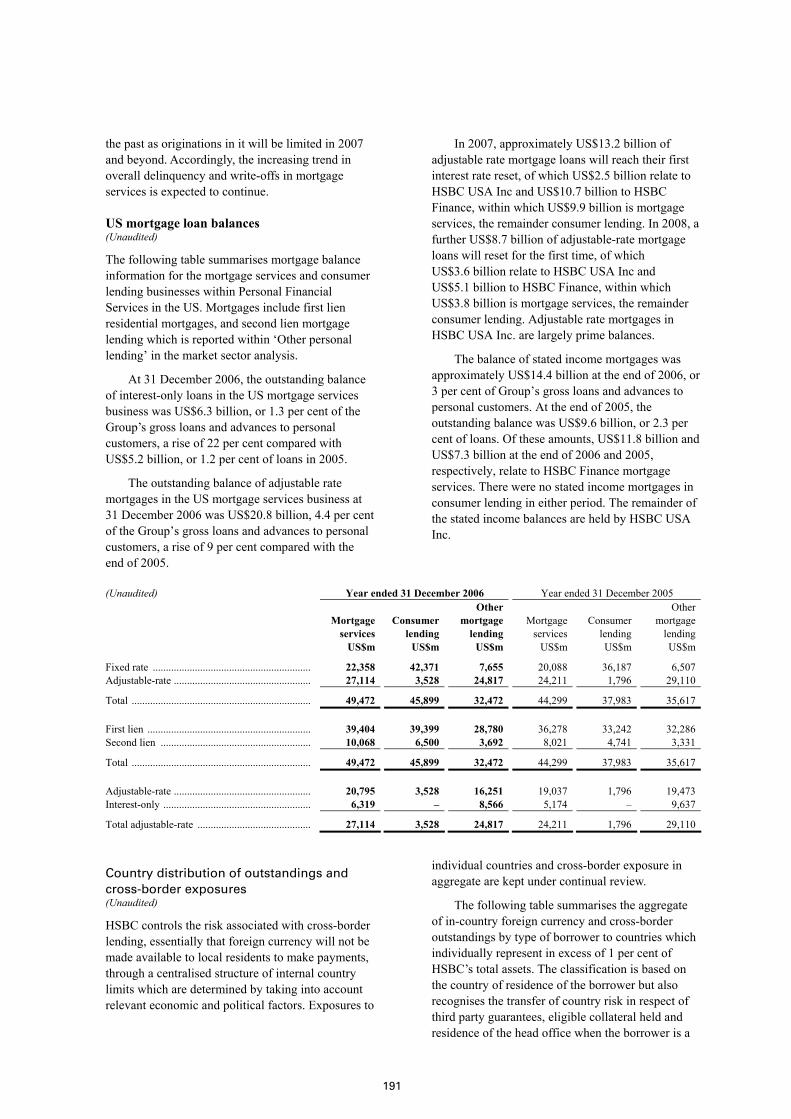
191
the past as originations in it will be limited in 2007 and beyond. Accordingly, the increasing trend in overall delinquency and write-offs in mortgage services is expected to continue.
US mortgage loan balances (Unaudited)
The following table summarises mortgage balance information for the mortgage services and consumer lending businesses within Personal Financial Services in the US. Mortgages include first lien residential mortgages, and second lien mortgage lending which is reported within ‘Other personal lending’ in the market sector analysis.
At 31 December 2006, the outstanding balance of interest-only loans in the US mortgage services business was US$6.3 billion, or 1.3 per cent of the Group’s gross loans and advances to personal customers, a rise of 22 per cent compared with US$5.2 billion, or 1.2 per cent of loans in 2005.
The outstanding balance of adjustable rate mortgages in the US mortgage services business at 31 December 2006 was US$20.8 billion, 4.4 per cent of the Group’s gross loans and advances to personal customers, a rise of 9 per cent compared with the end of 2005.
In 2007, approximately US$13.2 billion of adjustable rate mortgage loans will reach their first interest rate reset, of which US$2.5 billion relate to HSBC USA Inc and US$10.7 billion to HSBC Finance, within which US$9.9 billion is mortgage services, the remainder consumer lending. In 2008, a further US$8.7 billion of adjustable-rate mortgage loans will reset for the first time, of which US$3.6 billion relate to HSBC USA Inc and US$5.1 billion to HSBC Finance, within which US$3.8 billion is mortgage services, the remainder consumer lending. Adjustable rate mortgages in HSBC USA Inc. are largely prime balances.
The balance of stated income mortgages was approximately US$14.4 billion at the end of 2006, or 3 per cent of Group’s gross loans and advances to personal customers. At the end of 2005, the outstanding balance was US$9.6 billion, or 2.3 per cent of loans. Of these amounts, US$11.8 billion and US$7.3 billion at the end of 2006 and 2005, respectively, relate to HSBC Finance mortgage services. There were no stated income mortgages in consumer lending in either period. The remainder of the stated income balances are held by HSBC USA Inc.
(Unaudited) Year ended 31 December 2006 Year ended 31 December 2005
Mortgage services
Consumer lending
Other mortgage lending
Mortgage services
Consumer lending
Other mortgage lending
US$m US$m US$m US$m US$m US$m
Fixed rate ............................................................ 22,358 42,371 7,655 20,088 36,187 6,507 Adjustable-rate .................................................... 27,114 3,528 24,817 24,211 1,796 29,110
Total .................................................................... 49,472 45,899 32,472 44,299 37,983 35,617 First lien .............................................................. 39,404 39,399 28,780 36,278 33,242 32,286 Second lien ......................................................... 10,068 6,500 3,692 8,021 4,741 3,331
Total .................................................................... 49,472 45,899 32,472 44,299 37,983 35,617 Adjustable-rate .................................................... 20,795 3,528 16,251 19,037 1,796 19,473 Interest-only ........................................................ 6,319 – 8,566 5,174 – 9,637
Total adjustable-rate ........................................... 27,114 3,528 24,817 24,211 1,796 29,110
Country distribution of outstandings and cross-border exposures (Unaudited)
HSBC controls the risk associated with cross-border lending, essentially that foreign currency will not be made available to local residents to make payments, through a centralised structure of internal country limits which are determined by taking into account relevant economic and political factors. Exposures to
individual countries and cross-border exposure in aggregate are kept under continual review.
The following table summarises the aggregate of in-country foreign currency and cross-border outstandings by type of borrower to countries which individually represent in excess of 1 per cent of HSBC’s total assets. The classification is based on the country of residence of the borrower but also recognises the transfer of country risk in respect of third party guarantees, eligible collateral held and residence of the head office when the borrower is a
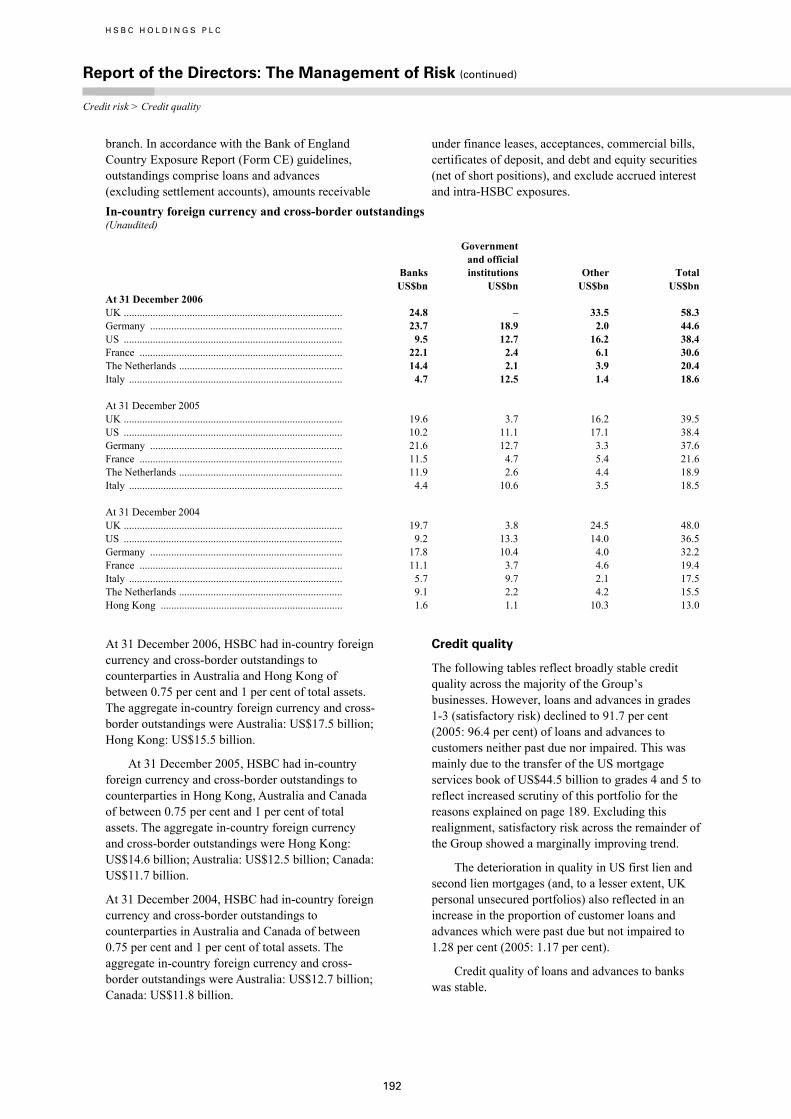
H S B C H O L D I N G S P L C
Report of the Directors: The Management of Risk (continued) Credit risk > Credit quality
192
branch. In accordance with the Bank of England Country Exposure Report (Form CE) guidelines, outstandings comprise loans and advances (excluding settlement accounts), amounts receivable
under finance leases, acceptances, commercial bills, certificates of deposit, and debt and equity securities (net of short positions), and exclude accrued interest and intra-HSBC exposures.
In-country foreign currency and cross-border outstandings (Unaudited)
Banks
Government and official institutions Other Total
US$bn US$bn US$bn US$bn At 31 December 2006 UK ................................................................................... 24.8 – 33.5 58.3 Germany ......................................................................... 23.7 18.9 2.0 44.6 US ................................................................................... 9.5 12.7 16.2 38.4 France ............................................................................. 22.1 2.4 6.1 30.6 The Netherlands .............................................................. 14.4 2.1 3.9 20.4 Italy ................................................................................. 4.7 12.5 1.4 18.6 At 31 December 2005 UK ................................................................................... 19.6 3.7 16.2 39.5 US ................................................................................... 10.2 11.1 17.1 38.4 Germany ......................................................................... 21.6 12.7 3.3 37.6 France ............................................................................. 11.5 4.7 5.4 21.6 The Netherlands .............................................................. 11.9 2.6 4.4 18.9 Italy ................................................................................. 4.4 10.6 3.5 18.5 At 31 December 2004 UK ................................................................................... 19.7 3.8 24.5 48.0 US ................................................................................... 9.2 13.3 14.0 36.5 Germany ......................................................................... 17.8 10.4 4.0 32.2 France ............................................................................. 11.1 3.7 4.6 19.4 Italy ................................................................................. 5.7 9.7 2.1 17.5 The Netherlands .............................................................. 9.1 2.2 4.2 15.5 Hong Kong ..................................................................... 1.6 1.1 10.3 13.0
At 31 December 2006, HSBC had in-country foreign currency and cross-border outstandings to counterparties in Australia and Hong Kong of between 0.75 per cent and 1 per cent of total assets. The aggregate in-country foreign currency and cross-border outstandings were Australia: US$17.5 billion; Hong Kong: US$15.5 billion.
At 31 December 2005, HSBC had in-country foreign currency and cross-border outstandings to counterparties in Hong Kong, Australia and Canada of between 0.75 per cent and 1 per cent of total assets. The aggregate in-country foreign currency and cross-border outstandings were Hong Kong: US$14.6 billion; Australia: US$12.5 billion; Canada: US$11.7 billion.
At 31 December 2004, HSBC had in-country foreign currency and cross-border outstandings to counterparties in Australia and Canada of between 0.75 per cent and 1 per cent of total assets. The aggregate in-country foreign currency and cross-border outstandings were Australia: US$12.7 billion; Canada: US$11.8 billion.
Credit quality
The following tables reflect broadly stable credit quality across the majority of the Group’s businesses. However, loans and advances in grades 1-3 (satisfactory risk) declined to 91.7 per cent (2005: 96.4 per cent) of loans and advances to customers neither past due nor impaired. This was mainly due to the transfer of the US mortgage services book of US$44.5 billion to grades 4 and 5 to reflect increased scrutiny of this portfolio for the reasons explained on page 189. Excluding this realignment, satisfactory risk across the remainder of the Group showed a marginally improving trend.
The deterioration in quality in US first lien and second lien mortgages (and, to a lesser extent, UK personal unsecured portfolios) also reflected in an increase in the proportion of customer loans and advances which were past due but not impaired to 1.28 per cent (2005: 1.17 per cent).
Credit quality of loans and advances to banks was stable.
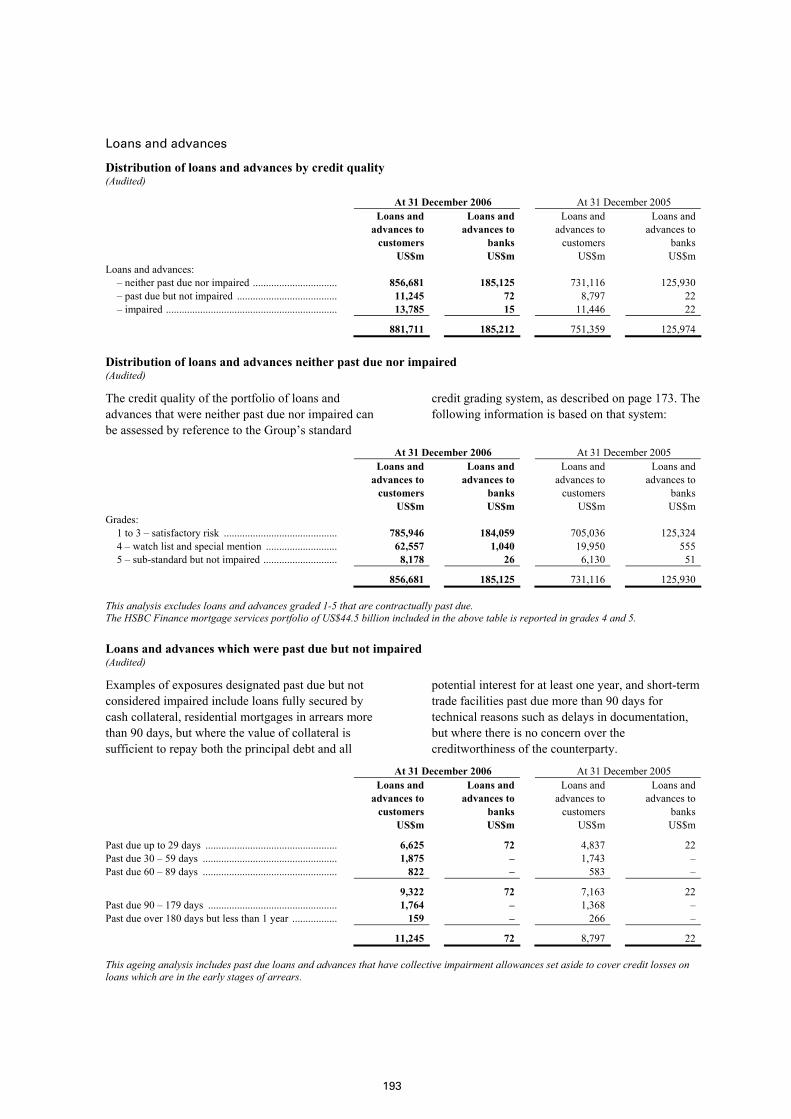
193
Loans and advances
Distribution of loans and advances by credit quality (Audited)
At 31 December 2006 At 31 December 2005 Loans and
advances to customers
Loans and advances to banks
Loans and advances to customers
Loans and advances to banks
US$m US$m US$m US$m Loans and advances:
– neither past due nor impaired ................................ 856,681 185,125 731,116 125,930 – past due but not impaired ...................................... 11,245 72 8,797 22 – impaired ................................................................. 13,785 15 11,446 22
881,711 185,212 751,359 125,974
Distribution of loans and advances neither past due nor impaired (Audited)
The credit quality of the portfolio of loans and advances that were neither past due nor impaired can be assessed by reference to the Group’s standard
credit grading system, as described on page 173. The following information is based on that system:
At 31 December 2006 At 31 December 2005 Loans and
advances to customers
Loans and advances to banks
Loans and advances to customers
Loans and advances to banks
US$m US$m US$m US$m Grades:
1 to 3 – satisfactory risk ........................................... 785,946 184,059 705,036 125,324 4 – watch list and special mention ........................... 62,557 1,040 19,950 555 5 – sub-standard but not impaired ............................ 8,178 26 6,130 51
856,681 185,125 731,116 125,930
This analysis excludes loans and advances graded 1-5 that are contractually past due. The HSBC Finance mortgage services portfolio of US$44.5 billion included in the above table is reported in grades 4 and 5.
Loans and advances which were past due but not impaired (Audited)
Examples of exposures designated past due but not considered impaired include loans fully secured by cash collateral, residential mortgages in arrears more than 90 days, but where the value of collateral is sufficient to repay both the principal debt and all
potential interest for at least one year, and short-term trade facilities past due more than 90 days for technical reasons such as delays in documentation, but where there is no concern over the creditworthiness of the counterparty.
At 31 December 2006 At 31 December 2005 Loans and
advances to customers
Loans and advances to banks
Loans and advances to customers
Loans and advances to banks
US$m US$m US$m US$m
Past due up to 29 days .................................................. 6,625 72 4,837 22 Past due 30 – 59 days ................................................... 1,875 – 1,743 – Past due 60 – 89 days ................................................... 822 – 583 –
9,322 72 7,163 22 Past due 90 – 179 days ................................................. 1,764 – 1,368 – Past due over 180 days but less than 1 year ................. 159 – 266 –
11,245 72 8,797 22
This ageing analysis includes past due loans and advances that have collective impairment allowances set aside to cover credit losses on loans which are in the early stages of arrears.
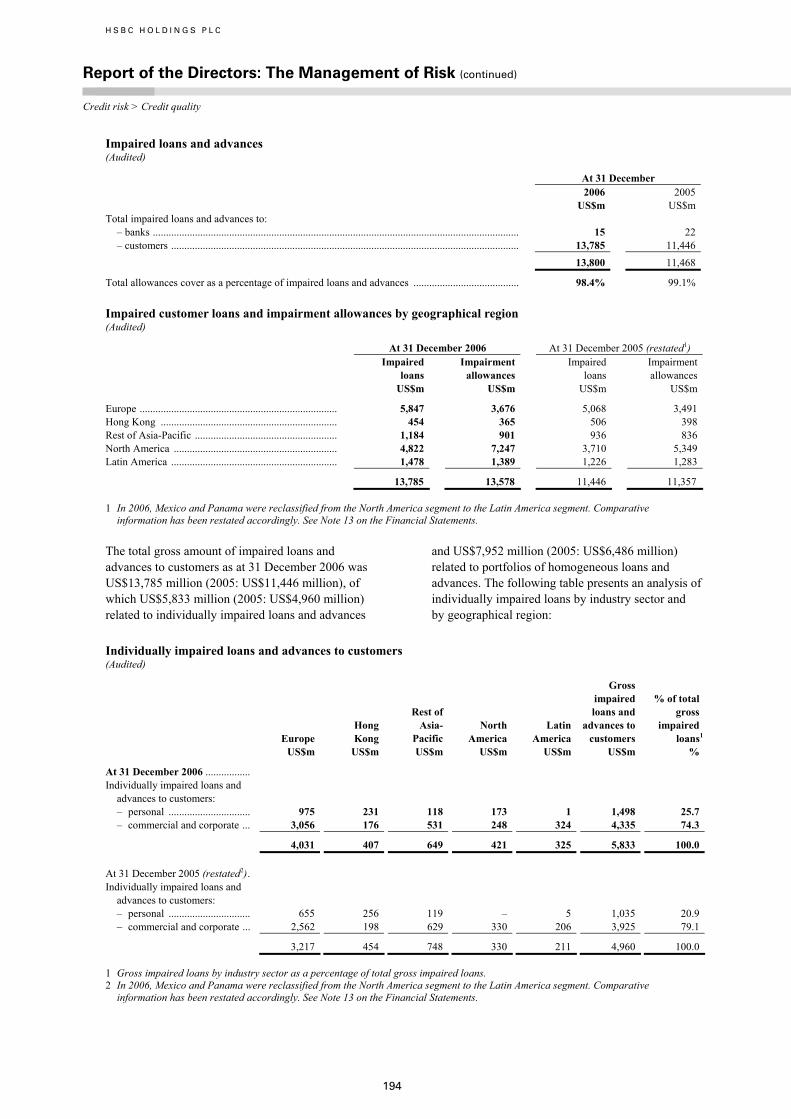
H S B C H O L D I N G S P L C
Report of the Directors: The Management of Risk (continued) Credit risk > Credit quality
194
Impaired loans and advances (Audited)
At 31 December 2006
US$m 2005
US$m Total impaired loans and advances to:
– banks ........................................................................................................................................... 15 22 – customers .................................................................................................................................... 13,785 11,446
13,800 11,468
Total allowances cover as a percentage of impaired loans and advances ........................................ 98.4% 99.1%
Impaired customer loans and impairment allowances by geographical region (Audited)
At 31 December 2006 At 31 December 2005 (restated1)
Impaired loans
Impairment allowances
Impaired loans
Impairment allowances
US$m US$m US$m US$m
Europe ........................................................................... 5,847 3,676 5,068 3,491 Hong Kong ................................................................... 454 365 506 398 Rest of Asia-Pacific ...................................................... 1,184 901 936 836 North America .............................................................. 4,822 7,247 3,710 5,349 Latin America ............................................................... 1,478 1,389 1,226 1,283
13,785 13,578 11,446 11,357
1 In 2006, Mexico and Panama were reclassified from the North America segment to the Latin America segment. Comparative information has been restated accordingly. See Note 13 on the Financial Statements.
The total gross amount of impaired loans and advances to customers as at 31 December 2006 was US$13,785 million (2005: US$11,446 million), of which US$5,833 million (2005: US$4,960 million) related to individually impaired loans and advances
and US$7,952 million (2005: US$6,486 million) related to portfolios of homogeneous loans and advances. The following table presents an analysis of individually impaired loans by industry sector and by geographical region:
Individually impaired loans and advances to customers (Audited)
Europe Hong Kong
Rest of Asia- Pacific
North America
Latin America
Gross impaired loans and advances to customers
% of total gross impaired loans1
US$m US$m US$m US$m US$m US$m %
At 31 December 2006 ................. Individually impaired loans and
advances to customers: – personal ............................... 975 231 118 173 1 1,498 25.7 – commercial and corporate ... 3,056 176 531 248 324 4,335 74.3
4,031 407 649 421 325 5,833 100.0 At 31 December 2005 (restated2). Individually impaired loans and
advances to customers: – personal ............................... 655 256 119 – 5 1,035 20.9 – commercial and corporate ... 2,562 198 629 330 206 3,925 79.1
3,217 454 748 330 211 4,960 100.0
1 Gross impaired loans by industry sector as a percentage of total gross impaired loans. 2 In 2006, Mexico and Panama were reclassified from the North America segment to the Latin America segment. Comparative
information has been restated accordingly. See Note 13 on the Financial Statements.
195
Year ended 31 December 2006 compared with year ended 31 December 2005 (Unaudited)
Total impaired loans to customers were US$13,785 million at 31 December 2006, an increase of 20 per cent since the end of 2005. At constant currency the growth was 14 per cent and, at 31 December 2006, impaired loans as a percentage of gross customer loans and advances were 1.56 per cent (2005: 1.52 per cent). The US represented 9 percentage points of overall growth and 33 per cent of total impaired customer loans at 31 December 2006.
The commentary that follows is based on constant exchange rates.
In Europe, impaired loans rose by 4 per cent to US$5,847 million in 2006. In the UK, impaired loans grew by 11 per cent over the same period. The UK market remained challenging, with pressure on consumers through high levels of personal indebtedness, compounded by interest rate rises. These effects were to an extent masked by the growing prevalence of personal bankruptcies and IVAs, at the completion of which any unpaid balances are written off. UK commercial and corporate lending remained broadly stable. In France, impaired loans fell mainly as a result of more active portfolio management, including the sale of a portfolio of substantially impaired debt and, in Turkey, higher impaired balances were broadly in line with growth in customer advances; the credit environment in these countries was relatively stable.
Impaired loans in Hong Kong were 10 per cent lower at US$454 million at 31 December 2006. HSBC responded to moderate volatility in its loan portfolio by launching a number of initiatives to strengthen credit management and risk monitoring procedures, in order to improve the credit quality of its portfolio. As a result, the number of newly impaired loans fell and an increased number of loans were written off.
In the Rest of Asia-Pacific, impaired loans increased by 23 per cent to US$1,184 million. In Taiwan, delinquency problems emerged in the middle of 2005, centred on a relatively small number of highly leveraged consumers. This prompted a range of regulatory changes aimed at avoiding a financial crisis, the most significant being the introduction of a government debt negotiation mechanism by which banks were instructed to make available deferred repayment terms at discounted rates. The consequence of this was to widen considerably the group of debtors seeking relief and increase substantially HSBC’s impaired loans to
some US$340 million. In the Middle East, the 8 per cent rise in impaired loans reflected lending growth. Impaired loans declined in most other countries, reflecting buoyant regional economies.
In North America there was a rise of 30 per cent in impaired loans, to US$4,822 million at 31 December 2006. Growth was substantially driven by credit deterioration in second lien, some portions of first lien and adjustable-rate mortgages in the US mortgage services book, as detailed on page 189.
This was partly offset by the non-recurrence of significant loan impairment allowances which were raised in 2005 as a result of hurricane Katrina and increased levels of bankruptcy filings in the fourth quarter of the year. As a consequence of this latter factor, HSBC experienced bankruptcies significantly below long-term trends in the first half of 2006. Continuing assessments of the financial impact of hurricane Katrina on HSBC Finance’s customers living in the Katrina Federal Emergency Management Agency designated Individual Assistance disaster areas resulted in a downwards revision of the estimate of credit loss exposure in the first half of 2006.
In contrast to the accelerated credit weakness witnessed in the mortgage services business, the trend of credit delinquency across the majority of the other portfolios, including mortgage balances originated through the branch-based consumer lending business, rose modestly, driven by growing portfolio maturity and a higher mix of credit card receivables following the Metris acquisition.
In Canada, impaired loans increased as a small number of commercial customers in the manufacturing sector were adversely affected by the stronger Canadian dollar.
In Latin America, impaired loans increased by 14 per cent to US$1,478 million, partly due to acquisitions in 2006 and partly to a higher amount of personal lending. Growth was mainly in Mexico and Brazil. In Mexico, impaired loans rose through strong growth in lending to personal and commercial customers, particularly the small and middle market sectors. In Brazil, impaired loans rose by 6 per cent, reflecting lending growth and some continuing credit stress, in part mitigated through tightened underwriting criteria introduced during 2005 and 2006.
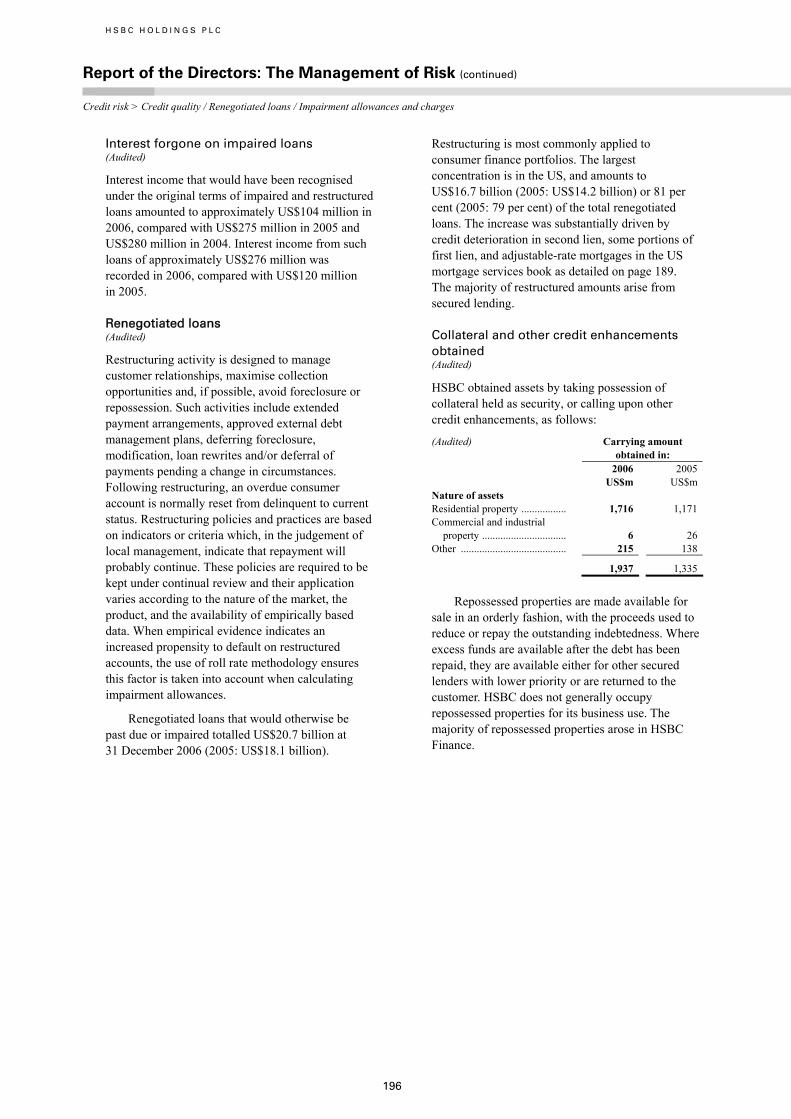
H S B C H O L D I N G S P L C
Report of the Directors: The Management of Risk (continued) Credit risk > Credit quality / Renegotiated loans / Impairment allowances and charges
196
Interest forgone on impaired loans (Audited)
Interest income that would have been recognised under the original terms of impaired and restructured loans amounted to approximately US$104 million in 2006, compared with US$275 million in 2005 and US$280 million in 2004. Interest income from such loans of approximately US$276 million was recorded in 2006, compared with US$120 million in 2005.
Renegotiated loans (Audited)
Restructuring activity is designed to manage customer relationships, maximise collection opportunities and, if possible, avoid foreclosure or repossession. Such activities include extended payment arrangements, approved external debt management plans, deferring foreclosure, modification, loan rewrites and/or deferral of payments pending a change in circumstances. Following restructuring, an overdue consumer account is normally reset from delinquent to current status. Restructuring policies and practices are based on indicators or criteria which, in the judgement of local management, indicate that repayment will probably continue. These policies are required to be kept under continual review and their application varies according to the nature of the market, the product, and the availability of empirically based data. When empirical evidence indicates an increased propensity to default on restructured accounts, the use of roll rate methodology ensures this factor is taken into account when calculating impairment allowances.
Renegotiated loans that would otherwise be past due or impaired totalled US$20.7 billion at 31 December 2006 (2005: US$18.1 billion).
Restructuring is most commonly applied to consumer finance portfolios. The largest concentration is in the US, and amounts to US$16.7 billion (2005: US$14.2 billion) or 81 per cent (2005: 79 per cent) of the total renegotiated loans. The increase was substantially driven by credit deterioration in second lien, some portions of first lien, and adjustable-rate mortgages in the US mortgage services book as detailed on page 189. The majority of restructured amounts arise from secured lending.
Collateral and other credit enhancements obtained (Audited)
HSBC obtained assets by taking possession of collateral held as security, or calling upon other credit enhancements, as follows:
(Audited) Carrying amount obtained in:
2006 2005 US$m US$m Nature of assets Residential property ................. 1,716 1,171 Commercial and industrial
property ................................ 6 26 Other ........................................ 215 138
1,937 1,335
Repossessed properties are made available for sale in an orderly fashion, with the proceeds used to reduce or repay the outstanding indebtedness. Where excess funds are available after the debt has been repaid, they are available either for other secured lenders with lower priority or are returned to the customer. HSBC does not generally occupy repossessed properties for its business use. The majority of repossessed properties arose in HSBC Finance.
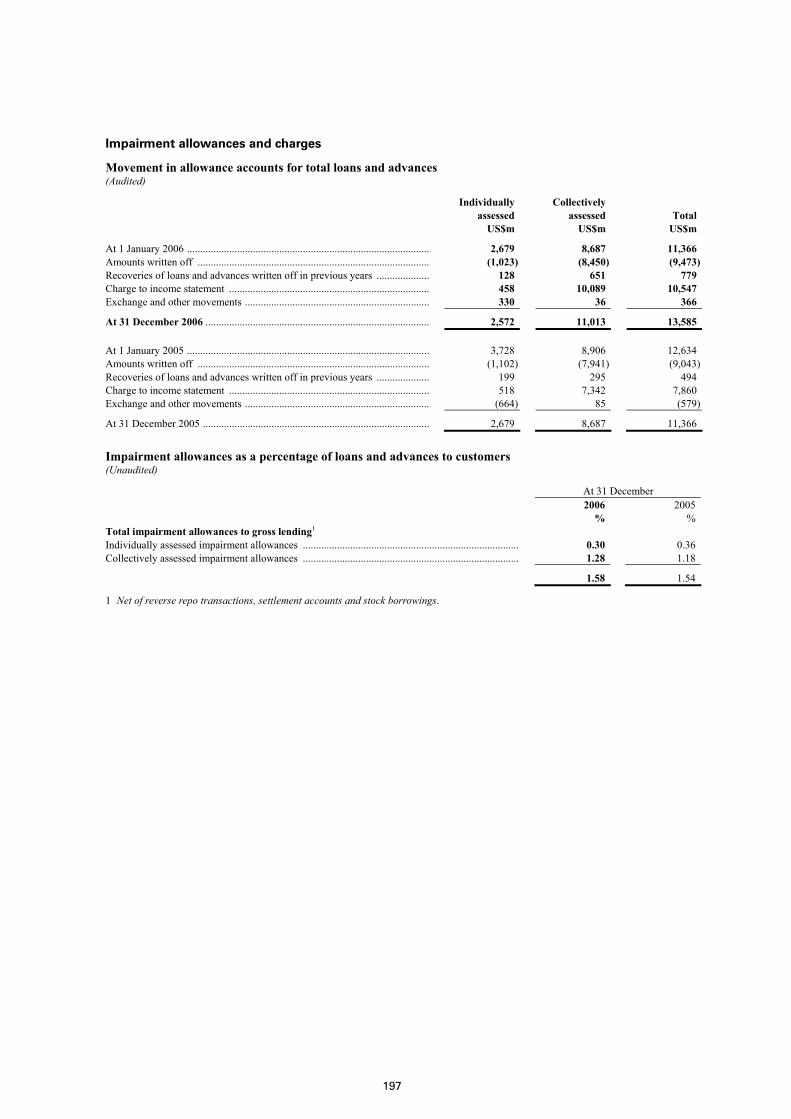
197
Impairment allowances and charges
Movement in allowance accounts for total loans and advances (Audited)
Individually assessed
Collectively assessed Total
US$m US$m US$m
At 1 January 2006 ............................................................................................ 2,679 8,687 11,366 Amounts written off ........................................................................................ (1,023) (8,450) (9,473)Recoveries of loans and advances written off in previous years .................... 128 651 779 Charge to income statement ............................................................................ 458 10,089 10,547 Exchange and other movements ...................................................................... 330 36 366
At 31 December 2006 ..................................................................................... 2,572 11,013 13,585 At 1 January 2005 ............................................................................................ 3,728 8,906 12,634 Amounts written off ........................................................................................ (1,102) (7,941) (9,043)Recoveries of loans and advances written off in previous years .................... 199 295 494 Charge to income statement ............................................................................ 518 7,342 7,860 Exchange and other movements ...................................................................... (664) 85 (579)
At 31 December 2005 ...................................................................................... 2,679 8,687 11,366
Impairment allowances as a percentage of loans and advances to customers (Unaudited)
At 31 December 2006 2005 % % Total impairment allowances to gross lending1 Individually assessed impairment allowances .................................................................................. 0.30 0.36 Collectively assessed impairment allowances .................................................................................. 1.28 1.18
1.58 1.54
1 Net of reverse repo transactions, settlement accounts and stock borrowings.
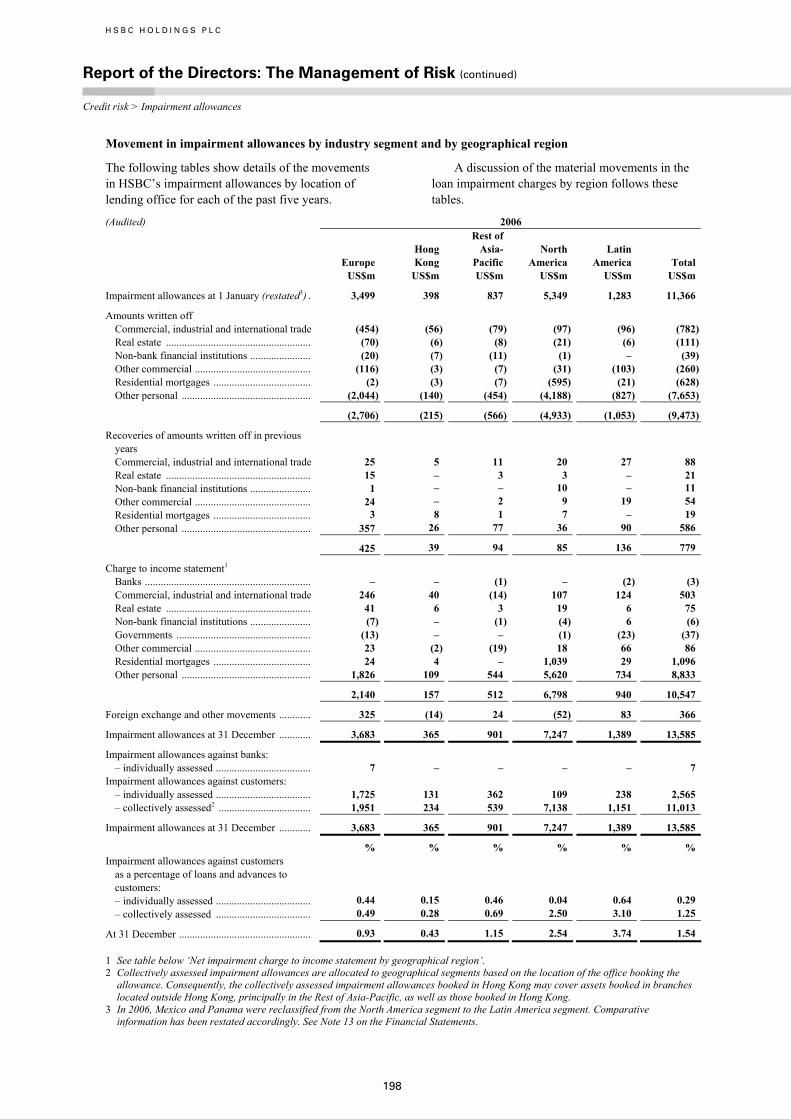
H S B C H O L D I N G S P L C
Report of the Directors: The Management of Risk (continued) Credit risk > Impairment allowances
198
Movement in impairment allowances by industry segment and by geographical region
The following tables show details of the movements in HSBC’s impairment allowances by location of lending office for each of the past five years.
A discussion of the material movements in the loan impairment charges by region follows these tables.
(Audited) 2006
Europe Hong Kong
Rest of Asia- Pacific
North America
Latin America Total
US$m US$m US$m US$m US$m US$m
Impairment allowances at 1 January (restated3) . 3,499 398 837 5,349 1,283 11,366
Amounts written off Commercial, industrial and international trade (454) (56) (79) (97) (96) (782)Real estate ....................................................... (70) (6) (8) (21) (6) (111)Non-bank financial institutions ....................... (20) (7) (11) (1) – (39)Other commercial ............................................ (116) (3) (7) (31) (103) (260)Residential mortgages ..................................... (2) (3) (7) (595) (21) (628)Other personal ................................................. (2,044) (140) (454) (4,188) (827) (7,653)
(2,706) (215) (566) (4,933) (1,053) (9,473)
Recoveries of amounts written off in previous years Commercial, industrial and international trade 25 5 11 20 27 88 Real estate ....................................................... 15 – 3 3 – 21 Non-bank financial institutions ....................... 1 – – 10 – 11 Other commercial ............................................ 24 – 2 9 19 54 Residential mortgages ..................................... 3 8 1 7 – 19 Other personal ................................................. 357 26 77 36 90 586
425 39 94 85 136 779
Charge to income statement1 Banks ............................................................... – – (1) – (2) (3)Commercial, industrial and international trade 246 40 (14) 107 124 503 Real estate ....................................................... 41 6 3 19 6 75 Non-bank financial institutions ....................... (7) – (1) (4) 6 (6)Governments ................................................... (13) – – (1) (23) (37)Other commercial ............................................ 23 (2) (19) 18 66 86 Residential mortgages ..................................... 24 4 – 1,039 29 1,096 Other personal ................................................. 1,826 109 544 5,620 734 8,833
2,140 157 512 6,798 940 10,547
Foreign exchange and other movements ............ 325 (14) 24 (52) 83 366
Impairment allowances at 31 December ............ 3,683 365 901 7,247 1,389 13,585
Impairment allowances against banks: – individually assessed .................................... 7 – – – – 7
Impairment allowances against customers: – individually assessed .................................... 1,725 131 362 109 238 2,565 – collectively assessed2 ................................... 1,951 234 539 7,138 1,151 11,013
Impairment allowances at 31 December ............ 3,683 365 901 7,247 1,389 13,585
% % % % % % Impairment allowances against customers
as a percentage of loans and advances to customers: – individually assessed .................................... 0.44 0.15 0.46 0.04 0.64 0.29 – collectively assessed .................................... 0.49 0.28 0.69 2.50 3.10 1.25
At 31 December .................................................. 0.93 0.43 1.15 2.54 3.74 1.54
1 See table below ‘Net impairment charge to income statement by geographical region’. 2 Collectively assessed impairment allowances are allocated to geographical segments based on the location of the office booking the
allowance. Consequently, the collectively assessed impairment allowances booked in Hong Kong may cover assets booked in branches located outside Hong Kong, principally in the Rest of Asia-Pacific, as well as those booked in Hong Kong.
3 In 2006, Mexico and Panama were reclassified from the North America segment to the Latin America segment. Comparative information has been restated accordingly. See Note 13 on the Financial Statements.
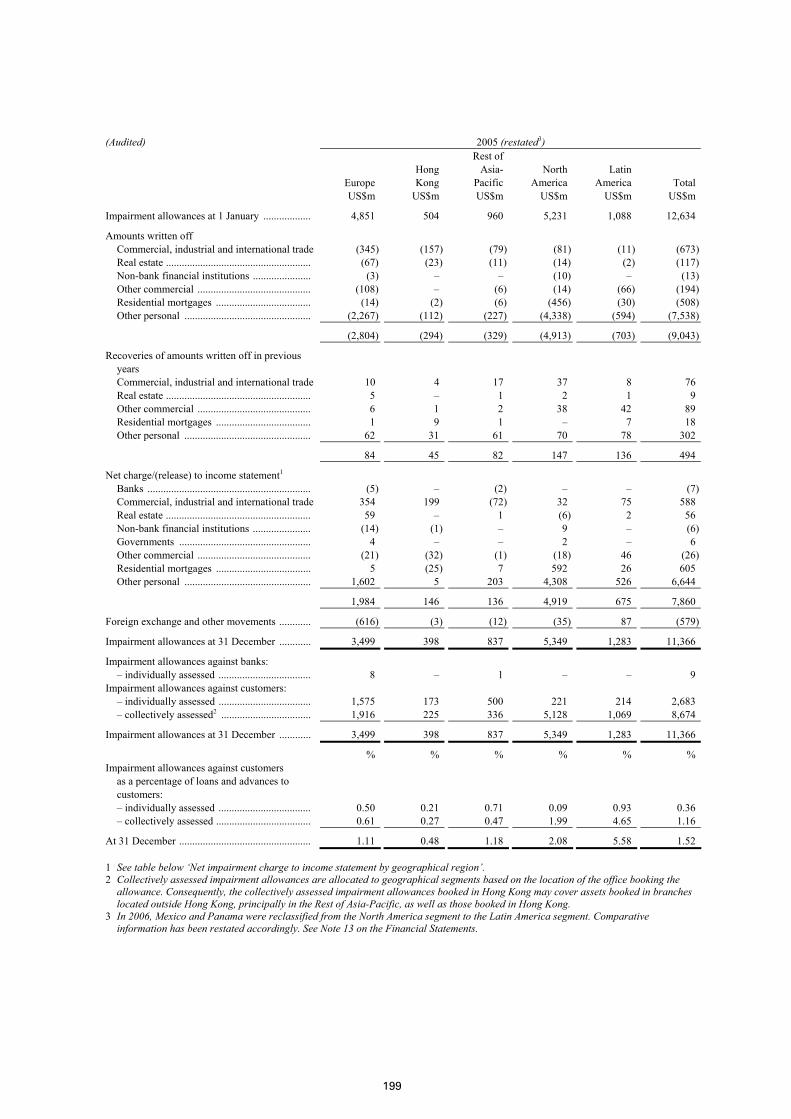
199
(Audited) 2005 (restated3)
Europe Hong Kong
Rest of Asia- Pacific
North America
Latin America Total
US$m US$m US$m US$m US$m US$m
Impairment allowances at 1 January .................. 4,851 504 960 5,231 1,088 12,634
Amounts written off Commercial, industrial and international trade (345) (157) (79) (81) (11) (673)Real estate ....................................................... (67) (23) (11) (14) (2) (117)Non-bank financial institutions ...................... (3) – – (10) – (13)Other commercial ........................................... (108) – (6) (14) (66) (194)Residential mortgages .................................... (14) (2) (6) (456) (30) (508)Other personal ................................................ (2,267) (112) (227) (4,338) (594) (7,538)
(2,804) (294) (329) (4,913) (703) (9,043)
Recoveries of amounts written off in previous years Commercial, industrial and international trade 10 4 17 37 8 76 Real estate ....................................................... 5 – 1 2 1 9 Other commercial ........................................... 6 1 2 38 42 89 Residential mortgages .................................... 1 9 1 – 7 18 Other personal ................................................ 62 31 61 70 78 302
84 45 82 147 136 494
Net charge/(release) to income statement1 Banks .............................................................. (5) – (2) – – (7)Commercial, industrial and international trade 354 199 (72) 32 75 588 Real estate ....................................................... 59 – 1 (6) 2 56 Non-bank financial institutions ...................... (14) (1) – 9 – (6)Governments .................................................. 4 – – 2 – 6 Other commercial ........................................... (21) (32) (1) (18) 46 (26)Residential mortgages .................................... 5 (25) 7 592 26 605 Other personal ................................................ 1,602 5 203 4,308 526 6,644
1,984 146 136 4,919 675 7,860
Foreign exchange and other movements ............ (616) (3) (12) (35) 87 (579)
Impairment allowances at 31 December ............ 3,499 398 837 5,349 1,283 11,366
Impairment allowances against banks: – individually assessed ................................... 8 – 1 – – 9
Impairment allowances against customers: – individually assessed ................................... 1,575 173 500 221 214 2,683 – collectively assessed2 .................................. 1,916 225 336 5,128 1,069 8,674
Impairment allowances at 31 December ............ 3,499 398 837 5,349 1,283 11,366
% % % % % % Impairment allowances against customers
as a percentage of loans and advances to customers: – individually assessed ................................... 0.50 0.21 0.71 0.09 0.93 0.36 – collectively assessed .................................... 0.61 0.27 0.47 1.99 4.65 1.16
At 31 December .................................................. 1.11 0.48 1.18 2.08 5.58 1.52
1 See table below ‘Net impairment charge to income statement by geographical region’. 2 Collectively assessed impairment allowances are allocated to geographical segments based on the location of the office booking the
allowance. Consequently, the collectively assessed impairment allowances booked in Hong Kong may cover assets booked in branches located outside Hong Kong, principally in the Rest of Asia-Pacific, as well as those booked in Hong Kong.
3 In 2006, Mexico and Panama were reclassified from the North America segment to the Latin America segment. Comparative information has been restated accordingly. See Note 13 on the Financial Statements.
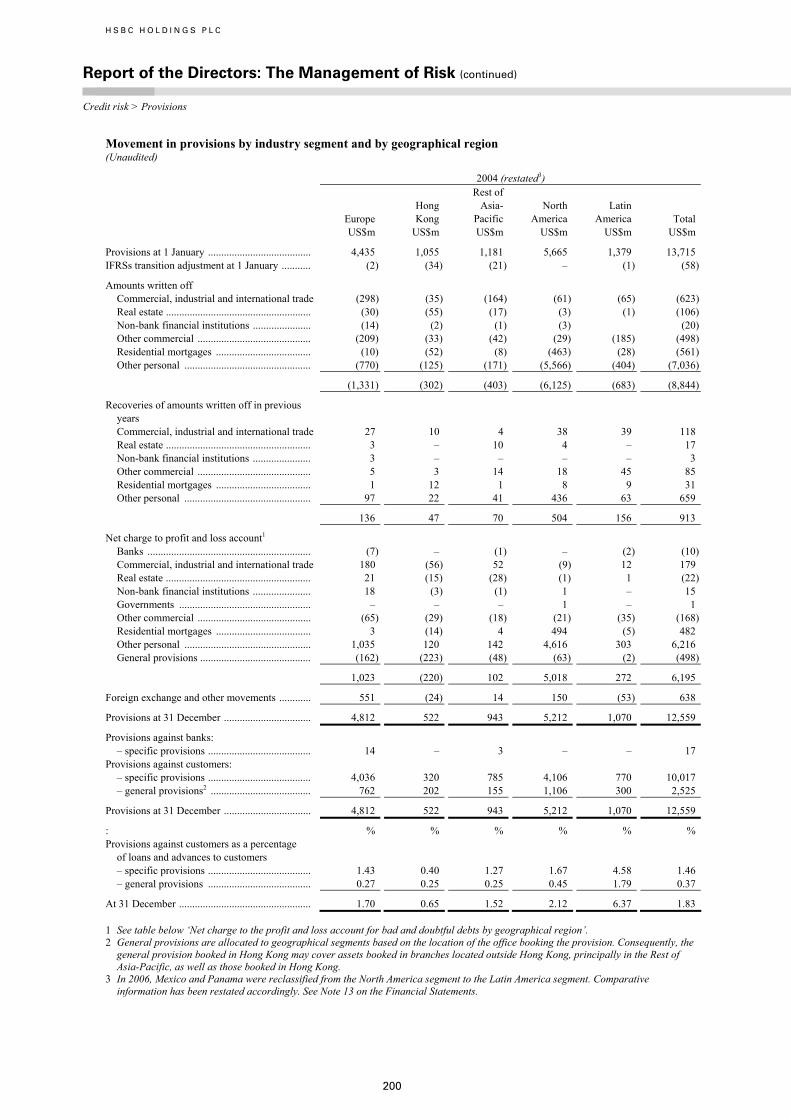
H S B C H O L D I N G S P L C
Report of the Directors: The Management of Risk (continued) Credit risk > Provisions
200
Movement in provisions by industry segment and by geographical region (Unaudited)
2004 (restated3)
Europe Hong Kong
Rest of Asia- Pacific
North America
Latin America Total
US$m US$m US$m US$m US$m US$m
Provisions at 1 January ....................................... 4,435 1,055 1,181 5,665 1,379 13,715 IFRSs transition adjustment at 1 January ........... (2) (34) (21) – (1) (58)
Amounts written off Commercial, industrial and international trade (298) (35) (164) (61) (65) (623)Real estate ....................................................... (30) (55) (17) (3) (1) (106)Non-bank financial institutions ...................... (14) (2) (1) (3) (20)Other commercial ........................................... (209) (33) (42) (29) (185) (498)Residential mortgages .................................... (10) (52) (8) (463) (28) (561)Other personal ................................................ (770) (125) (171) (5,566) (404) (7,036)
(1,331) (302) (403) (6,125) (683) (8,844)
Recoveries of amounts written off in previous years Commercial, industrial and international trade 27 10 4 38 39 118 Real estate ....................................................... 3 – 10 4 – 17 Non-bank financial institutions ...................... 3 – – – – 3 Other commercial ........................................... 5 3 14 18 45 85 Residential mortgages .................................... 1 12 1 8 9 31 Other personal ................................................ 97 22 41 436 63 659
136 47 70 504 156 913
Net charge to profit and loss account1 Banks .............................................................. (7) – (1) – (2) (10)Commercial, industrial and international trade 180 (56) 52 (9) 12 179 Real estate ....................................................... 21 (15) (28) (1) 1 (22)Non-bank financial institutions ...................... 18 (3) (1) 1 – 15 Governments .................................................. – – – 1 – 1 Other commercial ........................................... (65) (29) (18) (21) (35) (168)Residential mortgages .................................... 3 (14) 4 494 (5) 482 Other personal ................................................ 1,035 120 142 4,616 303 6,216 General provisions .......................................... (162) (223) (48) (63) (2) (498)
1,023 (220) 102 5,018 272 6,195
Foreign exchange and other movements ............ 551 (24) 14 150 (53) 638
Provisions at 31 December ................................. 4,812 522 943 5,212 1,070 12,559
Provisions against banks: – specific provisions ....................................... 14 – 3 – – 17
Provisions against customers: – specific provisions ....................................... 4,036 320 785 4,106 770 10,017 – general provisions2 ...................................... 762 202 155 1,106 300 2,525
Provisions at 31 December ................................. 4,812 522 943 5,212 1,070 12,559
: % % % % % % Provisions against customers as a percentage
of loans and advances to customers – specific provisions ....................................... 1.43 0.40 1.27 1.67 4.58 1.46 – general provisions ....................................... 0.27 0.25 0.25 0.45 1.79 0.37
At 31 December .................................................. 1.70 0.65 1.52 2.12 6.37 1.83
1 See table below ‘Net charge to the profit and loss account for bad and doubtful debts by geographical region’. 2 General provisions are allocated to geographical segments based on the location of the office booking the provision. Consequently, the
general provision booked in Hong Kong may cover assets booked in branches located outside Hong Kong, principally in the Rest of Asia-Pacific, as well as those booked in Hong Kong.
3 In 2006, Mexico and Panama were reclassified from the North America segment to the Latin America segment. Comparative information has been restated accordingly. See Note 13 on the Financial Statements.
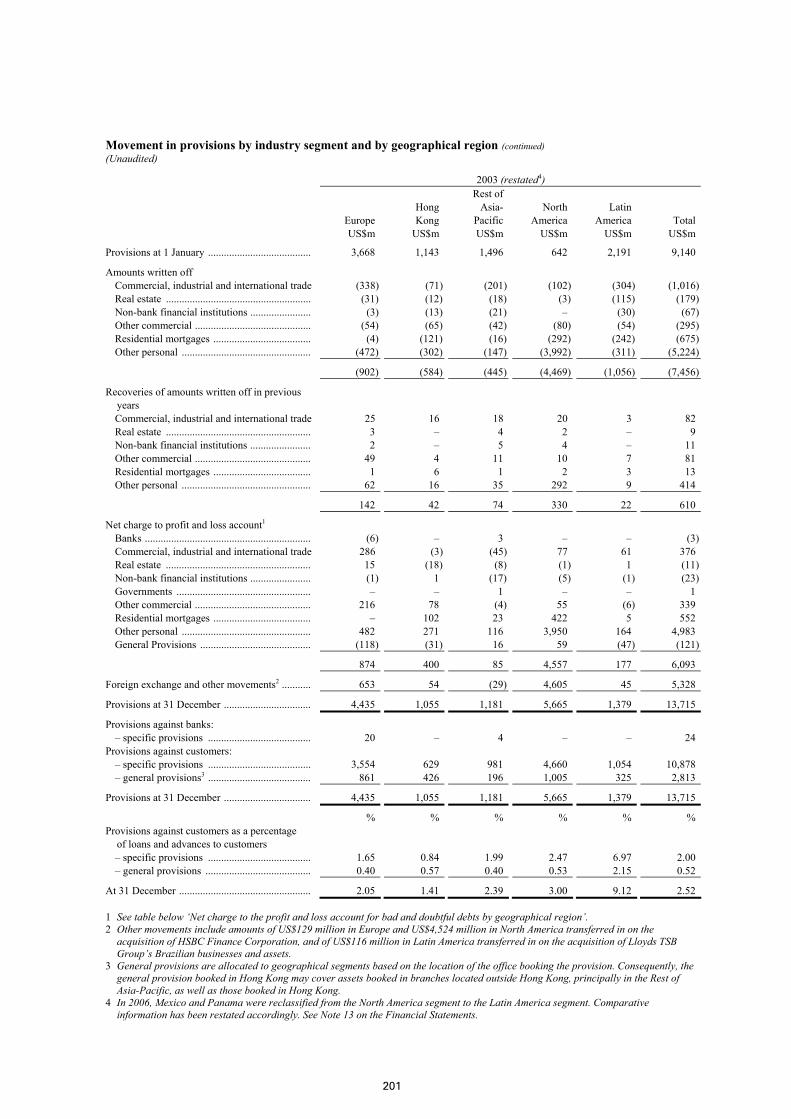
201
Movement in provisions by industry segment and by geographical region (continued) (Unaudited)
2003 (restated4)
Europe Hong Kong
Rest of Asia- Pacific
North America
Latin America Total
US$m US$m US$m US$m US$m US$m
Provisions at 1 January ....................................... 3,668 1,143 1,496 642 2,191 9,140
Amounts written off Commercial, industrial and international trade (338) (71) (201) (102) (304) (1,016)Real estate ....................................................... (31) (12) (18) (3) (115) (179)Non-bank financial institutions ....................... (3) (13) (21) – (30) (67)Other commercial ............................................ (54) (65) (42) (80) (54) (295)Residential mortgages ..................................... (4) (121) (16) (292) (242) (675)Other personal ................................................. (472) (302) (147) (3,992) (311) (5,224)
(902) (584) (445) (4,469) (1,056) (7,456)
Recoveries of amounts written off in previous years Commercial, industrial and international trade 25 16 18 20 3 82 Real estate ....................................................... 3 – 4 2 – 9 Non-bank financial institutions ....................... 2 – 5 4 – 11 Other commercial ............................................ 49 4 11 10 7 81 Residential mortgages ..................................... 1 6 1 2 3 13 Other personal ................................................. 62 16 35 292 9 414
142 42 74 330 22 610
Net charge to profit and loss account1 Banks ............................................................... (6) – 3 – – (3)Commercial, industrial and international trade 286 (3) (45) 77 61 376 Real estate ....................................................... 15 (18) (8) (1) 1 (11)Non-bank financial institutions ....................... (1) 1 (17) (5) (1) (23)Governments ................................................... – – 1 – – 1 Other commercial ............................................ 216 78 (4) 55 (6) 339 Residential mortgages ..................................... – 102 23 422 5 552 Other personal ................................................. 482 271 116 3,950 164 4,983 General Provisions .......................................... (118) (31) 16 59 (47) (121)
874 400 85 4,557 177 6,093
Foreign exchange and other movements2 ........... 653 54 (29) 4,605 45 5,328
Provisions at 31 December ................................. 4,435 1,055 1,181 5,665 1,379 13,715
Provisions against banks: – specific provisions ....................................... 20 – 4 – – 24
Provisions against customers: – specific provisions ....................................... 3,554 629 981 4,660 1,054 10,878 – general provisions3 ....................................... 861 426 196 1,005 325 2,813
Provisions at 31 December ................................. 4,435 1,055 1,181 5,665 1,379 13,715
% % % % % % Provisions against customers as a percentage
of loans and advances to customers – specific provisions ....................................... 1.65 0.84 1.99 2.47 6.97 2.00 – general provisions ........................................ 0.40 0.57 0.40 0.53 2.15 0.52
At 31 December .................................................. 2.05 1.41 2.39 3.00 9.12 2.52
1 See table below ‘Net charge to the profit and loss account for bad and doubtful debts by geographical region’. 2 Other movements include amounts of US$129 million in Europe and US$4,524 million in North America transferred in on the
acquisition of HSBC Finance Corporation, and of US$116 million in Latin America transferred in on the acquisition of Lloyds TSB Group’s Brazilian businesses and assets.
3 General provisions are allocated to geographical segments based on the location of the office booking the provision. Consequently, the general provision booked in Hong Kong may cover assets booked in branches located outside Hong Kong, principally in the Rest of Asia-Pacific, as well as those booked in Hong Kong.
4 In 2006, Mexico and Panama were reclassified from the North America segment to the Latin America segment. Comparative information has been restated accordingly. See Note 13 on the Financial Statements.
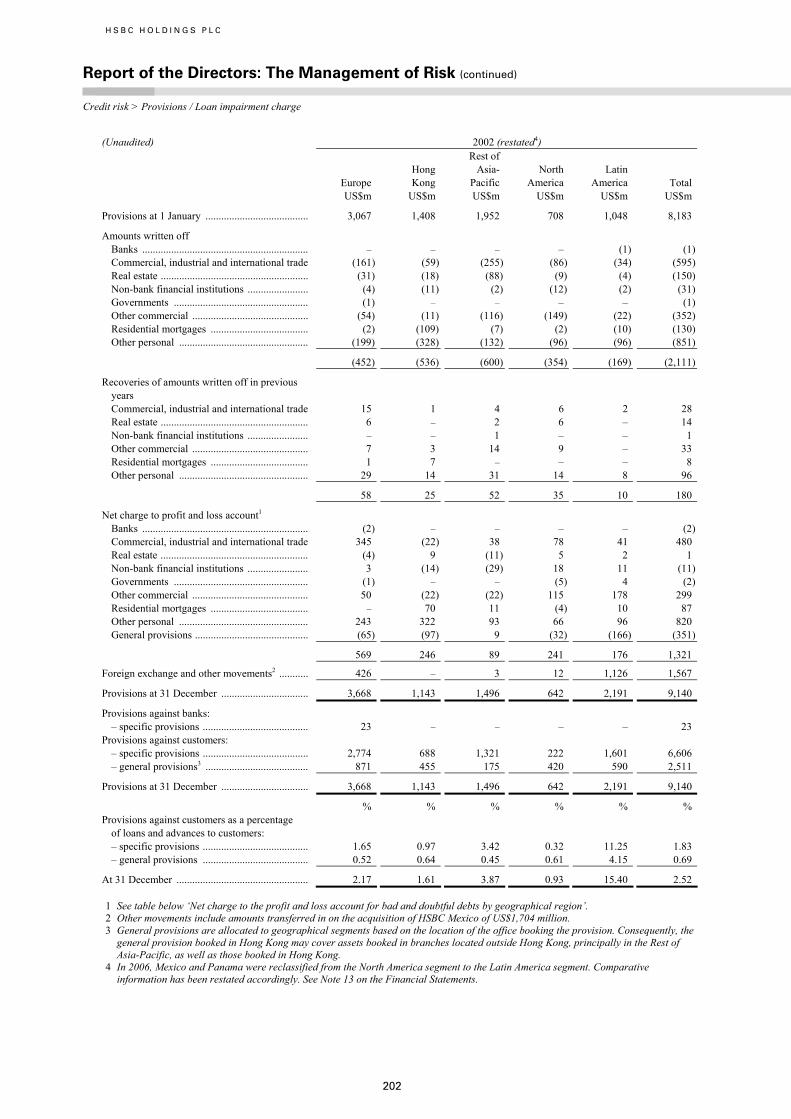
H S B C H O L D I N G S P L C
Report of the Directors: The Management of Risk (continued) Credit risk > Provisions / Loan impairment charge
202
(Unaudited) 2002 (restated4)
Europe Hong Kong
Rest of Asia- Pacific
North America
Latin America Total
US$m US$m US$m US$m US$m US$m
Provisions at 1 January ....................................... 3,067 1,408 1,952 708 1,048 8,183
Amounts written off Banks ............................................................... – – – – (1) (1)Commercial, industrial and international trade (161) (59) (255) (86) (34) (595)Real estate ........................................................ (31) (18) (88) (9) (4) (150)Non-bank financial institutions ....................... (4) (11) (2) (12) (2) (31)Governments ................................................... (1) – – – – (1)Other commercial ............................................ (54) (11) (116) (149) (22) (352)Residential mortgages ..................................... (2) (109) (7) (2) (10) (130)Other personal ................................................. (199) (328) (132) (96) (96) (851)
(452) (536) (600) (354) (169) (2,111)
Recoveries of amounts written off in previous years Commercial, industrial and international trade 15 1 4 6 2 28 Real estate ........................................................ 6 – 2 6 – 14 Non-bank financial institutions ....................... – – 1 – – 1 Other commercial ............................................ 7 3 14 9 – 33 Residential mortgages ..................................... 1 7 – – – 8 Other personal ................................................. 29 14 31 14 8 96
58 25 52 35 10 180
Net charge to profit and loss account1 Banks ............................................................... (2) – – – – (2)Commercial, industrial and international trade 345 (22) 38 78 41 480 Real estate ........................................................ (4) 9 (11) 5 2 1 Non-bank financial institutions ....................... 3 (14) (29) 18 11 (11)Governments ................................................... (1) – – (5) 4 (2)Other commercial ............................................ 50 (22) (22) 115 178 299 Residential mortgages ..................................... – 70 11 (4) 10 87 Other personal ................................................. 243 322 93 66 96 820 General provisions ........................................... (65) (97) 9 (32) (166) (351)
569 246 89 241 176 1,321
Foreign exchange and other movements2 ........... 426 – 3 12 1,126 1,567
Provisions at 31 December ................................. 3,668 1,143 1,496 642 2,191 9,140
Provisions against banks: – specific provisions ........................................ 23 – – – – 23
Provisions against customers: – specific provisions ........................................ 2,774 688 1,321 222 1,601 6,606 – general provisions3 ....................................... 871 455 175 420 590 2,511
Provisions at 31 December ................................. 3,668 1,143 1,496 642 2,191 9,140
% % % % % % Provisions against customers as a percentage
of loans and advances to customers: – specific provisions ........................................ 1.65 0.97 3.42 0.32 11.25 1.83 – general provisions ........................................ 0.52 0.64 0.45 0.61 4.15 0.69
At 31 December .................................................. 2.17 1.61 3.87 0.93 15.40 2.52
1 See table below ‘Net charge to the profit and loss account for bad and doubtful debts by geographical region’. 2 Other movements include amounts transferred in on the acquisition of HSBC Mexico of US$1,704 million. 3 General provisions are allocated to geographical segments based on the location of the office booking the provision. Consequently, the
general provision booked in Hong Kong may cover assets booked in branches located outside Hong Kong, principally in the Rest of Asia-Pacific, as well as those booked in Hong Kong.
4 In 2006, Mexico and Panama were reclassified from the North America segment to the Latin America segment. Comparative information has been restated accordingly. See Note 13 on the Financial Statements.
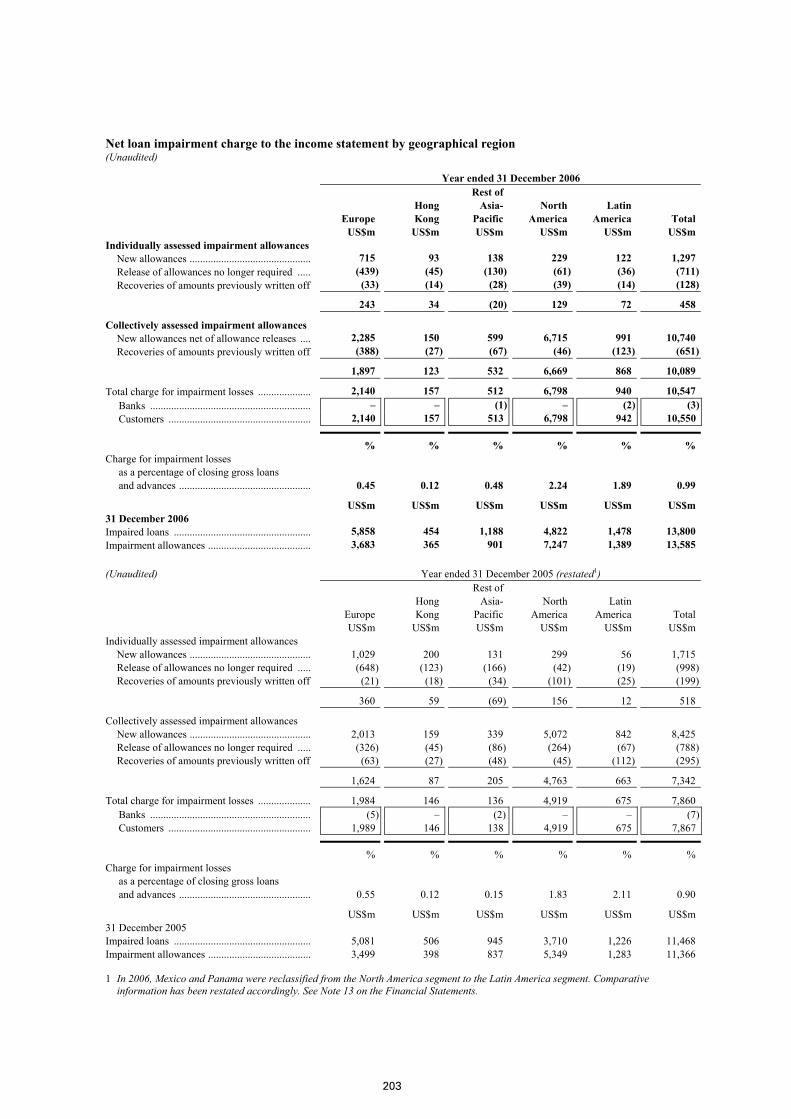
203
Net loan impairment charge to the income statement by geographical region (Unaudited)
Year ended 31 December 2006
Europe US$m
Hong Kong US$m
Rest of Asia- Pacific US$m
North America US$m
Latin America US$m
Total US$m
Individually assessed impairment allowances New allowances .............................................. 715 93 138 229 122 1,297 Release of allowances no longer required ..... (439) (45) (130) (61) (36) (711)Recoveries of amounts previously written off (33) (14) (28) (39) (14) (128)
243 34 (20) 129 72 458
Collectively assessed impairment allowances New allowances net of allowance releases .... 2,285 150 599 6,715 991 10,740 Recoveries of amounts previously written off (388) (27) (67) (46) (123) (651)
1,897 123 532 6,669 868 10,089
Total charge for impairment losses .................... 2,140 157 512 6,798 940 10,547 Banks ............................................................. – – (1) – (2) (3)Customers ...................................................... 2,140 157 513 6,798 942 10,550
% % % % % % Charge for impairment losses
as a percentage of closing gross loans and advances .................................................. 0.45 0.12 0.48 2.24 1.89 0.99
US$m US$m US$m US$m US$m US$m 31 December 2006 Impaired loans .................................................... 5,858 454 1,188 4,822 1,478 13,800 Impairment allowances ....................................... 3,683 365 901 7,247 1,389 13,585
(Unaudited) Year ended 31 December 2005 (restated1)
Europe US$m
Hong Kong US$m
Rest of Asia- Pacific US$m
North America US$m
Latin America US$m
Total US$m
Individually assessed impairment allowances New allowances .............................................. 1,029 200 131 299 56 1,715 Release of allowances no longer required ..... (648) (123) (166) (42) (19) (998)Recoveries of amounts previously written off (21) (18) (34) (101) (25) (199)
360 59 (69) 156 12 518
Collectively assessed impairment allowances New allowances .............................................. 2,013 159 339 5,072 842 8,425 Release of allowances no longer required ..... (326) (45) (86) (264) (67) (788)Recoveries of amounts previously written off (63) (27) (48) (45) (112) (295)
1,624 87 205 4,763 663 7,342
Total charge for impairment losses .................... 1,984 146 136 4,919 675 7,860 Banks ............................................................. (5) – (2) – – (7)Customers ...................................................... 1,989 146 138 4,919 675 7,867
% % % % % % Charge for impairment losses
as a percentage of closing gross loans and advances .................................................. 0.55 0.12 0.15 1.83 2.11 0.90
US$m US$m US$m US$m US$m US$m 31 December 2005 Impaired loans .................................................... 5,081 506 945 3,710 1,226 11,468 Impairment allowances ....................................... 3,499 398 837 5,349 1,283 11,366
1 In 2006, Mexico and Panama were reclassified from the North America segment to the Latin America segment. Comparative information has been restated accordingly. See Note 13 on the Financial Statements.
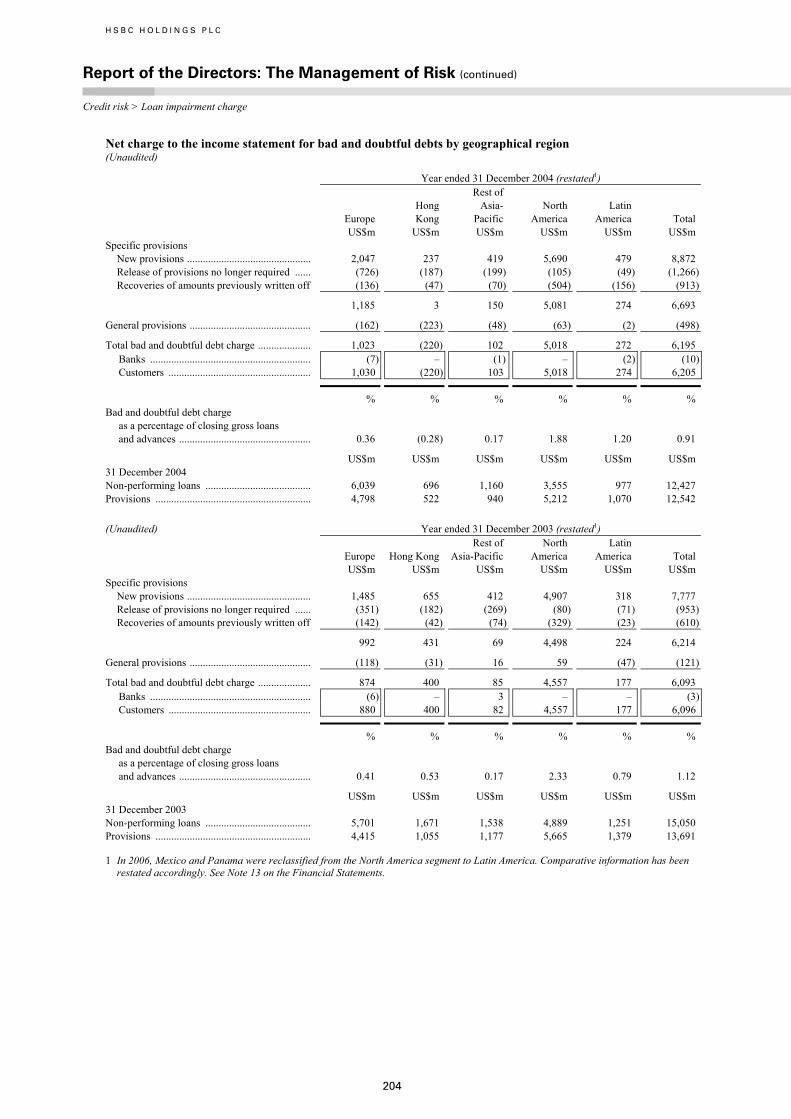
H S B C H O L D I N G S P L C
Report of the Directors: The Management of Risk (continued) Credit risk > Loan impairment charge
204
Net charge to the income statement for bad and doubtful debts by geographical region (Unaudited)
Year ended 31 December 2004 (restated1)
Europe US$m
Hong Kong US$m
Rest of Asia- Pacific US$m
North America US$m
Latin America US$m
Total US$m
Specific provisions New provisions ............................................... 2,047 237 419 5,690 479 8,872 Release of provisions no longer required ...... (726) (187) (199) (105) (49) (1,266)Recoveries of amounts previously written off (136) (47) (70) (504) (156) (913)
1,185 3 150 5,081 274 6,693
General provisions .............................................. (162) (223) (48) (63) (2) (498)
Total bad and doubtful debt charge .................... 1,023 (220) 102 5,018 272 6,195 Banks ............................................................. (7) – (1) – (2) (10)Customers ...................................................... 1,030 (220) 103 5,018 274 6,205
% % % % % % Bad and doubtful debt charge
as a percentage of closing gross loans and advances .................................................. 0.36 (0.28) 0.17 1.88 1.20 0.91
US$m US$m US$m US$m US$m US$m 31 December 2004 Non-performing loans ........................................ 6,039 696 1,160 3,555 977 12,427 Provisions ........................................................... 4,798 522 940 5,212 1,070 12,542
(Unaudited) Year ended 31 December 2003 (restated1)
Europe US$m
Hong Kong US$m
Rest of Asia-Pacific US$m
North America US$m
Latin America US$m
Total US$m
Specific provisions New provisions ............................................... 1,485 655 412 4,907 318 7,777 Release of provisions no longer required ...... (351) (182) (269) (80) (71) (953)Recoveries of amounts previously written off (142) (42) (74) (329) (23) (610)
992 431 69 4,498 224 6,214
General provisions .............................................. (118) (31) 16 59 (47) (121)
Total bad and doubtful debt charge .................... 874 400 85 4,557 177 6,093 Banks ............................................................. (6) – 3 – – (3)Customers ...................................................... 880 400 82 4,557 177 6,096
% % % % % % Bad and doubtful debt charge
as a percentage of closing gross loans and advances .................................................. 0.41 0.53 0.17 2.33 0.79 1.12
US$m US$m US$m US$m US$m US$m 31 December 2003 Non-performing loans ........................................ 5,701 1,671 1,538 4,889 1,251 15,050 Provisions ........................................................... 4,415 1,055 1,177 5,665 1,379 13,691
1 In 2006, Mexico and Panama were reclassified from the North America segment to Latin America. Comparative information has been restated accordingly. See Note 13 on the Financial Statements.
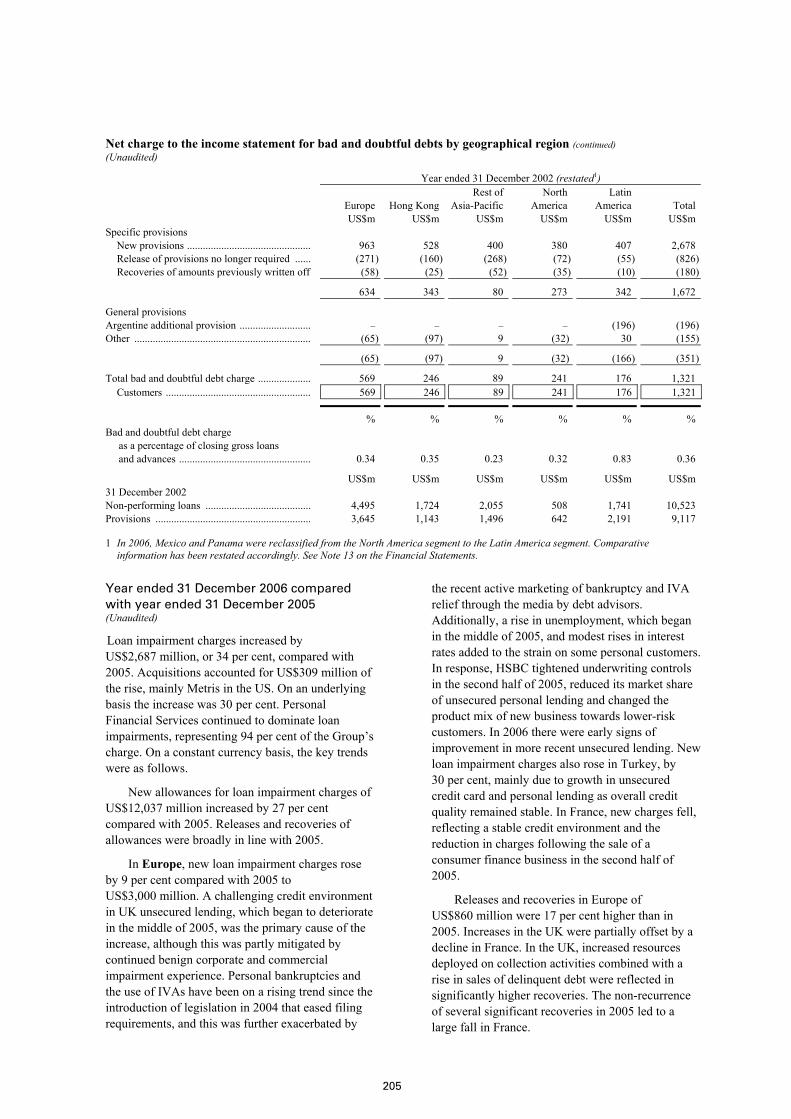
205
Net charge to the income statement for bad and doubtful debts by geographical region (continued) (Unaudited)
Year ended 31 December 2002 (restated1)
Europe US$m
Hong Kong US$m
Rest of Asia-Pacific US$m
North America US$m
Latin America US$m
Total US$m
Specific provisions New provisions ............................................... 963 528 400 380 407 2,678 Release of provisions no longer required ...... (271) (160) (268) (72) (55) (826)Recoveries of amounts previously written off (58) (25) (52) (35) (10) (180)
634 343 80 273 342 1,672
General provisions Argentine additional provision ........................... – – – – (196) (196)Other ................................................................... (65) (97) 9 (32) 30 (155)
(65) (97) 9 (32) (166) (351)
Total bad and doubtful debt charge .................... 569 246 89 241 176 1,321 Customers ....................................................... 569 246 89 241 176 1,321
% % % % % % Bad and doubtful debt charge
as a percentage of closing gross loans and advances .................................................. 0.34 0.35 0.23 0.32 0.83 0.36
US$m US$m US$m US$m US$m US$m 31 December 2002 Non-performing loans ........................................ 4,495 1,724 2,055 508 1,741 10,523 Provisions ........................................................... 3,645 1,143 1,496 642 2,191 9,117
1 In 2006, Mexico and Panama were reclassified from the North America segment to the Latin America segment. Comparative information has been restated accordingly. See Note 13 on the Financial Statements.
Year ended 31 December 2006 compared with year ended 31 December 2005 (Unaudited)
Loan impairment charges increased by US$2,687 million, or 34 per cent, compared with 2005. Acquisitions accounted for US$309 million of the rise, mainly Metris in the US. On an underlying basis the increase was 30 per cent. Personal Financial Services continued to dominate loan impairments, representing 94 per cent of the Group’s charge. On a constant currency basis, the key trends were as follows.
New allowances for loan impairment charges of US$12,037 million increased by 27 per cent compared with 2005. Releases and recoveries of allowances were broadly in line with 2005.
In Europe, new loan impairment charges rose by 9 per cent compared with 2005 to US$3,000 million. A challenging credit environment in UK unsecured lending, which began to deteriorate in the middle of 2005, was the primary cause of the increase, although this was partly mitigated by continued benign corporate and commercial impairment experience. Personal bankruptcies and the use of IVAs have been on a rising trend since the introduction of legislation in 2004 that eased filing requirements, and this was further exacerbated by
the recent active marketing of bankruptcy and IVA relief through the media by debt advisors. Additionally, a rise in unemployment, which began in the middle of 2005, and modest rises in interest rates added to the strain on some personal customers. In response, HSBC tightened underwriting controls in the second half of 2005, reduced its market share of unsecured personal lending and changed the product mix of new business towards lower-risk customers. In 2006 there were early signs of improvement in more recent unsecured lending. New loan impairment charges also rose in Turkey, by 30 per cent, mainly due to growth in unsecured credit card and personal lending as overall credit quality remained stable. In France, new charges fell, reflecting a stable credit environment and the reduction in charges following the sale of a consumer finance business in the second half of 2005.
Releases and recoveries in Europe of US$860 million were 17 per cent higher than in 2005. Increases in the UK were partially offset by a decline in France. In the UK, increased resources deployed on collection activities combined with a rise in sales of delinquent debt were reflected in significantly higher recoveries. The non-recurrence of several significant recoveries in 2005 led to a large fall in France.
H S B C H O L D I N G S P L C
Report of the Directors: The Management of Risk (continued) Credit risk > Loan impairment charge
206
In Hong Kong, new loan impairment charges declined by 22 per cent to US$243 million, reflecting the non-recurrence of an individual charge in 2005 for a large commercial customer. This was partly offset by a rise in credit card impairments as a result of a rise in balances. Overall, credit quality remained stable as strong economic growth and low levels of unemployment continued.
Releases and recoveries fell by 49 per cent to US$86 million, again mainly as a result of fewer individual impairment releases in the corporate and commercial sector and the non-recurrence of mortgage lending recoveries in 2005, following improvement in the property market since 2004.
In the Rest of Asia-Pacific, there was an 88 per cent rise in new impairment allowances to US$737 million. This was an improvement on the situation in the first half of 2006, when new impairment charges were 111 per cent higher than in the first half of 2005. The year-on-year increase was largely due to Taiwan and, to a lesser extent, Indonesia. During the first half of 2006, new government regulations placing restrictions on collection activity, combined with the popularity of renegotiation schemes offering the opportunity to waive interest and postpone principal payments, led to a sharp rise in credit card defaults, for which a full year charge of US$200 million was recorded. In the second half of 2006, this problem had begun to moderate and new impairment charges were 31 per cent lower than in the first half. In Indonesia, increased loan impairment charges in the personal sector reflected legislation which introduced higher minimum payment rules and a reduction in fuel subsidies. There were further rises in the Middle East, largely due to loan growth. Elsewhere in the region, credit quality was stable.
Releases and recoveries in the region fell by 11 per cent to US$225 million. The fall was mainly in Malaysia and was partly offset by a rise in commercial releases and recoveries in the Middle East.
In North America, new loan impairment charges rose by 36 per cent. Excluding Metris, new charges increased by 30 per cent. Credit deterioration, mainly in second lien, some portions of first lien and adjustable-rate mortgages acquired from third party correspondents through HSBC’s mortgage services business, were the primary cause of the rise in new charges. As the housing market in the US slowed through 2006 and interest rates rose, delinquency trends on both second lien and portions of first lien mortgages originated in 2005 and 2006 were higher than for loans made in previous years. In
addition, the extra payment obligations arising from the repricing of adjustable-rate mortgages to higher rates added to the assessed impairment of the correspondent portfolio, in particular in respect of second lien mortgages ranking behind adjustable-rate first lien mortgages.
As interest rate adjustments will be occurring in an environment of lower home value appreciation and tightening credit, it is estimated that the probability of default on adjustable-rate first mortgages subject to repricing, and on any second lien mortgage loans that are subordinate to an adjustable-rate first lien, will be greater than has been experienced in the past. As a result, loan impairment charges relating to the mortgage services portfolio have increased significantly.
In the second half of 2006, HSBC took action to tighten credit criteria in the mortgage services operation as detailed on page 189. As a consequence, balances in mortgage services declined compared with 30 June 2006.
Notwithstanding the credit weakness witnessed in the mortgage services business, credit delinquency in the majority of the other portfolios, including mortgage balances originated through the branch-based consumer lending business, rose modestly, driven by portfolio ageing and an increased proportion of credit card loans following the Metris acquisition. Partially offsetting factors included the effects of a decline in bankruptcy filings, especially in the first half of 2006 following the spike in the fourth quarter of 2005, low unemployment and the non-recurrence of charges relating to hurricane Katrina.
HSBC in the US closely monitors the two-month-and-over contractual delinquency ratio (being the ratio of two or more months delinquent accounts to gross loans and advances), as management views this as an important indicator of future write-offs. Details are disclosed below. The rise in the total ratio was chiefly as a result of the mortgage services business.
The increase in the US was partly offset by a small decline in new loan impairment charges in Canada, as the strong economy continued to underpin good credit quality.
Releases and recoveries in North America decreased by 23 per cent to US$146 million due to the non-recurrence of recoveries in the US.
In Latin America, new impairment charges rose by 24 per cent to US$1,113 million in 2006. This increase was chiefly attributable to Mexico and, to a lesser extent, Brazil. Strong growth in personal
207
and commercial lending in Mexico resulted in higher new charges. In Brazil, new charges rose by 11 per cent, a significant reduction from the 52 per cent rise reported in 2005, as credit quality improved following enhancements made to underwriting procedures during 2005 and 2006.
Latin American releases and recoveries went up by 7 per cent, largely in Mexico as a result of more stable political and economic conditions.
Year ended 31 December 2005 compared with year ended 31 December 2004 (Unaudited)
Loan impairment charges were US$7,860 million, an increase of 27 per cent compared with 2004. Acquisitions accounted for US$107 million of the rise and US$498 million reflected the non-recurrence of the general provision release in 2004. The total charge remained dominated by the personal sector, with losses in these portfolios representing 92 per cent of the Group’s net loan impairment charge. On a constant currency basis, the trends were as follows.
New allowances for loan impairment charges were US$10,140 million, an increase of 13 per cent compared with 2004. Releases and recoveries of allowances increased by 4 per cent to US$2,280 million. Including a general provision release of US$498 million in 2004, releases and recoveries decreased by 15 per cent.
In Europe, growth in UK personal lending and a weakening in credit quality were the principal causes of a 50 per cent increase in new loan impairment charges to US$3,042 million in 2005. Slower economic growth and weaker employment conditions were compounded by a change in legislation in 2004 that relaxed conditions for personal bankruptcies, which rose to record highs by the final quarter of 2005. In response to these trends in the personal portfolio, HSBC tightened underwriting controls, focusing more on existing relationships and changing the product mix towards lower risk customers. These actions, together with further centralisation of underwriting approvals and revised reward programmes, assisted in mitigating the rate of growth in new impairment charges towards the end of 2005. In the commercial sector, there were a number of individually significant new charges raised in the fourth quarter, as well as a higher rate of new allowances. Although credit charges remained low by historic standards, the trend is progressively moving back to more normal levels. Elsewhere in Europe, France and Italy saw declines in new allowances, due to the sale of a consumer finance subsidiary during the year and the non-recurrence of corporate charges, respectively. In
Turkey, new allowances have increased in line with the growth in the personal loan portfolio.
Releases and recoveries in Europe were US$1,058 million, an increase of 23 per cent. Including a general provision release of US$162 million in 2004, releases and recoveries were broadly in line. Increased releases in Turkey, largely reflecting higher volumes offset the non-recurrence of the general provision release in Switzerland.
New impairment allowances in Hong Kong were US$359 million, a rise of 51 per cent. This was partially attributable to a small number of individual allowances for corporate and commercial customers. However, overall credit quality improved, evidenced by a decline in impaired loans as a proportion of gross advances, reflecting a strong economy with low unemployment.
Releases and recoveries in Hong Kong declined by 53 per cent, including the non-recurrence of a general provision release of US$223 million in 2004. Excluding this, releases and recoveries fell by 9 per cent to US$213 million as the significant number of large corporate releases in 2004 was not repeated. The general provision release last year reflected a review of historical loss experience and the improved market environment.
The effect of strong growth in advances in the Rest of Asia-Pacific produced an 11 per cent rise in new impairment allowances to US$470 million. In particular, increased allowances in Taiwan were driven by a combination of loan growth and an increase in credit card delinquency. There were further increases in Indonesia and the Philippines due to growth in advances, with credit quality stable in both countries. These were partially offset by declines in mainland China and Singapore. In general, across the region, advances to customers rose and credit quality improved. Non-performing assets, as a percentage of advances, fell across most major countries.
In the Rest of Asia-Pacific, releases and recoveries rose by 6 per cent to US$334 million, including the US$48 million general provision release in 2004. Excluding this, releases and recoveries were 24 per cent higher than 2004. There were higher releases and recoveries across most countries in the region reflecting the strong economic environment, although in Malaysia and Singapore there were declines, due to the non-recurrence of the general provision releases in 2004.
New loan impairment allowances in North America declined by 6 per cent. This was despite
H S B C H O L D I N G S P L C
Report of the Directors: The Management of Risk (continued) Credit risk > Loan impairment charge / Loan delinquency in the US
208
loan growth, and the additional credit allowances raised in relation to hurricane Katrina, and accelerated bankruptcy filings in the second half of the year ahead of new legislation in the US. A portion of the increase in bankruptcies was an acceleration of write-offs that would have otherwise been experienced in future periods. In an effort to assist customers affected by hurricane Katrina, HSBC initiated various programmes, including extended payment arrangements. The reduction in the charge also reflected the non-recurrence of a US$47 million charge in 2004, following the adoption of FFIEC write-off policies relating to retail and credit card balances. Excluding these factors, credit quality improved year on year, reflecting an improving economic environment. This contributed to the fall in new impairment allowances, which was only partially offset by increased requirements due to loan growth. HSBC has benefited from the shift in the balance of the consumer lending business towards higher credit quality customers. HSBC Finance monitors the two-month-and-over contractual delinquency ratio closely, as management views it as an important indicator of future write-offs. The ratio declined from 4.0 per cent at 31 December 2004 to 3.6 per cent at 30 June 2005, rising to 3.7 per cent at 31 December 2005. Lending in the US is primarily in the personal sector. Credit quality in the commercial portfolio was stable in 2005. The favourable trends in the US were partially offset by rises in new allowances in Canada which were largely driven by personal loan growth in recent years, with an improvement in underlying credit quality.
Releases and recoveries in North America were modestly lower than in 2005. Including the 2004 general provision release of US$45 million, releases and recoveries declined by 31 per cent. In the US, a rise in releases reflected an improved credit
environment and a strong economy. Under IFRSs, from 1 January 2005 certain recoverable amounts were incorporated into the loan impairment charge directly resulting in lower reported recoveries. There were further decreases in Bank of Bermuda, following the non-recurrence of the general provision release in 2004. These declines were offset by a more than five-fold increase in releases in Canada, where better credit quality was driven by improved economic conditions, particularly in the resource-driven economy of western Canada.
In Latin America, new impairment allowances in Brazil were the principal cause of a 60 per cent rise in new charges to US$898 million in 2005. In Brazil, significant growth of 24 per cent in gross advances, coupled with deteriorating credit quality in the consumer finance business, were the main contributing factors to this increase. Lending growth combined with a move into the low-income segment, where finances have been stretched by higher interest rates, drove higher delinquency. Changes were made to underwriting procedures during the year, to improve the credit quality of new business. This resulted in a falling impairment charge to asset ratio towards the end of the year. In Mexico, new allowances also rose, chiefly due to lending growth. New allowances in Argentina were in line with 2004.
Releases and recoveries in Latin America were broadly in line with 2004. Recoveries in Brazil rose as a result of improved collections, compounded by higher releases as a result of greater volumes of advances. In Mexico, releases and recoveries declined following the non-recurrence of a large number of recoveries in 2004. Releases in Argentina fell as impaired loans reduced. The combined fall in Argentina and Mexico offset the rise in Brazil.
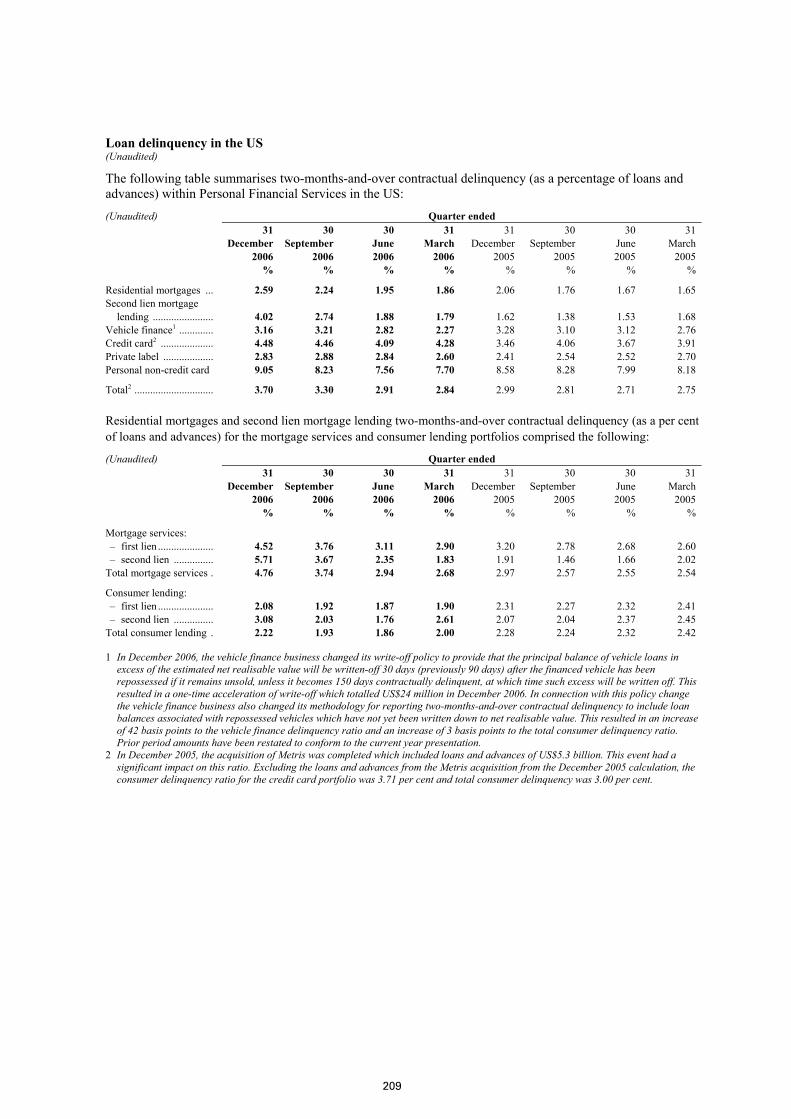
209
Loan delinquency in the US (Unaudited)
The following table summarises two-months-and-over contractual delinquency (as a percentage of loans and advances) within Personal Financial Services in the US: (Unaudited) Quarter ended 31
December 2006
30 September 2006
30 June 2006
31 March 2006
31 December 2005
30 September 2005
30 June 2005
31 March 2005
% % % % % % % %
Residential mortgages ... 2.59 2.24 1.95 1.86 2.06 1.76 1.67 1.65 Second lien mortgage
lending ....................... 4.02 2.74 1.88 1.79 1.62 1.38 1.53 1.68 Vehicle finance1 ............. 3.16 3.21 2.82 2.27 3.28 3.10 3.12 2.76 Credit card2 .................... 4.48 4.46 4.09 4.28 3.46 4.06 3.67 3.91 Private label ................... 2.83 2.88 2.84 2.60 2.41 2.54 2.52 2.70 Personal non-credit card 9.05 8.23 7.56 7.70 8.58 8.28 7.99 8.18
Total2 .............................. 3.70 3.30 2.91 2.84 2.99 2.81 2.71 2.75
Residential mortgages and second lien mortgage lending two-months-and-over contractual delinquency (as a per cent of loans and advances) for the mortgage services and consumer lending portfolios comprised the following:
(Unaudited) Quarter ended 31
December 2006
30 September 2006
30 June 2006
31 March 2006
31 December 2005
30 September 2005
30 June 2005
31 March 2005
% % % % % % % %
Mortgage services: – first lien ..................... 4.52 3.76 3.11 2.90 3.20 2.78 2.68 2.60 – second lien ............... 5.71 3.67 2.35 1.83 1.91 1.46 1.66 2.02
Total mortgage services . 4.76 3.74 2.94 2.68 2.97 2.57 2.55 2.54
Consumer lending: – first lien ..................... 2.08 1.92 1.87 1.90 2.31 2.27 2.32 2.41 – second lien ............... 3.08 2.03 1.76 2.61 2.07 2.04 2.37 2.45
Total consumer lending . 2.22 1.93 1.86 2.00 2.28 2.24 2.32 2.42
1 In December 2006, the vehicle finance business changed its write-off policy to provide that the principal balance of vehicle loans in excess of the estimated net realisable value will be written-off 30 days (previously 90 days) after the financed vehicle has been repossessed if it remains unsold, unless it becomes 150 days contractually delinquent, at which time such excess will be written off. This resulted in a one-time acceleration of write-off which totalled US$24 million in December 2006. In connection with this policy change the vehicle finance business also changed its methodology for reporting two-months-and-over contractual delinquency to include loan balances associated with repossessed vehicles which have not yet been written down to net realisable value. This resulted in an increase of 42 basis points to the vehicle finance delinquency ratio and an increase of 3 basis points to the total consumer delinquency ratio. Prior period amounts have been restated to conform to the current year presentation.
2 In December 2005, the acquisition of Metris was completed which included loans and advances of US$5.3 billion. This event had a significant impact on this ratio. Excluding the loans and advances from the Metris acquisition from the December 2005 calculation, the consumer delinquency ratio for the credit card portfolio was 3.71 per cent and total consumer delinquency was 3.00 per cent.
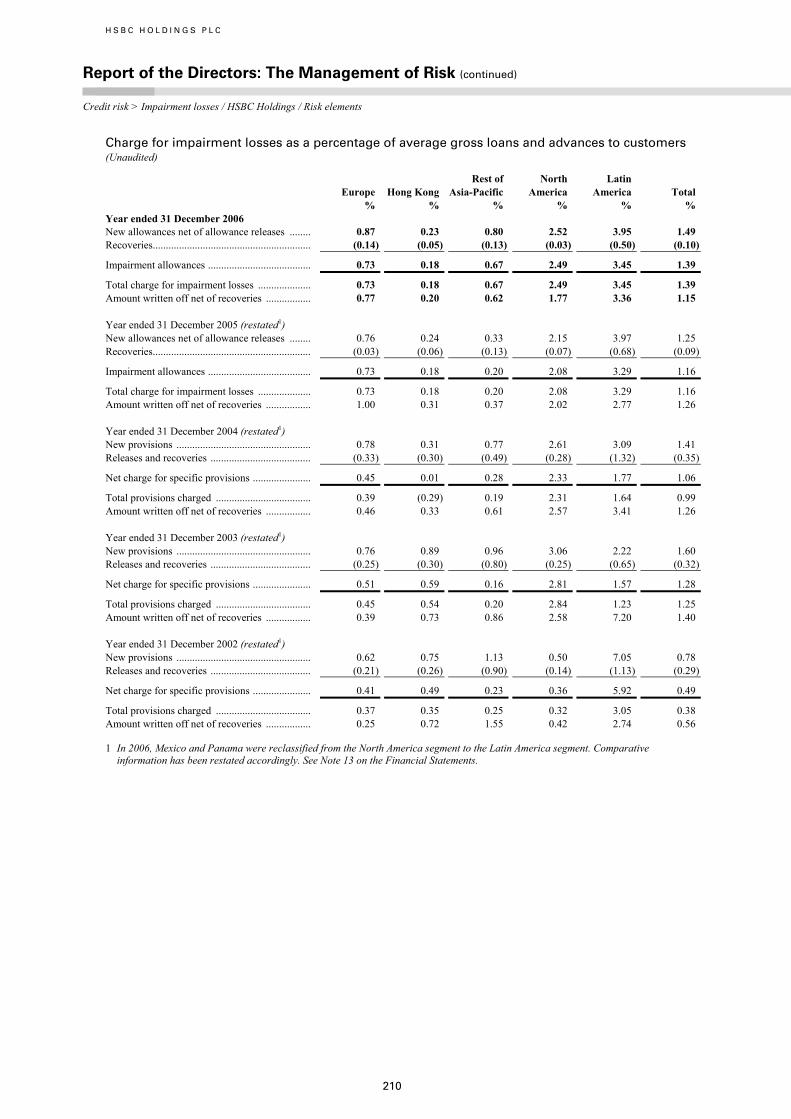
H S B C H O L D I N G S P L C
Report of the Directors: The Management of Risk (continued) Credit risk > Impairment losses / HSBC Holdings / Risk elements
210
Charge for impairment losses as a percentage of average gross loans and advances to customers (Unaudited)
Europe %
Hong Kong %
Rest of Asia-Pacific %
North America %
Latin America %
Total %
Year ended 31 December 2006 New allowances net of allowance releases ........ 0.87 0.23 0.80 2.52 3.95 1.49 Recoveries............................................................ (0.14) (0.05) (0.13) (0.03) (0.50) (0.10)
Impairment allowances ....................................... 0.73 0.18 0.67 2.49 3.45 1.39
Total charge for impairment losses .................... 0.73 0.18 0.67 2.49 3.45 1.39 Amount written off net of recoveries ................. 0.77 0.20 0.62 1.77 3.36 1.15 Year ended 31 December 2005 (restated1) New allowances net of allowance releases ........ 0.76 0.24 0.33 2.15 3.97 1.25 Recoveries............................................................ (0.03) (0.06) (0.13) (0.07) (0.68) (0.09)
Impairment allowances ....................................... 0.73 0.18 0.20 2.08 3.29 1.16
Total charge for impairment losses .................... 0.73 0.18 0.20 2.08 3.29 1.16 Amount written off net of recoveries ................. 1.00 0.31 0.37 2.02 2.77 1.26 Year ended 31 December 2004 (restated1) New provisions ................................................... 0.78 0.31 0.77 2.61 3.09 1.41 Releases and recoveries ...................................... (0.33) (0.30) (0.49) (0.28) (1.32) (0.35)
Net charge for specific provisions ...................... 0.45 0.01 0.28 2.33 1.77 1.06
Total provisions charged .................................... 0.39 (0.29) 0.19 2.31 1.64 0.99 Amount written off net of recoveries ................. 0.46 0.33 0.61 2.57 3.41 1.26 Year ended 31 December 2003 (restated1) New provisions ................................................... 0.76 0.89 0.96 3.06 2.22 1.60 Releases and recoveries ...................................... (0.25) (0.30) (0.80) (0.25) (0.65) (0.32)
Net charge for specific provisions ...................... 0.51 0.59 0.16 2.81 1.57 1.28
Total provisions charged .................................... 0.45 0.54 0.20 2.84 1.23 1.25 Amount written off net of recoveries ................. 0.39 0.73 0.86 2.58 7.20 1.40 Year ended 31 December 2002 (restated1) New provisions ................................................... 0.62 0.75 1.13 0.50 7.05 0.78 Releases and recoveries ...................................... (0.21) (0.26) (0.90) (0.14) (1.13) (0.29)
Net charge for specific provisions ...................... 0.41 0.49 0.23 0.36 5.92 0.49
Total provisions charged .................................... 0.37 0.35 0.25 0.32 3.05 0.38 Amount written off net of recoveries ................. 0.25 0.72 1.55 0.42 2.74 0.56
1 In 2006, Mexico and Panama were reclassified from the North America segment to the Latin America segment. Comparative information has been restated accordingly. See Note 13 on the Financial Statements.
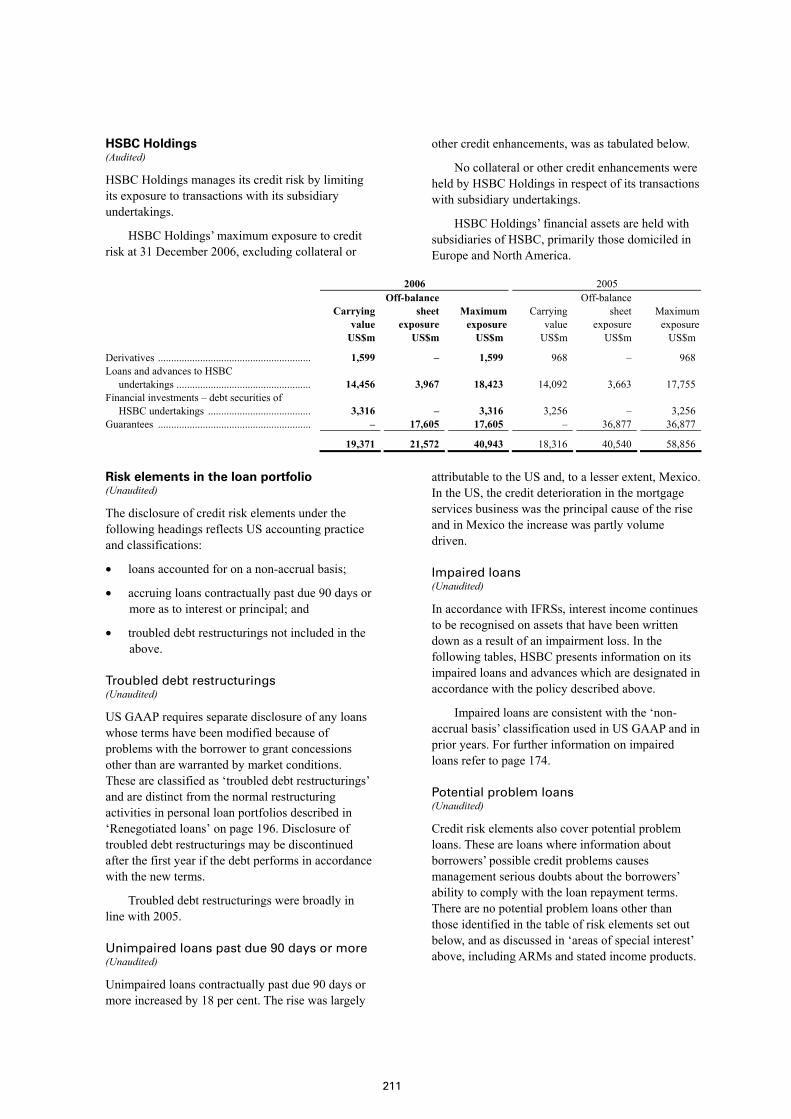
211
HSBC Holdings (Audited)
HSBC Holdings manages its credit risk by limiting its exposure to transactions with its subsidiary undertakings.
HSBC Holdings’ maximum exposure to credit risk at 31 December 2006, excluding collateral or
other credit enhancements, was as tabulated below.
No collateral or other credit enhancements were held by HSBC Holdings in respect of its transactions with subsidiary undertakings.
HSBC Holdings’ financial assets are held with subsidiaries of HSBC, primarily those domiciled in Europe and North America.
2006 2005
Carrying value
Off-balance sheet exposure
Maximum exposure
Carrying value
Off-balance sheet exposure
Maximum exposure
US$m US$m US$m US$m US$m US$m
Derivatives .......................................................... 1,599 – 1,599 968 – 968 Loans and advances to HSBC
undertakings ................................................... 14,456 3,967 18,423 14,092 3,663 17,755 Financial investments – debt securities of
HSBC undertakings ....................................... 3,316 – 3,316 3,256 – 3,256 Guarantees .......................................................... – 17,605 17,605 – 36,877 36,877
19,371 21,572 40,943 18,316 40,540 58,856
Risk elements in the loan portfolio (Unaudited)
The disclosure of credit risk elements under the following headings reflects US accounting practice and classifications:
• loans accounted for on a non-accrual basis;
• accruing loans contractually past due 90 days or more as to interest or principal; and
• troubled debt restructurings not included in the above.
Troubled debt restructurings (Unaudited)
US GAAP requires separate disclosure of any loans whose terms have been modified because of problems with the borrower to grant concessions other than are warranted by market conditions. These are classified as ‘troubled debt restructurings’ and are distinct from the normal restructuring activities in personal loan portfolios described in ‘Renegotiated loans’ on page 196. Disclosure of troubled debt restructurings may be discontinued after the first year if the debt performs in accordance with the new terms.
Troubled debt restructurings were broadly in line with 2005.
Unimpaired loans past due 90 days or more (Unaudited)
Unimpaired loans contractually past due 90 days or more increased by 18 per cent. The rise was largely
attributable to the US and, to a lesser extent, Mexico. In the US, the credit deterioration in the mortgage services business was the principal cause of the rise and in Mexico the increase was partly volume driven.
Impaired loans (Unaudited)
In accordance with IFRSs, interest income continues to be recognised on assets that have been written down as a result of an impairment loss. In the following tables, HSBC presents information on its impaired loans and advances which are designated in accordance with the policy described above.
Impaired loans are consistent with the ‘non-accrual basis’ classification used in US GAAP and in prior years. For further information on impaired loans refer to page 174.
Potential problem loans (Unaudited)
Credit risk elements also cover potential problem loans. These are loans where information about borrowers’ possible credit problems causes management serious doubts about the borrowers’ ability to comply with the loan repayment terms. There are no potential problem loans other than those identified in the table of risk elements set out below, and as discussed in ‘areas of special interest’ above, including ARMs and stated income products.
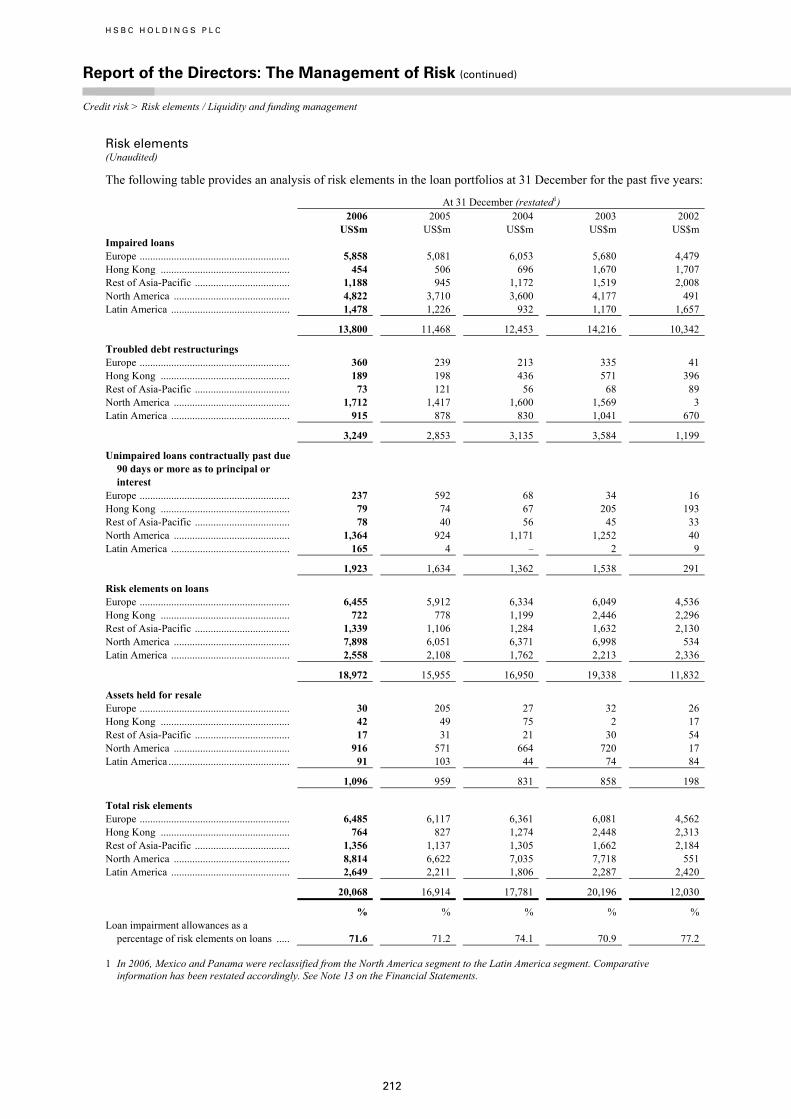
H S B C H O L D I N G S P L C
Report of the Directors: The Management of Risk (continued) Credit risk > Risk elements / Liquidity and funding management
212
Risk elements (Unaudited)
The following table provides an analysis of risk elements in the loan portfolios at 31 December for the past five years:
At 31 December (restated1) 2006
US$m 2005
US$m 2004
US$m 2003 US$m
2002 US$m
Impaired loans Europe ......................................................... 5,858 5,081 6,053 5,680 4,479 Hong Kong ................................................. 454 506 696 1,670 1,707 Rest of Asia-Pacific .................................... 1,188 945 1,172 1,519 2,008 North America ............................................ 4,822 3,710 3,600 4,177 491 Latin America ............................................. 1,478 1,226 932 1,170 1,657
13,800 11,468 12,453 14,216 10,342
Troubled debt restructurings Europe ......................................................... 360 239 213 335 41 Hong Kong ................................................. 189 198 436 571 396 Rest of Asia-Pacific .................................... 73 121 56 68 89 North America ............................................ 1,712 1,417 1,600 1,569 3 Latin America ............................................. 915 878 830 1,041 670
3,249 2,853 3,135 3,584 1,199
Unimpaired loans contractually past due 90 days or more as to principal or interest
Europe ......................................................... 237 592 68 34 16 Hong Kong ................................................. 79 74 67 205 193 Rest of Asia-Pacific .................................... 78 40 56 45 33 North America ............................................ 1,364 924 1,171 1,252 40 Latin America ............................................. 165 4 – 2 9
1,923 1,634 1,362 1,538 291
Risk elements on loans Europe ......................................................... 6,455 5,912 6,334 6,049 4,536 Hong Kong ................................................. 722 778 1,199 2,446 2,296 Rest of Asia-Pacific .................................... 1,339 1,106 1,284 1,632 2,130 North America ............................................ 7,898 6,051 6,371 6,998 534 Latin America ............................................. 2,558 2,108 1,762 2,213 2,336
18,972 15,955 16,950 19,338 11,832
Assets held for resale Europe ......................................................... 30 205 27 32 26 Hong Kong ................................................. 42 49 75 2 17 Rest of Asia-Pacific .................................... 17 31 21 30 54 North America ............................................ 916 571 664 720 17 Latin America .............................................. 91 103 44 74 84
1,096 959 831 858 198
Total risk elements Europe ......................................................... 6,485 6,117 6,361 6,081 4,562 Hong Kong ................................................. 764 827 1,274 2,448 2,313 Rest of Asia-Pacific .................................... 1,356 1,137 1,305 1,662 2,184 North America ............................................ 8,814 6,622 7,035 7,718 551 Latin America ............................................. 2,649 2,211 1,806 2,287 2,420
20,068 16,914 17,781 20,196 12,030
% % % % % Loan impairment allowances as a
percentage of risk elements on loans ..... 71.6 71.2
74.1 70.9 77.2
1 In 2006, Mexico and Panama were reclassified from the North America segment to the Latin America segment. Comparative information has been restated accordingly. See Note 13 on the Financial Statements.
213
Liquidity and funding management (Audited)
Liquidity risk is the risk that HSBC does not have sufficient financial resources to meet its obligations when they fall due, or will have to do so at excessive cost. This risk can arise from mismatches in the timing of cash flows. Funding risk (a particular form of liquidity risk) arises when the necessary liquidity to fund illiquid asset positions cannot be obtained at the expected terms and when required.
The objective of HSBC’s liquidity and funding management is to ensure that all foreseeable funding commitments and deposit withdrawals can be met when due, and that wholesale market access is co-ordinated and cost effective. It is HSBC’s objective to maintain a diversified and stable funding base comprising core retail and corporate customer deposits and institutional balances. This is augmented by wholesale funding and portfolios of highly liquid assets which are diversified by currency and maturity, with the objective of enabling HSBC to respond quickly and smoothly to unforeseen liquidity requirements.
HSBC requires operating entities to maintain a strong liquidity position and to manage the liquidity profile of their assets, liabilities and commitments with the objective of ensuring that cash flows are appropriately balanced and all obligations are met when due.
Policies and procedures (Audited)
The management of liquidity and funding is primarily carried out locally in the operating companies of HSBC in accordance with practices and limits set by the Group Management Board. These limits vary by local financial unit to take account of the depth and liquidity of the market in which the entity operates. It is HSBC’s general policy that each banking entity should be self-sufficient with regards to funding its own operations. Exceptions are permitted to facilitate the efficient funding of certain short-term treasury requirements and start-up operations or branches which do not have access to local deposit markets, all of which are funded under clearly defined internal and regulatory guidelines and limits from HSBC’s largest banking operations. These internal and regulatory limits and guidelines serve to place formal limitations on the transfer of resources between HSBC entities and are necessary to reflect the broad range of currencies, markets and time zones within which HSBC operates.
The Group’s liquidity and funding management process includes:
• projecting cash flows by major currency and considering the level of liquid assets necessary in relation thereto;
• monitoring balance sheet liquidity ratios against internal and regulatory requirements;
• maintaining a diverse range of funding sources with adequate back-up facilities;
• managing the concentration and profile of debt maturities;
• maintaining debt financing plans;
• monitoring depositor concentration in order to avoid undue reliance on large individual depositors and ensuring a satisfactory overall funding mix; and
• maintaining liquidity and funding contingency plans. These plans identify early indicators of stress conditions and describe actions to be taken in the event of difficulties arising from systemic or other crises, while minimising adverse long-term implications for the business.
Primary sources of funding (Audited)
Current accounts and savings deposits payable on demand or at short notice form a significant part of HSBC’s funding. HSBC places considerable importance on maintaining the stability of these deposits.
The stability of deposits, which are a primary source of funding, depends upon maintaining depositor confidence in HSBC’s capital strength and liquidity, and on competitive and transparent deposit-pricing strategies.
HSBC also accesses professional markets in order to provide funding for non-banking subsidiaries that do not accept deposits, to maintain a presence in local money markets and to optimise the funding of asset maturities not naturally matched by core deposit funding. In aggregate, HSBC’s banking entities are liquidity providers to the inter-bank market, placing significantly more funds with other banks than they borrow.
The main operating subsidiary that does not accept deposits is HSBC Finance, which funds itself principally through taking term funding in the professional markets and through the securitisation of assets. At 31 December 2006, US$150 billion (2005: US$132 billion) of HSBC Finance’s
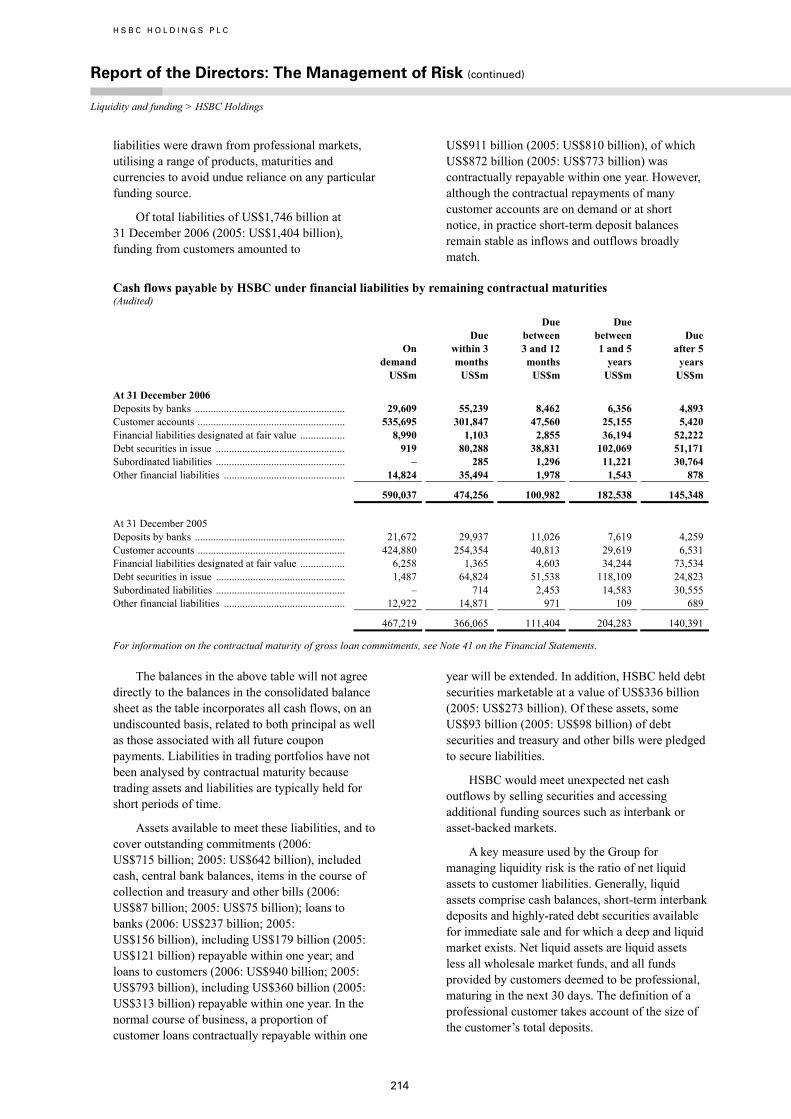
H S B C H O L D I N G S P L C
Report of the Directors: The Management of Risk (continued) Liquidity and funding > HSBC Holdings
214
liabilities were drawn from professional markets, utilising a range of products, maturities and currencies to avoid undue reliance on any particular funding source.
Of total liabilities of US$1,746 billion at 31 December 2006 (2005: US$1,404 billion), funding from customers amounted to
US$911 billion (2005: US$810 billion), of which US$872 billion (2005: US$773 billion) was contractually repayable within one year. However, although the contractual repayments of many customer accounts are on demand or at short notice, in practice short-term deposit balances remain stable as inflows and outflows broadly match.
Cash flows payable by HSBC under financial liabilities by remaining contractual maturities (Audited)
On demand US$m
Due within 3 months US$m
Due between 3 and 12 months US$m
Due between 1 and 5 years US$m
Due after 5 years US$m
At 31 December 2006 Deposits by banks ......................................................... 29,609 55,239 8,462 6,356 4,893 Customer accounts ........................................................ 535,695 301,847 47,560 25,155 5,420 Financial liabilities designated at fair value ................. 8,990 1,103 2,855 36,194 52,222 Debt securities in issue ................................................. 919 80,288 38,831 102,069 51,171 Subordinated liabilities ................................................. – 285 1,296 11,221 30,764 Other financial liabilities .............................................. 14,824 35,494 1,978 1,543 878
590,037 474,256 100,982 182,538 145,348 At 31 December 2005 Deposits by banks ......................................................... 21,672 29,937 11,026 7,619 4,259 Customer accounts ........................................................ 424,880 254,354 40,813 29,619 6,531 Financial liabilities designated at fair value ................. 6,258 1,365 4,603 34,244 73,534 Debt securities in issue ................................................. 1,487 64,824 51,538 118,109 24,823 Subordinated liabilities ................................................. – 714 2,453 14,583 30,555 Other financial liabilities .............................................. 12,922 14,871 971 109 689
467,219 366,065 111,404 204,283 140,391
For information on the contractual maturity of gross loan commitments, see Note 41 on the Financial Statements.
The balances in the above table will not agree directly to the balances in the consolidated balance sheet as the table incorporates all cash flows, on an undiscounted basis, related to both principal as well as those associated with all future coupon payments. Liabilities in trading portfolios have not been analysed by contractual maturity because trading assets and liabilities are typically held for short periods of time.
Assets available to meet these liabilities, and to cover outstanding commitments (2006: US$715 billion; 2005: US$642 billion), included cash, central bank balances, items in the course of collection and treasury and other bills (2006: US$87 billion; 2005: US$75 billion); loans to banks (2006: US$237 billion; 2005: US$156 billion), including US$179 billion (2005: US$121 billion) repayable within one year; and loans to customers (2006: US$940 billion; 2005: US$793 billion), including US$360 billion (2005: US$313 billion) repayable within one year. In the normal course of business, a proportion of customer loans contractually repayable within one
year will be extended. In addition, HSBC held debt securities marketable at a value of US$336 billion (2005: US$273 billion). Of these assets, some US$93 billion (2005: US$98 billion) of debt securities and treasury and other bills were pledged to secure liabilities.
HSBC would meet unexpected net cash outflows by selling securities and accessing additional funding sources such as interbank or asset-backed markets.
A key measure used by the Group for managing liquidity risk is the ratio of net liquid assets to customer liabilities. Generally, liquid assets comprise cash balances, short-term interbank deposits and highly-rated debt securities available for immediate sale and for which a deep and liquid market exists. Net liquid assets are liquid assets less all wholesale market funds, and all funds provided by customers deemed to be professional, maturing in the next 30 days. The definition of a professional customer takes account of the size of the customer’s total deposits.
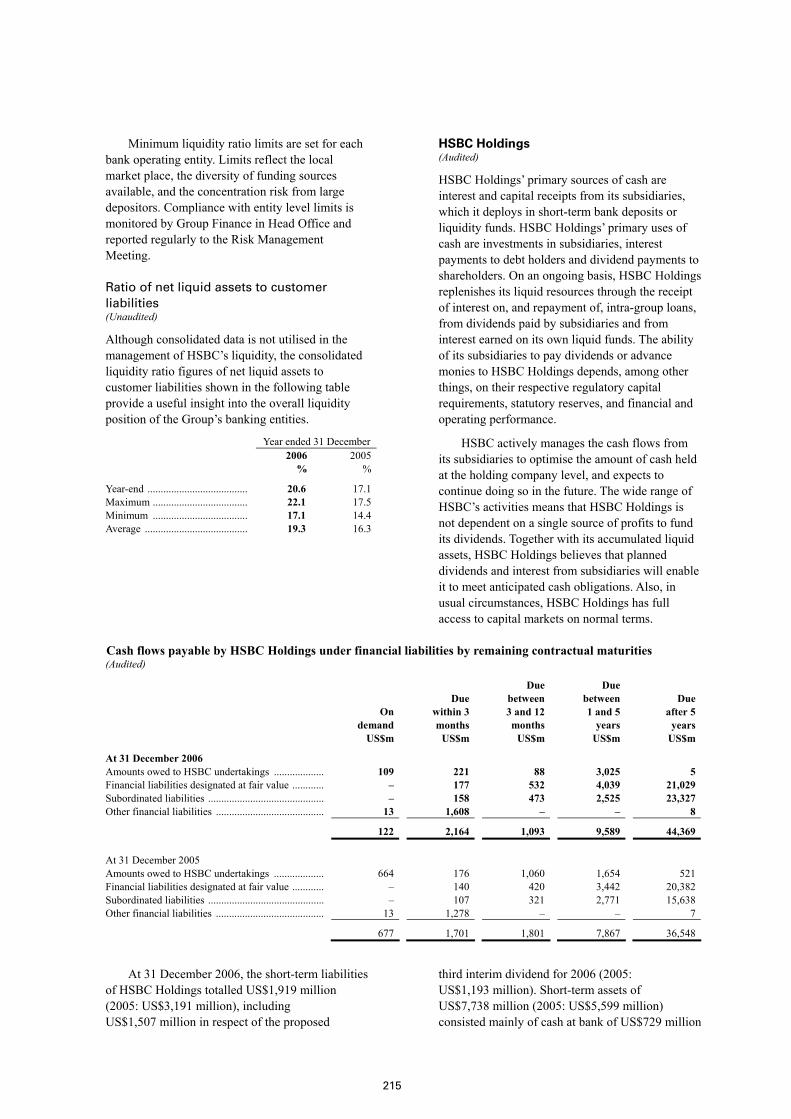
215
Minimum liquidity ratio limits are set for each bank operating entity. Limits reflect the local market place, the diversity of funding sources available, and the concentration risk from large depositors. Compliance with entity level limits is monitored by Group Finance in Head Office and reported regularly to the Risk Management Meeting.
Ratio of net liquid assets to customer liabilities (Unaudited)
Although consolidated data is not utilised in the management of HSBC’s liquidity, the consolidated liquidity ratio figures of net liquid assets to customer liabilities shown in the following table provide a useful insight into the overall liquidity position of the Group’s banking entities.
Year ended 31 December 2006 2005 % %
Year-end ...................................... 20.6 17.1 Maximum .................................... 22.1 17.5 Minimum .................................... 17.1 14.4 Average ....................................... 19.3 16.3
HSBC Holdings (Audited)
HSBC Holdings’ primary sources of cash are interest and capital receipts from its subsidiaries, which it deploys in short-term bank deposits or liquidity funds. HSBC Holdings’ primary uses of cash are investments in subsidiaries, interest payments to debt holders and dividend payments to shareholders. On an ongoing basis, HSBC Holdings replenishes its liquid resources through the receipt of interest on, and repayment of, intra-group loans, from dividends paid by subsidiaries and from interest earned on its own liquid funds. The ability of its subsidiaries to pay dividends or advance monies to HSBC Holdings depends, among other things, on their respective regulatory capital requirements, statutory reserves, and financial and operating performance.
HSBC actively manages the cash flows from its subsidiaries to optimise the amount of cash held at the holding company level, and expects to continue doing so in the future. The wide range of HSBC’s activities means that HSBC Holdings is not dependent on a single source of profits to fund its dividends. Together with its accumulated liquid assets, HSBC Holdings believes that planned dividends and interest from subsidiaries will enable it to meet anticipated cash obligations. Also, in usual circumstances, HSBC Holdings has full access to capital markets on normal terms.
Cash flows payable by HSBC Holdings under financial liabilities by remaining contractual maturities (Audited)
On demand
Due within 3 months
Due between 3 and 12 months
Due between 1 and 5 years
Due after 5 years
US$m US$m US$m US$m US$m
At 31 December 2006 Amounts owed to HSBC undertakings ................... 109 221 88 3,025 5 Financial liabilities designated at fair value ............ – 177 532 4,039 21,029 Subordinated liabilities ............................................ – 158 473 2,525 23,327 Other financial liabilities ......................................... 13 1,608 – – 8
122 2,164 1,093 9,589 44,369 At 31 December 2005 Amounts owed to HSBC undertakings ................... 664 176 1,060 1,654 521 Financial liabilities designated at fair value ............ – 140 420 3,442 20,382 Subordinated liabilities ............................................ – 107 321 2,771 15,638 Other financial liabilities ......................................... 13 1,278 – – 7
677 1,701 1,801 7,867 36,548
At 31 December 2006, the short-term liabilities of HSBC Holdings totalled US$1,919 million (2005: US$3,191 million), including US$1,507 million in respect of the proposed
third interim dividend for 2006 (2005: US$1,193 million). Short-term assets of US$7,738 million (2005: US$5,599 million) consisted mainly of cash at bank of US$729 million
H S B C H O L D I N G S P L C
Report of the Directors: The Management of Risk (continued) Market risk > Value at risk
216
(2005: US$756 million) and loans and advances to HSBC undertakings of US$6,886 million (2005: US$4,661 million).
Market risk management (Audited)
The objective of HSBC’s market risk management is to manage and control market risk exposures in order to optimise return on risk while maintaining a market profile consistent with the Group’s status as a premier provider of financial products and services.
Market risk is the risk that movements in market risk factors, including foreign exchange rates and commodity prices, interest rates, credit spreads and equity prices will reduce HSBC’s income or the value of its portfolios. Credit risk is discussed separately in the Credit risk section on page 171.
HSBC separates exposures to market risk into either trading or non-trading portfolios. Trading portfolios include those positions arising from market-making, proprietary position-taking and other marked-to-market positions so designated. The contribution of the marked-to-market positions so designated but not held with trading intent is disclosed separately.
Non-trading portfolios primarily arise from the interest rate management of HSBC’s retail and commercial banking assets and liabilities.
The management of market risk is principally undertaken in Global Markets using risk limits approved by the Group Management Board. Limits are set for portfolios, products and risk types, with market liquidity being a principal factor in determining the level of limits set. Traded Credit and Market Risk, an independent unit within Corporate, Investment Banking and Markets, develops the Group’s market risk management policies and measurement techniques. Each major operating entity has an independent market risk control function which is responsible for measuring market risk exposures in accordance with the policies defined by Traded Credit and Market Risk, and monitoring and reporting these exposures against the prescribed limits on a daily basis.
Each operating entity is required to assess the market risks which arise on each product in its business and to transfer these risks to either its local Global Markets unit for management, or to separate books managed under the supervision of the local Asset and Liability Management Committee (‘ALCO’). The aim is to ensure that all
market risks are consolidated within operations which have the necessary skills, tools, management and governance to manage such risks professionally.
Value at risk (‘VAR’) (Audited)
One of the principal tools used by HSBC to monitor and limit market risk exposure is VAR. VAR is a technique that estimates the potential losses that could occur on risk positions as a result of movements in market rates and prices over a specified time horizon and to a given level of confidence.
The VAR models used by HSBC are predominantly based on historical simulation. The historical simulation models derive plausible future scenarios from historical market rate time series, taking account of inter-relationships between different markets and rates, for example, between interest rates and foreign exchange rates. The models also incorporate the impact of option features in the underlying exposures.
The historical simulation models used by HSBC incorporate the following features:
• potential market movements are calculated with reference to data from the last two years;
• historical market rates and prices are calculated with reference to foreign exchange rates and commodity prices, interest rates, equity prices and the associated volatilities;
• VAR is calculated to a 99 per cent confidence level; and
• VAR is calculated for a one-day holding period.
HSBC routinely validates the accuracy of its VAR models by backtesting the actual daily profit and loss results, adjusted to remove non-modelled items such as fees and commissions, against the corresponding VAR numbers. Statistically, HSBC would expect to see losses in excess of VAR only one per cent of the time over a one-year period. The actual number of excesses over this period can therefore be used to gauge how well the models are performing.
Although a valuable guide to risk, VAR should always be viewed in the context of its limitations. For example:
• the use of historical data as a proxy for estimating future events may not encompass all potential events, particularly those which are extreme in nature;
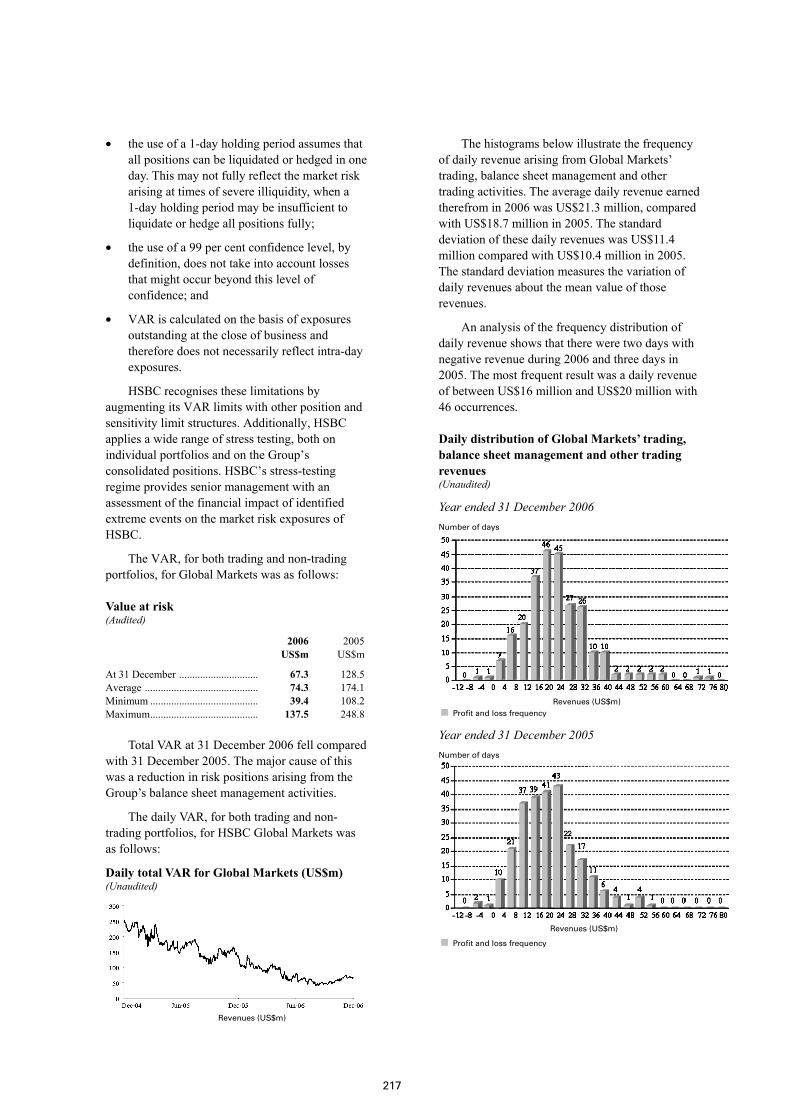
217
• the use of a 1-day holding period assumes that all positions can be liquidated or hedged in one day. This may not fully reflect the market risk arising at times of severe illiquidity, when a 1-day holding period may be insufficient to liquidate or hedge all positions fully;
• the use of a 99 per cent confidence level, by definition, does not take into account losses that might occur beyond this level of confidence; and
• VAR is calculated on the basis of exposures outstanding at the close of business and therefore does not necessarily reflect intra-day exposures.
HSBC recognises these limitations by augmenting its VAR limits with other position and sensitivity limit structures. Additionally, HSBC applies a wide range of stress testing, both on individual portfolios and on the Group’s consolidated positions. HSBC’s stress-testing regime provides senior management with an assessment of the financial impact of identified extreme events on the market risk exposures of HSBC.
The VAR, for both trading and non-trading portfolios, for Global Markets was as follows:
Value at risk (Audited)
2006 2005 US$m US$m
At 31 December .............................. 67.3 128.5 Average ........................................... 74.3 174.1 Minimum ......................................... 39.4 108.2 Maximum......................................... 137.5 248.8
Total VAR at 31 December 2006 fell compared with 31 December 2005. The major cause of this was a reduction in risk positions arising from the Group’s balance sheet management activities.
The daily VAR, for both trading and non-trading portfolios, for HSBC Global Markets was as follows:
Daily total VAR for Global Markets (US$m) (Unaudited)
Revenues (US$m)
The histograms below illustrate the frequency of daily revenue arising from Global Markets’ trading, balance sheet management and other trading activities. The average daily revenue earned therefrom in 2006 was US$21.3 million, compared with US$18.7 million in 2005. The standard deviation of these daily revenues was US$11.4 million compared with US$10.4 million in 2005. The standard deviation measures the variation of daily revenues about the mean value of those revenues.
An analysis of the frequency distribution of daily revenue shows that there were two days with negative revenue during 2006 and three days in 2005. The most frequent result was a daily revenue of between US$16 million and US$20 million with 46 occurrences.
Daily distribution of Global Markets’ trading, balance sheet management and other trading revenues (Unaudited)
Year ended 31 December 2006 Number of days
Revenues (US$m)
Profit and loss frequency
Year ended 31 December 2005 Number of days
Revenues (US$m)
Profit and loss frequency
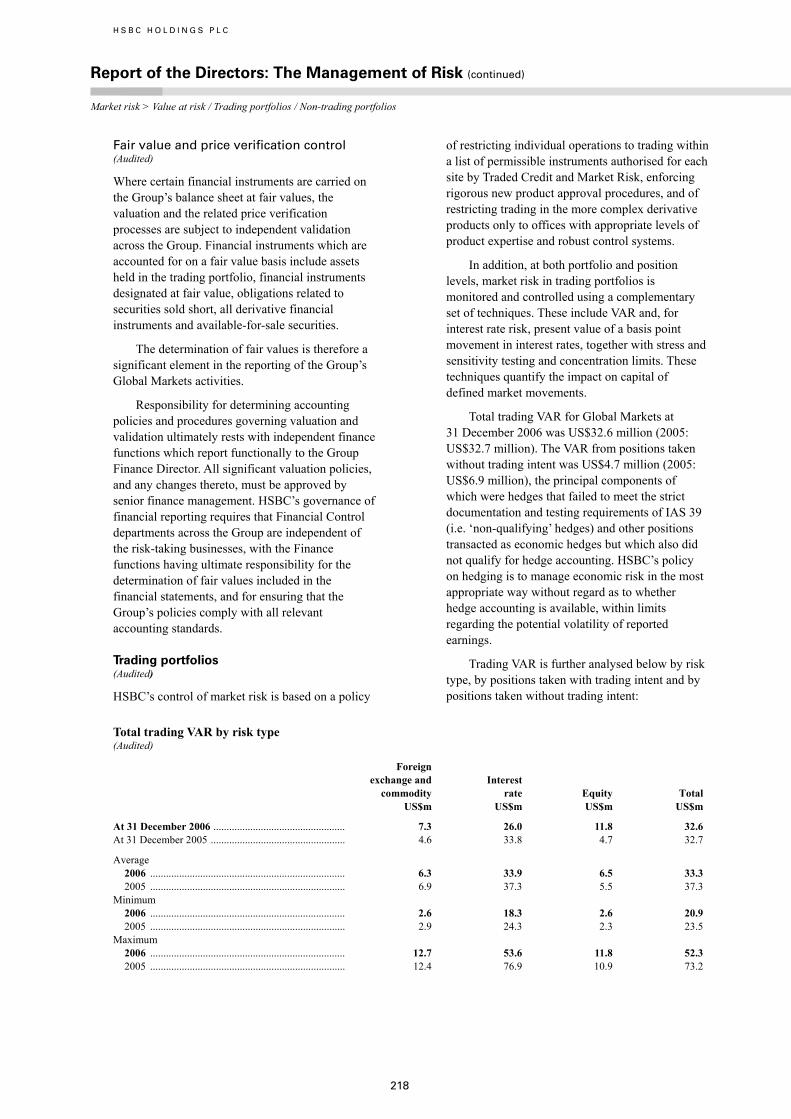
H S B C H O L D I N G S P L C
Report of the Directors: The Management of Risk (continued) Market risk > Value at risk / Trading portfolios / Non-trading portfolios
218
Fair value and price verification control (Audited)
Where certain financial instruments are carried on the Group’s balance sheet at fair values, the valuation and the related price verification processes are subject to independent validation across the Group. Financial instruments which are accounted for on a fair value basis include assets held in the trading portfolio, financial instruments designated at fair value, obligations related to securities sold short, all derivative financial instruments and available-for-sale securities.
The determination of fair values is therefore a significant element in the reporting of the Group’s Global Markets activities.
Responsibility for determining accounting policies and procedures governing valuation and validation ultimately rests with independent finance functions which report functionally to the Group Finance Director. All significant valuation policies, and any changes thereto, must be approved by senior finance management. HSBC’s governance of financial reporting requires that Financial Control departments across the Group are independent of the risk-taking businesses, with the Finance functions having ultimate responsibility for the determination of fair values included in the financial statements, and for ensuring that the Group’s policies comply with all relevant accounting standards.
Trading portfolios (Audited)
HSBC’s control of market risk is based on a policy
of restricting individual operations to trading within a list of permissible instruments authorised for each site by Traded Credit and Market Risk, enforcing rigorous new product approval procedures, and of restricting trading in the more complex derivative products only to offices with appropriate levels of product expertise and robust control systems.
In addition, at both portfolio and position levels, market risk in trading portfolios is monitored and controlled using a complementary set of techniques. These include VAR and, for interest rate risk, present value of a basis point movement in interest rates, together with stress and sensitivity testing and concentration limits. These techniques quantify the impact on capital of defined market movements.
Total trading VAR for Global Markets at 31 December 2006 was US$32.6 million (2005: US$32.7 million). The VAR from positions taken without trading intent was US$4.7 million (2005: US$6.9 million), the principal components of which were hedges that failed to meet the strict documentation and testing requirements of IAS 39 (i.e. ‘non-qualifying’ hedges) and other positions transacted as economic hedges but which also did not qualify for hedge accounting. HSBC’s policy on hedging is to manage economic risk in the most appropriate way without regard as to whether hedge accounting is available, within limits regarding the potential volatility of reported earnings.
Trading VAR is further analysed below by risk type, by positions taken with trading intent and by positions taken without trading intent:
Total trading VAR by risk type (Audited)
Foreign exchange and commodity
Interest rate Equity Total
US$m US$m US$m US$m
At 31 December 2006 .................................................. 7.3 26.0 11.8 32.6 At 31 December 2005 ................................................... 4.6 33.8 4.7 32.7
Average 2006 .......................................................................... 6.3 33.9 6.5 33.3 2005 .......................................................................... 6.9 37.3 5.5 37.3
Minimum 2006 .......................................................................... 2.6 18.3 2.6 20.9 2005 .......................................................................... 2.9 24.3 2.3 23.5
Maximum 2006 .......................................................................... 12.7 53.6 11.8 52.3 2005 .......................................................................... 12.4 76.9 10.9 73.2
219
Positions taken with trading intent – VAR by risk type (Audited)
Foreign exchange and commodity
Interest rate Equity Total
US$m US$m US$m US$m
At 31 December 2006 .................................................. 7.3 27.9 11.8 30.2 At 31 December 2005 ................................................... 4.6 28.4 4.7 30.1
Average 2006 .......................................................................... 6.3 31.7 6.5 31.6 2005 .......................................................................... 6.9 33.3 5.5 33.5
Minimum 2006 .......................................................................... 2.6 18.3 2.6 19.9 2005 .......................................................................... 2.9 25.5 2.3 25.7
Maximum 2006 .......................................................................... 12.7 49.6 11.8 48.2 2005 .......................................................................... 12.4 49.0 10.9 46.7
Positions taken without trading intent – VAR by risk type (Audited)
Foreign exchange and commodity
Interest rate Equity Total
US$m US$m US$m US$m
At 31 December 2006 .................................................. – 4.7 – 4.7 At 31 December 2005 ................................................... – 6.9 – 6.9
Average 2006 .......................................................................... – 5.6 – 5.6 2005 .......................................................................... – 8.6 – 8.6
Minimum 2006 .......................................................................... – 2.5 – 2.5 2005 .......................................................................... – 1.4 – 1.4
Maximum 2006 .......................................................................... – 10.5 – 10.5 2005 .......................................................................... – 24.5 – 24.5
Non-trading portfolios (Audited)
The principal objective of market risk management of non-trading portfolios is to optimise net interest income.
Market risk in non-trading portfolios arises principally from mismatches between the future yield on assets and their funding cost, as a result of interest rate changes. Analysis of this risk is complicated by having to make assumptions on optionality in certain product areas, for example, mortgage prepayments, and from behavioural assumptions regarding the economic duration of liabilities which are contractually repayable on demand, for example, current accounts. The prospective change in future net interest income from non-trading portfolios will be reflected in the current realisable value of these positions, should they be sold or closed prior to maturity. In order to manage this risk optimally, market risk in non-trading portfolios is transferred to Global Markets or to separate books managed under the supervision of the local ALCO.
The transfer of market risk to books managed by Global Markets or supervised by ALCO is usually achieved by a series of internal deals between the business units and these books. When the behavioural characteristics of a product differ from its contractual characteristics, the behavioural characteristics are assessed to determine the true underlying interest rate risk. Local ALCOs are required to regularly monitor all such behavioural assumptions and interest rate risk positions, to ensure they comply with interest rate risk limits established by the Group Management Board.
As noted above, in certain cases, the non-linear characteristics of products cannot be adequately captured by the risk transfer process. For example, both the flow from customer deposit accounts to alternative investment products and the precise prepayment speeds of mortgages will vary at different interest rate levels. In such circumstances, simulation modelling is used to identify the impact of varying scenarios on valuations and net interest income.
H S B C H O L D I N G S P L C
Report of the Directors: The Management of Risk (continued) Market risk > Non-trading portfolios / Sensitivity of NII
220
Once market risk has been consolidated in Global Markets or ALCO-managed books, the net exposure is typically managed through the use of interest rate swaps within agreed limits.
The principal non-trading risks which are not included in VAR for Global Markets (see ‘Value at risk’ above) are detailed below.
Non-trading risks not included in Global Markets VAR (Audited)
HSBC Finance
Mortgage servicing rights
Capital instruments
US$m US$m US$m
At 31 December 2006 ............................................................................................. 11.6 3.2 87.4 At 31 December 2005 .............................................................................................. 13.5 3.9 65.0
Average 2006 ..................................................................................................................... 15.5 2.9 72.1 2005 ..................................................................................................................... 13.4 3.2 70.3
Minimum 2006 ...................................................................................................................... 6.8 2.5 58.8 2005 ..................................................................................................................... 6.2 2.4 62.3
Maximum 2006 ...................................................................................................................... 23.9 3.9 87.4 2005 ..................................................................................................................... 41.6 4.0 78.2
Market risk within HSBC Finance primarily arises from mismatches between future behaviouralised asset yields and their funding costs and associated derivatives. The sub-prime mortgage portfolio is a sub-set of this portfolio of behaviouralised assets. This non-trading risk is principally managed by controlling the sensitivity of projected net interest income under varying interest rate scenarios.
VAR limits are set to control the total market risk exposure of HSBC Finance.
Market risk arising in the prime residential mortgage business of HSBC Bank USA is primarily managed by a specialist function within the business, under guidelines established by HSBC Bank USA’s ALCO. A range of risk management tools is applied to hedge the sensitivity arising from movements in interest rates. The key element of market risk within the US prime mortgage business relates to the prepayment options embedded in US prime mortgages, which affect the sensitivity of the value of mortgage servicing rights (‘MSRs’) to interest rate movements and the net interest margin on mortgage assets. MSRs represent the economic value of the right to receive fees for performing specified residential mortgage servicing activities. They are sensitive to interest rate movements because lower rates accelerate the prepayment speed of the underlying mortgages and therefore reduce the value of the MSRs. The reverse is true for rising rates. HSBC uses a combination of interest rate-sensitive derivatives and debt securities to help protect the economic value of MSRs. An accounting asymmetry can arise in this area because the derivatives used to
hedge the economic exposure arising from MSRs are always measured at fair value, but the MSRs themselves are measured for accounting purposes at the lower of amortised cost and valuation. It is, therefore, possible for an economically hedged position not to be shown as such in the accounts, when the hedge shows a loss but the MSRs cannot be revalued above cost to reflect the related profit. HSBC’s policy is to hedge the economic risk.
VAR limits are set to control the exposure to MSRs and MSRs hedges.
Market risk arises on fixed-rate securities issued by HSBC. These securities are managed as capital instruments and include non-cumulative preference shares, non-cumulative perpetual preferred securities and fixed rate subordinated debt.
Market risk arising in HSBC’s insurance businesses is discussed in ‘Risk management of insurance operations’ on pages 228 to 242.
Market risk also arises within HSBC’s defined benefit pension schemes to the extent that the obligations of the schemes are not fully matched by assets with determinable cash flows. This risk principally derives from the pension schemes holding equities against their future pension obligations. The risk is that market movements in equity prices could result in assets which are insufficient over time to cover the level of projected liabilities. Management, together with the trustees who act on behalf of the pension scheme beneficiaries, assess the level of this risk using reports prepared by independent external actuaries.
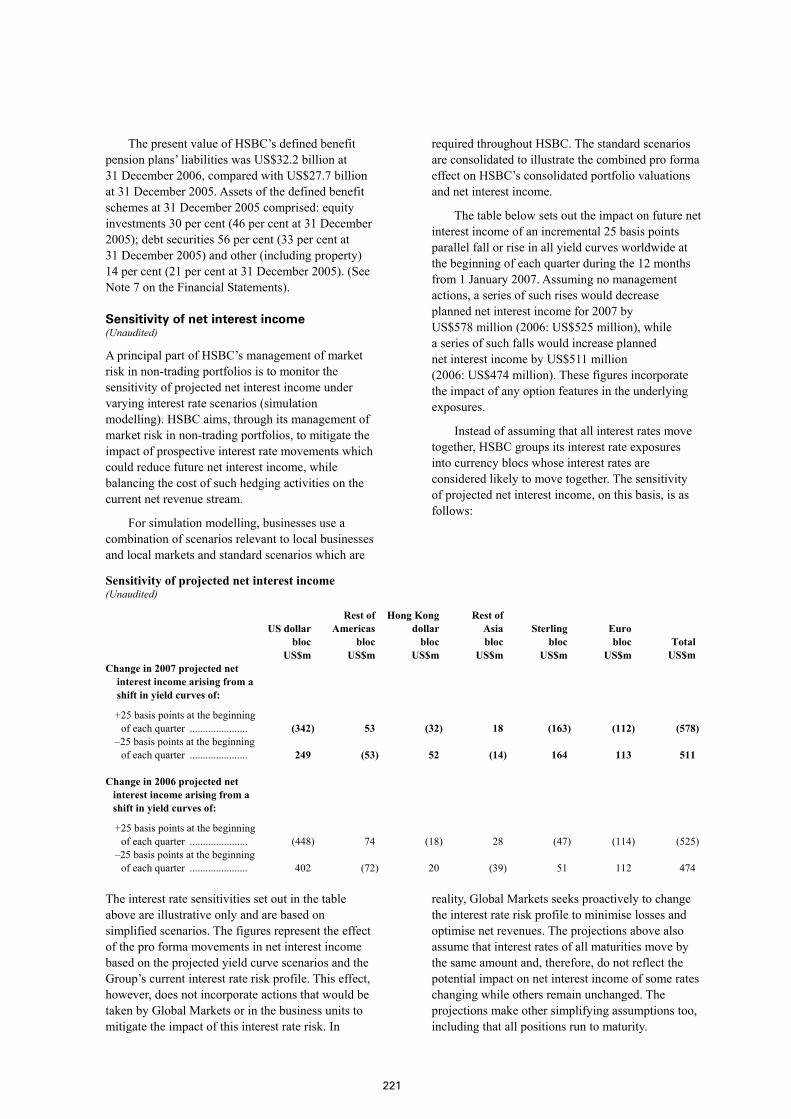
221
The present value of HSBC’s defined benefit pension plans’ liabilities was US$32.2 billion at 31 December 2006, compared with US$27.7 billion at 31 December 2005. Assets of the defined benefit schemes at 31 December 2005 comprised: equity investments 30 per cent (46 per cent at 31 December 2005); debt securities 56 per cent (33 per cent at 31 December 2005) and other (including property) 14 per cent (21 per cent at 31 December 2005). (See Note 7 on the Financial Statements).
Sensitivity of net interest income (Unaudited)
A principal part of HSBC’s management of market risk in non-trading portfolios is to monitor the sensitivity of projected net interest income under varying interest rate scenarios (simulation modelling). HSBC aims, through its management of market risk in non-trading portfolios, to mitigate the impact of prospective interest rate movements which could reduce future net interest income, while balancing the cost of such hedging activities on the current net revenue stream.
For simulation modelling, businesses use a combination of scenarios relevant to local businesses and local markets and standard scenarios which are
required throughout HSBC. The standard scenarios are consolidated to illustrate the combined pro forma effect on HSBC’s consolidated portfolio valuations and net interest income.
The table below sets out the impact on future net interest income of an incremental 25 basis points parallel fall or rise in all yield curves worldwide at the beginning of each quarter during the 12 months from 1 January 2007. Assuming no management actions, a series of such rises would decrease planned net interest income for 2007 by US$578 million (2006: US$525 million), while a series of such falls would increase planned net interest income by US$511 million (2006: US$474 million). These figures incorporate the impact of any option features in the underlying exposures.
Instead of assuming that all interest rates move together, HSBC groups its interest rate exposures into currency blocs whose interest rates are considered likely to move together. The sensitivity of projected net interest income, on this basis, is as follows:
Sensitivity of projected net interest income (Unaudited)
US dollar bloc US$m
Rest of Americas bloc US$m
Hong Kong dollar bloc US$m
Rest of Asia bloc US$m
Sterling bloc US$m
Euro bloc US$m
Total US$m
Change in 2007 projected net interest income arising from a shift in yield curves of:
+25 basis points at the beginning of each quarter ...................... (342) 53 (32) 18 (163) (112) (578)
–25 basis points at the beginning of each quarter ...................... 249 (53) 52 (14) 164 113 511
Change in 2006 projected net
interest income arising from a shift in yield curves of:
+25 basis points at the beginning of each quarter ...................... (448) 74 (18) 28 (47) (114) (525)
–25 basis points at the beginning of each quarter ...................... 402 (72) 20 (39) 51 112 474
The interest rate sensitivities set out in the table above are illustrative only and are based on simplified scenarios. The figures represent the effect of the pro forma movements in net interest income based on the projected yield curve scenarios and the Group’s current interest rate risk profile. This effect, however, does not incorporate actions that would be taken by Global Markets or in the business units to mitigate the impact of this interest rate risk. In
reality, Global Markets seeks proactively to change the interest rate risk profile to minimise losses and optimise net revenues. The projections above also assume that interest rates of all maturities move by the same amount and, therefore, do not reflect the potential impact on net interest income of some rates changing while others remain unchanged. The projections make other simplifying assumptions too, including that all positions run to maturity.
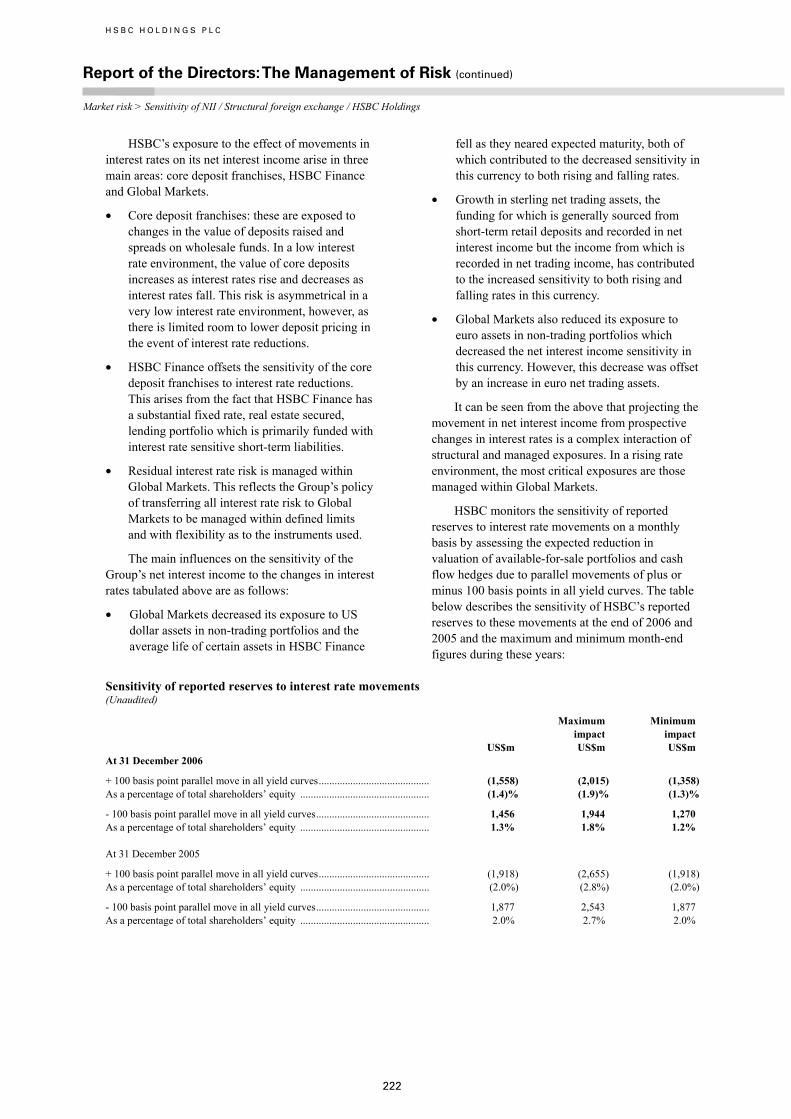
H S B C H O L D I N G S P L C
Report of the Directors: The Management of Risk (continued) Market risk > Sensitivity of NII / Structural foreign exchange / HSBC Holdings
222
HSBC’s exposure to the effect of movements in interest rates on its net interest income arise in three main areas: core deposit franchises, HSBC Finance and Global Markets.
• Core deposit franchises: these are exposed to changes in the value of deposits raised and spreads on wholesale funds. In a low interest rate environment, the value of core deposits increases as interest rates rise and decreases as interest rates fall. This risk is asymmetrical in a very low interest rate environment, however, as there is limited room to lower deposit pricing in the event of interest rate reductions.
• HSBC Finance offsets the sensitivity of the core deposit franchises to interest rate reductions. This arises from the fact that HSBC Finance has a substantial fixed rate, real estate secured, lending portfolio which is primarily funded with interest rate sensitive short-term liabilities.
• Residual interest rate risk is managed within Global Markets. This reflects the Group’s policy of transferring all interest rate risk to Global Markets to be managed within defined limits and with flexibility as to the instruments used.
The main influences on the sensitivity of the Group’s net interest income to the changes in interest rates tabulated above are as follows:
• Global Markets decreased its exposure to US dollar assets in non-trading portfolios and the average life of certain assets in HSBC Finance
fell as they neared expected maturity, both of which contributed to the decreased sensitivity in this currency to both rising and falling rates.
• Growth in sterling net trading assets, the funding for which is generally sourced from short-term retail deposits and recorded in net interest income but the income from which is recorded in net trading income, has contributed to the increased sensitivity to both rising and falling rates in this currency.
• Global Markets also reduced its exposure to euro assets in non-trading portfolios which decreased the net interest income sensitivity in this currency. However, this decrease was offset by an increase in euro net trading assets.
It can be seen from the above that projecting the movement in net interest income from prospective changes in interest rates is a complex interaction of structural and managed exposures. In a rising rate environment, the most critical exposures are those managed within Global Markets.
HSBC monitors the sensitivity of reported reserves to interest rate movements on a monthly basis by assessing the expected reduction in valuation of available-for-sale portfolios and cash flow hedges due to parallel movements of plus or minus 100 basis points in all yield curves. The table below describes the sensitivity of HSBC’s reported reserves to these movements at the end of 2006 and 2005 and the maximum and minimum month-end figures during these years:
Sensitivity of reported reserves to interest rate movements (Unaudited)
US$m
Maximum impact US$m
Minimum impact US$m
At 31 December 2006
+ 100 basis point parallel move in all yield curves.......................................... (1,558) (2,015) (1,358)As a percentage of total shareholders’ equity ................................................. (1.4)% (1.9)% (1.3)%
- 100 basis point parallel move in all yield curves........................................... 1,456 1,944 1,270 As a percentage of total shareholders’ equity ................................................. 1.3% 1.8% 1.2% At 31 December 2005
+ 100 basis point parallel move in all yield curves.......................................... (1,918) (2,655) (1,918)As a percentage of total shareholders’ equity ................................................. (2.0%) (2.8%) (2.0%)
- 100 basis point parallel move in all yield curves........................................... 1,877 2,543 1,877 As a percentage of total shareholders’ equity ................................................. 2.0% 2.7% 2.0%

223
The sensitivities are illustrative only and are based on simplified scenarios. The table shows interest rate risk exposures arising in available-for-sale portfolios and from cash flow hedges which are marked-to-market through reserves. These particular exposures form only a part of the Group’s overall interest rate exposures. The accounting treatment under IFRSs of the Group’s remaining interest rate exposures, while economically largely offsetting the exposures shown in the above table, does not require revaluation movements to go to reserves.
Structural foreign exchange exposures (Unaudited)
Structural foreign exchange exposures represent net investments in subsidiaries, branches or associated undertakings, the functional currencies of which are currencies other than the US dollar.
Exchange differences on structural exposures are recorded in the consolidated statement of recognised income and expense. The main operating (or functional) currencies in which HSBC’s business is transacted are the US dollar, the Hong Kong dollar, sterling, the euro, the Mexican peso, the Brazilian real and the Chinese renminbi. As the US dollar and currencies linked to it form the dominant currency bloc in which HSBC’s operations transact business, HSBC Holdings prepares its consolidated financial statements in US dollars. HSBC’s consolidated balance sheet is, therefore, affected by exchange differences between the US dollar and all the non-US dollar functional currencies of underlying subsidiaries.
HSBC hedges structural foreign exchange exposures only in limited circumstances. HSBC’s structural foreign exchange exposures are managed with the primary objective of ensuring, where practical, that HSBC’s consolidated capital ratios, and the capital ratios of individual banking subsidiaries, are protected from the effect of changes in exchange rates. This is usually achieved by ensuring that, for each subsidiary bank, the ratio of structural exposures in a given currency to risk-weighted assets denominated in that currency is broadly equal to the capital ratio of the subsidiary in question.
Selective hedges were in place during 2006. Hedging is undertaken using forward foreign exchange contracts which are accounted for under IFRSs as hedges of a net investment in a foreign operation, or by financing with borrowings in the same currencies as the functional currencies involved. There was no ineffectiveness arising from
these hedges in the year ended 31 December 2006.
There was no material effect from exchange differences on HSBC’s capital ratios during the year.
HSBC Holdings (Audited)
As a financial services holding company, HSBC Holdings has limited market risk activity. Its activities predominantly involve maintaining sufficient capital resources to support the Group’s diverse activities; allocating these capital resources across the Group’s businesses; earning dividend and interest income on its investments in the Group’s businesses; providing dividend payments to HSBC Holdings’ equity shareholders and interest payments to providers of debt capital; and maintaining a supply of short-term cash resources. It does not take proprietary trading positions.
The objectives of HSBC Holdings’ market risk management are to minimise income statement volatility arising from short-term cash balances and funding positions; to minimise the market risk arising from long-term investments and long-term liabilities; and to protect distributable reserves from any adverse market risk variables.
Market risk for HSBC Holdings is monitored by its Structural Positions Review Group.
The main market risks to which HSBC Holdings is exposed are interest rate risk and foreign currency risk.
HSBC Holdings is exposed to interest rate risk on debt capital investments in, and loans to, subsidiary undertakings; on debt capital issues; and on short-term cash resources.
Certain loans to subsidiary undertakings of a capital nature that are not denominated in the functional currency of either the provider or the recipient are accounted for as financial assets. Changes in the carrying amount of these assets due to exchange differences are taken directly to the income statement. These loans, and the associated foreign exchange exposures, are eliminated on a Group consolidated basis.
Revaluations due to foreign exchange rate movements affecting loans to subsidiary undertakings of a capital nature which are denominated in the functional currency of either the borrower or the recipient, are taken directly to reserves. Equity investments in subsidiary undertakings are accounted for on a cost basis and are not revalued following movements in exchange rates.
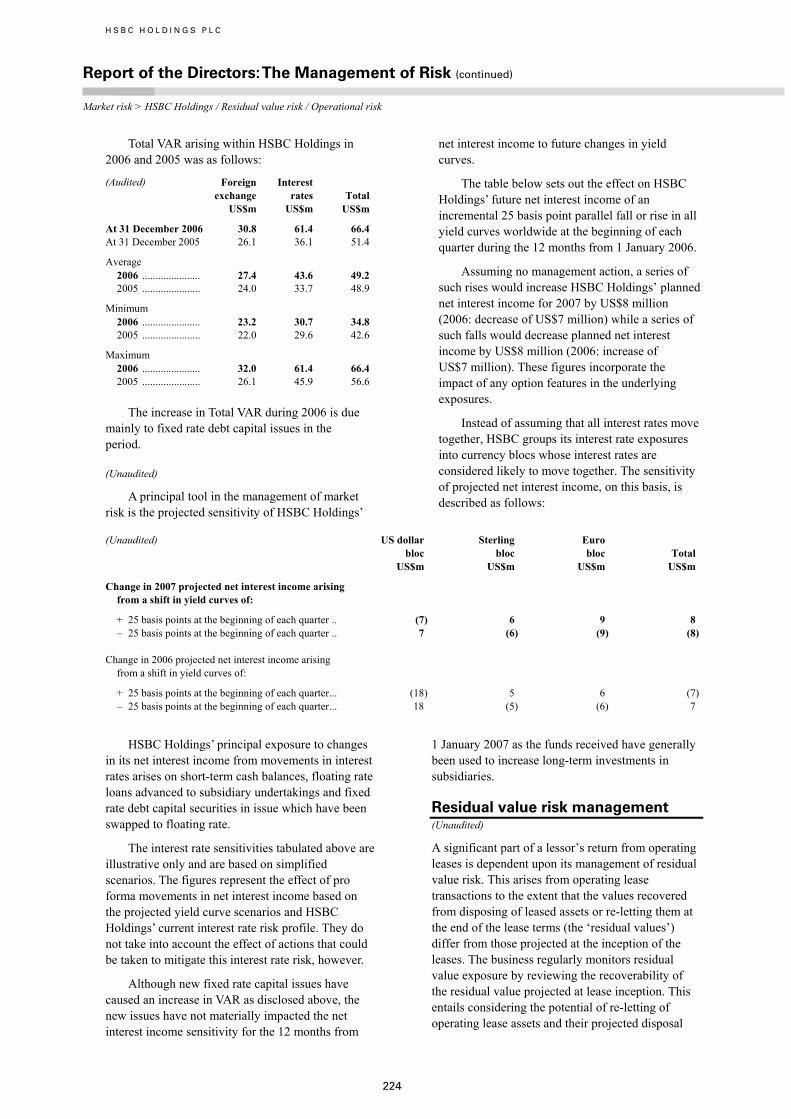
H S B C H O L D I N G S P L C
Report of the Directors: The Management of Risk (continued) Market risk > HSBC Holdings / Residual value risk / Operational risk
224
Total VAR arising within HSBC Holdings in 2006 and 2005 was as follows:
(Audited) Foreign exchange US$m
Interest rates US$m
Total US$m
At 31 December 2006 30.8 61.4 66.4 At 31 December 2005 26.1 36.1 51.4
Average 2006 ...................... 27.4 43.6 49.2 2005 ...................... 24.0 33.7 48.9
Minimum 2006 ...................... 23.2 30.7 34.8 2005 ...................... 22.0 29.6 42.6
Maximum 2006 ...................... 32.0 61.4 66.4 2005 ...................... 26.1 45.9 56.6
The increase in Total VAR during 2006 is due mainly to fixed rate debt capital issues in the period.
(Unaudited)
A principal tool in the management of market risk is the projected sensitivity of HSBC Holdings’
net interest income to future changes in yield curves.
The table below sets out the effect on HSBC Holdings’ future net interest income of an incremental 25 basis point parallel fall or rise in all yield curves worldwide at the beginning of each quarter during the 12 months from 1 January 2006.
Assuming no management action, a series of such rises would increase HSBC Holdings’ planned net interest income for 2007 by US$8 million (2006: decrease of US$7 million) while a series of such falls would decrease planned net interest income by US$8 million (2006: increase of US$7 million). These figures incorporate the impact of any option features in the underlying exposures.
Instead of assuming that all interest rates move together, HSBC groups its interest rate exposures into currency blocs whose interest rates are considered likely to move together. The sensitivity of projected net interest income, on this basis, is described as follows:
(Unaudited) US dollarbloc
Sterlingbloc
Euro bloc
Total
US$m US$m US$m US$m
Change in 2007 projected net interest income arising from a shift in yield curves of:
+ 25 basis points at the beginning of each quarter .. (7) 6 9 8 – 25 basis points at the beginning of each quarter .. 7 (6) (9) (8)
Change in 2006 projected net interest income arising
from a shift in yield curves of:
+ 25 basis points at the beginning of each quarter... (18) 5 6 (7)– 25 basis points at the beginning of each quarter... 18 (5) (6) 7
HSBC Holdings’ principal exposure to changes in its net interest income from movements in interest rates arises on short-term cash balances, floating rate loans advanced to subsidiary undertakings and fixed rate debt capital securities in issue which have been swapped to floating rate.
The interest rate sensitivities tabulated above are illustrative only and are based on simplified scenarios. The figures represent the effect of pro forma movements in net interest income based on the projected yield curve scenarios and HSBC Holdings’ current interest rate risk profile. They do not take into account the effect of actions that could be taken to mitigate this interest rate risk, however.
Although new fixed rate capital issues have caused an increase in VAR as disclosed above, the new issues have not materially impacted the net interest income sensitivity for the 12 months from
1 January 2007 as the funds received have generally been used to increase long-term investments in subsidiaries.
Residual value risk management (Unaudited)
A significant part of a lessor’s return from operating leases is dependent upon its management of residual value risk. This arises from operating lease transactions to the extent that the values recovered from disposing of leased assets or re-letting them at the end of the lease terms (the ‘residual values’) differ from those projected at the inception of the leases. The business regularly monitors residual value exposure by reviewing the recoverability of the residual value projected at lease inception. This entails considering the potential of re-letting of operating lease assets and their projected disposal
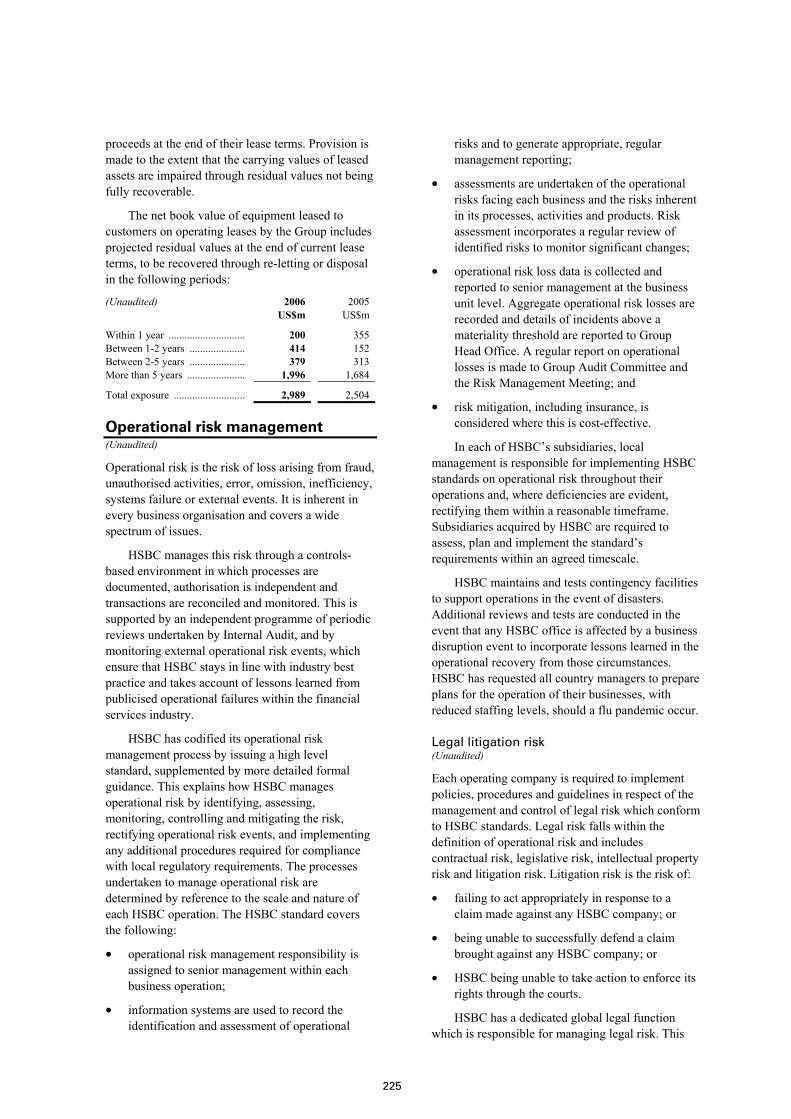
225
proceeds at the end of their lease terms. Provision is made to the extent that the carrying values of leased assets are impaired through residual values not being fully recoverable.
The net book value of equipment leased to customers on operating leases by the Group includes projected residual values at the end of current lease terms, to be recovered through re-letting or disposal in the following periods:
(Unaudited) 2006 2005 US$m US$m
Within 1 year ............................. 200 355 Between 1-2 years ..................... 414 152 Between 2-5 years ..................... 379 313 More than 5 years ...................... 1,996 1,684
Total exposure ........................... 2,989 2,504
Operational risk management (Unaudited)
Operational risk is the risk of loss arising from fraud, unauthorised activities, error, omission, inefficiency, systems failure or external events. It is inherent in every business organisation and covers a wide spectrum of issues.
HSBC manages this risk through a controls-based environment in which processes are documented, authorisation is independent and transactions are reconciled and monitored. This is supported by an independent programme of periodic reviews undertaken by Internal Audit, and by monitoring external operational risk events, which ensure that HSBC stays in line with industry best practice and takes account of lessons learned from publicised operational failures within the financial services industry.
HSBC has codified its operational risk management process by issuing a high level standard, supplemented by more detailed formal guidance. This explains how HSBC manages operational risk by identifying, assessing, monitoring, controlling and mitigating the risk, rectifying operational risk events, and implementing any additional procedures required for compliance with local regulatory requirements. The processes undertaken to manage operational risk are determined by reference to the scale and nature of each HSBC operation. The HSBC standard covers the following:
• operational risk management responsibility is assigned to senior management within each business operation;
• information systems are used to record the identification and assessment of operational
risks and to generate appropriate, regular management reporting;
• assessments are undertaken of the operational risks facing each business and the risks inherent in its processes, activities and products. Risk assessment incorporates a regular review of identified risks to monitor significant changes;
• operational risk loss data is collected and reported to senior management at the business unit level. Aggregate operational risk losses are recorded and details of incidents above a materiality threshold are reported to Group Head Office. A regular report on operational losses is made to Group Audit Committee and the Risk Management Meeting; and
• risk mitigation, including insurance, is considered where this is cost-effective.
In each of HSBC’s subsidiaries, local management is responsible for implementing HSBC standards on operational risk throughout their operations and, where deficiencies are evident, rectifying them within a reasonable timeframe. Subsidiaries acquired by HSBC are required to assess, plan and implement the standard’s requirements within an agreed timescale.
HSBC maintains and tests contingency facilities to support operations in the event of disasters. Additional reviews and tests are conducted in the event that any HSBC office is affected by a business disruption event to incorporate lessons learned in the operational recovery from those circumstances. HSBC has requested all country managers to prepare plans for the operation of their businesses, with reduced staffing levels, should a flu pandemic occur.
Legal litigation risk (Unaudited)
Each operating company is required to implement policies, procedures and guidelines in respect of the management and control of legal risk which conform to HSBC standards. Legal risk falls within the definition of operational risk and includes contractual risk, legislative risk, intellectual property risk and litigation risk. Litigation risk is the risk of:
• failing to act appropriately in response to a claim made against any HSBC company; or
• being unable to successfully defend a claim brought against any HSBC company; or
• HSBC being unable to take action to enforce its rights through the courts.
HSBC has a dedicated global legal function which is responsible for managing legal risk. This
H S B C H O L D I N G S P L C
Report of the Directors: The Management of Risk (continued) Operational risk / Reputational risk / Sustainability risk
226
comprises the provision of legal advice and support in resisting claims and legal proceedings against HSBC companies, including analysis of legal issues and the management of any litigation, as well as in respect of non-routine debt recoveries or other litigation against third parties.
The Head Office Legal department oversees the global legal function and is headed by a Group General Manager who reports to the Group Chairman. There are Legal departments in 40 of the countries in which HSBC operates which have primary responsibility for identifying and assessing legal risk and advising local management in their respective jurisdictions on these matters. There is also a regional level Legal function in each of Europe, North America, Latin America, the Middle East and Asia-Pacific.
HSBC policy requires operating companies to notify the appropriate in-house Legal department immediately any litigation is either threatened or commenced against the Group or an employee. Claims which exceed US$1.5 million, must be advised immediately to the appropriate regional Legal department. Claims where the amount exceeds US$5 million, where the action is by the regulatory authority, the proceedings are criminal, or any claim that might materially affect the Group’s reputation must immediately be advised to the Head Office Legal department. Such matters are then advised to the Risk Management Meeting of the Group Management Board in a monthly paper.
HSBC policy also requires that an exception report must be made to the local compliance function and escalated to the Head of Group Compliance in respect of any breach which has given rise to a fine and/or costs levied by a court of law or regulatory body where the amount is US$1,500 or more and material or significant issues are reported to the Risk Management Meeting of the Group Management Board and/or the Group Audit Committee.
In addition, operating companies are required to submit returns detailing outstanding claims which exceed US$10 million or which may be sensitive to the reputation of HSBC for reporting to the Group Audit Committee and the Board of HSBC Holdings, and disclosure in the Interim Report and Annual Report and Accounts if appropriate.
Pension risk (Unaudited)
HSBC operates a number of pension plans throughout the world, as described in Note 7 on the Financial Statements. Some of these pension plans
are defined benefit plans, of which the largest is the HSBC Bank (UK) Pension Scheme.
The benefits payable under the defined benefit plans are typically a function of salary and length of service. In order to fund these benefits, sponsoring group companies (and in some instances, employees) make regular contributions in accordance with advice from actuaries and in consultation with the scheme’s Trustees (where relevant). The defined benefit plans invest these contributions in a range of investments designed to meet their long-term liabilities.
A deficit in a defined benefit plan may arise from a number of factors, including:
• investments delivering a return below that required to provide the projected plan benefits. This could arise, for example, when there is a fall in the market value of equities, or when increases in long-term interest rates cause a fall in the value of fixed income securities held;
• a change in either interest rates or inflation which causes an increase in the value of the scheme liabilities; and
• scheme members living longer than expected (known as longevity risk).
The plan’s investment strategy is determined in the light of the market risk inherent in the investments and the consequential impact on potential future contributions.
Ultimate responsibility for investment strategy rests with either the Trustees or, in certain circumstances, a Management Committee. The degree of independence of the Trustees from HSBC differs in different jurisdictions. For example, the HSBC Bank (UK) Pension Scheme, which accounts for over 80 per cent of the net liability of the Group’s pension plans, is overseen by a corporate Trustee. To assist this scheme’s Trustee, HSBC has proposed a number of techniques for applying the Group’s existing asset and liability management strategy and related monitoring mechanisms to the market risks inherent in the scheme.
These techniques include:
• regular assessments of funding positions;
• regular reviews of investment performance against market benchmarks;
• half-yearly reviews of the pension schemes’ effect on the Group’s financial statements;
• alignment of investment strategy with the liability profile of the pension scheme; and
227
• hedging strategies to address inflation and the interest rate risk inherent within the schemes.
In order to mitigate the risk of investments under-performing and the adverse effect of changes in long-term interest rates and inflation, the Trustee has agreed to a programme of initiatives including changing the asset mix and entering into long-term interest rate and inflation swaps.
Reputational risk management (Unaudited)
HSBC regularly updates its policies and procedures for safeguarding against reputational and operational risks. This is an evolutionary process which takes account of The Association of British Insurers’ guidance on best practice when responding to environmental, social and governance (‘ESG’) risks.
The safeguarding of HSBC’s reputation is of paramount importance to its continued prosperity and is the responsibility of every member of staff. HSBC has always aspired to the highest standards of conduct and, as a matter of routine, takes account of reputational risks to its business. Reputational risks can arise from ESG issues or as a consequence of operational risk events. As a banking group, HSBC’s good reputation depends upon the way in which it conducts its business, but it can also be affected by the way in which clients, to whom it provides financial services, conduct themselves. The training of Directors on appointment includes reputational matters.
Reputational risks, including ESG matters, are considered and assessed by the Board, the Group Management Board, the Risk Management Meeting, subsidiary company boards, board committees and/or senior management during the formulation of policy and the establishment of HSBC standards. Standards on all major aspects of business are set for HSBC and for individual subsidiaries, businesses and functions. These policies, which form an integral part of the internal control systems, are communicated through manuals and statements of policy and are promulgated through internal communications and training. The policies cover ESG issues and set out operational procedures in all areas of reputational risk, including money laundering deterrence, environmental impact, anti-corruption measures and employee relations. The policy manuals address risk issues in detail and co-operation between Head Office departments and businesses is required to ensure a strong adherence to HSBC’s risk management system and its corporate responsibility practices.
Internal controls are an integral part of how HSBC conducts its business. HSBC’s manuals and statements of policy are the foundation of these internal controls. There is a strong process in place to ensure controls operate effectively. Any significant failings are reported through the control mechanisms, internal audit and compliance functions to subsidiary company audit committees and to the Group Audit Committee, which keeps under review the effectiveness of the system of internal controls and reports regularly to HSBC Holdings’ Board. In addition, all HSBC businesses and major functions are required to review their control procedures and to make regular reports about any losses arising from operational risks.
Sustainability risk management (Unaudited)
Sustainability risks arise from the provision of financial services to companies or projects which run counter to the needs of sustainable development; in effect this risk arises when the environmental and social effects outweigh economic benefits. Within Group Head Office, a separate function, Group Sustainable Development, is mandated to manage these risks globally. Its risk management responsibilities include:
• formulating sustainability risk policies. This includes oversight of HSBC’s Sustainability Risk Standards, management of the Equator Principles for project finance lending, and sector-based sustainability policies covering those sectors with high environmental or social impacts (forestry, freshwater infrastructure, chemicals, energy, mining and metals, and defence-related lending);
• undertaking an independent review of transactions where sustainability risks are assessed to be high, and supporting HSBC’s operating companies to assess similar risks of a lower magnitude;
• building and implementing systems-based processes to ensure consistent application of policies, reduce the costs of sustainability risk reviews and capture management information to measure and report on the effect of HSBC’s lending and investment activities on sustainable development; and
• providing training and capacity building within HSBC’s operating companies to ensure sustainability risks are identified and mitigated on a consistent basis and to either HSBC’s own standards, or international standards or local regulations, whichever the higher.
H S B C H O L D I N G S P L C
Report of the Directors: The Management of Risk (continued) Insurance operations > Life insurance / Non-life insurance / Insurance risk
228
Risk management of insurance operations (Audited)
Within its service proposition, HSBC offers its customers a wide range of insurance products, many of which complement other bank and consumer finance products.
Both life and non-life insurance is underwritten, principally in the UK, Hong Kong, Mexico, Brazil, the US and Argentina.
Life insurance business (Audited)
There are a number of major sub-categories of life assurance business, of which the main ones are discussed below:
Life insurance contracts with discretionary participation features allow policyholders to participate in the profits generated from such business in addition to providing cover on death. The largest portfolio, which is in Hong Kong, is a book of endowment and whole-life policies, with annual bonuses awarded to policyholders. Market risk is managed in conjunction with other risks through the investment policy and adjustment to bonus rates. In practice this means that the majority of the market risk is borne by policyholders. The main risk associated with this product is the value of assigned assets falling below that required to support benefit payments. HSBC manages this risk by conducting regular actuarial investigations on the sustainability of the bonus rates.
Credit life insurance provides protection in the event of death or unemployment. Credit life insurance business is written for banking and finance products. The insurance risk relates to mortality and morbidity risk which is restricted to the duration of the loans advanced. Claims experience is required to be monitored and premium rates adjusted accordingly.
Annuities are contracts providing regular payments of income from capital investment for either a fixed period or during the annuitant’s lifetime. Deferred annuities are those whose payments to the annuitant begin at a designated future date while, for immediate annuities, payments begin on inception of the policy. The principal risks of annuity business relate to mortality and market risk, the latter arising from the need to match investments to the anticipated cash flow profile of the policies. The investment strategy seeks to match the anticipated cash flow profile, and the mortality risk is regularly monitored.
Term assurance provides cover in the event of death. Critical illness cover provides cover in the event of critical illness. The major components of the ‘Term assurance and other long-term contracts’ category are term assurance and critical illness policies written in the UK. The principal risks are in respect of mortality and morbidity. These risks are managed through a combination of underwriting practices, premium adjustment in light of changes in experience and reinsurance.
Linked life insurance business pays benefits to the policyholder which is typically determined by reference to the value of the investments supporting the policy. For linked life insurance business, the market risk is substantially borne by policyholders. The principal risk retained by HSBC relates to expenses incurred in managing this product. They are recovered by management charges deducted from the policyholder over the lifetime of the policy. However, if the policy is terminated early, deductions made to that point may be less than the costs incurred for managing the product. This risk is mitigated by retaining the ability to apply charges on early surrender. Mortality, disability and morbidity risks can also arise with this product and are managed by applying the techniques set out above for non-linked lines of business.
Non-life insurance business (Audited)
Non-life insurance contracts include motor, fire and other damage, accident and health, repayment protection and commercial and liability business.
Within accident and health insurance, potential accumulations of personal accident risks are mitigated by the purchase of catastrophe reinsurance.
Motor insurance business covers vehicle damage and liability for personal injury. Reinsurance protection is required to be arranged where necessary to avoid excessive exposure to larger losses, particularly those relating to personal injury claims.
Fire and other damage business is written in all major markets, most significantly in Europe. The predominant focus in most markets is insurance for home and contents while cover for selected commercial customers is largely written in Asian and Latin American markets. Portfolios at risk from catastrophic losses are required to be protected by reinsurance in accordance with information obtained from professional risk-modelling organisations.
A very limited portfolio of liability business is written in major markets.
229
Following the disposal of the non-life insurance portfolio in Brazil in 2005, credit non-life business now represents the largest single class and is concentrated in the US and the UK. This business is originated in conjunction with the provision of loans.
Insurance risk (Audited)
The principal insurance risk faced by HSBC is that the cost of claims combined with acquisition and administration costs may exceed the aggregate amount of premiums received and investment income. HSBC manages its insurance risks through the application of formal underwriting, reinsurance and claims procedures designed to ensure compliance with regulations.
The Group manages insurance risk by diversifying insurance business by type and geography and by focusing on risks that are straightforward to manage which, in the main, are related to core underlying banking activities (for example, credit life products). The following tables provide an analysis of the insurance risk exposures by geography and by type of business. These tables demonstrate the Group’s diversification of risk. Personal lines tend to be higher volume and with lower individual value than commercial lines, which
further diversifies the risk. Compared to non-life business, life business tends to be longer term in nature and frequently involves an element of savings and investment in the contract. Separate tables are therefore provided for life and non-life business, reflecting their very distinct risk characteristics. The life insurance risk table provides an analysis of insurance liabilities as the best available overall measure of the insurance exposure. The table for non-life business uses written premiums as representing the best available measure of risk exposure.
Both life and non-life business insurance risks are controlled through high level procedures set centrally, and can be supplemented with procedures set locally which take account of specific local market conditions and regulatory requirements. For example, central authorisation is required to write certain classes of business, with restrictions applying particularly to commercial and liability non-life insurance. For life business in particular, local ALCOs monitor the risk exposures.
As indicated in the specific comments relating to particular classes, use is also made of reinsurance as a means of further mitigating exposure, in particular to aggregations of catastrophe risk.
Analysis of life insurance risk – policyholder liabilities (Audited)
Europe Hong Kong
Rest of Asia- Pacific
North America
Latin America Total
US$m US$m US$m US$m US$m US$m At 31 December 2006 Life (non-linked)
Insurance contracts with DPF1 ....................... 195 6,001 193 – – 6,389 Credit life ........................................................ 130 – – 200 – 330 Annuities ........................................................ 271 – 26 1,106 1,370 2,773 Term assurance and other long-term
contracts ..................................................... 1,134 75 89 – 236 1,534
Total life (non-linked) ........................................ 1,730 6,076 308 1,306 1,606 11,026
Life (linked) ........................................................ 1,270 765 402 – 1,248 3,685
Investment contracts with DPF1 ......................... – – 20 – – 20
Life insurance policyholders’ liabilities ............. 3,000 6,841 730 1,306 2,854 14,731 At 31 December 2005 (restated2) Life (non-linked) Insurance contracts with DPF1 ........................... 155 3,886 152 – – 4,193
Credit life ........................................................ 156 – – 196 – 352 Annuities ........................................................ 202 – 22 1,075 1,091 2,390 Term assurance and other long-term
contracts ..................................................... 1,063 68 82 – 221 1,434
Total life (non-linked) ........................................ 1,576 3,954 256 1,271 1,312 8,369
Life (linked) ........................................................ 1,201 536 332 – 826 2,895
Investment contracts with DPF1 ......................... – – 9 – – 9
Life insurance policyholders’ liabilities ............. 2,777 4,490 597 1,271 2,138 11,273
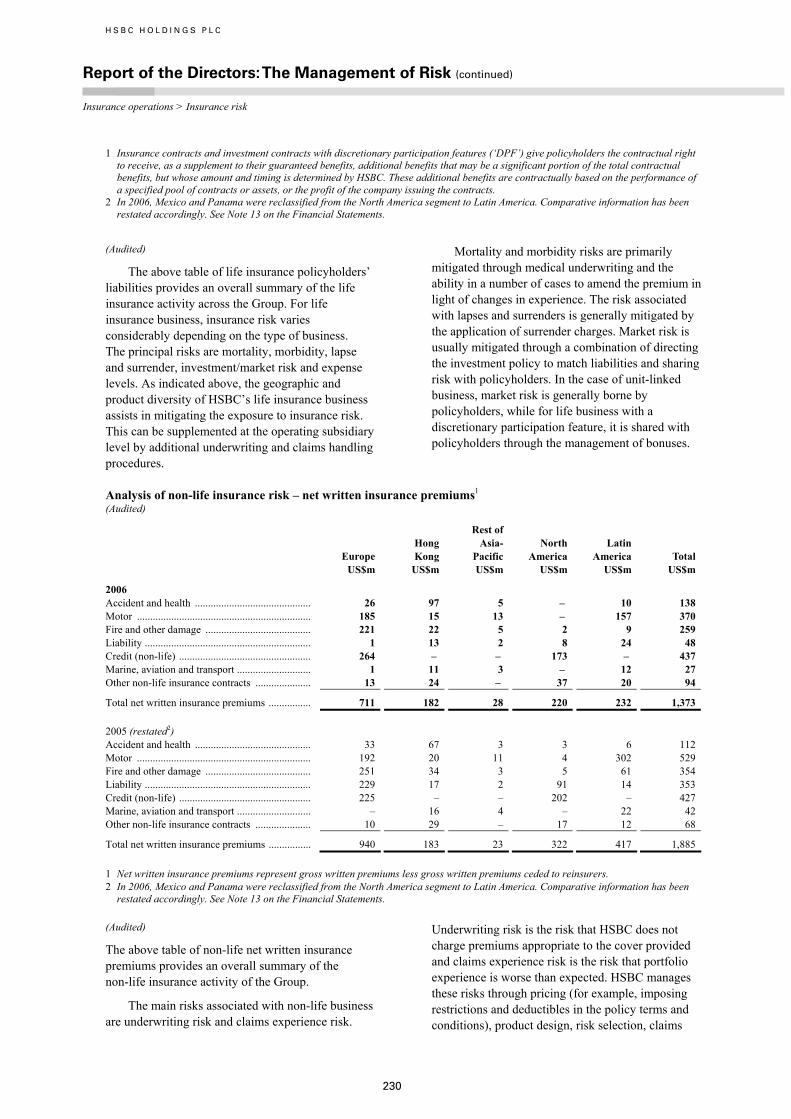
H S B C H O L D I N G S P L C
Report of the Directors: The Management of Risk (continued) Insurance operations > Insurance risk
230
1 Insurance contracts and investment contracts with discretionary participation features (‘DPF’) give policyholders the contractual right to receive, as a supplement to their guaranteed benefits, additional benefits that may be a significant portion of the total contractual benefits, but whose amount and timing is determined by HSBC. These additional benefits are contractually based on the performance of a specified pool of contracts or assets, or the profit of the company issuing the contracts.
2 In 2006, Mexico and Panama were reclassified from the North America segment to Latin America. Comparative information has been restated accordingly. See Note 13 on the Financial Statements.
(Audited)
The above table of life insurance policyholders’ liabilities provides an overall summary of the life insurance activity across the Group. For life insurance business, insurance risk varies considerably depending on the type of business. The principal risks are mortality, morbidity, lapse and surrender, investment/market risk and expense levels. As indicated above, the geographic and product diversity of HSBC’s life insurance business assists in mitigating the exposure to insurance risk. This can be supplemented at the operating subsidiary level by additional underwriting and claims handling procedures.
Mortality and morbidity risks are primarily mitigated through medical underwriting and the ability in a number of cases to amend the premium in light of changes in experience. The risk associated with lapses and surrenders is generally mitigated by the application of surrender charges. Market risk is usually mitigated through a combination of directing the investment policy to match liabilities and sharing risk with policyholders. In the case of unit-linked business, market risk is generally borne by policyholders, while for life business with a discretionary participation feature, it is shared with policyholders through the management of bonuses.
Analysis of non-life insurance risk – net written insurance premiums1
(Audited)
Europe Hong Kong
Rest of Asia- Pacific
North America
Latin America Total
US$m US$m US$m US$m US$m US$m
2006 Accident and health ............................................ 26 97 5 – 10 138 Motor .................................................................. 185 15 13 – 157 370 Fire and other damage ........................................ 221 22 5 2 9 259 Liability ............................................................... 1 13 2 8 24 48 Credit (non-life) .................................................. 264 – – 173 – 437 Marine, aviation and transport ............................ 1 11 3 – 12 27 Other non-life insurance contracts ..................... 13 24 – 37 20 94
Total net written insurance premiums ................ 711 182 28 220 232 1,373 2005 (restated2) Accident and health ............................................ 33 67 3 3 6 112 Motor .................................................................. 192 20 11 4 302 529 Fire and other damage ........................................ 251 34 3 5 61 354 Liability ............................................................... 229 17 2 91 14 353 Credit (non-life) .................................................. 225 – – 202 – 427 Marine, aviation and transport ............................ – 16 4 – 22 42 Other non-life insurance contracts ..................... 10 29 – 17 12 68
Total net written insurance premiums ................ 940 183 23 322 417 1,885
1 Net written insurance premiums represent gross written premiums less gross written premiums ceded to reinsurers. 2 In 2006, Mexico and Panama were reclassified from the North America segment to Latin America. Comparative information has been
restated accordingly. See Note 13 on the Financial Statements.
(Audited)
The above table of non-life net written insurance premiums provides an overall summary of the non-life insurance activity of the Group.
The main risks associated with non-life business are underwriting risk and claims experience risk.
Underwriting risk is the risk that HSBC does not charge premiums appropriate to the cover provided and claims experience risk is the risk that portfolio experience is worse than expected. HSBC manages these risks through pricing (for example, imposing restrictions and deductibles in the policy terms and conditions), product design, risk selection, claims
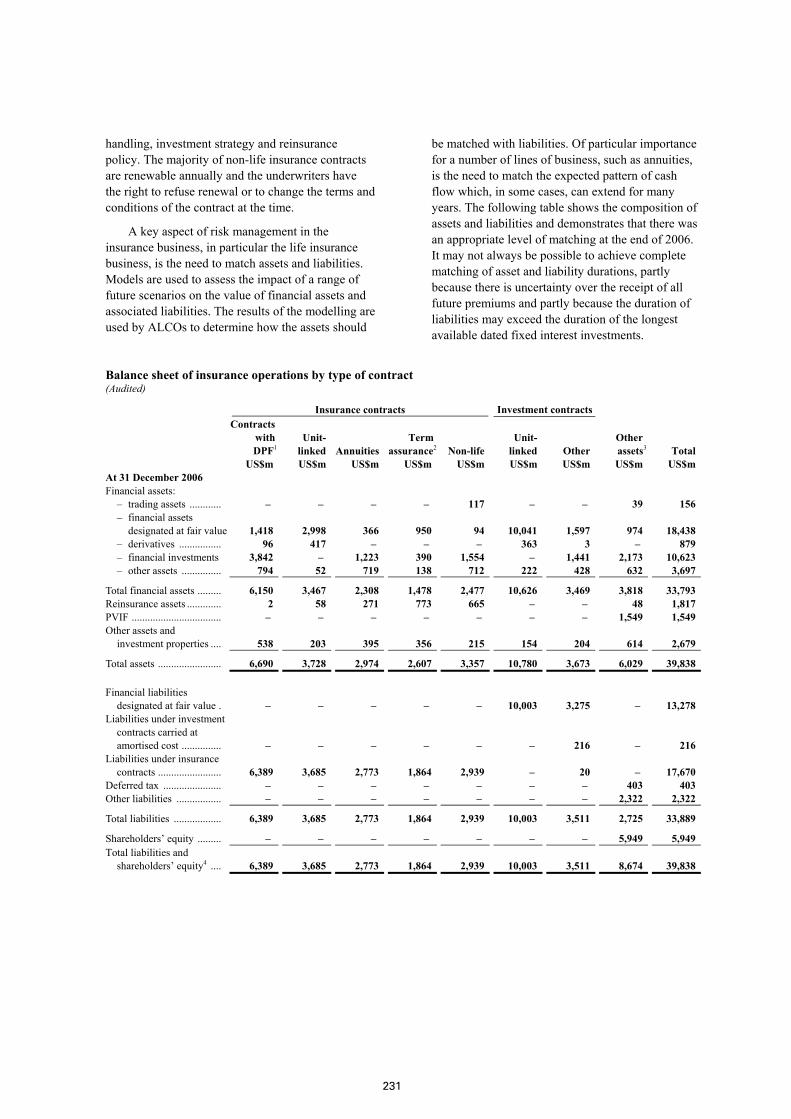
231
handling, investment strategy and reinsurance policy. The majority of non-life insurance contracts are renewable annually and the underwriters have the right to refuse renewal or to change the terms and conditions of the contract at the time.
A key aspect of risk management in the insurance business, in particular the life insurance business, is the need to match assets and liabilities. Models are used to assess the impact of a range of future scenarios on the value of financial assets and associated liabilities. The results of the modelling are used by ALCOs to determine how the assets should
be matched with liabilities. Of particular importance for a number of lines of business, such as annuities, is the need to match the expected pattern of cash flow which, in some cases, can extend for many years. The following table shows the composition of assets and liabilities and demonstrates that there was an appropriate level of matching at the end of 2006. It may not always be possible to achieve complete matching of asset and liability durations, partly because there is uncertainty over the receipt of all future premiums and partly because the duration of liabilities may exceed the duration of the longest available dated fixed interest investments.
Balance sheet of insurance operations by type of contract (Audited)
Insurance contracts Investment contracts
Contracts with DPF1
Unit- linked Annuities
Termassurance2
Non-life
Unit- linked Other
Other assets3
Total US$m US$m US$m US$m US$m US$m US$m US$m US$m At 31 December 2006 Financial assets:
– trading assets ............ – – – – 117 – – 39 156 – financial assets
designated at fair value 1,418 2,998 366 950 94 10,041 1,597 974 18,438 – derivatives ................ 96 417 – – – 363 3 – 879 – financial investments 3,842 – 1,223 390 1,554 – 1,441 2,173 10,623 – other assets ............... 794 52 719 138 712 222 428 632 3,697
Total financial assets ......... 6,150 3,467 2,308 1,478 2,477 10,626 3,469 3,818 33,793 Reinsurance assets ............. 2 58 271 773 665 – – 48 1,817 PVIF .................................. – – – – – – – 1,549 1,549 Other assets and
investment properties .... 538 203 395 356 215 154 204 614 2,679
Total assets ........................ 6,690 3,728 2,974 2,607 3,357 10,780 3,673 6,029 39,838 Financial liabilities
designated at fair value . – – – – – 10,003 3,275 – 13,278 Liabilities under investment
contracts carried at amortised cost ............... – – – – – – 216 – 216
Liabilities under insurance contracts ........................ 6,389 3,685 2,773 1,864 2,939 – 20 – 17,670
Deferred tax ...................... – – – – – – – 403 403 Other liabilities ................. – – – – – – – 2,322 2,322
Total liabilities .................. 6,389 3,685 2,773 1,864 2,939 10,003 3,511 2,725 33,889
Shareholders’ equity ......... – – – – – – – 5,949 5,949 Total liabilities and
shareholders’ equity4 .... 6,389 3,685 2,773 1,864 2,939 10,003 3,511 8,674 39,838
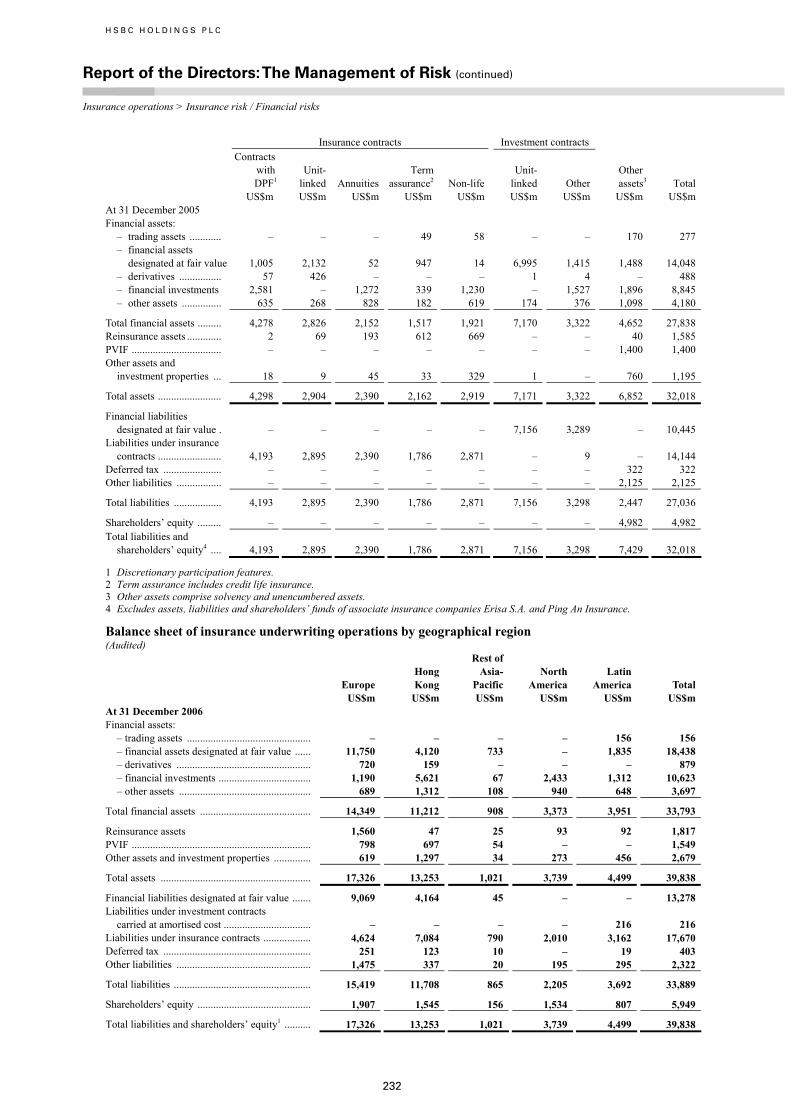
H S B C H O L D I N G S P L C
Report of the Directors: The Management of Risk (continued) Insurance operations > Insurance risk / Financial risks
232
Insurance contracts Investment contracts
Contracts with DPF1
Unit- linked Annuities
Term assurance2
Non-life
Unit- linked Other
Other assets3
Total US$m US$m US$m US$m US$m US$m US$m US$m US$m At 31 December 2005 Financial assets:
– trading assets ............ – – – 49 58 – – 170 277 – financial assets
designated at fair value 1,005 2,132 52 947 14 6,995 1,415 1,488 14,048 – derivatives ................ 57 426 – – – 1 4 – 488 – financial investments 2,581 – 1,272 339 1,230 – 1,527 1,896 8,845 – other assets ............... 635 268 828 182 619 174 376 1,098 4,180
Total financial assets ......... 4,278 2,826 2,152 1,517 1,921 7,170 3,322 4,652 27,838 Reinsurance assets ............. 2 69 193 612 669 – – 40 1,585 PVIF .................................. – – – – – – – 1,400 1,400 Other assets and
investment properties ... 18 9 45 33 329 1 – 760 1,195
Total assets ........................ 4,298 2,904 2,390 2,162 2,919 7,171 3,322 6,852 32,018
Financial liabilities designated at fair value . – – – – – 7,156 3,289 – 10,445
Liabilities under insurance contracts ........................ 4,193 2,895 2,390 1,786 2,871 – 9 – 14,144
Deferred tax ...................... – – – – – – – 322 322 Other liabilities ................. – – – – – – – 2,125 2,125
Total liabilities .................. 4,193 2,895 2,390 1,786 2,871 7,156 3,298 2,447 27,036
Shareholders’ equity ......... – – – – – – – 4,982 4,982 Total liabilities and
shareholders’ equity4 .... 4,193 2,895 2,390 1,786 2,871 7,156 3,298 7,429 32,018
1 Discretionary participation features. 2 Term assurance includes credit life insurance. 3 Other assets comprise solvency and unencumbered assets. 4 Excludes assets, liabilities and shareholders’ funds of associate insurance companies Erisa S.A. and Ping An Insurance.
Balance sheet of insurance underwriting operations by geographical region (Audited)
Europe Hong Kong
Rest of Asia- Pacific
North America
Latin America Total
US$m US$m US$m US$m US$m US$m At 31 December 2006 Financial assets:
– trading assets ............................................... – – – – 156 156 – financial assets designated at fair value ...... 11,750 4,120 733 – 1,835 18,438 – derivatives ................................................... 720 159 – – – 879 – financial investments ................................... 1,190 5,621 67 2,433 1,312 10,623 – other assets .................................................. 689 1,312 108 940 648 3,697
Total financial assets .......................................... 14,349 11,212 908 3,373 3,951 33,793
Reinsurance assets 1,560 47 25 93 92 1,817 PVIF .................................................................... 798 697 54 – – 1,549 Other assets and investment properties .............. 619 1,297 34 273 456 2,679
Total assets ......................................................... 17,326 13,253 1,021 3,739 4,499 39,838
Financial liabilities designated at fair value ....... 9,069 4,164 45 – – 13,278 Liabilities under investment contracts
carried at amortised cost ................................. – – – – 216 216 Liabilities under insurance contracts .................. 4,624 7,084 790 2,010 3,162 17,670 Deferred tax ........................................................ 251 123 10 – 19 403 Other liabilities ................................................... 1,475 337 20 195 295 2,322
Total liabilities .................................................... 15,419 11,708 865 2,205 3,692 33,889
Shareholders’ equity ........................................... 1,907 1,545 156 1,534 807 5,949
Total liabilities and shareholders’ equity1 .......... 17,326 13,253 1,021 3,739 4,499 39,838
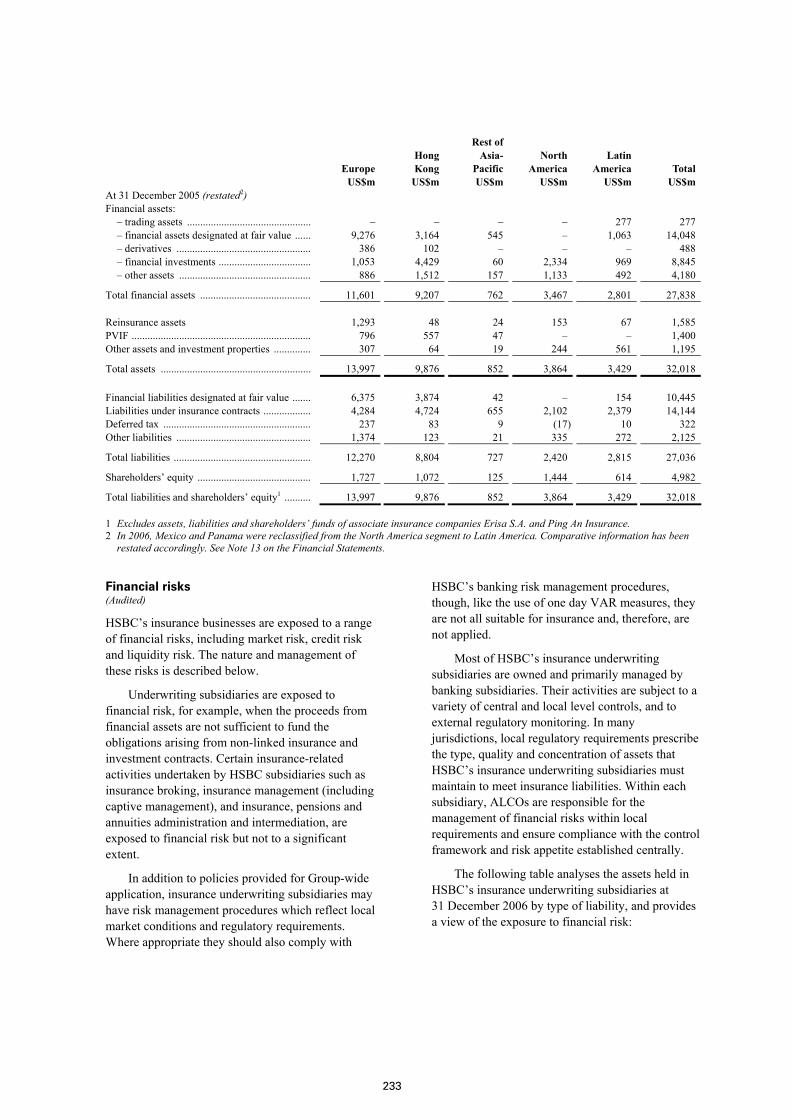
233
Europe Hong Kong
Rest of Asia- Pacific
North America
Latin America Total
US$m US$m US$m US$m US$m US$m At 31 December 2005 (restated2) Financial assets:
– trading assets ............................................... – – – – 277 277 – financial assets designated at fair value ...... 9,276 3,164 545 – 1,063 14,048 – derivatives ................................................... 386 102 – – – 488 – financial investments ................................... 1,053 4,429 60 2,334 969 8,845 – other assets .................................................. 886 1,512 157 1,133 492 4,180
Total financial assets .......................................... 11,601 9,207 762 3,467 2,801 27,838 Reinsurance assets 1,293 48 24 153 67 1,585 PVIF .................................................................... 796 557 47 – – 1,400 Other assets and investment properties .............. 307 64 19 244 561 1,195
Total assets ......................................................... 13,997 9,876 852 3,864 3,429 32,018 Financial liabilities designated at fair value ....... 6,375 3,874 42 – 154 10,445 Liabilities under insurance contracts .................. 4,284 4,724 655 2,102 2,379 14,144 Deferred tax ........................................................ 237 83 9 (17) 10 322 Other liabilities ................................................... 1,374 123 21 335 272 2,125
Total liabilities .................................................... 12,270 8,804 727 2,420 2,815 27,036
Shareholders’ equity ........................................... 1,727 1,072 125 1,444 614 4,982
Total liabilities and shareholders’ equity1 .......... 13,997 9,876 852 3,864 3,429 32,018
1 Excludes assets, liabilities and shareholders’ funds of associate insurance companies Erisa S.A. and Ping An Insurance. 2 In 2006, Mexico and Panama were reclassified from the North America segment to Latin America. Comparative information has been
restated accordingly. See Note 13 on the Financial Statements.
Financial risks (Audited)
HSBC’s insurance businesses are exposed to a range of financial risks, including market risk, credit risk and liquidity risk. The nature and management of these risks is described below.
Underwriting subsidiaries are exposed to financial risk, for example, when the proceeds from financial assets are not sufficient to fund the obligations arising from non-linked insurance and investment contracts. Certain insurance-related activities undertaken by HSBC subsidiaries such as insurance broking, insurance management (including captive management), and insurance, pensions and annuities administration and intermediation, are exposed to financial risk but not to a significant extent.
In addition to policies provided for Group-wide application, insurance underwriting subsidiaries may have risk management procedures which reflect local market conditions and regulatory requirements. Where appropriate they should also comply with
HSBC’s banking risk management procedures, though, like the use of one day VAR measures, they are not all suitable for insurance and, therefore, are not applied.
Most of HSBC’s insurance underwriting subsidiaries are owned and primarily managed by banking subsidiaries. Their activities are subject to a variety of central and local level controls, and to external regulatory monitoring. In many jurisdictions, local regulatory requirements prescribe the type, quality and concentration of assets that HSBC’s insurance underwriting subsidiaries must maintain to meet insurance liabilities. Within each subsidiary, ALCOs are responsible for the management of financial risks within local requirements and ensure compliance with the control framework and risk appetite established centrally.
The following table analyses the assets held in HSBC’s insurance underwriting subsidiaries at 31 December 2006 by type of liability, and provides a view of the exposure to financial risk:
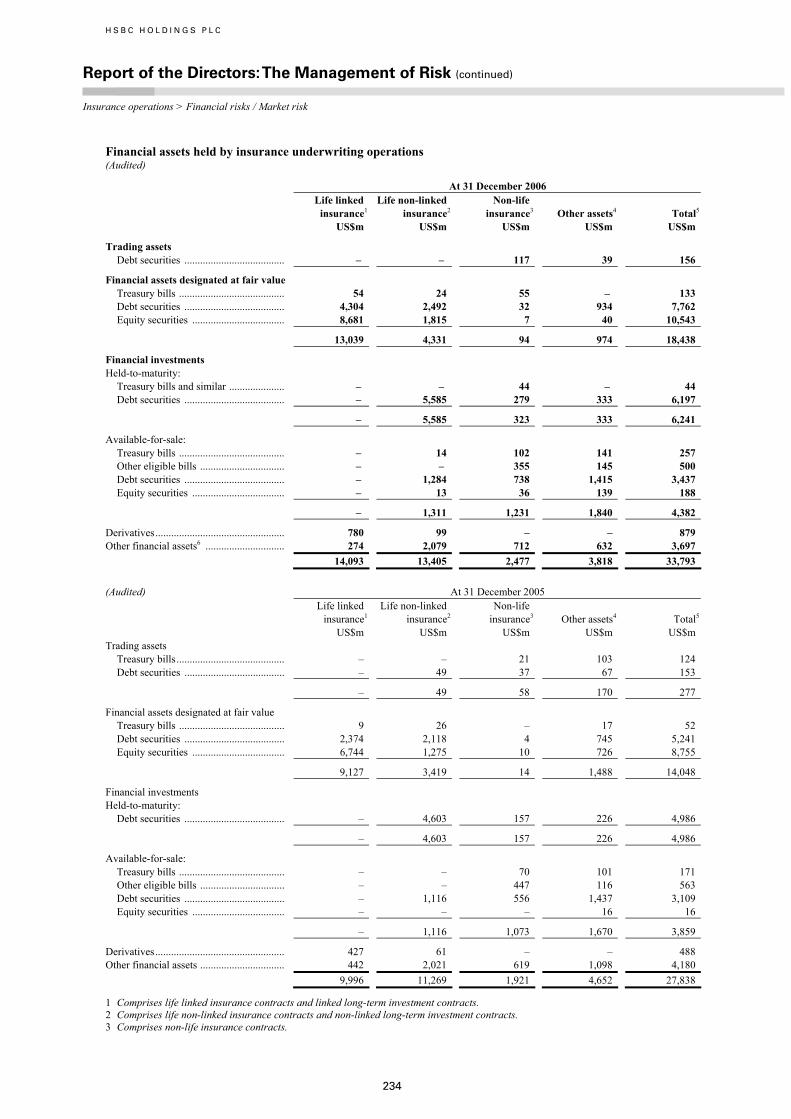
H S B C H O L D I N G S P L C
Report of the Directors: The Management of Risk (continued) Insurance operations > Financial risks / Market risk
234
Financial assets held by insurance underwriting operations (Audited)
At 31 December 2006 Life linked Life non-linked Non-life insurance1 insurance2 insurance3 Other assets4 Total5
US$m US$m US$m US$m US$m
Trading assets Debt securities ...................................... – – 117 39 156
Financial assets designated at fair value Treasury bills ........................................ 54 24 55 – 133 Debt securities ...................................... 4,304 2,492 32 934 7,762 Equity securities ................................... 8,681 1,815 7 40 10,543
13,039 4,331 94 974 18,438
Financial investments Held-to-maturity:
Treasury bills and similar ..................... – – 44 – 44 Debt securities ...................................... – 5,585 279 333 6,197
– 5,585 323 333 6,241
Available-for-sale: Treasury bills ........................................ – 14 102 141 257 Other eligible bills ................................ – – 355 145 500 Debt securities ...................................... – 1,284 738 1,415 3,437 Equity securities ................................... – 13 36 139 188
– 1,311 1,231 1,840 4,382
Derivatives................................................. 780 99 – – 879 Other financial assets6 .............................. 274 2,079 712 632 3,697 14,093 13,405 2,477 3,818 33,793
(Audited) At 31 December 2005 Life linked Life non-linked Non-life insurance1 insurance2 insurance3 Other assets4 Total5
US$m US$m US$m US$m US$m Trading assets
Treasury bills......................................... – – 21 103 124 Debt securities ...................................... – 49 37 67 153
– 49 58 170 277
Financial assets designated at fair value Treasury bills ........................................ 9 26 – 17 52 Debt securities ...................................... 2,374 2,118 4 745 5,241 Equity securities ................................... 6,744 1,275 10 726 8,755
9,127 3,419 14 1,488 14,048
Financial investments Held-to-maturity:
Debt securities ...................................... – 4,603 157 226 4,986
– 4,603 157 226 4,986
Available-for-sale: Treasury bills ........................................ – – 70 101 171 Other eligible bills ................................ – – 447 116 563 Debt securities ...................................... – 1,116 556 1,437 3,109 Equity securities ................................... – – – 16 16
– 1,116 1,073 1,670 3,859
Derivatives................................................. 427 61 – – 488 Other financial assets ................................ 442 2,021 619 1,098 4,180 9,996 11,269 1,921 4,652 27,838
1 Comprises life linked insurance contracts and linked long-term investment contracts. 2 Comprises life non-linked insurance contracts and non-linked long-term investment contracts. 3 Comprises non-life insurance contracts.
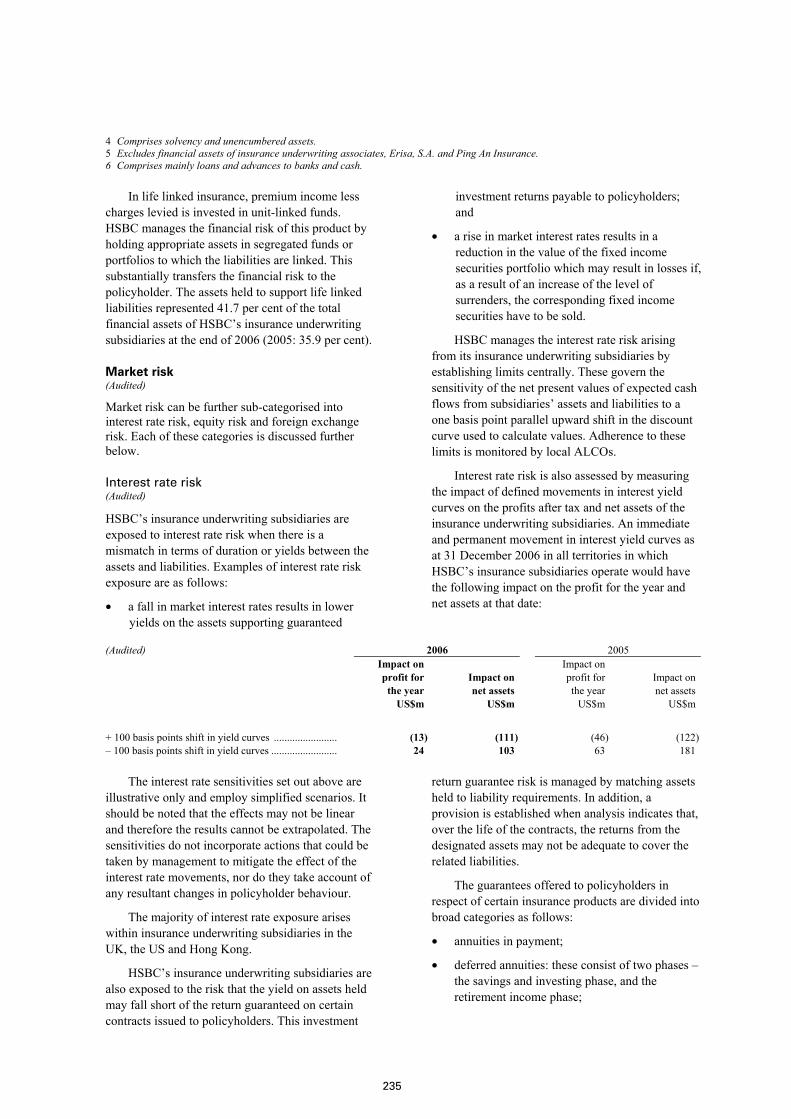
235
4 Comprises solvency and unencumbered assets. 5 Excludes financial assets of insurance underwriting associates, Erisa, S.A. and Ping An Insurance. 6 Comprises mainly loans and advances to banks and cash.
In life linked insurance, premium income less charges levied is invested in unit-linked funds. HSBC manages the financial risk of this product by holding appropriate assets in segregated funds or portfolios to which the liabilities are linked. This substantially transfers the financial risk to the policyholder. The assets held to support life linked liabilities represented 41.7 per cent of the total financial assets of HSBC’s insurance underwriting subsidiaries at the end of 2006 (2005: 35.9 per cent).
Market risk (Audited)
Market risk can be further sub-categorised into interest rate risk, equity risk and foreign exchange risk. Each of these categories is discussed further below.
Interest rate risk (Audited)
HSBC’s insurance underwriting subsidiaries are exposed to interest rate risk when there is a mismatch in terms of duration or yields between the assets and liabilities. Examples of interest rate risk exposure are as follows:
• a fall in market interest rates results in lower yields on the assets supporting guaranteed
investment returns payable to policyholders; and
• a rise in market interest rates results in a reduction in the value of the fixed income securities portfolio which may result in losses if, as a result of an increase of the level of surrenders, the corresponding fixed income securities have to be sold.
HSBC manages the interest rate risk arising from its insurance underwriting subsidiaries by establishing limits centrally. These govern the sensitivity of the net present values of expected cash flows from subsidiaries’ assets and liabilities to a one basis point parallel upward shift in the discount curve used to calculate values. Adherence to these limits is monitored by local ALCOs.
Interest rate risk is also assessed by measuring the impact of defined movements in interest yield curves on the profits after tax and net assets of the insurance underwriting subsidiaries. An immediate and permanent movement in interest yield curves as at 31 December 2006 in all territories in which HSBC’s insurance subsidiaries operate would have the following impact on the profit for the year and net assets at that date:
(Audited) 2006 2005
Impact on profit for the year
Impact on net assets
Impact on profit for the year
Impact on net assets
US$m US$m US$m US$m
+ 100 basis points shift in yield curves ........................ (13) (111) (46) (122)– 100 basis points shift in yield curves ......................... 24 103 63 181
The interest rate sensitivities set out above are illustrative only and employ simplified scenarios. It should be noted that the effects may not be linear and therefore the results cannot be extrapolated. The sensitivities do not incorporate actions that could be taken by management to mitigate the effect of the interest rate movements, nor do they take account of any resultant changes in policyholder behaviour.
The majority of interest rate exposure arises within insurance underwriting subsidiaries in the UK, the US and Hong Kong.
HSBC’s insurance underwriting subsidiaries are also exposed to the risk that the yield on assets held may fall short of the return guaranteed on certain contracts issued to policyholders. This investment
return guarantee risk is managed by matching assets held to liability requirements. In addition, a provision is established when analysis indicates that, over the life of the contracts, the returns from the designated assets may not be adequate to cover the related liabilities.
The guarantees offered to policyholders in respect of certain insurance products are divided into broad categories as follows:
• annuities in payment;
• deferred annuities: these consist of two phases – the savings and investing phase, and the retirement income phase;
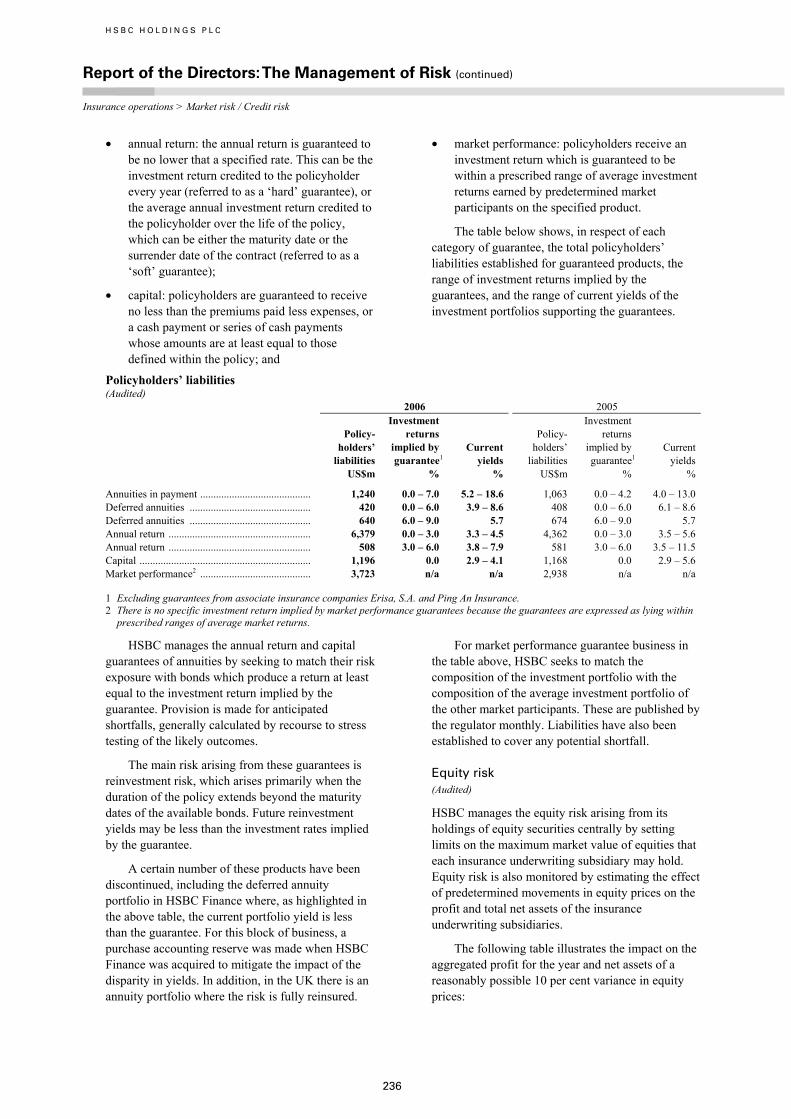
H S B C H O L D I N G S P L C
Report of the Directors: The Management of Risk (continued) Insurance operations > Market risk / Credit risk
236
• annual return: the annual return is guaranteed to be no lower that a specified rate. This can be the investment return credited to the policyholder every year (referred to as a ‘hard’ guarantee), or the average annual investment return credited to the policyholder over the life of the policy, which can be either the maturity date or the surrender date of the contract (referred to as a ‘soft’ guarantee);
• capital: policyholders are guaranteed to receive no less than the premiums paid less expenses, or a cash payment or series of cash payments whose amounts are at least equal to those defined within the policy; and
• market performance: policyholders receive an investment return which is guaranteed to be within a prescribed range of average investment returns earned by predetermined market participants on the specified product.
The table below shows, in respect of each category of guarantee, the total policyholders’ liabilities established for guaranteed products, the range of investment returns implied by the guarantees, and the range of current yields of the investment portfolios supporting the guarantees.
Policyholders’ liabilities (Audited) 2006 2005
Policy- holders’ liabilities
Investment returns implied by guarantee1
Current yields
Policy- holders’ liabilities
Investment returns implied by guarantee1
Current yields
US$m % % US$m % %
Annuities in payment .......................................... 1,240 0.0 – 7.0 5.2 – 18.6 1,063 0.0 – 4.2 4.0 – 13.0 Deferred annuities .............................................. 420 0.0 – 6.0 3.9 – 8.6 408 0.0 – 6.0 6.1 – 8.6 Deferred annuities .............................................. 640 6.0 – 9.0 5.7 674 6.0 – 9.0 5.7 Annual return ...................................................... 6,379 0.0 – 3.0 3.3 – 4.5 4,362 0.0 – 3.0 3.5 – 5.6 Annual return ...................................................... 508 3.0 – 6.0 3.8 – 7.9 581 3.0 – 6.0 3.5 – 11.5 Capital ................................................................. 1,196 0.0 2.9 – 4.1 1,168 0.0 2.9 – 5.6 Market performance2 .......................................... 3,723 n/a n/a 2,938 n/a n/a
1 Excluding guarantees from associate insurance companies Erisa, S.A. and Ping An Insurance. 2 There is no specific investment return implied by market performance guarantees because the guarantees are expressed as lying within
prescribed ranges of average market returns.
HSBC manages the annual return and capital guarantees of annuities by seeking to match their risk exposure with bonds which produce a return at least equal to the investment return implied by the guarantee. Provision is made for anticipated shortfalls, generally calculated by recourse to stress testing of the likely outcomes.
The main risk arising from these guarantees is reinvestment risk, which arises primarily when the duration of the policy extends beyond the maturity dates of the available bonds. Future reinvestment yields may be less than the investment rates implied by the guarantee.
A certain number of these products have been discontinued, including the deferred annuity portfolio in HSBC Finance where, as highlighted in the above table, the current portfolio yield is less than the guarantee. For this block of business, a purchase accounting reserve was made when HSBC Finance was acquired to mitigate the impact of the disparity in yields. In addition, in the UK there is an annuity portfolio where the risk is fully reinsured.
For market performance guarantee business in the table above, HSBC seeks to match the composition of the investment portfolio with the composition of the average investment portfolio of the other market participants. These are published by the regulator monthly. Liabilities have also been established to cover any potential shortfall.
Equity risk (Audited)
HSBC manages the equity risk arising from its holdings of equity securities centrally by setting limits on the maximum market value of equities that each insurance underwriting subsidiary may hold. Equity risk is also monitored by estimating the effect of predetermined movements in equity prices on the profit and total net assets of the insurance underwriting subsidiaries.
The following table illustrates the impact on the aggregated profit for the year and net assets of a reasonably possible 10 per cent variance in equity prices:
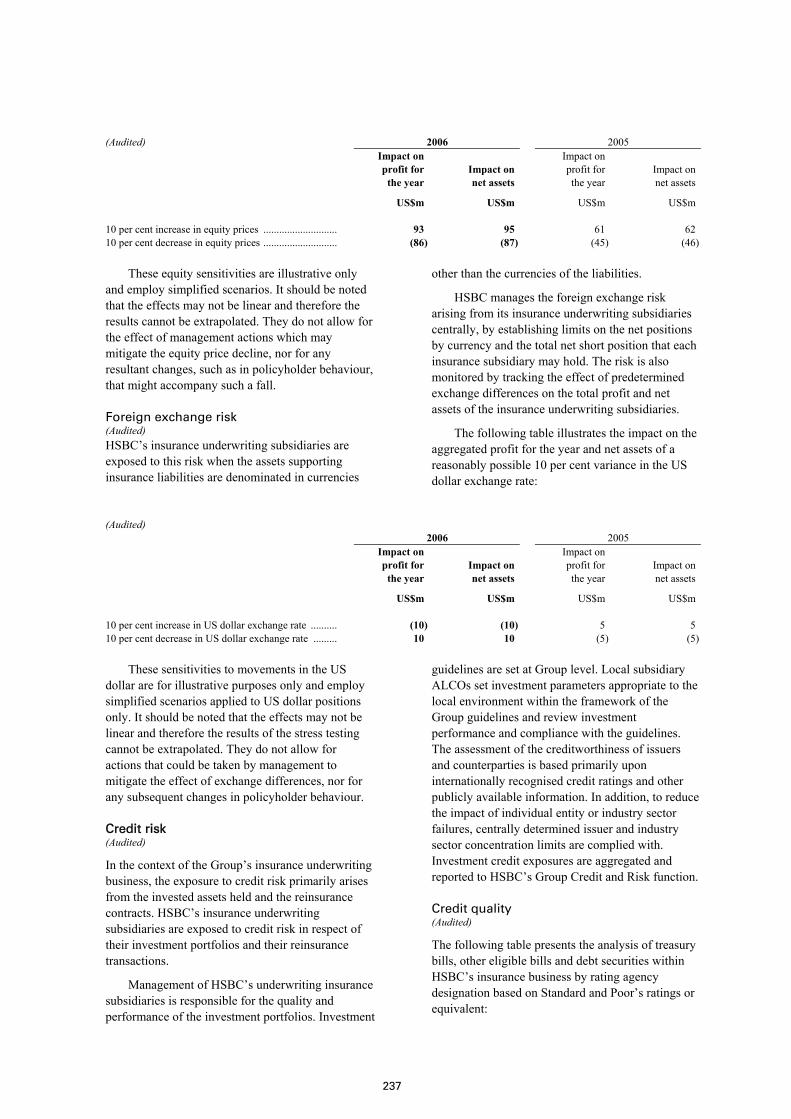
237
(Audited) 2006 2005
Impact on profit for the year
Impact on net assets
Impact on profit for the year
Impact on net assets
US$m US$m US$m US$m 10 per cent increase in equity prices ............................ 93 95 61 62 10 per cent decrease in equity prices ............................ (86) (87) (45) (46)
These equity sensitivities are illustrative only and employ simplified scenarios. It should be noted that the effects may not be linear and therefore the results cannot be extrapolated. They do not allow for the effect of management actions which may mitigate the equity price decline, nor for any resultant changes, such as in policyholder behaviour, that might accompany such a fall.
Foreign exchange risk (Audited) HSBC’s insurance underwriting subsidiaries are exposed to this risk when the assets supporting insurance liabilities are denominated in currencies
other than the currencies of the liabilities.
HSBC manages the foreign exchange risk arising from its insurance underwriting subsidiaries centrally, by establishing limits on the net positions by currency and the total net short position that each insurance subsidiary may hold. The risk is also monitored by tracking the effect of predetermined exchange differences on the total profit and net assets of the insurance underwriting subsidiaries.
The following table illustrates the impact on the aggregated profit for the year and net assets of a reasonably possible 10 per cent variance in the US dollar exchange rate:
(Audited) 2006 2005
Impact on profit for the year
Impact on net assets
Impact on profit for the year
Impact on net assets
US$m US$m US$m US$m 10 per cent increase in US dollar exchange rate .......... (10) (10) 5 5 10 per cent decrease in US dollar exchange rate ......... 10 10 (5) (5)
These sensitivities to movements in the US dollar are for illustrative purposes only and employ simplified scenarios applied to US dollar positions only. It should be noted that the effects may not be linear and therefore the results of the stress testing cannot be extrapolated. They do not allow for actions that could be taken by management to mitigate the effect of exchange differences, nor for any subsequent changes in policyholder behaviour.
Credit risk (Audited)
In the context of the Group’s insurance underwriting business, the exposure to credit risk primarily arises from the invested assets held and the reinsurance contracts. HSBC’s insurance underwriting subsidiaries are exposed to credit risk in respect of their investment portfolios and their reinsurance transactions.
Management of HSBC’s underwriting insurance subsidiaries is responsible for the quality and performance of the investment portfolios. Investment
guidelines are set at Group level. Local subsidiary ALCOs set investment parameters appropriate to the local environment within the framework of the Group guidelines and review investment performance and compliance with the guidelines. The assessment of the creditworthiness of issuers and counterparties is based primarily upon internationally recognised credit ratings and other publicly available information. In addition, to reduce the impact of individual entity or industry sector failures, centrally determined issuer and industry sector concentration limits are complied with. Investment credit exposures are aggregated and reported to HSBC’s Group Credit and Risk function.
Credit quality (Audited)
The following table presents the analysis of treasury bills, other eligible bills and debt securities within HSBC’s insurance business by rating agency designation based on Standard and Poor’s ratings or equivalent:
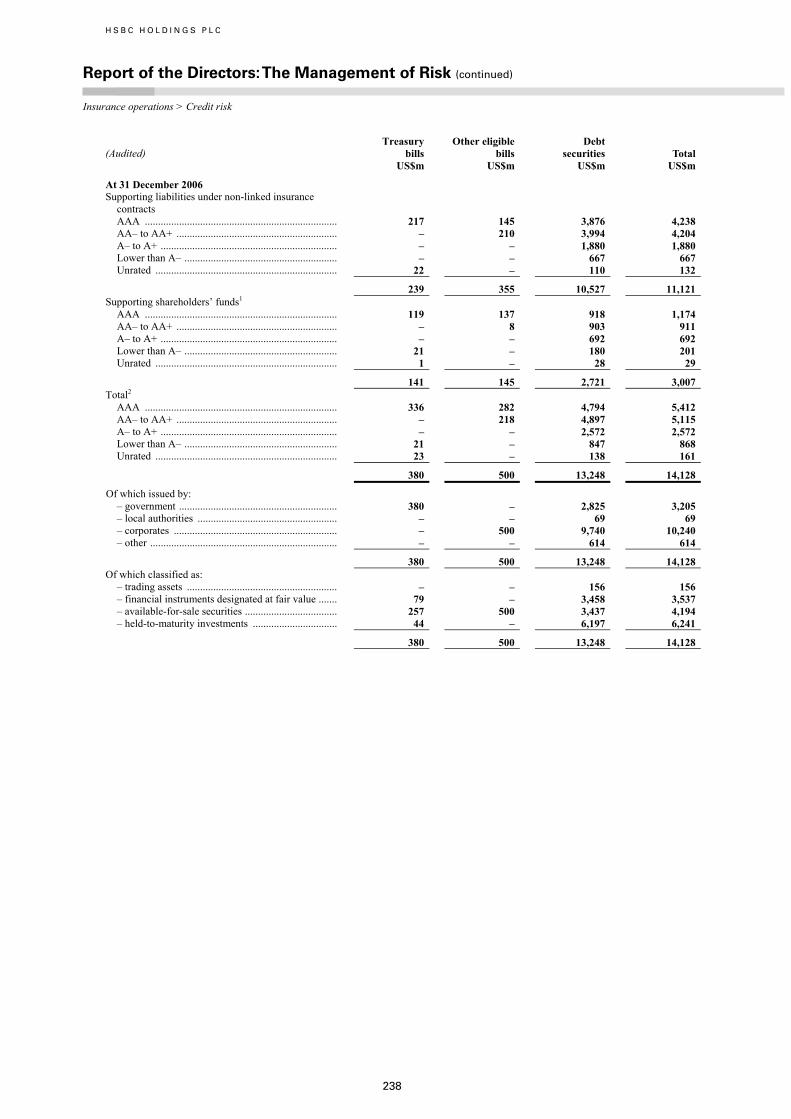
H S B C H O L D I N G S P L C
Report of the Directors: The Management of Risk (continued) Insurance operations > Credit risk
238
(Audited)
Treasury bills
Other eligible bills
Debt securities
Total
US$m US$m US$m US$m
At 31 December 2006 Supporting liabilities under non-linked insurance
contracts
AAA ......................................................................... 217 145 3,876 4,238 AA– to AA+ ............................................................. – 210 3,994 4,204 A– to A+ ................................................................... – – 1,880 1,880 Lower than A– .......................................................... – – 667 667 Unrated ..................................................................... 22 – 110 132
239 355 10,527 11,121 Supporting shareholders’ funds1
AAA ......................................................................... 119 137 918 1,174 AA– to AA+ ............................................................. – 8 903 911 A– to A+ ................................................................... – – 692 692 Lower than A– .......................................................... 21 – 180 201 Unrated ..................................................................... 1 – 28 29
141 145 2,721 3,007 Total2
AAA ......................................................................... 336 282 4,794 5,412 AA– to AA+ ............................................................. – 218 4,897 5,115 A– to A+ ................................................................... – – 2,572 2,572 Lower than A– .......................................................... 21 – 847 868 Unrated ..................................................................... 23 – 138 161
380 500 13,248 14,128
Of which issued by: – government ............................................................ 380 – 2,825 3,205 – local authorities ..................................................... – – 69 69 – corporates .............................................................. – 500 9,740 10,240 – other ....................................................................... – – 614 614
380 500 13,248 14,128 Of which classified as:
– trading assets ......................................................... – – 156 156 – financial instruments designated at fair value ....... 79 – 3,458 3,537 – available-for-sale securities ................................... 257 500 3,437 4,194 – held-to-maturity investments ................................ 44 – 6,197 6,241
380 500 13,248 14,128
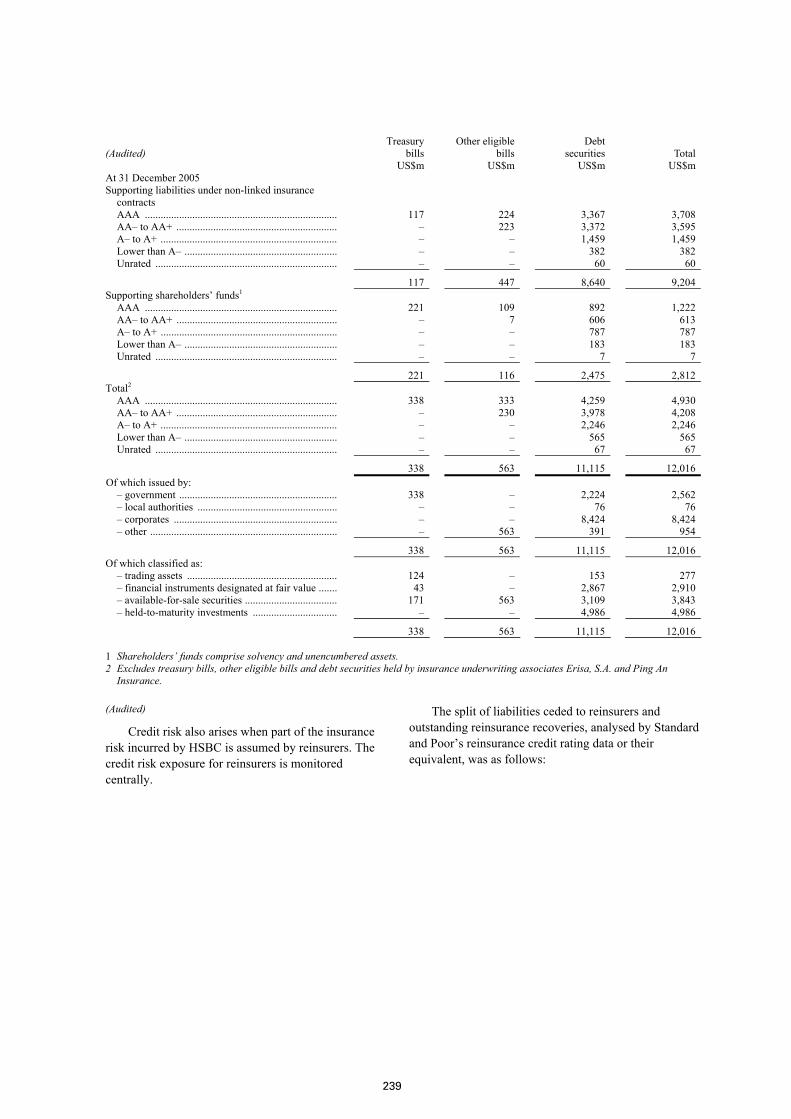
239
(Audited)
Treasury bills
Other eligible bills
Debt securities
Total
US$m US$m US$m US$m At 31 December 2005 Supporting liabilities under non-linked insurance
contracts
AAA ......................................................................... 117 224 3,367 3,708 AA– to AA+ ............................................................. – 223 3,372 3,595 A– to A+ ................................................................... – – 1,459 1,459 Lower than A– .......................................................... – – 382 382 Unrated ..................................................................... – – 60 60
117 447 8,640 9,204 Supporting shareholders’ funds1
AAA ......................................................................... 221 109 892 1,222 AA– to AA+ ............................................................. – 7 606 613 A– to A+ ................................................................... – – 787 787 Lower than A– .......................................................... – – 183 183 Unrated ..................................................................... – – 7 7
221 116 2,475 2,812 Total2
AAA ......................................................................... 338 333 4,259 4,930 AA– to AA+ ............................................................. – 230 3,978 4,208 A– to A+ ................................................................... – – 2,246 2,246 Lower than A– .......................................................... – – 565 565 Unrated ..................................................................... – – 67 67
338 563 11,115 12,016 Of which issued by:
– government ............................................................ 338 – 2,224 2,562 – local authorities ..................................................... – – 76 76 – corporates .............................................................. – – 8,424 8,424 – other ....................................................................... – 563 391 954
338 563 11,115 12,016 Of which classified as:
– trading assets ......................................................... 124 – 153 277 – financial instruments designated at fair value ....... 43 – 2,867 2,910 – available-for-sale securities ................................... 171 563 3,109 3,843 – held-to-maturity investments ................................ – – 4,986 4,986
338 563 11,115 12,016
1 Shareholders’ funds comprise solvency and unencumbered assets. 2 Excludes treasury bills, other eligible bills and debt securities held by insurance underwriting associates Erisa, S.A. and Ping An
Insurance.
(Audited)
Credit risk also arises when part of the insurance risk incurred by HSBC is assumed by reinsurers. The credit risk exposure for reinsurers is monitored centrally.
The split of liabilities ceded to reinsurers and outstanding reinsurance recoveries, analysed by Standard and Poor’s reinsurance credit rating data or their equivalent, was as follows:
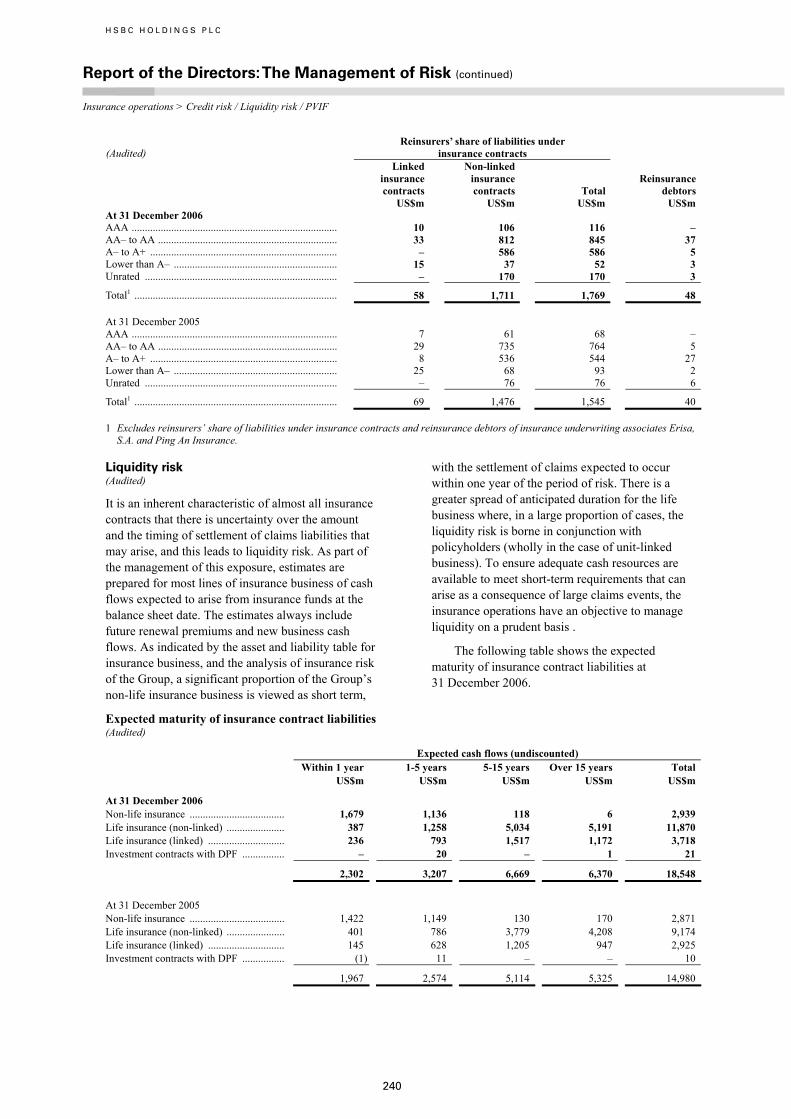
H S B C H O L D I N G S P L C
Report of the Directors: The Management of Risk (continued) Insurance operations > Credit risk / Liquidity risk / PVIF
240
(Audited)
Reinsurers’ share of liabilities under insurance contracts
Linked insurance contracts
Non-linked insurance contracts Total
Reinsurance debtors
US$m US$m US$m US$m At 31 December 2006 AAA .............................................................................. 10 106 116 – AA– to AA .................................................................... 33 812 845 37 A– to A+ ....................................................................... – 586 586 5 Lower than A– .............................................................. 15 37 52 3 Unrated ......................................................................... – 170 170 3
Total1 ............................................................................. 58 1,711 1,769 48 At 31 December 2005 AAA .............................................................................. 7 61 68 – AA– to AA .................................................................... 29 735 764 5 A– to A+ ....................................................................... 8 536 544 27 Lower than A– .............................................................. 25 68 93 2 Unrated ......................................................................... – 76 76 6
Total1 ............................................................................. 69 1,476 1,545 40
1 Excludes reinsurers’ share of liabilities under insurance contracts and reinsurance debtors of insurance underwriting associates Erisa, S.A. and Ping An Insurance.
Liquidity risk (Audited)
It is an inherent characteristic of almost all insurance contracts that there is uncertainty over the amount and the timing of settlement of claims liabilities that may arise, and this leads to liquidity risk. As part of the management of this exposure, estimates are prepared for most lines of insurance business of cash flows expected to arise from insurance funds at the balance sheet date. The estimates always include future renewal premiums and new business cash flows. As indicated by the asset and liability table for insurance business, and the analysis of insurance risk of the Group, a significant proportion of the Group’s non-life insurance business is viewed as short term,
with the settlement of claims expected to occur within one year of the period of risk. There is a greater spread of anticipated duration for the life business where, in a large proportion of cases, the liquidity risk is borne in conjunction with policyholders (wholly in the case of unit-linked business). To ensure adequate cash resources are available to meet short-term requirements that can arise as a consequence of large claims events, the insurance operations have an objective to manage liquidity on a prudent basis .
The following table shows the expected maturity of insurance contract liabilities at 31 December 2006.
Expected maturity of insurance contract liabilities (Audited)
Expected cash flows (undiscounted) Within 1 year 1-5 years 5-15 years Over 15 years Total US$m US$m US$m US$m US$m
At 31 December 2006 Non-life insurance .................................... 1,679 1,136 118 6 2,939 Life insurance (non-linked) ...................... 387 1,258 5,034 5,191 11,870 Life insurance (linked) ............................. 236 793 1,517 1,172 3,718 Investment contracts with DPF ................ – 20 – 1 21
2,302 3,207 6,669 6,370 18,548 At 31 December 2005 Non-life insurance .................................... 1,422 1,149 130 170 2,871 Life insurance (non-linked) ...................... 401 786 3,779 4,208 9,174 Life insurance (linked) ............................. 145 628 1,205 947 2,925 Investment contracts with DPF ................ (1) 11 – – 10
1,967 2,574 5,114 5,325 14,980
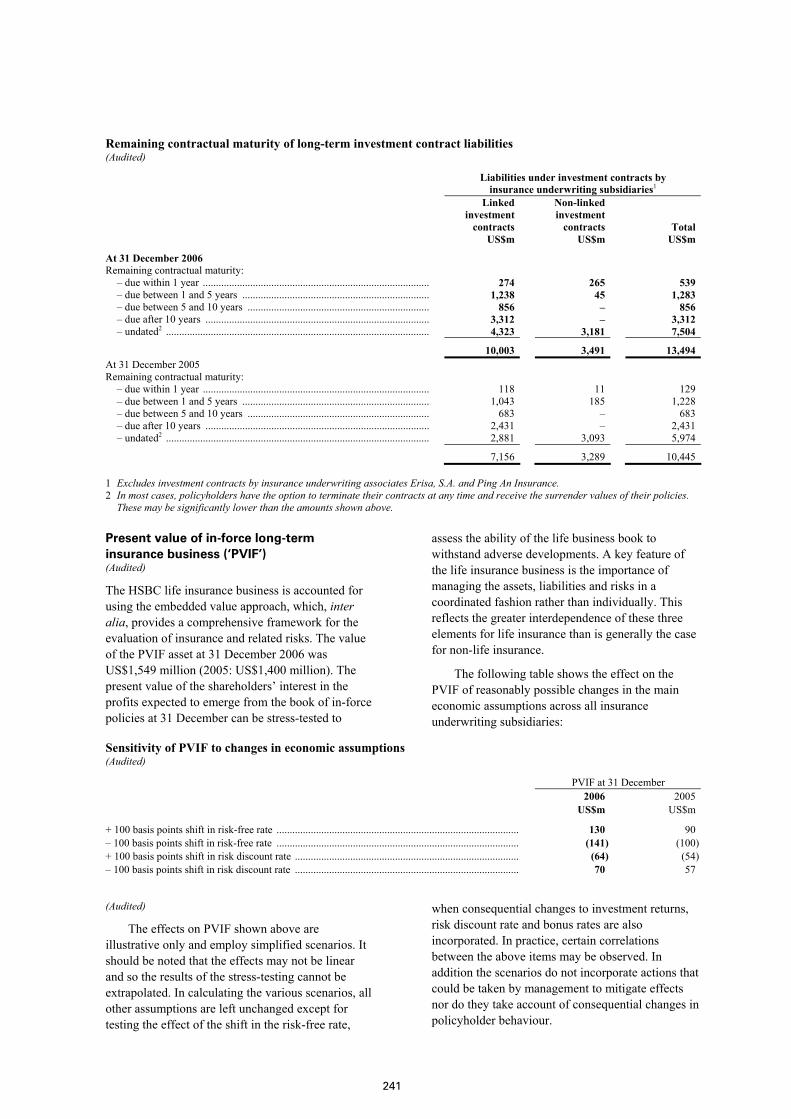
241
Remaining contractual maturity of long-term investment contract liabilities (Audited) Liabilities under investment contracts by
insurance underwriting subsidiaries1 Linked
investment contracts
Non-linked investment contracts
Total US$m US$m US$m
At 31 December 2006 Remaining contractual maturity:
– due within 1 year ...................................................................................... 274 265 539 – due between 1 and 5 years ....................................................................... 1,238 45 1,283 – due between 5 and 10 years ..................................................................... 856 – 856 – due after 10 years ..................................................................................... 3,312 – 3,312 – undated2 .................................................................................................... 4,323 3,181 7,504
10,003 3,491 13,494 At 31 December 2005 Remaining contractual maturity:
– due within 1 year ...................................................................................... 118 11 129 – due between 1 and 5 years ....................................................................... 1,043 185 1,228 – due between 5 and 10 years ..................................................................... 683 – 683 – due after 10 years ..................................................................................... 2,431 – 2,431 – undated2 .................................................................................................... 2,881 3,093 5,974
7,156 3,289 10,445
1 Excludes investment contracts by insurance underwriting associates Erisa, S.A. and Ping An Insurance. 2 In most cases, policyholders have the option to terminate their contracts at any time and receive the surrender values of their policies.
These may be significantly lower than the amounts shown above.
Present value of in-force long-term insurance business (‘PVIF’) (Audited)
The HSBC life insurance business is accounted for using the embedded value approach, which, inter alia, provides a comprehensive framework for the evaluation of insurance and related risks. The value of the PVIF asset at 31 December 2006 was US$1,549 million (2005: US$1,400 million). The present value of the shareholders’ interest in the profits expected to emerge from the book of in-force policies at 31 December can be stress-tested to
assess the ability of the life business book to withstand adverse developments. A key feature of the life insurance business is the importance of managing the assets, liabilities and risks in a coordinated fashion rather than individually. This reflects the greater interdependence of these three elements for life insurance than is generally the case for non-life insurance.
The following table shows the effect on the PVIF of reasonably possible changes in the main economic assumptions across all insurance underwriting subsidiaries:
Sensitivity of PVIF to changes in economic assumptions (Audited)
PVIF at 31 December 2006 2005 US$m US$m
+ 100 basis points shift in risk-free rate ............................................................................................ 130 90 – 100 basis points shift in risk-free rate ............................................................................................ (141) (100)+ 100 basis points shift in risk discount rate ..................................................................................... (64) (54)– 100 basis points shift in risk discount rate ..................................................................................... 70 57
(Audited)
The effects on PVIF shown above are illustrative only and employ simplified scenarios. It should be noted that the effects may not be linear and so the results of the stress-testing cannot be extrapolated. In calculating the various scenarios, all other assumptions are left unchanged except for testing the effect of the shift in the risk-free rate,
when consequential changes to investment returns, risk discount rate and bonus rates are also incorporated. In practice, certain correlations between the above items may be observed. In addition the scenarios do not incorporate actions that could be taken by management to mitigate effects nor do they take account of consequential changes in policyholder behaviour.
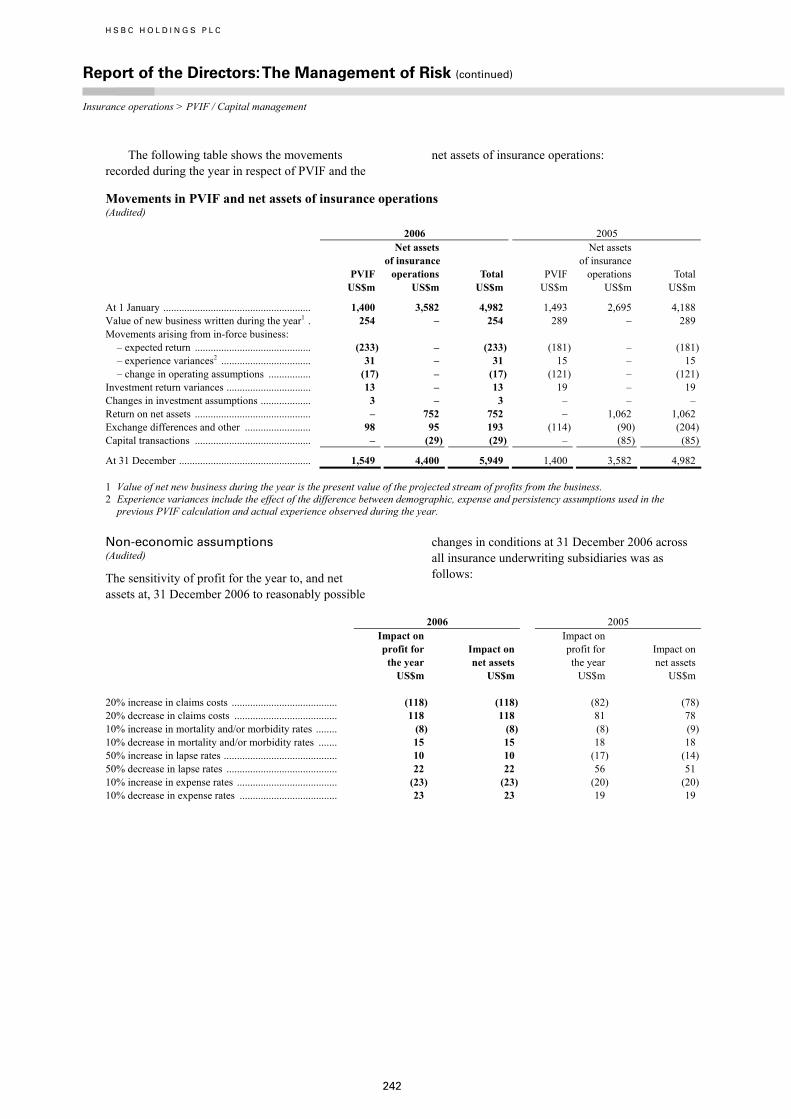
H S B C H O L D I N G S P L C
Report of the Directors: The Management of Risk (continued) Insurance operations > PVIF / Capital management
242
The following table shows the movements recorded during the year in respect of PVIF and the
net assets of insurance operations:
Movements in PVIF and net assets of insurance operations (Audited)
2006 2005
PVIF
Net assets of insurance operations Total PVIF
Net assets of insurance operations Total
US$m US$m US$m US$m US$m US$m
At 1 January ........................................................ 1,400 3,582 4,982 1,493 2,695 4,188 Value of new business written during the year1 . 254 – 254 289 – 289 Movements arising from in-force business:
– expected return ............................................ (233) – (233) (181) – (181)– experience variances2 .................................. 31 – 31 15 – 15 – change in operating assumptions ................ (17) – (17) (121) – (121)
Investment return variances ................................ 13 – 13 19 – 19 Changes in investment assumptions ................... 3 – 3 – – – Return on net assets ............................................ – 752 752 – 1,062 1,062 Exchange differences and other ......................... 98 95 193 (114) (90) (204)Capital transactions ............................................ – (29) (29) – (85) (85)
At 31 December .................................................. 1,549 4,400 5,949 1,400 3,582 4,982
1 Value of net new business during the year is the present value of the projected stream of profits from the business. 2 Experience variances include the effect of the difference between demographic, expense and persistency assumptions used in the
previous PVIF calculation and actual experience observed during the year.
Non-economic assumptions (Audited)
The sensitivity of profit for the year to, and net assets at, 31 December 2006 to reasonably possible
changes in conditions at 31 December 2006 across all insurance underwriting subsidiaries was as follows:
2006 2005
Impact on profit for the year
Impact on net assets
Impact on profit for the year
Impact on net assets
US$m US$m US$m US$m 20% increase in claims costs ........................................ (118) (118) (82) (78)20% decrease in claims costs ....................................... 118 118 81 78 10% increase in mortality and/or morbidity rates ........ (8) (8) (8) (9)10% decrease in mortality and/or morbidity rates ....... 15 15 18 18 50% increase in lapse rates ........................................... 10 10 (17) (14)50% decrease in lapse rates .......................................... 22 22 56 51 10% increase in expense rates ...................................... (23) (23) (20) (20)10% decrease in expense rates ..................................... 23 23 19 19
243
Capital management and allocation
Capital management (Audited)
It is HSBC’s policy to maintain a strong capital base to support the development of its business and to meet regulatory capital requirements at all times. In addition, the level of capital held by HSBC Holdings and other major subsidiaries, particularly HSBC Finance, is determined by its rating targets. HSBC currently uses a benchmark minimum tier 1 capital ratio of 8.25 per cent for the purposes of its long-term capital planning. HSBC recognises the impact on shareholder returns of the level of equity capital employed within HSBC and seeks to maintain a prudent balance between the advantages and flexibility afforded by a strong capital position and the higher returns on equity possible with greater leverage.
An annual Group capital plan is prepared and approved by the Board with the objective of maintaining both the optimal amount of capital and the mix between the different components of capital. The Group’s policy is to hold capital in a range of different forms and from diverse sources and all capital raising is agreed with major subsidiaries as part of their individual and the Group’s capital management process. Major subsidiaries would usually raise their own non-equity tier 1 capital and subordinated debt in accordance with the Group’s guidelines regarding market and investor concentration, cost, market conditions, timing and maturity profile. The subordinated debt requirements of other HSBC companies are met internally.
Each subsidiary manages its own capital within the context of the approved annual Group capital plan, which determines levels of risk-weighted asset growth and the optimal amount and mix of capital required to support planned business growth. As part of HSBC’s capital management policy, capital generated in excess of planned requirements is returned to HSBC Holdings, normally by way of dividends.
HSBC Holdings is primarily a provider of equity capital to its subsidiaries. These investments are substantially funded by HSBC Holdings’ own capital issuance and profit retentions. HSBC Holdings seeks to maintain a prudent balance between the composition of its capital and that of its investment in subsidiaries.
The principal forms of capital are included in the following balances on the consolidated balance sheet: called up share capital, share premium account, other reserves, retained earnings, and
subordinated liabilities. Capital also includes the collective impairment allowances held in respect of loans and advances.
Capital measurement and allocation (Audited)
The FSA supervises HSBC on a consolidated basis and, as such, receives information on the capital adequacy of, and sets capital requirements for, HSBC as a whole. Individual banking subsidiaries are directly regulated by their local banking supervisors, who set and monitor their capital adequacy requirements. In most jurisdictions, non-banking financial subsidiaries are also subject to the supervision and capital requirements of local regulatory authorities. Since 1988, when the governors of the Group of Ten central banks agreed to guidelines for the international convergence of capital measurement and standards, known as the Basel Capital Accord (Basel I), the banking supervisors of HSBC’s major banking subsidiaries have exercised capital adequacy supervision within a broadly similar framework.
In implementing the EU’s Banking Consolidation Directive, the FSA requires each bank and banking group to maintain an individually prescribed ratio of total capital to risk-weighted assets taking into account both balance sheet assets and off-balance sheet transactions. Under the EU’s Capital Adequacy Directive, the FSA allows banks to calculate capital requirements for market risk in the trading book using VAR techniques. HSBC complied with the FSA’s capital adequacy requirements throughout 2006 and 2005.
HSBC’s capital is divided into two tiers:
• Tier 1 capital comprises shareholders’ funds, innovative tier 1 securities and minority interests in tier 1 capital, after adjusting for items reflected in shareholders’ funds which are treated differently for the purposes of capital adequacy. The book values of goodwill and intangible assets are deducted in arriving at tier 1 capital.
• Tier 2 capital comprises qualifying subordinated loan capital, collective impairment allowances, minority and other interests in tier 2 capital and unrealised gains arising on the fair valuation of equity instruments held as available-for-sale. Tier 2 capital also includes reserves arising from the revaluation of properties.
Various limits are applied to elements of the capital base. The amount of innovative tier 1 securities cannot exceed 15 per cent of overall tier 1 capital, qualifying tier 2 capital cannot exceed tier 1
H S B C H O L D I N G S P L C
Report of the Directors: The Management of Risk (continued) Capital management > Capital measurement
244
capital, and qualifying term subordinated loan capital may not exceed 50 per cent of tier 1 capital. There are also limitations on the amount of collective impairment allowances which may be included as part of tier 2 capital. From the total of tier 1 and tier 2 capital are deducted the carrying amounts of unconsolidated investments, investments in the capital of banks, and certain regulatory items. Changes to the definition of capital came into force on 1 January 2007 and further details are provided under ‘Future developments’ below.
Banking operations are categorised as either trading book or banking book and risk-weighted assets are determined accordingly. Banking book risk-weighted assets are measured by means of a hierarchy of risk weightings classified according to the nature of each asset and counterparty, taking into account any eligible collateral or guarantees. Banking book off-balance sheet items giving rise to credit, foreign exchange or interest rate risk are assigned weights appropriate to the category of the counterparty, taking into account any eligible collateral or guarantees. Trading book risk-weighted assets are determined by taking into account market- related risks such as foreign exchange, interest rate and equity position risks, and counterparty risk.
Future developments
Basel II (Audited)
The Basel Committee on Banking Supervision (‘the Basel Committee’) has published a new framework for calculating minimum capital requirements. Known as ‘Basel II’, it will replace the 1988 Basel Capital Accord. Basel II is structured around three ‘pillars’: minimum capital requirements, supervisory review process and market discipline. The supervisory objectives for Basel II are to promote safety and soundness in the financial system and maintain at least the current overall level of capital in the system; enhance competitive equality; constitute a more comprehensive approach to addressing risks; and focus on internationally active banks.
With respect to pillar one minimum capital requirements, Basel II provides three approaches, of increasing sophistication, to the calculation of credit risk regulatory capital. The most basic, the standardised approach, requires banks to use external credit ratings to determine the risk weightings applied to rated counterparties, and groups other counterparties into broad categories and applies standardised risk weightings to these categories. In the next level, the internal ratings-based foundation
approach, allows banks to calculate their credit risk regulatory capital requirement on the basis of their internal assessment of the probability that a counterparty will default, but with quantification of exposure and loss estimates being subject to standard supervisory parameters. Finally, the internal ratings-based advanced approach, will allow banks to use their own internal assessment of not only the probability of default but also the quantification of exposure at default and loss given default.
Basel II also introduces capital requirements for operational risk and, again, contains three levels of sophistication. The capital required under the basic indicator approach will be a simple percentage of gross revenues, whereas under the standardised approach it will be one of three different percentages of gross revenues allocated to each of eight defined business lines. Finally, the advanced measurement approach uses banks’ own statistical analysis and modelling of operational risk data to determine capital requirements.
The EU Capital Requirements Directive (‘CRD’) recast the Banking Consolidation Directive and the Capital Adequacy Directive and will be the means by which Basel II will be implemented in the EU. The CRD was formally adopted by the Council and European Parliament on 14 June 2006 and it requires EU Member States to bring implementing provisions into force on 1 January 2007. In the case of the provisions relating to the implementation of the internal ratings-based advanced approach to credit risk and the advanced measurement approach to operational risk, implementation becomes available 1 January 2008.
In October 2006, the FSA published the General Prudential Sourcebook (‘GENPRU’) and the Prudential Sourcebook for Banks, Building Societies and Investment Firms (‘BIPRU’), which take effect from 1 January 2007 and implement the CRD in the UK. GENPRU introduces changes to the definition of capital and the methodology for calculating capital ratios. Changes include relaxation of the rules regarding the deduction of investments in other banks capital and proportional rather than full consolidation of associates. In addition, certain deductions from capital, previously taken from total capital will be deducted 50 per cent each from tier 1 and tier 2 for Pillar 3 disclosure purposes.
BIPRU introduces the Basel II requirements for the calculation of capital requirements as well as changes to the consolidation regime, the trading book definition and various ancillary provisions. In respect of counterparty risk in the trading book, certain changes have been
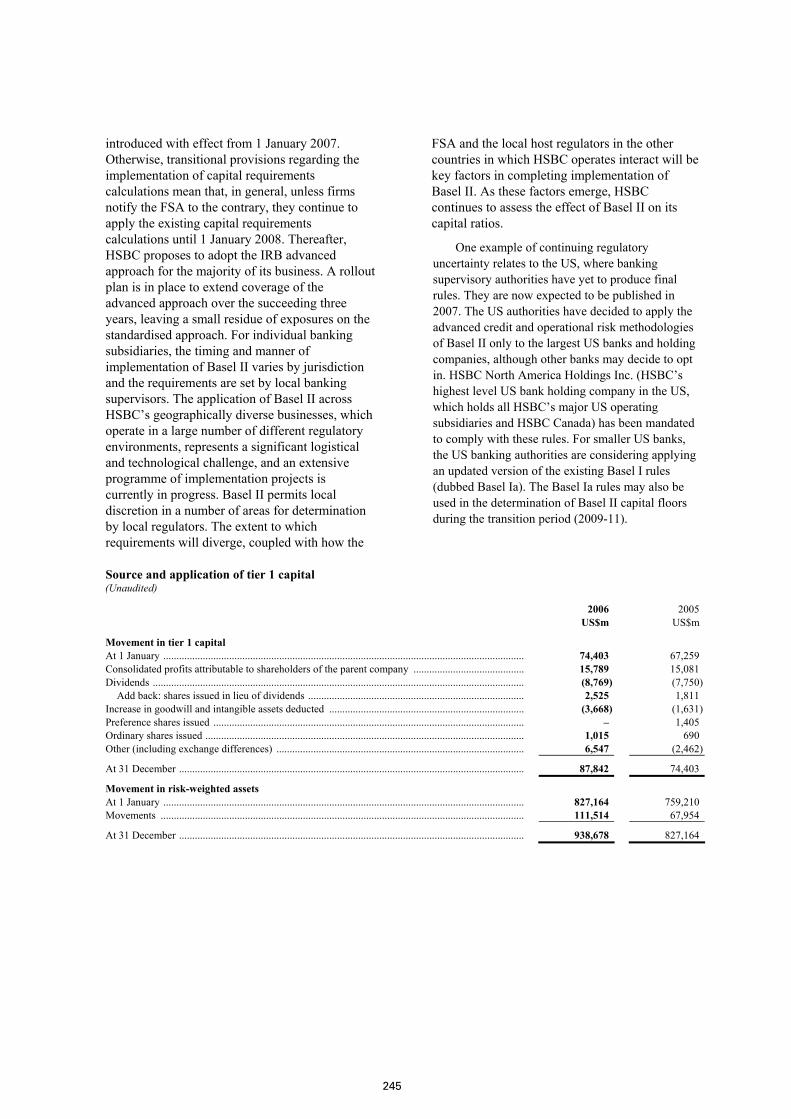
245
introduced with effect from 1 January 2007. Otherwise, transitional provisions regarding the implementation of capital requirements calculations mean that, in general, unless firms notify the FSA to the contrary, they continue to apply the existing capital requirements calculations until 1 January 2008. Thereafter, HSBC proposes to adopt the IRB advanced approach for the majority of its business. A rollout plan is in place to extend coverage of the advanced approach over the succeeding three years, leaving a small residue of exposures on the standardised approach. For individual banking subsidiaries, the timing and manner of implementation of Basel II varies by jurisdiction and the requirements are set by local banking supervisors. The application of Basel II across HSBC’s geographically diverse businesses, which operate in a large number of different regulatory environments, represents a significant logistical and technological challenge, and an extensive programme of implementation projects is currently in progress. Basel II permits local discretion in a number of areas for determination by local regulators. The extent to which requirements will diverge, coupled with how the
FSA and the local host regulators in the other countries in which HSBC operates interact will be key factors in completing implementation of Basel II. As these factors emerge, HSBC continues to assess the effect of Basel II on its capital ratios.
One example of continuing regulatory uncertainty relates to the US, where banking supervisory authorities have yet to produce final rules. They are now expected to be published in 2007. The US authorities have decided to apply the advanced credit and operational risk methodologies of Basel II only to the largest US banks and holding companies, although other banks may decide to opt in. HSBC North America Holdings Inc. (HSBC’s highest level US bank holding company in the US, which holds all HSBC’s major US operating subsidiaries and HSBC Canada) has been mandated to comply with these rules. For smaller US banks, the US banking authorities are considering applying an updated version of the existing Basel I rules (dubbed Basel Ia). The Basel Ia rules may also be used in the determination of Basel II capital floors during the transition period (2009-11).
Source and application of tier 1 capital (Unaudited)
2006 US$m
2005 US$m
Movement in tier 1 capital At 1 January ......................................................................................................................................... 74,403 67,259 Consolidated profits attributable to shareholders of the parent company .......................................... 15,789 15,081 Dividends ............................................................................................................................................. (8,769) (7,750) Add back: shares issued in lieu of dividends .................................................................................. 2,525 1,811 Increase in goodwill and intangible assets deducted .......................................................................... (3,668) (1,631)Preference shares issued ...................................................................................................................... – 1,405 Ordinary shares issued ......................................................................................................................... 1,015 690 Other (including exchange differences) .............................................................................................. 6,547 (2,462)
At 31 December ................................................................................................................................... 87,842 74,403
Movement in risk-weighted assets At 1 January ......................................................................................................................................... 827,164 759,210 Movements .......................................................................................................................................... 111,514 67,954
At 31 December ................................................................................................................................... 938,678 827,164
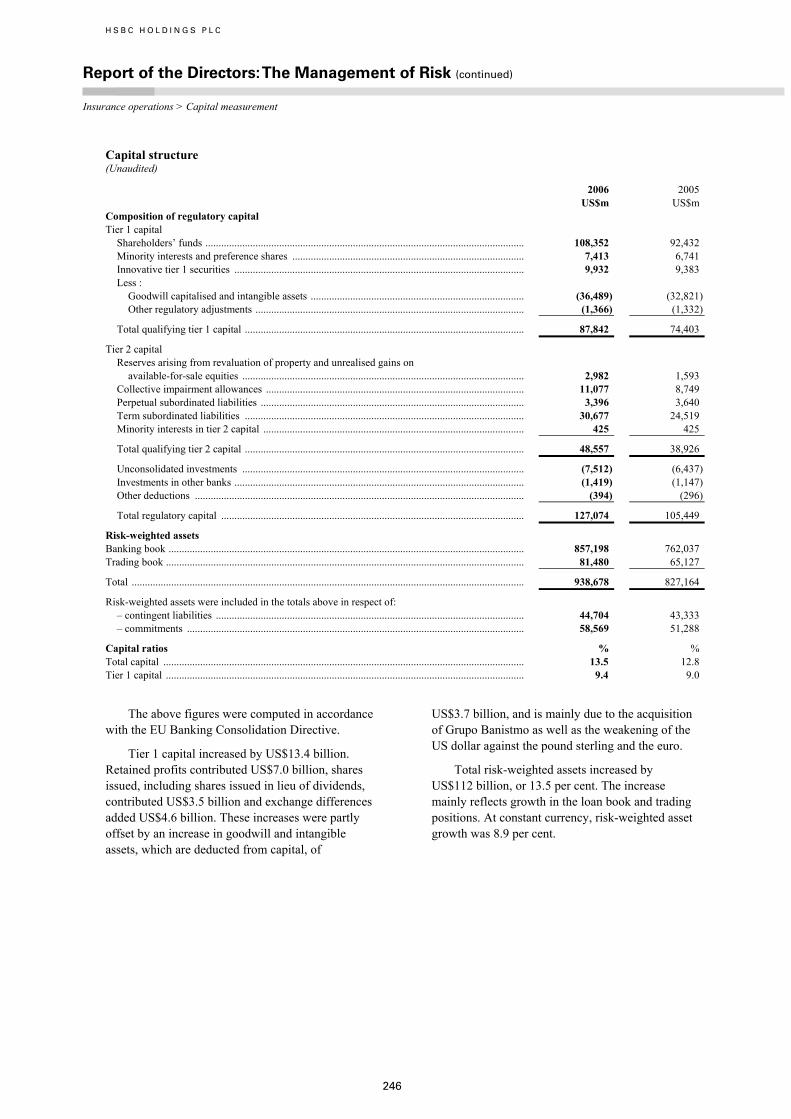
H S B C H O L D I N G S P L C
Report of the Directors: The Management of Risk (continued) Insurance operations > Capital measurement
246
Capital structure (Unaudited)
2006 US$m
2005 US$m
Composition of regulatory capital Tier 1 capital
Shareholders’ funds ......................................................................................................................... 108,352 92,432 Minority interests and preference shares ........................................................................................ 7,413 6,741 Innovative tier 1 securities .............................................................................................................. 9,932 9,383 Less : Goodwill capitalised and intangible assets ................................................................................. (36,489) (32,821) Other regulatory adjustments ...................................................................................................... (1,366) (1,332)
Total qualifying tier 1 capital .......................................................................................................... 87,842 74,403
Tier 2 capital Reserves arising from revaluation of property and unrealised gains on
available-for-sale equities ........................................................................................................... 2,982 1,593 Collective impairment allowances .................................................................................................. 11,077 8,749 Perpetual subordinated liabilities .................................................................................................... 3,396 3,640 Term subordinated liabilities .......................................................................................................... 30,677 24,519 Minority interests in tier 2 capital ................................................................................................... 425 425
Total qualifying tier 2 capital .......................................................................................................... 48,557 38,926
Unconsolidated investments ........................................................................................................... (7,512) (6,437)Investments in other banks .............................................................................................................. (1,419) (1,147)Other deductions ............................................................................................................................. (394) (296)
Total regulatory capital ................................................................................................................... 127,074 105,449
Risk-weighted assets Banking book ....................................................................................................................................... 857,198 762,037 Trading book ........................................................................................................................................ 81,480 65,127
Total ..................................................................................................................................................... 938,678 827,164
Risk-weighted assets were included in the totals above in respect of: – contingent liabilities ..................................................................................................................... 44,704 43,333 – commitments ................................................................................................................................ 58,569 51,288
Capital ratios % % Total capital ......................................................................................................................................... 13.5 12.8 Tier 1 capital ........................................................................................................................................ 9.4 9.0
The above figures were computed in accordance with the EU Banking Consolidation Directive.
Tier 1 capital increased by US$13.4 billion. Retained profits contributed US$7.0 billion, shares issued, including shares issued in lieu of dividends, contributed US$3.5 billion and exchange differences added US$4.6 billion. These increases were partly offset by an increase in goodwill and intangible assets, which are deducted from capital, of
US$3.7 billion, and is mainly due to the acquisition of Grupo Banistmo as well as the weakening of the US dollar against the pound sterling and the euro.
Total risk-weighted assets increased by US$112 billion, or 13.5 per cent. The increase mainly reflects growth in the loan book and trading positions. At constant currency, risk-weighted asset growth was 8.9 per cent.
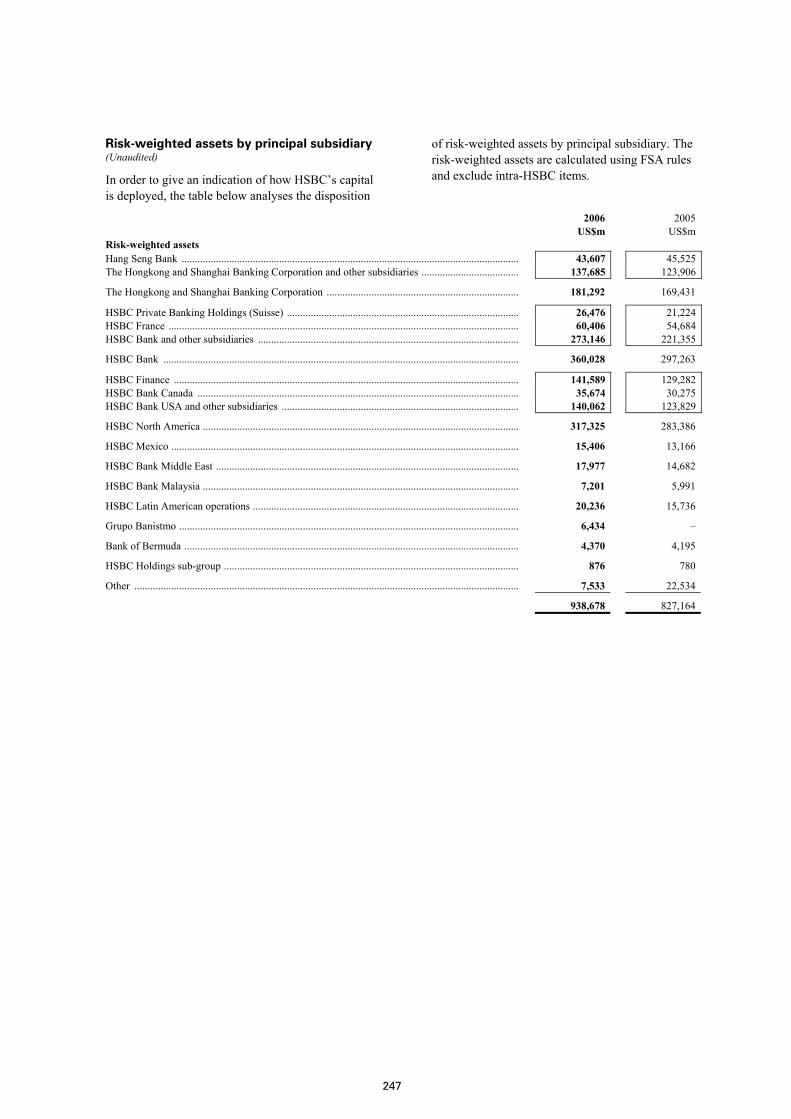
247
Risk-weighted assets by principal subsidiary (Unaudited)
In order to give an indication of how HSBC’s capital is deployed, the table below analyses the disposition
of risk-weighted assets by principal subsidiary. The risk-weighted assets are calculated using FSA rules and exclude intra-HSBC items.
2006 US$m
2005 US$m
Risk-weighted assets Hang Seng Bank ................................................................................................................................ 43,607 45,525The Hongkong and Shanghai Banking Corporation and other subsidiaries ..................................... 137,685 123,906
The Hongkong and Shanghai Banking Corporation ......................................................................... 181,292 169,431
HSBC Private Banking Holdings (Suisse) ........................................................................................ 26,476 21,224HSBC France ..................................................................................................................................... 60,406 54,684HSBC Bank and other subsidiaries ................................................................................................... 273,146 221,355
HSBC Bank ....................................................................................................................................... 360,028 297,263
HSBC Finance ................................................................................................................................... 141,589 129,282HSBC Bank Canada .......................................................................................................................... 35,674 30,275HSBC Bank USA and other subsidiaries .......................................................................................... 140,062 123,829
HSBC North America ........................................................................................................................ 317,325 283,386
HSBC Mexico .................................................................................................................................... 15,406 13,166
HSBC Bank Middle East ................................................................................................................... 17,977 14,682
HSBC Bank Malaysia ........................................................................................................................ 7,201 5,991
HSBC Latin American operations ..................................................................................................... 20,236 15,736
Grupo Banistmo ................................................................................................................................. 6,434 –
Bank of Bermuda ............................................................................................................................... 4,370 4,195
HSBC Holdings sub-group ................................................................................................................ 876 780
Other .................................................................................................................................................. 7,533 22,534
938,678 827,164
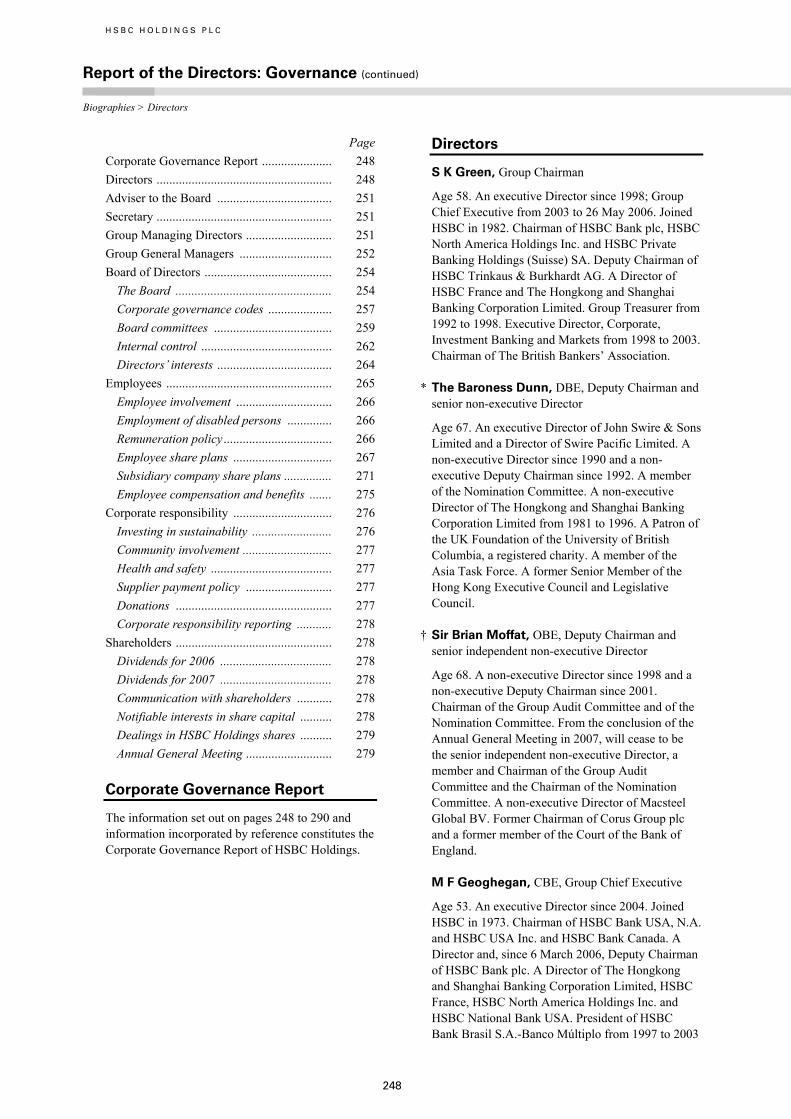
H S B C H O L D I N G S P L C
Report of the Directors: Governance (continued)
Biographies > Directors
248
PageCorporate Governance Report ...................... 248Directors ....................................................... 248Adviser to the Board .................................... 251Secretary ....................................................... 251Group Managing Directors ........................... 251Group General Managers ............................. 252Board of Directors ........................................ 254
The Board ................................................. 254Corporate governance codes .................... 257Board committees ..................................... 259Internal control ......................................... 262Directors’ interests .................................... 264
Employees .................................................... 265Employee involvement .............................. 266Employment of disabled persons .............. 266Remuneration policy .................................. 266Employee share plans ............................... 267Subsidiary company share plans ............... 271Employee compensation and benefits ....... 275
Corporate responsibility ............................... 276Investing in sustainability ......................... 276Community involvement ............................ 277Health and safety ...................................... 277Supplier payment policy ........................... 277Donations ................................................. 277Corporate responsibility reporting ........... 278
Shareholders ................................................. 278Dividends for 2006 ................................... 278Dividends for 2007 ................................... 278Communication with shareholders ........... 278Notifiable interests in share capital .......... 278Dealings in HSBC Holdings shares .......... 279Annual General Meeting ........................... 279
Corporate Governance Report
The information set out on pages 248 to 290 and information incorporated by reference constitutes the Corporate Governance Report of HSBC Holdings.
Directors
S K Green, Group Chairman
Age 58. An executive Director since 1998; Group Chief Executive from 2003 to 26 May 2006. Joined HSBC in 1982. Chairman of HSBC Bank plc, HSBC North America Holdings Inc. and HSBC Private Banking Holdings (Suisse) SA. Deputy Chairman of HSBC Trinkaus & Burkhardt AG. A Director of HSBC France and The Hongkong and Shanghai Banking Corporation Limited. Group Treasurer from 1992 to 1998. Executive Director, Corporate, Investment Banking and Markets from 1998 to 2003. Chairman of The British Bankers’ Association.
* The Baroness Dunn, DBE, Deputy Chairman and senior non-executive Director
Age 67. An executive Director of John Swire & Sons Limited and a Director of Swire Pacific Limited. A non-executive Director since 1990 and a non-executive Deputy Chairman since 1992. A member of the Nomination Committee. A non-executive Director of The Hongkong and Shanghai Banking Corporation Limited from 1981 to 1996. A Patron of the UK Foundation of the University of British Columbia, a registered charity. A member of the Asia Task Force. A former Senior Member of the Hong Kong Executive Council and Legislative Council.
† Sir Brian Moffat, OBE, Deputy Chairman and senior independent non-executive Director
Age 68. A non-executive Director since 1998 and a non-executive Deputy Chairman since 2001. Chairman of the Group Audit Committee and of the Nomination Committee. From the conclusion of the Annual General Meeting in 2007, will cease to be the senior independent non-executive Director, a member and Chairman of the Group Audit Committee and the Chairman of the Nomination Committee. A non-executive Director of Macsteel Global BV. Former Chairman of Corus Group plc and a former member of the Court of the Bank of England.
M F Geoghegan, CBE, Group Chief Executive
Age 53. An executive Director since 2004. Joined HSBC in 1973. Chairman of HSBC Bank USA, N.A. and HSBC USA Inc. and HSBC Bank Canada. A Director and, since 6 March 2006, Deputy Chairman of HSBC Bank plc. A Director of The Hongkong and Shanghai Banking Corporation Limited, HSBC France, HSBC North America Holdings Inc. and HSBC National Bank USA. President of HSBC Bank Brasil S.A.-Banco Múltiplo from 1997 to 2003
249
and responsible for all of HSBC’s business throughout South America from 2000 to 2003. Chief Executive of HSBC Bank plc from 2004 to 6 March 2006. A non-executive Director and Chairman of Young Enterprise.
† The Rt Hon the Lord Butler of Brockwell, KG, GCB, CVO
Age 69. Master, University College, Oxford. A non-executive Director since 1998. Chairman of the Corporate Responsibility Committee and the HSBC Global Education Trust. A member of the Nomination Committee until the conclusion of the Annual General Meeting in 2007. A non-executive Director of Imperial Chemical Industries plc. A member of the International Advisory Board of Marsh McLennan Inc. Chaired the UK Government Review of Intelligence on Weapons of Mass Destruction in 2004. Secretary of the Cabinet and Head of the Home Civil Service in the United Kingdom from 1988 to 1998.
† R K F Ch’ien, CBE (retiring on 25 May 2007)
Age 55. Chairman of CDC Corporation and of its subsidiary, China.com Inc. A non-executive Director since 1998. A member of the Group Audit Committee. Non-executive Chairman of HSBC Private Equity (Asia) Limited and a non-executive Director of The Hongkong and Shanghai Banking Corporation Limited since 1997. Non-executive Chairman of MTR Corporation Limited and a non-executive Director of Convenience Retail Asia Limited, Inchcape plc, VTech Holdings Limited and The Wharf (Holdings) Limited.
† J D Coombe Age 61. Chairman of Hogg Robinson plc. A non-executive Director since March 2005. A member of the Group Audit Committee and, since 1 June 2006, a member of the Remuneration Committee. A non-executive Director of Home Retail Group plc and a member of the Supervisory Board of Siemens AG. A member of The Code Committee of the Panel on Takeovers and Mergers. A trustee of the Royal Academy Trust. Former executive Director and Chief Financial Officer of GlaxoSmithKline plc. A former Chairman of The Hundred Group of Finance Directors and a former member of the Accounting Standards Board.
† R A Fairhead
Age 45. Chief Executive Officer and Director of the Financial Times Group Limited and a Director of Pearson plc. A non-executive Director since 2004. A member, and from the conclusion of the Annual General Meeting in 2007, Chairman of the Group Audit Committee. A non-executive Director of The Economist Newspaper Limited. Finance Director of Pearson plc until 12 June 2006. Former Executive Vice President, Strategy and Group Control of Imperial Chemical Industries plc.
D J Flint, CBE, Group Finance Director
Age 51. Joined HSBC as an executive Director in 1995. Non-executive Chairman of HSBC Finance Corporation. A non-executive Director of BP p.l.c. and a member of the Consultative Committee of the Large Business Advisory Board of HM Revenue & Customs. Chaired the Financial Reporting Council’s review of the Turnbull Guidance on Internal Control. Served on the Accounting Standards Board and the Standards Advisory Council of the International Accounting Standards Board from 2001 to 2004. A former partner in KPMG.
† W K L Fung, OBE
Age 58. Group Managing Director of Li & Fung Limited. A non-executive Director since 1998. A member of the Corporate Responsibility Committee and, until the conclusion of the Annual General Meeting in 2007, of the Remuneration Committee. A non-executive Director and, since May 2005, Deputy Chairman of The Hongkong and Shanghai Banking Corporation Limited. A non-executive Director of CLP Holdings Limited, Integrated Distribution Services Group Limited, Convenience Retail Asia Limited, Shui On Land Limited and VTech Holdings Limited. A member of the Hong Kong Trade Development Council. A former non-executive Director of Bank of Communications Co. Ltd. Former Chairman of the Hong Kong General Chamber of Commerce, the Hong Kong Exporters’ Association and the Hong Kong Committee for the Pacific Economic Co-operation Council.
† S Hintze (retiring on 25 May 2007)
Age 62. Former Chief Operating Officer of Barilla S.P.A. A non-executive Director since 2001. A member of the Corporate Responsibility Committee and of the Remuneration Committee. A non-executive Director of Premier Foods plc. A former non-executive Director of Safeway plc and the Society of Genealogists, a registered charity. A
H S B C H O L D I N G S P L C
Report of the Directors: Governance
Biographies > Directors / Senior management
250
former Senior Vice President of Nestlé S.A. With Mars Incorporated from 1972 to 1993, latterly as Executive Vice President of M&M/Mars in New Jersey.
† J W J Hughes-Hallett
Age 57. Chairman of John Swire & Sons Limited. A non-executive Director since 1 March 2005. A member of the Group Audit Committee since 1 June 2006 and, from the conclusion of the Annual General Meeting in 2007, a member of the Nomination Committee. A non-executive Director of The Hongkong and Shanghai Banking Corporation Limited from 1999 to 2004. A non-executive Director and formerly Chairman of Cathay Pacific Airways Limited and Swire Pacific Limited. A director of China Festival 2008. A trustee of the Dulwich Picture Gallery, the Hong Kong Maritime Museum and the Esmée Fairbairn Foundation. A member of the London School of Oriental and African Studies Governing Body.
† Sir Mark Moody-Stuart, KCMG
Age 66. Chairman of Anglo American plc. A non-executive Director since 2001. Chairman of the Remuneration Committee and a member of the Corporate Responsibility Committee. A non-executive Director of Accenture Limited, a Governor of Nuffield Hospitals and President of the Liverpool School of Tropical Medicine. Chairman of the Global Business Coalition on HIV/AIDS and the Global Compact Foundation. A former Director and Chairman of The ‘Shell’ Transport and Trading Company, plc and former Chairman of the Committee of Managing Directors of the Royal Dutch/Shell Group of Companies.
† G Morgan
Age 61. A non-executive Director since 1 October 2006 and, from the conclusion of the Annual General Meeting in 2007, a member of the Remuneration Committee. A Director of SNC-Lavalin Group Inc., and Alcan Inc. A member of the Board of Trustees of The Fraser Institute and the Energy Advisory Board of Accenture Limited. A non-executive Director of HSBC Bank Canada until 18 April 2006. Founding President and Chief Executive Officer of EnCana Corporation until December 2005 and Vice Chairman from December 2005 to 24 October 2006.
† S W Newton
Age 65. Chairman of The Real Return Group Company Limited. A non-executive Director since 2002 and, from the conclusion of the Annual
General Meeting in 2007, a member of the Group Audit Committee. A Member of the Advisory Board of the East Asia Institute and of the Investment Board at Cambridge University. A Member of The Wellcome Trust Investment Committee. Founder of Newton Investment Management, from which he retired in 2002.
† S M Robertson
Age 66. Non-executive Chairman of Rolls-Royce Group plc and the founder member of Simon Robertson Associates LLP. A non-executive Director since 3 January 2006. From the conclusion of the Annual General Meeting in 2007, to be the senior independent non-executive Director and a member of the Nomination Committee. A non-executive Director of Berry Bros. & Rudd Limited, The Economist Newspaper Limited and The Royal Opera House Covent Garden Limited. Chairman of Trustees of the Royal Academy Trust and the Ernest Kleinwort Charitable Trust. A trustee of the Eden Project and of the Royal Opera House Endowment Fund. A former Managing Director of Goldman Sachs International. Former Chairman of Dresdner Kleinwort Benson and a former non-executive Director of Inchcape plc, Invensys plc and the London Stock Exchange.
* H Sohmen, OBE (retiring on 25 May 2007)
Age 67. Chairman of Bergesen Worldwide Limited, Bergesen Worldwide Offshore Limited and Bergesen Worldwide Gas ASA. Chairman and President of BW Corporation Limited (formerly World-Wide Shipping Group Limited). A non-executive Director since 1990. A non-executive Director of The Hongkong and Shanghai Banking Corporation Limited from 1984 to 2005 and Deputy Chairman from 1996 to May 2005. Former Chairman of The International Tanker Owners Pollution Federation Limited.
† Sir Brian Williamson, CBE Age 62. Chairman of Electra Private Equity plc. A non-executive Director since 2002. A member and, from the conclusion of the Annual General Meeting in 2007, Chairman of the Nomination Committee. A non-executive Director of Resolution plc. A member of the Supervisory Board of Euronext NV. A senior adviser to Fleming Family and Partners. Former Chairman of London International Financial Futures and Options Exchange, Gerrard Group plc and Resolution Life Group Limited. A former non-executive Director of the Financial Services Authority and of the Court of The Bank of Ireland.
251
Adviser to the Board
D J Shaw
Age 60. An Adviser to the Board since 1998. Solicitor. A partner in Norton Rose from 1973 to 1998. A Director of The Bank of Bermuda Limited, HSBC Private Banking Holdings (Suisse) SA and, since May 2006, a non-executive Director of Shui On Land Limited.
Secretary
R G Barber
Age 56. Group Company Secretary. Appointed a Group General Manager on 1 October 2006. Joined HSBC in 1980. Company Secretary of HSBC Holdings plc since 1990. Corporation Secretary of The Hongkong and Shanghai Banking Corporation Limited from 1986 to 1992 and Company Secretary of HSBC Bank plc from 1994 to 1996.
Group Managing Directors
C C R Bannister
Age 48. Group Managing Director, Insurance. A Group Managing Director since 1 August 2006. Joined HSBC in 1994. Appointed a Group General Manager in 2001. Chairman of HSBC Insurance Holdings Limited since November 2006. Deputy Chief Executive Officer, HSBC Securities (USA) Inc. from 1996 to 1998 and Chief Executive Officer, Group Private Banking from 1998 to 2006.
V H C Cheng, OBE
Age 58. Chairman of The Hongkong and Shanghai Banking Corporation Limited. A Group Managing Director since May 2005. Joined HSBC in 1978. Appointed a Group General Manager in 1995. Deputy Chairman and Chief Executive Officer of Hang Seng Bank Limited from 1998 to 2005.
C-H Filippi
Age 54. Chairman and Chief Executive Officer of HSBC France. A Group Managing Director since 2004. A Director of HSBC Bank plc. A member of the Supervisory Board of HSBC Trinkaus & Burkhardt AG. Joined HSBC France in 1987 having previously held senior appointments in the French civil service. Appointed a Group General Manager in 2001. Global Head of Corporate and Institutional Banking from 2001 to 2004.
A A Flockhart
Age 55. President and Group Managing Director, Latin America and the Caribbean. A Group Managing Director since 1 October 2006. Joined HSBC in 1974. Appointed a Group General Manager and Chief Executive Officer, Mexico in 2002. Chief Executive Officer HSBC Thailand from 1992 to 1994. Managing Director of The Saudi British Bank from 1997 to 1999 and Senior Executive Vice-President, Commercial Banking, HSBC Bank USA Inc. from 1999 to 2002.
S T Gulliver
Age 47. Head of Corporate, Investment Banking and Markets and Group Investment Businesses. A Group Managing Director since 2004. Director of HSBC Bank plc, HSBC USA Inc. and The Hongkong and Shanghai Banking Corporation Limited. Joined HSBC in 1980. Appointed a Group General Manager in 2000. Head of Treasury and Capital Markets in Asia-Pacific from 1996 to 2002, Head of Global Markets from 2002 to 2003, and Co-Head of Corporate, Investment Banking and Markets from 2003 to May 2006.
D H Hodgkinson
Age 56. Group Chief Operating Officer. A Group Managing Director since 26 May 2006 and Chairman of HSBC Bank Middle East Limited since 24 July 2006. Joined HSBC in 1969. Appointed a Group General Manager in 2003. Managing Director of The Saudi British Bank from 1999 to 2003. Deputy Chairman and Chief Executive Officer of HSBC Bank Middle East Limited from 2003 to May 2006.
D D J John
Age 56. Chief Executive, HSBC Bank plc. A Group Managing Director since 6 March 2006. Joined HSBC Bank plc in 1971. Appointed a Group General Manager in 2000. Deputy Chairman and Chief Executive Officer, HSBC Bank Malaysia Berhad from 1999 to 2002. Chief Operating Officer of HSBC Bank plc from 2003 to May 2005 and Deputy Chief Executive from May 2005 to 6 March 2006.
Y A Nasr
Age 52. Group Managing Director, Strategic Investments since 1 October 2006. A Director of HSBC Private Banking Holdings (Suisse) SA. A Group Managing Director since 2004. Joined HSBC in 1976. Appointed a Group General Manager in 1998. President and Chief Executive Officer of
H S B C H O L D I N G S P L C
Report of the Directors: Governance (continued)
Biographies > Directors / Senior management
252
HSBC Bank Canada from 1997 to 1999. President and Chief Executive Officer of HSBC USA Inc. and HSBC Bank USA from 1999 to 2003. President, HSBC Bank Brasil S.A.-Banco Múltiplo from 2005 to 2006.
Group General Managers
E Alonso
Age 51. President and Chief Executive Officer, HSBC Bank Brasil S.A.-Banco Múltiplo. Joined HSBC in 1997. Appointed a Group General Manager on 1 October 2006.
P Y Antika
Age 46. Chief Executive Officer, HSBC Turkey. Joined HSBC in 1990. Appointed a Group General Manager in August 2005.
R J Arena
Age 58. Group General Manager, Global e-business. Joined HSBC in 1999. Appointed a Group General Manager in 2000.
R E T Bennett
Age 55. Group General Manager, Legal and Compliance. Joined HSBC in 1979. Appointed a Group General Manager in 1998.
N S K Booker
Age 48. Deputy Chairman and Chief Executive Officer, HSBC Bank Middle East Limited. Joined HSBC in 1981. Appointed a Group General Manager in 2004.
P W Boyles
Age 51. Group General Manager, Human Resources. Joined HSBC in 1975. Appointed a Group General Manager on 1 January 2006.
D C Budd
Age 53. Chief Operating Officer and Executive Director, HSBC Bank plc. Joined HSBC in 1972. Appointed a Group General Manager in May 2005.
Z J Cama
Age 59. Deputy Chairman and Chief Executive Officer, HSBC Bank Malaysia Berhad. Joined HSBC in 1968. Appointed a Group General Manager in 2001.
T M Detelich
Age 50. President, Consumer and Mortgage Lending, HSBC Finance Corporation. Joined HSBC Finance Corporation in 1976. Appointed a Group General Manager on 1 October 2006.
J D Garner
Age 37. Group General Manager, Personal Financial Services and Direct Businesses, HSBC Bank plc. Joined HSBC in 2004. Appointed a Group General Manager on 1 October 2006.
J L Gordon
Age 54. President and Chief Executive Officer, HSBC Bank Canada. Joined HSBC in 1987. Appointed a Group General Manager in August 2005.
K M Harvey
Age 46. Group General Manager and Group Chief Information Officer. Joined HSBC Finance Corporation in 1989. Appointed a Group General Manager in 2004.
A M Keir
Age 48. Global Co-Head Commercial Banking. Joined HSBC in 1981. Appointed a Group General Manager on 1 October 2006.
N L Kidwai
Age 49. Chief Executive Officer, HSBC India. Joined HSBC in 2002. Appointed a Group General Manager on 1 October 2006.
M J W King
Age 50. Group General Manager, Internal Audit. Joined HSBC in 1986. Appointed a Group General Manager in 2002.
P J Lawrence
Age 45. Head of Corporate, Investment Banking and Markets, USA. President and Chief Executive Officer, HSBC Bank USA, N.A. and HSBC USA Inc. Joined HSBC in 1982. Appointed a Group General Manager in August 2005.
M Leung
Age 54. Global Co-Head Commercial Banking. Joined HSBC in 1978. Appointed a Group General Manager in August 2005.

253
A M Mahoney
Age 44. Group General Manager and Head of Network, HSBC Bank plc. Joined HSBC in 1983. Appointed a Group General Manager on 24 November 2006.
B P McDonagh
Age 48. Chief Executive Officer, HSBC Finance Corporation and Chief Operating Officer, HSBC North America Holdings Inc. Joined HSBC in 1979. Appointed a Group General Manager in August 2005.
C M Meares
Age 49. Chief Executive Officer, Group Private Banking. Joined HSBC in 1980. Appointed a Group General Manager on 1 November 2006.
W G Menezes
Age 61. Group Executive, Card Services, HSBC Finance Corporation. Joined HSBC in 1996. Appointed a Group General Manager on 1 October 2006.
K Newman
Age 49. Senior Executive Vice President, Personal Financial Services, HSBC Bank USA, N.A. Joined HSBC in 1989. Appointed a Group General Manager on 1 October 2006.
R C F Or
Age 57. Vice-Chairman and Chief Executive, Hang Seng Bank Limited and Director, The Hongkong and Shanghai Banking Corporation Limited. Joined HSBC in 1972. Appointed a Group General Manager in 2000.
K Patel
Age 58. Group General Manager, Chief Executive Officer, Africa. Joined HSBC in 1984. Appointed a Group General Manager in 2000.
R C Picot
Age 49. Group Chief Accounting Officer. Joined HSBC in 1993. Appointed a Group General Manager in 2003.
M J Powell
Age 45. Head of Global Markets. Joined HSBC in 1984. Appointed a Group General Manager on 1 October 2006.
B Robertson
Age 52. Group General Manager, Credit and Risk. Joined HSBC in 1975. Appointed a Group General Manager in 2003.
M R P Smith, OBE
Age 50. Chief Executive Officer, The Hongkong and Shanghai Banking Corporation Limited. Chairman, Hang Seng Bank Limited. Joined HSBC in 1978. Appointed a Group General Manager in 2000.
P A Thurston
Age 53. Chief Executive Officer, HSBC Mexico. Joined HSBC in 1975. Appointed a Group General Manager in 2003.
P T S Wong
Age 55. Executive Director, Hong Kong and Mainland China, The Hongkong and Shanghai Banking Corporation Limited. Joined HSBC in February 2005. Appointed a Group General Manager in April 2005.
* Non-executive Director † Independent non-executive Director

H S B C H O L D I N G S P L C
Report of the Directors: Governance (continued) Board of Directors > The Board
254
Board of Directors
The Board
The objective of the management structures within HSBC, headed by the Board of Directors of HSBC Holdings and led by the Group Chairman, is to deliver sustainable value to shareholders. Implementation of the strategy set by the Board is delegated to the Group Management Board under the leadership of the Group Chief Executive.
HSBC Holdings has a unitary Board of Directors. The authority of each Director is exercised in Board Meetings where the Board acts collectively as a unit. At 5 March 2007 the Board comprises the Group Chairman, Group Chief Executive, Group Finance Director and 15 non-executive Directors. The names and brief biographical particulars of the Directors are listed on pages 248 to 250. The Group Chairman, Group Chief Executive and Group Finance Director are employees who carry out executive functions in HSBC in addition to their duties as Directors. Non-executive Directors are not HSBC employees and do not participate in the daily business management of HSBC. Non-executive Directors bring an external perspective, constructively challenge and help develop proposals on strategy, scrutinise the performance of management in meeting agreed goals and objectives and monitor the reporting of performance. The non-executive Directors have a wealth of experience across a number of industries and business sectors, including the leadership of large, complex multinational enterprises. The roles of non-executive Directors as members of Board committees are set out on pages 259 to 262. It is estimated that non-executive Directors spend 24 days per annum on HSBC business after an induction phase, with Committee members devoting significant additional time.
The Board sets the strategy for HSBC through the five-year strategic plan and approves the annual operating plans presented by management for the achievement of the strategic objectives. The annual operating plans ensure the efficient disposition of HSBC’s resources for the achievement of these objectives. The Board delegates the management and day-to-day running of HSBC to the Group Management Board but retains to itself approval of certain matters including annual plans and performance targets, procedures for monitoring and control of operations, the authority or the delegation of authority to approve credit, market risk limits, acquisitions, disposals, investments, capital expenditure or realisation or creation of a new venture, specified senior appointments, and any
substantial change in balance sheet management policy.
The Directors who served during the year were Sir John Bond, Lord Butler, R K F Ch’ien, J D Coombe, Baroness Dunn, R A Fairhead, D J Flint, W K L Fung, M F Geoghegan, S K Green, S Hintze, J W J Hughes-Hallett, A W Jebson, Sir John Kemp-Welch, Sir Brian Moffat, Sir Mark Moody-Stuart, G Morgan, S W Newton, S M Robertson, H Sohmen and Sir Brian Williamson.
Sir John Bond, A W Jebson and Sir John Kemp-Welch retired as Directors at the conclusion of the Annual General Meeting held on 26 May 2006. S M Robertson was appointed a Director on 3 January 2006, G Morgan was appointed a Director on 1 October 2006 and J F Gil Díaz was appointed a Director on 2 January 2007 and resigned on 5 March 2007.
The Board of Directors meets regularly and Directors receive information between meetings about the activities of committees and developments in HSBC’s business.
Seven Board meetings were held during 2006. Lord Butler, R K F Ch’ien, J D Coombe, Baroness Dunn, D J Flint, M F Geoghegan, S K Green, S Hintze, Sir Brian Moffat, S M Robertson, H Sohmen and Sir Brian Williamson attended all of the Board meetings. R A Fairhead, W K L Fung, J W J Hughes-Hallett, Sir Mark Moody-Stuart and S W Newton attended six of the Board meetings. Sir John Bond and A W Jebson attended the four Board meetings held before they ceased to be Directors. Sir John Kemp-Welch attended three of the four Board meetings held before he ceased to be a Director. G Morgan attended the one Board meeting held following his appointment.
During 2006, the non-executive Directors and the Group Chairman met twice without the presence of the Group Chief Executive and Group Finance Director. In addition, the non-executive Directors met once without Sir John Bond when he was Group Chairman to discuss his performance and on one other occasion without S K Green, following his appointment as Group Chairman.
In addition to the meetings of the principal Committees referred to in the following pages, eleven other meetings of Committees of the Board were held during the year to discharge business delegated by the Board.
All Directors attended the 2006 Annual General Meeting.
255
Group Chairman and Group Chief Executive
The roles of Group Chairman and Group Chief Executive are separated and held by experienced full-time Directors. S K Green succeeded Sir John Bond as Group Chairman at the conclusion of the Annual General Meeting on 26 May 2006 and M F Geoghegan succeeded S K Green as Group Chief Executive. Sir Brian Moffat, the senior independent non-executive Director and the Chairman of the Nomination Committee, wrote to shareholders regarding these appointments.
He explained that the decision by the Board to appoint S K Green as Group Chairman was made after a thorough selection process. This was conducted by the Nomination Committee, assisted by external advisers, and included extensive benchmarking against external candidates. The Committee considered carefully the requirements of the position in terms of HSBC’s size, geographical spread and complexity; the need for full time executive commitment and experience of international banking at the highest level; and took account of the need for the Group Chairman to have a wide range of skills, the capacity for strategic thinking and the ability to sustain and enhance the Group’s corporate character. The Committee also took into consideration the need for the Group Chairman to be able to work closely and effectively with the Group Chief Executive, to have the authority to run the Board and to have the personal standing to represent HSBC externally at the highest level. Job specifications for the Group Chairman and the Group Chief Executive, setting out their respective authorities and responsibilities, have been agreed by the Board. The Nomination Committee came to the unanimous conclusion that S K Green was the outstanding candidate.
S K Green joined HSBC in 1982. He was Group Treasurer from 1992 to 1998, and Executive Director, Corporate, Investment Banking and Markets from 1998 to 2003, when he was appointed Group Chief Executive. He has worked in Hong Kong, New York, the Middle East and London, and has immense international experience and knowledge of HSBC. The Committee concluded that S K Green is superbly well qualified to serve as Group Chairman. His principal commitment outside HSBC is as Chairman of The British Bankers’ Association.
S K Green’s successor as Group Chief Executive was M F Geoghegan, who led HSBC Bank, HSBC’s principal subsidiary in the UK, from 2004 to March 2006. He too is highly qualified for his position as Group Chief Executive and his
appointment also had the unanimous support of the Board. Mr Geoghegan has over 33 years’ experience with HSBC and has worked in 10 countries in North and South America, Asia, the Middle East and Europe.
The Directors believed strongly that these appointments were in the best interests of the shareholders. The appointments had the unanimous support of the Directors and were made after consulting with representatives of major institutional investors and explaining the succession planning and independent external search process. S K Green and M F Geoghegan stood for re-election at the 2006 Annual General Meeting and were both re-elected ahead of taking up their new roles from the conclusion of that meeting.
Nowadays, success in financial services depends in a large measure on the relative strengths of competing management teams. Planning management succession is key to this, has long been established in the Group and the plan is regularly reviewed by the non-executive Directors. Furthermore, HSBC is a remarkable organisation with a distinctive character and culture. The business is managed through international teamwork and HSBC believes this is best achieved by management continuity and amongst colleagues who have similar values. By way of example, the top 45 executives have a combined service of over 1,000 years with HSBC, although four of these executives have joined the Group in the last six years, thus ensuring there is a balance of new talent to help run the business.
Board balance and independence of Directors
The Board considers all of the non-executive Directors to be independent in character and judgement. Baroness Dunn and H Sohmen have served on the Board for more than nine years, however, and in that respect only, do not meet the usual criteria for independence set out in the UK Combined Code on corporate governance. The Board has therefore determined Lord Butler, R K F Ch’ien, J D Coombe, R A Fairhead, W K L Fung, J F Gil Díaz, S Hintze, J W J Hughes-Hallett, Sir Brian Moffat, Sir Mark Moody-Stuart, G Morgan, S W Newton, S M Robertson, and Sir Brian Williamson to be independent. In reaching its determination of each non-executive Director’s independence the Board has concluded that there are no relationships or circumstances which are likely to affect a Director’s judgement and any relationships or circumstances which could appear to do so were considered not to be material. From the conclusion of the Annual General Meeting in 2007, Lord Butler,
H S B C H O L D I N G S P L C
Report of the Directors: Governance (continued) Board of Directors > The Board / Corporate governance
256
W K L Fung and Sir Brian Moffat will each have served on the Board for more than nine years and, in that respect only, will not meet the usual criteria for independence set out in the UK Combined Code on corporate governance.
When determining independence the Board considers that calculation of the length of service of a non-executive Director begins on the date of his or her first election by shareholders as a Director of HSBC Holdings. Given the complexity and geographical spread of HSBC’s business, the experience of previous service on a subsidiary company board can be a considerable benefit to HSBC and does not detract from a Director’s independence.
In accordance with the Rules Governing the Listing of Securities on The Stock Exchange of Hong Kong Limited, each non-executive Director determined by the Board to be independent has provided an annual confirmation of his or her independence to HSBC Holdings.
Information, induction and ongoing development
The Board regularly reviews reports on progress against financial objectives, on business developments and on investor and external relations and receives reports from the Chairmen of Board Committees and from the Group Chief Executive. The Board receives regular reports and presentations on strategy and developments in the customer groups and principal geographical areas. Regular reports are also provided to the Board, the Group Audit Committee and the Group Management Board on credit exposures and the loan portfolio, asset and liability management, liquidity, litigation and compliance and reputational issues. The agenda and supporting papers are distributed in advance of all Board and Committee meetings to allow time for appropriate review and to facilitate full discussion at the meetings. All Directors have full and timely access to all relevant information and may take independent professional advice if necessary.
The Directors have free and open contact with management at all levels. Group Managing Directors and Group General Managers meet informally with Directors after Board meetings. Board offsite visits are made each year to enable Directors to see at first hand the operations of subsidiary companies in local environments and to meet management, employees and customers. In 2006 the Board visited Istanbul, Hong Kong and Shenzhen.
Full, formal and tailored induction programmes, with particular emphasis on internal controls, are
arranged for newly appointed Directors. The programmes consist of a series of meetings with other Directors and senior executives to enable new Directors to receive information and familiarise themselves with HSBC’s strategy, operations and internal controls. Prior to their appointment, each Director receives comprehensive guidance on the duties and liabilities of a Director of HSBC Holdings. Opportunities to update and develop skills and knowledge, through externally run seminars and through briefings by senior executives, are provided to all Directors.
Performance evaluation
MWM Consulting was commissioned to undertake an independent performance evaluation of the Board, its committees and individual Directors. The evaluation examined those key areas where the Board requires clarity in order to provide high level oversight, including: the strategic process; key business drivers and performance milestones; the global economic environment and competitive context in which HSBC operates; the risks faced by the business; board dynamics, capability and alignment; reputation; and information flows. The report on the evaluation has been reviewed by the Board and has been used by the non-executive Directors, led by Sir Brian Moffat, in their evaluation of the performance of the Group Chairman. The review concluded that the Board and its committees were functioning effectively. It is the intention of the Board of HSBC Holdings to continue to review its performance and that of its Directors annually.
Retirement and re-election of Directors
Lord Butler, R K F Ch’ien, Baroness Dunn, R A Fairhead, W K L Fung, S Hintze, Sir Brian Moffat, G Morgan and H Sohmen will retire at the forthcoming Annual General Meeting. With the exception of R K F Ch’ien, S Hintze and H Sohmen, who are to retire, they offer themselves for re-election.
Following the performance evaluation of the Board, the Group Chairman has confirmed that the Directors standing for re-election at the Annual General Meeting continue to perform effectively and to demonstrate commitment to their roles.
Brief biographical particulars of all Directors including those seeking re-election at the Annual General Meeting, are given on pages 248 to 250.
257
Relations with shareholders
The Board ensures all Directors, including non-executive Directors, develop an understanding of the views of major shareholders through attendance at analyst presentations and other meetings with institutional investors and their representative bodies. The Board also met with representatives of institutional shareholders in 2006 to discuss corporate governance matters.
The Group Chairman, Group Chief Executive and the Group Finance Director hold regular meetings with institutional investors and report to the Board on those meetings.
Sir Brian Moffat, Deputy Chairman and, until the conclusion of the Annual General Meeting in 2007, senior independent non-executive Director, is available to shareholders should they have concerns which contact through the normal channels of Group Chairman, Group Chief Executive, Group Finance Director or other executives has failed to resolve or for which such contact would be inappropriate. From the conclusion of the Annual General Meeting in 2007, S M Robertson will be senior independent non-executive Director. The senior independent non-executive Director may be contacted through the Group Company Secretary at 8 Canada Square, London E14 5HQ.
Indemnification of Directors, relevant audit information and contracts of significance
The Articles of Association of HSBC Holdings provide that Directors are entitled to be indemnified out of the assets of the Company against claims from third parties in respect of certain liabilities arising in connection with the performance of their functions, in accordance with the provisions of the UK Companies Act 1985. Such indemnity provisions of this nature have been in place during the financial year but have not been utilised by the Directors.
Each person who is a director at the date of approval of this report confirms that so far as the director is aware, there is no relevant audit information of which the Company's auditor is unaware; and the director has taken all the steps that he or she ought to have taken as a director in order to make himself or herself aware of any relevant audit information and to establish that the Company's auditor is aware of that information. This confirmation is given pursuant to section 234ZA of the UK Companies Act 1985 and should be interpreted in accordance therewith and subject to the provisions thereof.
None of the Directors had, during the year or at the end of the year, a material interest, directly or indirectly, in any contract of significance with HSBC Holdings or any of its subsidiary undertakings.
Corporate Governance Codes
HSBC is committed to high standards of corporate governance. HSBC Holdings has complied with the applicable code provisions of the Combined Code on Corporate Governance issued by the Financial Reporting Council (‘the Combined Code’) throughout the year, save for code provision A.2.2 as the Group Chairman did not on appointment meet the Combined Code’s independence criteria. On 26 May 2006 S K Green, who had previously served as Group Chief Executive, became Group Chairman. In accordance with the provisions of the Combined Code, the Board consulted major shareholders in advance of the appointment. Sir Brian Moffat, the senior independent non-executive Director and the Chairman of the Nomination Committee, wrote to all shareholders to explain the Board’s decision and the reasons for the appointment. These are described on page 255.
HSBC Holdings has complied with all applicable code provisions of the Code on Corporate Governance Practices in Appendix 14 to the Rules Governing the Listing of Securities on The Stock Exchange of Hong Kong Limited throughout the year.
The Board of HSBC Holdings has adopted a code of conduct for transactions in HSBC Group securities by Directors that complies with The Model Code in the Listing Rules of the Financial Services Authority and with The Model Code for Securities Transactions by Directors of Listed Issuers (‘Hong Kong Model Code’) set out in the Rules Governing the Listing of Securities on The Stock Exchange of Hong Kong Limited, save that The Stock Exchange of Hong Kong Limited has granted certain waivers from strict compliance with the Hong Kong Model Code, primarily to take into account accepted practices in the UK, particularly in respect of employee share plans. Following a specific enquiry, each Director has confirmed he or she has complied with the code of conduct for transactions in HSBC Group securities throughout the year.
Differences in HSBC Holdings/New York Stock Exchange corporate governance practices
Under the New York Stock Exchange’s (‘NYSE’) corporate governance rules for listed companies, as a NYSE-listed foreign private issuer, HSBC Holdings
H S B C H O L D I N G S P L C
Report of the Directors: Governance (continued) Board of Directors > Corporate governance / Board committees
258
must disclose any significant ways in which its corporate governance practices differ from those followed by US companies subject to NYSE listing standards. HSBC Holdings believes the following to be the significant differences between its corporate governance practices and NYSE corporate governance rules applicable to US companies.
US companies listed on the NYSE are required to adopt and disclose corporate governance guidelines. The Listing Rules of the UK Financial Services Authority require each listed company incorporated in the UK to include in its Annual Report and Accounts a narrative statement of how it has applied the principles of the Combined Code and a statement as to whether or not it has complied with the code provisions of the Combined Code throughout the accounting period covered by the Annual Report and Accounts. A company that has not complied with the Code provisions, or complied with only some of the Code provisions or (in the case of provisions whose requirements are of a continuing nature) complied for only part of an accounting period covered by the report, must specify the Code provisions with which it has not complied, and (where relevant) for what part of the reporting period such non-compliance continued, and give reasons for any non-compliance. As stated above, HSBC Holdings complied throughout 2006 with the applicable code provisions of the Combined Code, save with respect to the appointment of the current Group Chairman, as referred to above. The Combined Code does not require HSBC Holdings to disclose the full range of corporate governance guidelines with which it complies.
Under NYSE standards, companies are required to have a nominating/corporate governance committee, composed entirely of independent directors. In addition to identifying individuals qualified to become board members, this committee must develop and recommend to the board a set of corporate governance principles. HSBC’s Nomination Committee, which follows the requirements of the Combined Code, includes a majority of members who are independent. All members of the Committee are non-executive Directors and three of the four members, including the Committee chairman, are independent non-executive Directors. The Committee’s terms of reference do not require the Committee to develop and recommend corporate governance principles for HSBC Holdings. As stated above, HSBC Holdings is subject to the corporate governance principles of the Combined Code.
Pursuant to NYSE listing standards, non-management directors must meet on a regular basis
without management present and independent directors must meet separately at least once per year. During 2006, HSBC Holdings’ non-executive Directors met twice as a group with the Group Chairman, but without the Group Chief Executive or Group Finance Director present, and met twice as a group without the Group Chairman, Group Chief Executive or Group Finance Director present. HSBC Holdings’ practice, in this regard, complies with the Combined Code.
In accordance with the requirements of the Combined Code, HSBC Holdings discloses in its annual report how the Board, its committees and the Directors are evaluated and the results of the evaluation (on page 256) and it provides extensive information regarding Directors’ compensation in the Directors’ Remuneration Report (on pages 280 to 283). The terms of reference of HSBC Holdings’ Audit, Nomination and Remuneration Committees are available at www.hsbc.com/boardcommittees.
NYSE listing standards require US companies to adopt a code of business conduct and ethics for directors, officers and employees, and promptly disclose any waivers of the code for directors or executive officers. In addition to the Group Business Principles and Values, which apply to the employees of all HSBC companies, pursuant to the requirements of the Sarbanes-Oxley Act the Board of HSBC Holdings has adopted a Code of Ethics applicable to the Group Chairman and the Group Chief Executive, as the principal executive officers, and to the Group Finance Director and Group Chief Accounting Officer. HSBC Holdings’ Code of Ethics is available on www.hsbc.com/codeofethics or from the Group Company Secretary at 8 Canada Square, London E14 5HQ. If the Board amends or waives the provisions of the Code of Ethics, details of the amendment or waiver will appear at the same website address. During 2006 HSBC Holdings made no amendments to its Code of Ethics and granted no waivers from its provisions. The Group Business Principles and Values are available on www.hsbc.com/businessprinciplesandvalues.
Under NYSE listing rules applicable to US companies, independent directors must comprise a majority of the board of directors. Currently, over half of HSBC Holdings’ Directors are independent.
Under the Combined Code the HSBC Holdings Board determines whether a director is independent in character and judgement and whether there are relationships or circumstances which are likely to affect, or could appear to affect, the director’s judgement. Under the NYSE rules a director cannot qualify as independent unless the board affirmatively
259
determines that the director has no material relationship with the listed company; in addition the NYSE rules prescribe a list of circumstances in which a director cannot be independent. The Combined Code requires a company’s board to assess director independence by affirmatively concluding that the director is independent of management and free from any business or other relationship that could materially interfere with the exercise of independent judgement.
Lastly, a chief executive officer of a US company listed on the NYSE must annually certify that he or she is not aware of any violation by the company of NYSE corporate governance standards. In accordance with NYSE listing rules applicable to foreign private issuers, HSBC Holdings’ Group Chairman is not required to provide the NYSE with this annual compliance certification. However, in accordance with rules applicable to both US companies and foreign private issuers, the Group Chairman is required promptly to notify the NYSE in writing after any executive officer becomes aware of any material non-compliance with the NYSE corporate governance standards applicable to HSBC Holdings.
Since July 2005 HSBC Holdings has been required to submit annual and interim written affirmations of compliance with applicable NYSE corporate governance standards, similar to the affirmations required of NYSE listed US companies.
Board committees
The Board has appointed a number of committees consisting of certain Directors, Group Managing Directors and, in the case of the Corporate Responsibility Committee, certain co-opted non-director members. The following are the principal committees:
Group Management Board
The Group Management Board meets regularly and operates as a general management committee under the direct authority of the Board. The objective of the Group Management Board is to maintain a reporting and control structure whereby all of the line operations of HSBC are accountable to individual members of the Group Management Board who report to the Group Chief Executive who in turn reports to the Group Chairman. The members of the Group Management Board are M F Geoghegan (Chairman) and D J Flint, both of whom are executive Directors, and C C R Bannister, V H C Cheng, C-H Filippi, A A Flockhart, S T Gulliver, D H Hodgkinson, D D J John and
Y A Nasr, all of whom are Group Managing Directors.
The Group Management Board exercises the powers, authorities and discretions of the Board in so far as they concern the management and day-to-day running of HSBC Holdings in accordance with such policies and directions as the Board may from time to time determine. Matters reserved for approval by the Board are described on page 254.
Following each meeting the Group Chief Executive reports to the Board on the Group Management Board’s activities.
Group Audit Committee
The Group Audit Committee meets regularly with HSBC’s senior financial, internal audit, credit, legal and compliance management and the external auditor to consider HSBC Holdings’ financial reporting, the nature and scope of audit reviews and the effectiveness of the systems of internal control and compliance. The members of the Group Audit Committee throughout 2006 were Sir Brian Moffat (Chairman), R K F Ch’ien, J D Coombe and R A Fairhead. J W J Hughes-Hallett was appointed a member of the Committee on 1 June 2006. Sir John Kemp-Welch ceased to be a member of the Committee on 26 May 2006. From the conclusion of the Annual General Meeting in 2007, Sir Brian Moffat will cease to be Chairman and a member of the Committee, R A Fairhead will become Chairman of the Committee and S W Newton will become a member of the Committee. All members of the Committee are independent non-executive Directors.
The Board has determined that Sir Brian Moffat, R K F Ch’ien, R A Fairhead, J D Coombe and J W J Hughes-Hallett are independent according to SEC criteria, and that Sir Brian Moffat, R A Fairhead, J D Coombe and J W J Hughes-Hallett may be regarded as audit committee financial experts for the purposes of section 407 of the Sarbanes-Oxley Act and as having recent and relevant financial experience.
Appointments to the Committee are made for periods of up to three years, extendable by no more than two additional three-year periods, so long as members continue to be independent.
Formal and tailored induction programmes are held for newly appointed Committee members and appropriate training is provided on an ongoing and timely basis.
There were seven meetings of the Group Audit Committee during 2006. R K F Ch’ien, J D Coombe,
H S B C H O L D I N G S P L C
Report of the Directors: Governance (continued) Board of Directors > Board committees
260
R A Fairhead and Sir Brian Moffat attended all of the meetings; Sir John Kemp-Welch attended two of the three meetings held before his retirement and J W J Hughes-Hallett attended each of the four meetings held following his appointment.
At each meeting, the Committee has the opportunity to meet with the external auditor, without management present, to facilitate the discussion of any matter relating to its remit and any issue arising from the audit. Similar arrangements have been adopted for the Committee to meet with the internal auditor.
The terms of reference of the Committee, which are reviewed annually, are available at www.hsbc.com/boardcommittees. To ensure consistency of scope and approach by subsidiary company audit committees, the Group Audit Committee has established core terms of reference to guide subsidiary company boards when adopting terms of reference for their audit committees. The Committee receives bi-annual confirmations from subsidiary company audit committees relating to the financial statements and internal control procedures of those subsidiaries.
The Group Audit Committee is accountable to the Board and assists it in meeting its responsibilities for maintaining an effective system of internal control and compliance and for meeting its external financial reporting obligations. The Committee is directly responsible on behalf of the Board for the selection, oversight and remuneration of the external auditor. The Committee receives frequent comprehensive reports from the Group General Manager Credit and Risk, the Head of Group Compliance, the Group General Manager, Legal and Compliance, the Group General Manager Internal Audit and the Head of Group Security and receives periodic presentations from other functional heads and line management.
Regular comprehensive reports on the work of the internal audit function are submitted to the Committee. These reports include reports on frauds and special investigations and summaries of internal audit findings, regulatory reports and external auditors’ reports. The Committee monitors and reviews the effectiveness of the internal audit function and receives summaries of periodic peer reviews of HSBC’s internal audit functions around the world. HSBC has adopted the Principles of the International Institute of Internal Auditors, which include a periodic external quality assurance review of the internal audit function. The first such review will be undertaken in 2007.
The Committee undertakes an annual review of the effectiveness of HSBC’s system of internal control. This is described on page 262. The Committee receives regular updates on changes in law, regulations and accounting standards and practices and the preparations being made to respond to those requirements. During 2006, the Committee received regular updates on the preparations for the review of internal financial reporting controls required by section 404 of the Sarbanes-Oxley Act, the implementation of the Basel 2 capital adequacy requirements and the actions taken to implement the recommendations of the Corrigan Report on reducing the risks of, and limiting the damage caused by, systemic financial shocks. The report, issued by the Counterparty Risk Management Policy Group focused on risk management, risk monitoring and enhanced transparency in financial institutions.
The Committee reports on its activities at each Board meeting and, twice annually, produces a written summary of its activities.
The Committee has approved procedures for the receipt, retention and handling of complaints regarding accounting, internal accounting controls and auditing matters. The Committee receives regular reports regarding the nature, investigation and resolution of material complaints and concerns from the Head of Group Compliance.
The Committee reviews and monitors the external auditor's independence and objectivity and the effectiveness of the audit process, taking into consideration relevant professional and regulatory requirements.
The Committee reviews the strategy and approves the terms for the engagement of the external auditor for the audit of the Annual Report and Accounts. Regular reports on the progress of the audit facilitate the Committee’s assessment of the effectiveness of the audit.
The Committee receives reports from the external auditor on its own policies and procedures regarding independence and quality control and oversees the appropriate rotation of audit partners within the external auditor. The external auditor provides the Committee with an annual confirmation of its independence in accordance with industry standards.
On the recommendation of the Committee the Board has approved a policy for the employment by HSBC of former employees of the external auditor or its affiliates. The Committee monitors this policy through the receipt of periodic reports of those former employees of the external auditor employed
261
by HSBC and the number of former employees of the external auditor currently employed in senior positions in HSBC. The reports enable the Committee to consider whether there has been any impairment, or appearance of impairment, of the auditor’s judgement or independence in respect of the audit.
The Group Audit Committee has established policies for the pre-approval of specific services that may be provided by the principal auditor, KPMG Audit Plc and its affiliates (‘KPMG’). These policies are kept under review and amended as necessary to meet the dual objectives of ensuring that HSBC benefits in a cost effective manner from the cumulative knowledge and experience of its auditor, whilst also ensuring that the auditor maintains the necessary degree of independence and objectivity. These pre-approval policies apply to all services where HSBC Holdings or any of its subsidiaries pays for the service, or is a beneficiary or addressee of the service and has selected or influenced the choice of KPMG. All services entered into with KPMG during 2006 were pre-approved by the Committee or were entered into under pre-approval policies established by the Committee. A quarterly update on non-audit services provided by KPMG is presented to the Committee.
The pre-approved services relate to regulatory reviews, agreed-upon procedures reports, other types of attestation reports, the provision of advice and other non-audit services allowed under SEC independence rules. They fall into the categories of audit services, audit-related services, tax services and other services.
All services provided by KPMG relating to the implementation of section 404 of the Sarbanes-Oxley Act were specifically pre-approved by the Group Audit Committee.
An analysis of the remuneration paid in respect of audit and non-audit services provided by KPMG for each of the last three years is disclosed in Note 8 on the Financial Statements on page 331.
The Committee has recommended to the Board that KPMG Audit Plc be reappointed auditor at the forthcoming Annual General Meeting.
Remuneration Committee
The role of the Remuneration Committee and its membership are set out in the Directors’ Remuneration Report on page 280.
Nomination Committee
The Nomination Committee is responsible for leading the process for Board appointments and for identifying and nominating, for approval by the Board, candidates for appointment to the Board. Before recommending an appointment to the Board, the Committee evaluates the balance of skills, knowledge and experience on the Board and, in the light of this, identifies the role and capabilities required for a particular appointment. Candidates are considered on merit against these criteria. Care is taken to ensure that appointees have enough time to devote to HSBC. Prospective Directors are asked to identify any significant other commitments and confirm they have sufficient time to discharge what is expected of them. All Directors are subject to election by shareholders at the Annual General Meeting following their appointment and to re-election at least every three years. The members of the Nomination Committee throughout 2006 were Sir Brian Moffat (Chairman), Lord Butler, Baroness Dunn and Sir Brian Williamson.
From the conclusion of the Annual General Meeting in 2007, Sir Brian Williamson will become Chairman of the Committee in succession to Sir Brian Moffat, Lord Butler will cease to be a member of the Committee and J W J Hughes-Hallett and S M Robertson will become members of the Committee.
There were four Nomination Committee meetings during 2006, each of which was attended by all members.
Following each meeting the Committee reports to the Board on its activities.
The terms of reference of the Committee are available at www.hsbc.com/boardcommittees.
The appointments of J F Gil Díaz, G Morgan and S M Robertson as non-executive Directors were made on the advice and recommendation of the Nomination Committee. J F Gil Díaz, former Secretary of Finance and Public Credit in Mexico, and G Morgan, a director of HSBC Bank Canada for nine years, were identified by the Nomination Committee and so neither an external consultancy nor open advertising was used in connection with their appointments.
The terms and conditions of appointments of non-executive Directors are available for inspection at 8 Canada Square, London E14 5HQ and will be made available for 15 minutes before the Annual General Meeting and during the Meeting itself.
H S B C H O L D I N G S P L C
Report of the Directors: Governance (continued) Board of Directors > Board committees / Internal control
262
As set out on page 255, the Committee conducted the selection process which recommended to the Board that S K Green succeed Sir John Bond as Group Chairman at the conclusion of the 2006 Annual General Meeting and that M F Geoghegan succeed S K Green as Group Chief Executive.
The Committee makes recommendations to the Board concerning: plans for succession for both executive and non-executive Directors; the appointment of any Director to executive or other office; suitable candidates for the role of senior independent non-executive Director; the re-election by shareholders of Directors retiring by rotation; the renewal of the terms of office of non-executive Directors; membership of Board Committees, in consultation with the Group Chairman and the chairman of such committees as appropriate; any matters relating to the continuation in office of any Director at any time; Directors’ fees and committee fees for the Company; and appointments and re-appointments to the Boards of Directors of major subsidiary companies as appropriate.
The Committee regularly reviews the structure, size and composition (including the skills, knowledge and experience required) of the Board and makes recommendations to the Board as appropriate. It keeps under review the leadership needs of HSBC, with a view to ensuring the continued ability of HSBC to compete effectively in the marketplace. The Board has satisfied itself that the Nomination Committee has in place appropriate plans for orderly succession to the Board and senior management positions as well as procedures to ensure an appropriate balance of skills and experience within HSBC and on the Board.
Corporate Responsibility Committee
The Corporate Responsibility Committee is responsible for overseeing corporate responsibility and sustainability policies, principally environmental, social and ethical matters and for advising the Board, committees of the Board and executive management on such matters. The terms of reference of the Committee are available at www.hsbc.com/boardcommittees. The members of the Committee throughout 2006 were Lord Butler (Chairman), W K L Fung, S Hintze and Sir Mark Moody-Stuart, each of whom is an independent non-executive Director, and G V I Davis, E M Diggory and Lord May, who are non-director members of the Committee.
There were five meetings of the Corporate Responsibility Committee during 2006. Following
each meeting the Committee reports to the Board on its activities.
Further information will be in HSBC’s Corporate Responsibility Report 2006, available in May 2007.
Internal control
The Directors are responsible for internal control in HSBC and for reviewing its effectiveness. Procedures have been designed for safeguarding assets against unauthorised use or disposition; for maintaining proper accounting records; and for the reliability of financial information used within the business or for publication. Such procedures are designed to manage rather than eliminate the risk of failure to achieve business objectives and can only provide reasonable and not absolute assurance against material misstatement, errors, losses or fraud. The procedures also enable HSBC Holdings to discharge its obligations under the Handbook of Rules and Guidance issued by the Financial Services Authority, HSBC’s lead regulator.
The key procedures that the Directors have established are designed to provide effective internal control within HSBC and accord with the Internal Control: Revised Guidance for Directors on the Combined Code issued by the Financial Reporting Council. Such procedures for the ongoing identification, evaluation and management of the significant risks faced by HSBC have been in place throughout the year and up to 5 March 2007, the date of approval of the Annual Report and Accounts 2006. In the case of companies acquired during the year, the internal controls in place are being reviewed against HSBC’s benchmarks and integrated into HSBC’s processes.
HSBC’s key internal control procedures include the following:
• Authority to operate the various subsidiaries is delegated to their respective chief executive officers within limits set by the Board of Directors of HSBC Holdings. Sub-delegation of authority from the Board to individuals requires these individuals, within their respective delegation, to maintain a clear and appropriate apportionment of significant responsibilities and to oversee the establishment and maintenance of systems of controls appropriate to the business. The appointment of executives to the most senior positions within HSBC requires the approval of the Board of Directors of HSBC Holdings.
• Functional, operating, financial reporting and
263
certain management reporting standards are established by Group Head Office management committees, for application across the whole of HSBC. These are supplemented by operating standards set by functional and local management as required for the type of business and geographical location of each subsidiary.
• Systems and procedures are in place in HSBC to identify, control and report on the major risks including credit, changes in the market prices of financial instruments, liquidity, operational error, breaches of law or regulations, unauthorised activities and fraud. Exposure to these risks is monitored by risk management committees, asset and liability committees and executive committees in subsidiaries and by the Group Management Board for HSBC as a whole. A risk management meeting of the Group Management Board, chaired by the Group Finance Director, is held each month. These risk management meetings address asset and liability management issues. Minutes of the risk management meetings of the Group Management Board are submitted to the Group Audit Committee and to the Board of Directors.
• A Disclosure Committee has been established to review material disclosures made by HSBC Holdings for any errors, misstatements or omissions. The membership of the Disclosure Committee, which is chaired by the Group Company Secretary, includes the heads of the finance, legal, credit and risk, compliance, corporate communications, investor relations and internal audit functions.
• Processes are in place to identify new risks from changes in market practices or customer behaviours which could expose HSBC to heightened risk of loss or reputational damage. During 2006 additional attention was directed towards evolving best practice in the areas of internet banking, counterparty risk management policy following the publication of the Corrigan report in July 2005; best practice guidance emerging on liquidity management from the Institute of International Finance; the implications of a slowing housing market in the US coupled with rising payment obligations under adjustable rate mortgages; and the implications of changed customer behaviour in the UK regarding seeking protection from credit obligations.
• Periodic strategic plans are prepared for customer groups, global product groups, key
support functions and certain geographies within the framework of the Group Strategic Plan. Operating plans are prepared and adopted by all HSBC companies annually, setting out the key business initiatives and the likely financial effects of those initiatives.
• Centralised functional control is exercised over all computer system developments and operations. Common systems are employed for similar business processes wherever practicable. Credit and market risks are measured and reported on in subsidiaries and aggregated for review of risk concentrations on a Group-wide basis.
• Responsibilities for financial performance against plans and for capital expenditure, credit exposures and market risk exposures are delegated with limits to line management in the subsidiaries. In addition, functional management in Group Head Office is responsible for setting policies, procedures and standards in the following areas of risk: credit risk; market risk; liquidity risk; operational risk; IT risk; insurance risk; accounting risk; tax risk; legal and regulatory compliance risk; human resources risk; reputational risk and purchasing risk; and for certain global product lines.
• Policies to guide subsidiary companies and management at all levels in the conduct of business to safeguard the Group’s reputation are established by the Board of HSBC Holdings and the Group Management Board, subsidiary company boards, board committees or senior management. Reputational risks can arise from environmental, social or governance issues, or as a consequence of operational risk events. As a banking group, HSBC’s good reputation depends upon the way in which it conducts its business but it can also be affected by the way in which clients, to which it provides financial services, conduct their business.
• The internal audit function, which is centrally controlled, monitors the effectiveness of internal control structures across the whole of HSBC. The work of the internal audit function is focused on areas of greatest risk to HSBC as determined by a risk-based approach. The head of this function reports to the Group Chairman and the Group Audit Committee.
• Management is responsible for ensuring that recommendations made by the internal audit function are implemented within an appropriate and agreed timetable. Confirmation to this effect must be provided to internal audit. Management
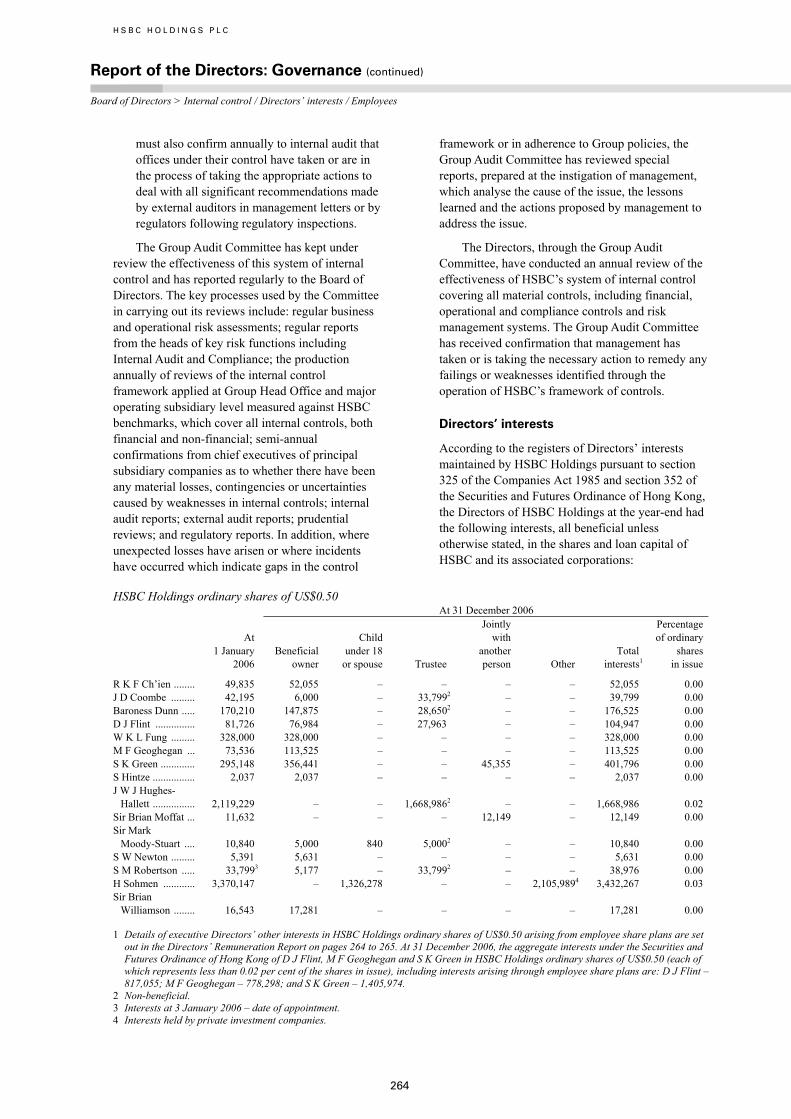
H S B C H O L D I N G S P L C
Report of the Directors: Governance (continued) Board of Directors > Internal control / Directors’ interests / Employees
264
must also confirm annually to internal audit that offices under their control have taken or are in the process of taking the appropriate actions to deal with all significant recommendations made by external auditors in management letters or by regulators following regulatory inspections.
The Group Audit Committee has kept under review the effectiveness of this system of internal control and has reported regularly to the Board of Directors. The key processes used by the Committee in carrying out its reviews include: regular business and operational risk assessments; regular reports from the heads of key risk functions including Internal Audit and Compliance; the production annually of reviews of the internal control framework applied at Group Head Office and major operating subsidiary level measured against HSBC benchmarks, which cover all internal controls, both financial and non-financial; semi-annual confirmations from chief executives of principal subsidiary companies as to whether there have been any material losses, contingencies or uncertainties caused by weaknesses in internal controls; internal audit reports; external audit reports; prudential reviews; and regulatory reports. In addition, where unexpected losses have arisen or where incidents have occurred which indicate gaps in the control
framework or in adherence to Group policies, the Group Audit Committee has reviewed special reports, prepared at the instigation of management, which analyse the cause of the issue, the lessons learned and the actions proposed by management to address the issue.
The Directors, through the Group Audit Committee, have conducted an annual review of the effectiveness of HSBC’s system of internal control covering all material controls, including financial, operational and compliance controls and risk management systems. The Group Audit Committee has received confirmation that management has taken or is taking the necessary action to remedy any failings or weaknesses identified through the operation of HSBC’s framework of controls.
Directors’ interests
According to the registers of Directors’ interests maintained by HSBC Holdings pursuant to section 325 of the Companies Act 1985 and section 352 of the Securities and Futures Ordinance of Hong Kong, the Directors of HSBC Holdings at the year-end had the following interests, all beneficial unless otherwise stated, in the shares and loan capital of HSBC and its associated corporations:
HSBC Holdings ordinary shares of US$0.50 At 31 December 2006
At 1 January 2006
Beneficial owner
Child under 18 or spouse
Trustee
Jointly with another person
Other
Total interests1
Percentage of ordinary shares in issue
R K F Ch’ien ........ 49,835 52,055 – – – – 52,055 0.00 J D Coombe ......... 42,195 6,000 – 33,7992 – – 39,799 0.00 Baroness Dunn ..... 170,210 147,875 – 28,6502 – – 176,525 0.00 D J Flint ............... 81,726 76,984 – 27,963 – – 104,947 0.00 W K L Fung ......... 328,000 328,000 – – – – 328,000 0.00 M F Geoghegan ... 73,536 113,525 – – – – 113,525 0.00 S K Green ............. 295,148 356,441 – – 45,355 – 401,796 0.00 S Hintze ................ 2,037 2,037 – – – – 2,037 0.00 J W J Hughes-
Hallett ................ 2,119,229 – – 1,668,9862 – – 1,668,986
0.02 Sir Brian Moffat ... 11,632 – – – 12,149 – 12,149 0.00 Sir Mark
Moody-Stuart .... 10,840 5,000 840 5,0002 – – 10,840
0.00 S W Newton ......... 5,391 5,631 – – – – 5,631 0.00 S M Robertson ..... 33,7993 5,177 – 33,7992 – – 38,976 0.00 H Sohmen ............ 3,370,147 – 1,326,278 – – 2,105,9894 3,432,267 0.03 Sir Brian
Williamson ........ 16,543 17,281 – – – – 17,281
0.00
1 Details of executive Directors’ other interests in HSBC Holdings ordinary shares of US$0.50 arising from employee share plans are set out in the Directors’ Remuneration Report on pages 264 to 265. At 31 December 2006, the aggregate interests under the Securities and Futures Ordinance of Hong Kong of D J Flint, M F Geoghegan and S K Green in HSBC Holdings ordinary shares of US$0.50 (each of which represents less than 0.02 per cent of the shares in issue), including interests arising through employee share plans are: D J Flint – 817,055; M F Geoghegan – 778,298; and S K Green – 1,405,974.
2 Non-beneficial. 3 Interests at 3 January 2006 – date of appointment. 4 Interests held by private investment companies.

265
S K Green has an interest as beneficial owner in €75,000 of HSBC Holdings plc 5½ per cent Subordinated Notes 2009 which he held throughout the year.
As a Director of HSBC Private Banking Holdings (Suisse), S K Green has an interest as beneficial owner in one share of CHF1,000, which he held throughout the year. S K Green has waived his rights to receive dividends on the share and has undertaken to transfer the share to HSBC on ceasing to be a Director of HSBC Private Banking Holdings (Suisse).
As Directors of HSBC France, S K Green and M F Geoghegan each have an interest as beneficial owner in one share of €5 in that company, which they held throughout the year. The Directors have waived their rights to receive dividends on these
shares and have undertaken to transfer these shares to HSBC on ceasing to be Directors of HSBC France.
No Directors held any short positions as defined in the Securities and Futures Ordinance of Hong Kong. Save as stated above and in the Directors’ Remuneration Report, none of the Directors had an interest in any shares or debentures of HSBC or any associated corporation at the beginning or at the end of the year, and none of the Directors or members of their immediate family was awarded or exercised any right to subscribe for any shares or debentures during the year.
Since the end of the year, the interests of each of the following Directors have increased by the number of HSBC Holdings ordinary shares shown against their name:
HSBC Holdings ordinary shares of US$0.50
Beneficial owner
Jointly with another person
Beneficiary of a trust
R K F Ch’ien .................................................................................................... 4161 – – J D Coombe ..................................................................................................... 471 – – Baroness Dunn ................................................................................................. 1,1821 – – D J Flint ........................................................................................................... 6422 2231 5,6733
M F Geoghegan ............................................................................................... – – 5,3143
S K Green ........................................................................................................ 2,8774 – 8,0073
Sir Brian Moffat................................................................................................ – 971 – S W Newton...................................................................................................... 451 – – S M Robertson ................................................................................................. 411 – – Sir Brian Williamson........................................................................................ 1381 – –
1 Scrip dividend. 2 Comprises scrip dividend on shares held as beneficial owner (568 shares), the acquisition of shares in the HSBC Holdings UK Share
Ownership Plan through regular monthly contributions (27 shares), the automatic reinvestment of dividend income on shares held in the plan (8 shares) and by the automatic reinvestment of dividend income by an Individual Savings Account and Personal Equity Plan manager (39 shares).
3 Scrip dividend on awards held under The HSBC Share Plan and the HSBC Holdings Restricted Share Plan 2000. 4 Comprises scrip dividend on shares held as beneficial owner (2,842 shares), the acquisition of shares in the HSBC Holdings UK Share
Ownership Plan through normal monthly contributions (27 shares) and the automatic reinvestment of dividend income on shares held in the plan (8 shares).
There have been no other changes in Directors’ interests from 31 December 2006 to the date of this Report. Any subsequent changes up to the last practicable date before the publication of the ‘Notice of Annual General Meeting’ will be set out in the notes to that Notice.
At 31 December 2006, Directors and Senior Management held, in aggregate, beneficial interests in 17,333,485 HSBC Holdings ordinary shares (0.2 per cent of the issued ordinary shares).
At 31 December 2006, executive Directors and Senior Management held, in aggregate, options to subscribe for 4,585,589 HSBC Holdings ordinary shares under the HSBC Holdings Executive Share Option Scheme, HSBC Holdings Group Share Option Plan, HSBC Holdings savings-related share
option plans and HSBC Finance 1996 Long-Term Executive Incentive Compensation Plan. These options are exercisable between 2007 and 2014 at prices ranging from £5.3496 to £9.1350 per share, and US$10.66 to US$21.37 per share.
Employees
At 31 December 2006, HSBC’s customers were served by 312,000 full and part-time employees worldwide, compared with 284,000 at 31 December 2005 and 253,000 at 31 December 2004. The main centres of employment are the UK with approximately 57,000 employees; the US 50,000; Brazil 29,000; Hong Kong 28,000; India 27,000; Mexico 24,000 and France 15,000. HSBC negotiates with recognised unions. The highest concentrations
H S B C H O L D I N G S P L C
Report of the Directors: Governance (continued) Employees / Share plans
266
of union membership are in Brazil, France, India, Malaysia, Malta, Mexico, the Philippines, Singapore and the UK. It is the policy to maintain well-developed communications and consultation programmes. HSBC has not experienced any material disruptions to its operations from labour disputes during the past five years.
In support of its strategy, HSBC focuses on attracting, developing and motivating the very best individuals and on encouraging talent internally. HSBC places employees’ engagement with the business central to people management. With a proven link to superior business performance, this is beneficial to shareholders, colleagues and customers alike. Emphasis is placed on performance management and differentiated rewards that are competitive in their market, valuing those who contribute over time. In addition, a continuing focus on policies that encourage an inclusive working environment and the availability of career opportunities for all is critical to HSBC being an employer of choice. HSBC seeks to maintain an employee profile that reflects its customer base.
HSBC operates in a highly competitive and international business environment and HSBC’s diverse workforce represents a significant competitive advantage. The broad cultural mix and increasing cross-border mobility of its employees enables HSBC to resource operations with individuals who have detailed knowledge of local markets and of HSBC globally, in order to enhance customer service and improve productivity. HSBC recruits from a broad cross-section of society and encourages the sharing of individual perspectives and ideas through collective leadership development events, training and global secondments.
Increasingly HSBC recognises its role as an employer in a wider context and is developing its commitment to employee health issues, involvement in community and not-for-profit organisations and flexible working opportunities. As rising global education levels and advances in technology improve, the Group’s access to previously untapped resources and the profile of HSBC’s employees continues to change. Job losses in some countries may arise but HSBC has a good record of communicating honestly and openly, treating people with respect and reassigning people wherever possible.
HSBC attaches great importance to cultivating its own talent. Resources have been set aside to ensure a supply of talented individuals to meet business needs, with support provided for these employees in the form of career enhancement and
personal development programmes. HSBC invests in succession planning and developing a talent pipeline from graduate hires through to senior management. In addition, HSBC recognises that there are lessons to be learned from other successful businesses, and will recruit from other organisations where appropriate.
Employee involvement
HSBC Holdings continues to regard communication with its employees as a key aspect of its policies. Information is given to employees about employment matters and about the financial and economic factors affecting HSBC’s performance through management channels, an intranet site accessible to all HSBC’s employees worldwide, in-house magazines and by way of attendance at internal seminars and training programmes. Employees are encouraged to discuss operational and strategic issues with their line management and to make suggestions aimed at improving performance. The involvement of employees in the performance of HSBC is further encouraged through participation in bonus and share plans as appropriate.
About half of all HSBC employees now participate in one or more of HSBC’s employee share plans.
Employment of disabled persons
HSBC Holdings continues to be committed to providing equal opportunities to employees. The employment of disabled persons is included in this commitment and the recruitment, training, career development and promotion of disabled persons is based on the aptitudes and abilities of the individual. Should employees become disabled during employment, every effort is made to continue their employment and, if necessary, appropriate training is provided.
Remuneration policy
As with most businesses, HSBC’s performance depends on the quality and commitment of its people. Accordingly, the Board’s stated strategy is to attract, retain and motivate the very best people.
In a business that is based on trust and relationships, HSBC’s broad policy is to look for people who want to make a long-term career with the organisation since trust and relationships are built over time.
Remuneration is an important component in people’s decisions on which company to join, but it is not the only one; it is HSBC’s experience that
267
people are attracted to an organisation with good values, fairness, the potential for success and the scope to develop a broad, interesting career.
In line with the overall principles applied by the Remuneration Committee as described on page 280 in the Directors’ Remuneration Report:
• employees’ salaries are reviewed annually in the context of individual and business performance, market practice, internal relativities and competitive market pressures. Allowances and benefits are largely determined by local market practice;
• employees participate in various bonus arrangements. The level of performance-related variable pay depends upon the performance of constituent businesses and the individual concerned. Variable bonus plans emphasise revenue growth whilst retaining a strong link to expense control; other key measures taken into account in determining individual bonus levels include customer relationships; employee engagement; full utilisation of professional skills; and adherence to HSBC’s ethical standards, lending guidelines, internal controls and procedures. Bonus ranges are reviewed in the context of prevailing market practice; and
• HSBC has a long history of paying close attention to its customers in order to provide value for shareholders. This has been achieved by ensuring that the interests of HSBC and its employees are aligned with those of its shareholders and that HSBC’s approach to risk management serves the interests of all. Accordingly, employees are encouraged to participate in the success they help to create, through participating in the HSBC Holdings savings-related share option plans and in local share ownership and profit-sharing arrangements.
Employee share plans
To help align the interests of employees with those of shareholders, share options are granted under all-employee share plans and discretionary awards of Performance Shares and Restricted Shares are made under The HSBC Share Plan. There have been no awards of discretionary share options since 30 September 2005.
Set out on pages 267 to 275 are particulars of outstanding employee share options, including those held by employees working under employment contracts that are regarded as ‘continuous contracts’ for the purposes of the Hong Kong Employment
Ordinance. The options were granted at nil consideration. No options have been granted to substantial shareholders, suppliers of goods or services, or in excess of the individual limit for each share plan. No options were cancelled during the year.
Employee share plans are subject to the following limits on the number of HSBC Holdings ordinary shares that may be subscribed for. In any 10-year period not more than 10 per cent of the HSBC Holdings ordinary shares in issue from time to time (approximately 1,159 million HSBC Holdings ordinary shares at 5 March 2007) may in aggregate become issuable pursuant to the grant of options or be issued other than pursuant to options under all-employee share plans. In any 10-year period not more than 5 per cent of the HSBC Holdings ordinary shares in issue from time to time (approximately 579 million HSBC Holdings ordinary shares on 5 March 2007) may in aggregate be put under option under The HSBC Share Plan or be issuable pursuant to the HSBC Holdings Group Share Option Plan, the HSBC Executive Share Option Scheme, the HSBC Holdings Restricted Share Plan 2000 or The HSBC Share Plan. The number of HSBC Holdings ordinary shares that may be issued on exercise of all options granted on or after 27 May 2005 under The HSBC Share Plan and any other plans must not exceed 1,119,000,000 HSBC Holdings ordinary shares. Under the HSBC Holdings savings-related share option plans, The HSBC Share Plan, HSBC Holdings Group Share Option Plan and the HSBC Holdings Executive Share Option Scheme there were options outstanding over 277,129,598 HSBC Holdings ordinary shares at 31 December 2006. Particulars of options over HSBC Holdings shares held by Directors of HSBC Holdings are set out on pages 287 of the Directors’ Remuneration Report.
The impact on earnings per share of granting share options which are to be satisfied by the issue of new shares is shown in diluted earnings per share on the face of the consolidated income statement, with further details disclosed in Note 12 on the Financial Statements on page 339. The effect on basic earnings per share of exercising all outstanding share options would be to dilute it by 0.58 per cent.
All-employee share option plans
The HSBC Holdings Savings-Related Share Option Plan and the HSBC Holdings Savings-Related Share Option Plan: International are all-employee share plans under which eligible HSBC employees (those employed within the Group on the first working day of the year of grant) may be granted options to
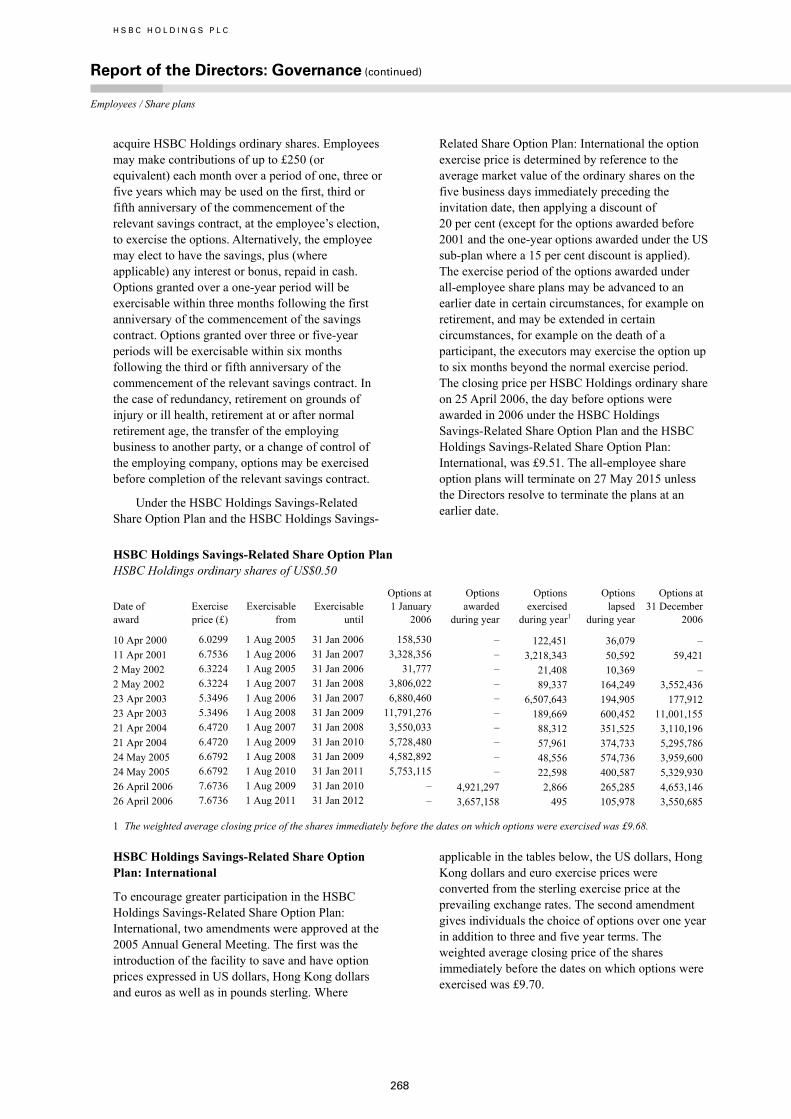
H S B C H O L D I N G S P L C
Report of the Directors: Governance (continued) Employees / Share plans
268
acquire HSBC Holdings ordinary shares. Employees may make contributions of up to £250 (or equivalent) each month over a period of one, three or five years which may be used on the first, third or fifth anniversary of the commencement of the relevant savings contract, at the employee’s election, to exercise the options. Alternatively, the employee may elect to have the savings, plus (where applicable) any interest or bonus, repaid in cash. Options granted over a one-year period will be exercisable within three months following the first anniversary of the commencement of the savings contract. Options granted over three or five-year periods will be exercisable within six months following the third or fifth anniversary of the commencement of the relevant savings contract. In the case of redundancy, retirement on grounds of injury or ill health, retirement at or after normal retirement age, the transfer of the employing business to another party, or a change of control of the employing company, options may be exercised before completion of the relevant savings contract.
Under the HSBC Holdings Savings-Related Share Option Plan and the HSBC Holdings Savings-
Related Share Option Plan: International the option exercise price is determined by reference to the average market value of the ordinary shares on the five business days immediately preceding the invitation date, then applying a discount of 20 per cent (except for the options awarded before 2001 and the one-year options awarded under the US sub-plan where a 15 per cent discount is applied). The exercise period of the options awarded under all-employee share plans may be advanced to an earlier date in certain circumstances, for example on retirement, and may be extended in certain circumstances, for example on the death of a participant, the executors may exercise the option up to six months beyond the normal exercise period. The closing price per HSBC Holdings ordinary share on 25 April 2006, the day before options were awarded in 2006 under the HSBC Holdings Savings-Related Share Option Plan and the HSBC Holdings Savings-Related Share Option Plan: International, was £9.51. The all-employee share option plans will terminate on 27 May 2015 unless the Directors resolve to terminate the plans at an earlier date.
HSBC Holdings Savings-Related Share Option Plan HSBC Holdings ordinary shares of US$0.50
Date of award
Exercise price (£)
Exercisable from
Exercisable until
Options at 1 January 2006
Options awarded during year
Options exercised during year1
Options lapsed during year
Options at 31 December 2006
10 Apr 2000 6.0299 1 Aug 2005 31 Jan 2006 158,530 – 122,451 36,079 – 11 Apr 2001 6.7536 1 Aug 2006 31 Jan 2007 3,328,356 – 3,218,343 50,592 59,421 2 May 2002 6.3224 1 Aug 2005 31 Jan 2006 31,777 – 21,408 10,369 – 2 May 2002 6.3224 1 Aug 2007 31 Jan 2008 3,806,022 – 89,337 164,249 3,552,436 23 Apr 2003 5.3496 1 Aug 2006 31 Jan 2007 6,880,460 – 6,507,643 194,905 177,912 23 Apr 2003 5.3496 1 Aug 2008 31 Jan 2009 11,791,276 – 189,669 600,452 11,001,155 21 Apr 2004 6.4720 1 Aug 2007 31 Jan 2008 3,550,033 – 88,312 351,525 3,110,196 21 Apr 2004 6.4720 1 Aug 2009 31 Jan 2010 5,728,480 – 57,961 374,733 5,295,786 24 May 2005 6.6792 1 Aug 2008 31 Jan 2009 4,582,892 – 48,556 574,736 3,959,600 24 May 2005 6.6792 1 Aug 2010 31 Jan 2011 5,753,115 – 22,598 400,587 5,329,930 26 April 2006 7.6736 1 Aug 2009 31 Jan 2010 – 4,921,297 2,866 265,285 4,653,146 26 April 2006 7.6736 1 Aug 2011 31 Jan 2012 – 3,657,158 495 105,978 3,550,685
1 The weighted average closing price of the shares immediately before the dates on which options were exercised was £9.68.
HSBC Holdings Savings-Related Share Option Plan: International
To encourage greater participation in the HSBC Holdings Savings-Related Share Option Plan: International, two amendments were approved at the 2005 Annual General Meeting. The first was the introduction of the facility to save and have option prices expressed in US dollars, Hong Kong dollars and euros as well as in pounds sterling. Where
applicable in the tables below, the US dollars, Hong Kong dollars and euro exercise prices were converted from the sterling exercise price at the prevailing exchange rates. The second amendment gives individuals the choice of options over one year in addition to three and five year terms. The weighted average closing price of the shares immediately before the dates on which options were exercised was £9.70.

269
HSBC Holdings ordinary shares of US$0.50
Date of award
Exercise price (£)
Exercisable from
Exercisable until
Options at 1 January 2006
Options awarded during year
Options exercised during year
Options lapsed during year
Options at 31 December 2006
10 Apr 2000 6.0299 1 Aug 2005 31 Jan 2006 460,231 – 143,034 317,197 – 11 Apr 2001 6.7536 1 Aug 2006 31 Jan 2007 1,275,370 – 1,058,761 175,756 40,853 2 May 2002 6.3224 1 Aug 2005 31 Jan 2006 121,795 – 30,328 91,467 – 2 May 2002 6.3224 1 Aug 2007 31 Jan 2008 1,099,581 – 8,016 28,044 1,063,521 23 Apr 2003 5.3496 1 Aug 2006 31 Jan 2007 10,459 – 3,312 7,147 – 23 Apr 2003 5.3496 1 Aug 2008 31 Jan 2009 10,488 – – – 10,488 8 May 2003 5.3496 1 Aug 2006 31 Jan 2007 15,488,310 – 13,601,113 1,576,819 310,378 8 May 2003 5.3496 1 Aug 2008 31 Jan 2009 6,009,197 – 26,376 155,787 5,827,034 21 Apr 2004 6.4720 1 Aug 2007 31 Jan 2008 49,524 – – 2,454 47,070 21 Apr 2004 6.4720 1 Aug 2009 31 Jan 2010 12,365 – – – 12,365 10 May 2004 6.4720 1 Aug 2007 31 Jan 2008 9,235,596 – 54,635 567,666 8,613,295 10 May 2004 6.4720 1 Aug 2009 31 Jan 2010 3,096,929 – 5,144 138,309 2,953,476 24 May 2005 6.6792 1 Aug 2008 31 Jan 2009 11,986,110 – 25,562 1,004,484 10,956,064 24 May 2005 6.6792 1 Aug 2010 31 Jan 2011 3,949,607 – 7,422 198,269 3,743,916 26 Apr 2006 7.6736 1 Aug 2007 31 Oct 2007 – 903,056 1,156 41,291 860,609 26 Apr 2006 7.6736 1 Aug 2009 31 Jan 2010 – 2,390,318 500 65,039 2,324,779 26 Apr 2006 7.6736 1 Aug 2011 31 Jan 2012 – 537,775 – 19,663 518,112
Date of award
Exercise price (US$)
Exercisable from
Exercisable until
Options at 1 January 2006
Options awarded during year
Options exercised during year
Options lapsed during year
Options at 31 December 2006
26 Apr 2006 14.16211 1 Aug 2007 31 Oct 2007 – 636,783 – 44,965 591,818 26 Apr 2006 13.3290 1 Aug 2007 31 Oct 2007 – 117,957 – 5,297 112,660 26 Apr 2006 13.3290 1 Aug 2009 31 Jan 2010 – 1,832,362 – 83,216 1,749,146 26 Apr 2006 13.3290 1 Aug 2011 31 Jan 2012 – 505,502 – 27,026 478,476 1 Exercisable at a 15 per cent discount to the average market value of the ordinary shares on the five business days immediately
preceding the invitation date.
Date of award
Exercise price (€)
Exercisable from
Exercisable until
Options at 1 January 2006
Options awarded during year
Options exercised during year
Options lapsed during year
Options at 31 December 2006
26 Apr 2006 11.0062 1 Aug 2007 31 Oct 2007 – 43,261 – 1,215 42,046 26 Apr 2006 11.0062 1 Aug 2009 31 Jan 2010 – 191,017 – 2,160 188,857 26 Apr 2006 11.0062 1 Aug 2011 31 Jan 2012 – 40,967 – 1,397 39,570
Date of award
Exercise price (HK$)
Exercisable from
Exercisable until
Options at 1 January 2006
Options awarded during year
Options exercised during year
Options lapsed during year
Options at 31 December 2006
26 Apr 2006 103.4401 1 Aug 2007 31 Oct 2007 – 1,368,901 34 73,021 1,295,846 26 Apr 2006 103.4401 1 Aug 2009 31 Jan 2010 – 4,337,651 570 81,320 4,255,761 26 Apr 2006 103.4401 1 Aug 2011 31 Jan 2012 – 1,142,709 322 31,996 1,110,391
Performance Share awards and Restricted Share awards
Note 9 on the Financial Statements on pages 332 to 338 gives details about share-based payments, including awards of Performance Shares and Restricted Shares made in 2006.
The HSBC Share Plan was approved at the 2005 Annual General Meeting. Awards of Performance Shares are made under this Plan to executive
Directors and other senior executives. The performance conditions for awards of Performance Shares are described under ‘Long-term incentive plan’ on page 281. The Remuneration Committee has determined that for awards made from 2007, Performance Share awards will be directed to those senior executives who can influence the performance conditions, being the Group Chairman and members and attendees of the Group Management Board.
H S B C H O L D I N G S P L C
Report of the Directors: Governance (continued) Employees / Share plans
270
Awards of Restricted Shares are made to other employees below the level of the Group Management Board based on performance, potential and retention requirements or as part of deferral of annual bonus. Restricted Share awards comprise a number of shares to which the employee will become entitled, normally after three years, subject to the individual remaining in employment. All awards of Performance Shares and Restricted Shares will be satisfied by the transfer of existing shares.
Discretionary share option plans
Prior to 2005, awards of discretionary share options were made under the HSBC Holdings Group Share Option Plan and the HSBC Holdings Executive Share Option Scheme to employees, based on performance criteria and potential. The vesting of these options was subject to the attainment of pre-determined relative TSR performance criteria, except within HSBC France (which was acquired in 2000) where performance criteria were phased in. Under the HSBC Holdings Group Share Option Plan the maximum value of options which could have been granted to an employee in any one year (together with any Performance Share awards under the HSBC Holdings Restricted Share Plan 2000) was 150 per cent of the employee’s annual salary at the date of grant plus any bonus paid for the previous year (or in exceptional circumstances 225 per cent). Under the HSBC Executive Share Option Scheme the maximum value of options which could have been granted to an employee in any one year was four times the employee’s relevant earnings. Subject to attainment of the relative TSR performance condition where applicable, options are generally exercisable between the third and tenth anniversary of the date of grant. Employees of a subsidiary that is sold or transferred out of HSBC may exercise options awarded under the HSBC Holdings Group Share Option Plan or the HSBC Holdings Executive Share Option Scheme within six or twelve months respectively of the sale or transfer regardless of whether the performance condition is met. Subject to the attainment of relative TSR performance conditions the options are exercisable up to the tenth anniversary of the date of grant.
In light of the sustained performance and shareholder returns over the three year period to March 2006, the Remuneration Committee exercised its discretion to waive the relative TSR performance condition in respect of the 2003 awards under the HSBC Holdings Group Share Option Plan. This waiver did not apply to awards with relative TSR performance conditions which were granted to senior executives under the French sub-plan of the HSBC
Holdings Group Share Option Plan. In 2006 there were still some 35,000 high performing employees (approximately the top 20 per cent of performers) below senior management who had received share option awards under the HSBC Holdings Group Share Option Plan in 2003. Further details were given on page 216 of the Annual Report and Accounts 2005.
The Remuneration Committee favours the use of Performance Shares and Restricted Shares and, following the introduction of The HSBC Share Plan in 2005, has not granted discretionary share options on any widespread basis. There are locations, and there may be particular circumstances in the future, however, where option grants may be appropriate. No options were awarded in 2006. The maximum value of options which may be granted to an employee in any one year under The HSBC Share Plan (when taken together with any Performance Share awards made under The HSBC Share Plan) is 700 per cent of the employee’s annual salary at the date of grant.
The exercise price of options granted under The HSBC Share Plan, and previously under the HSBC Holdings Group Share Option Plan, is the higher of the average market value of the ordinary shares on the five business days prior to the grant of the option or the market value of the ordinary shares on the date of grant of the option. The exercise price of options granted under the HSBC Holdings Executive Share Option Scheme was the market value of the ordinary shares on the business day prior to the grant of the option. The HSBC Share Plan will terminate on 27 May 2015 unless the Directors resolve to terminate the Plan at an earlier date.
The exercise period of the options awarded under discretionary share incentive plans may be advanced to an earlier date in certain circumstances, for example on retirement and may be extended in certain circumstances, for example on the death of a participant the executors may exercise the option up to twelve months beyond the normal exercise period.

271
HSBC Holdings Executive Share Option Scheme1 HSBC Holdings ordinary shares of US$0.50
Date of award
Exercise price (£)
Exercisable from
Exercisable until
Options at 1 January 2006
Options exercised during year2
Options lapsed during year
Options at 31 December 2006
1 Apr 1996 3.3334 1 Apr 1999 1 Apr 2006 208,269 182,769 25,500 – 24 Mar 1997 5.0160 24 Mar 2000 24 Mar 2007 572,819 366,745 18,000 188,074 12 Aug 1997 7.7984 12 Aug 2000 12 Aug 2007 14,625 5,625 – 9,000 16 Mar 1998 6.2767 16 Mar 2001 16 Mar 2008 1,063,611 376,177 9,000 678,434 29 Mar 1999 6.3754 3 Apr 2002 29 Mar 2009 17,004,786 5,059,192 136,624 11,808,970 10 Aug 1999 7.4210 10 Aug 2002 10 Aug 2009 117,908 5,850 12,000 100,058 31 Aug 1999 7.8710 31 Aug 2002 31 Aug 2009 4,000 – – 4,000 3 Apr 2000 7.4600 3 Apr 2003 3 Apr 2010 13,268,990 3,770,744 249,677 9,248,569
1 The HSBC Holdings Executive Share Option Scheme expired on 26 May 2000. No options have been granted under the Scheme since that date.
2 The weighted average closing price of the shares immediately before the dates on which options were exercised was £9.72.
HSBC Holdings Group Share Option Plan1 HSBC Holdings ordinary shares of US$0.50
Date of award
Exercise price (£)
Exercisable from
Exercisable until
Options at 1 January 2006
Options exercised during year2
Options lapsed during year
Options at 31 December 2006
4 Oct 2000 9.6420 4 Oct 2003 4 Oct 2010 371,885 43,406 7,303 321,176 23 Apr 2001 8.7120 23 Apr 2004 23 Apr 2011 39,241,828 9,285,643 555,716 29,400,469 30 Aug 2001 8.2280 30 Aug 2004 30 Aug 2011 262,955 80,762 3,000 179,193 7 May 2002 8.4050 7 May 2005 7 May 2012 44,268,052 11,008,002 758,353 32,501,697 30 Aug 2002 7.4550 30 Aug 2005 30 Aug 2012 410,625 48,025 1,000 361,600 2 May 2003 6.9100 2 May 2006 2 May 2013 52,831,030 17,190,284 1,099,160 34,541,586 29 Aug 2003 8.1300 29 Aug 2006 29 Aug 2013 555,080 100,186 9,000 445,894 3 Nov 2003 9.1350 3 Nov 2006 3 Nov 2013 4,069,800 – 814,000 3,255,800 30 Apr 2004 8.2830 30 Apr 2007 30 Apr 2014 60,216,608 61,500 2,227,604 57,927,504 27 Aug 2004 8.6500 27 Aug 2007 27 Aug 2014 337,760 – 5,290 332,470 20 Apr 2005 8.3620 30 Apr 2008 20 Apr 2015 7,416,895 – 56,100 7,360,795
1 The HSBC Holdings Group Share Option Plan expired on 26 May 2005. No options have been granted under the Plan since that date. 2 The weighted average closing price of the shares immediately before the dates on which options were exercised was £9.69.
The HSBC Share Plan HSBC Holdings ordinary shares of US$0.50
Date of award
Exercise price (£)
Exercisable from
Exercisable until
Options at 1 January 2006
Options exercised during year
Options lapsed during year
Options at 31 December 2006
21 Jun 2005 8.794 21 Jun 2008 21 Jun 2009 552,526 – – 552,526 30 Sep 2005 9.170 30 Sep 2008 30 Sep 2015 74,985 – – 74,985 Subsidiary company share plans
HSBC France and its subsidiaries
When it was acquired in 2000, HSBC France and its subsidiary company, HSBC Private Bank France, operated employee share option plans under which
options could be granted over their respective shares. No further options will be granted under either of these companies’ plans. The following are details of options to acquire shares in HSBC France and HSBC Private Bank France.
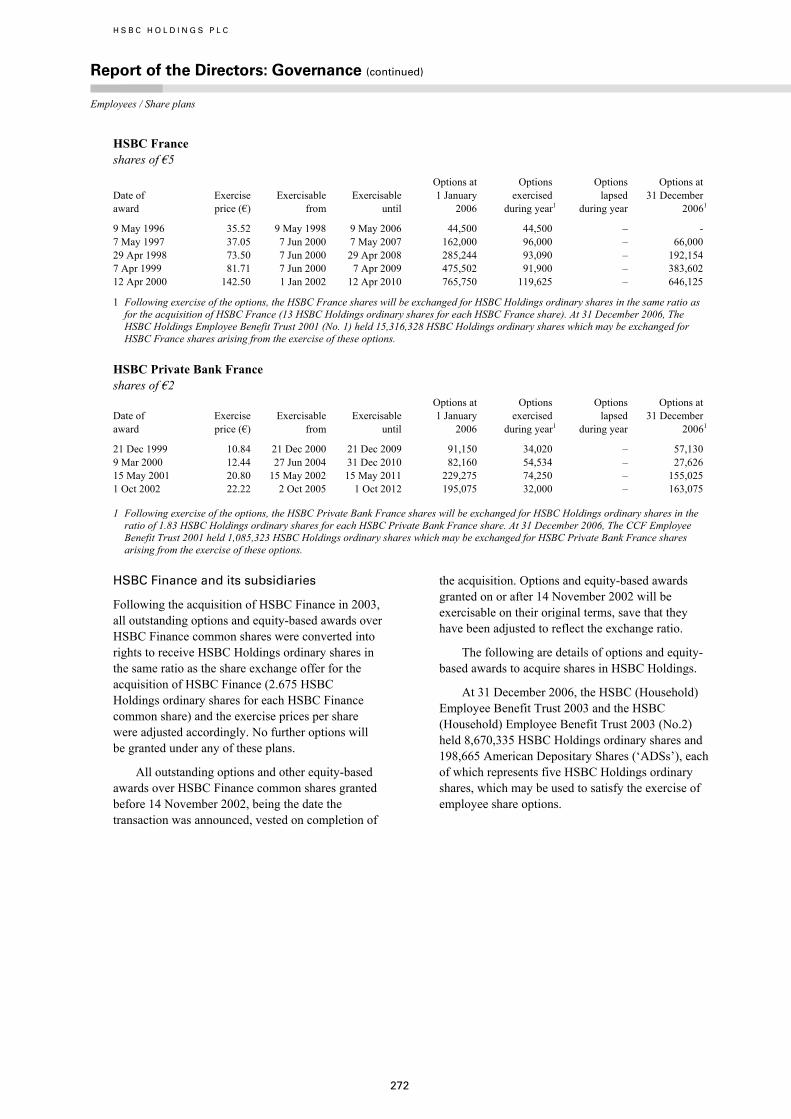
H S B C H O L D I N G S P L C
Report of the Directors: Governance (continued) Employees / Share plans
272
HSBC France shares of €5
Date of award
Exercise price (€)
Exercisable from
Exercisable until
Options at 1 January 2006
Options exercised during year1
Options lapsed during year
Options at 31 December 20061
9 May 1996 35.52 9 May 1998 9 May 2006 44,500 44,500 – - 7 May 1997 37.05 7 Jun 2000 7 May 2007 162,000 96,000 – 66,000 29 Apr 1998 73.50 7 Jun 2000 29 Apr 2008 285,244 93,090 – 192,154 7 Apr 1999 81.71 7 Jun 2000 7 Apr 2009 475,502 91,900 – 383,602 12 Apr 2000 142.50 1 Jan 2002 12 Apr 2010 765,750 119,625 – 646,125
1 Following exercise of the options, the HSBC France shares will be exchanged for HSBC Holdings ordinary shares in the same ratio as for the acquisition of HSBC France (13 HSBC Holdings ordinary shares for each HSBC France share). At 31 December 2006, The HSBC Holdings Employee Benefit Trust 2001 (No. 1) held 15,316,328 HSBC Holdings ordinary shares which may be exchanged for HSBC France shares arising from the exercise of these options.
HSBC Private Bank France shares of €2
Date of award
Exercise price (€)
Exercisable from
Exercisable until
Options at 1 January 2006
Options exercised during year1
Options lapsed during year
Options at 31 December 20061
21 Dec 1999 10.84 21 Dec 2000 21 Dec 2009 91,150 34,020 – 57,130 9 Mar 2000 12.44 27 Jun 2004 31 Dec 2010 82,160 54,534 – 27,626 15 May 2001 20.80 15 May 2002 15 May 2011 229,275 74,250 – 155,025 1 Oct 2002 22.22 2 Oct 2005 1 Oct 2012 195,075 32,000 – 163,075
1 Following exercise of the options, the HSBC Private Bank France shares will be exchanged for HSBC Holdings ordinary shares in the ratio of 1.83 HSBC Holdings ordinary shares for each HSBC Private Bank France share. At 31 December 2006, The CCF Employee Benefit Trust 2001 held 1,085,323 HSBC Holdings ordinary shares which may be exchanged for HSBC Private Bank France shares arising from the exercise of these options.
HSBC Finance and its subsidiaries
Following the acquisition of HSBC Finance in 2003, all outstanding options and equity-based awards over HSBC Finance common shares were converted into rights to receive HSBC Holdings ordinary shares in the same ratio as the share exchange offer for the acquisition of HSBC Finance (2.675 HSBC Holdings ordinary shares for each HSBC Finance common share) and the exercise prices per share were adjusted accordingly. No further options will be granted under any of these plans.
All outstanding options and other equity-based awards over HSBC Finance common shares granted before 14 November 2002, being the date the transaction was announced, vested on completion of
the acquisition. Options and equity-based awards granted on or after 14 November 2002 will be exercisable on their original terms, save that they have been adjusted to reflect the exchange ratio.
The following are details of options and equity-based awards to acquire shares in HSBC Holdings.
At 31 December 2006, the HSBC (Household) Employee Benefit Trust 2003 and the HSBC (Household) Employee Benefit Trust 2003 (No.2) held 8,670,335 HSBC Holdings ordinary shares and 198,665 American Depositary Shares (‘ADSs’), each of which represents five HSBC Holdings ordinary shares, which may be used to satisfy the exercise of employee share options.
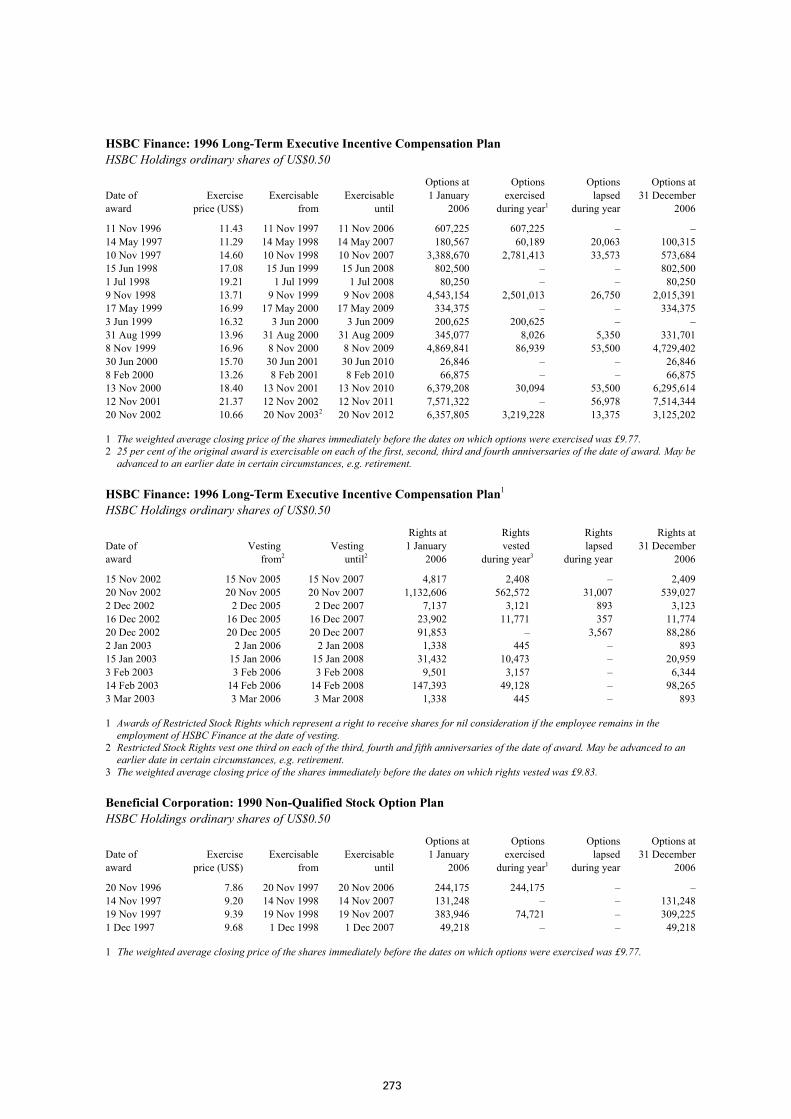
273
HSBC Finance: 1996 Long-Term Executive Incentive Compensation Plan HSBC Holdings ordinary shares of US$0.50
Date of award
Exercise price (US$)
Exercisable from
Exercisable until
Options at 1 January 2006
Options exercised during year1
Options lapsed during year
Options at 31 December 2006
11 Nov 1996 11.43 11 Nov 1997 11 Nov 2006 607,225 607,225 – – 14 May 1997 11.29 14 May 1998 14 May 2007 180,567 60,189 20,063 100,315 10 Nov 1997 14.60 10 Nov 1998 10 Nov 2007 3,388,670 2,781,413 33,573 573,684 15 Jun 1998 17.08 15 Jun 1999 15 Jun 2008 802,500 – – 802,500 1 Jul 1998 19.21 1 Jul 1999 1 Jul 2008 80,250 – – 80,250 9 Nov 1998 13.71 9 Nov 1999 9 Nov 2008 4,543,154 2,501,013 26,750 2,015,391 17 May 1999 16.99 17 May 2000 17 May 2009 334,375 – – 334,375 3 Jun 1999 16.32 3 Jun 2000 3 Jun 2009 200,625 200,625 – – 31 Aug 1999 13.96 31 Aug 2000 31 Aug 2009 345,077 8,026 5,350 331,701 8 Nov 1999 16.96 8 Nov 2000 8 Nov 2009 4,869,841 86,939 53,500 4,729,402 30 Jun 2000 15.70 30 Jun 2001 30 Jun 2010 26,846 – – 26,846 8 Feb 2000 13.26 8 Feb 2001 8 Feb 2010 66,875 – – 66,875 13 Nov 2000 18.40 13 Nov 2001 13 Nov 2010 6,379,208 30,094 53,500 6,295,614 12 Nov 2001 21.37 12 Nov 2002 12 Nov 2011 7,571,322 – 56,978 7,514,344 20 Nov 2002 10.66 20 Nov 20032 20 Nov 2012 6,357,805 3,219,228 13,375 3,125,202
1 The weighted average closing price of the shares immediately before the dates on which options were exercised was £9.77. 2 25 per cent of the original award is exercisable on each of the first, second, third and fourth anniversaries of the date of award. May be
advanced to an earlier date in certain circumstances, e.g. retirement.
HSBC Finance: 1996 Long-Term Executive Incentive Compensation Plan1 HSBC Holdings ordinary shares of US$0.50
Date of award
Vesting from2
Vesting until2
Rights at 1 January 2006
Rights vested during year3
Rights lapsed during year
Rights at 31 December 2006
15 Nov 2002 15 Nov 2005 15 Nov 2007 4,817 2,408 – 2,409 20 Nov 2002 20 Nov 2005 20 Nov 2007 1,132,606 562,572 31,007 539,027 2 Dec 2002 2 Dec 2005 2 Dec 2007 7,137 3,121 893 3,123 16 Dec 2002 16 Dec 2005 16 Dec 2007 23,902 11,771 357 11,774 20 Dec 2002 20 Dec 2005 20 Dec 2007 91,853 – 3,567 88,286 2 Jan 2003 2 Jan 2006 2 Jan 2008 1,338 445 – 893 15 Jan 2003 15 Jan 2006 15 Jan 2008 31,432 10,473 – 20,959 3 Feb 2003 3 Feb 2006 3 Feb 2008 9,501 3,157 – 6,344 14 Feb 2003 14 Feb 2006 14 Feb 2008 147,393 49,128 – 98,265 3 Mar 2003 3 Mar 2006 3 Mar 2008 1,338 445 – 893
1 Awards of Restricted Stock Rights which represent a right to receive shares for nil consideration if the employee remains in the employment of HSBC Finance at the date of vesting.
2 Restricted Stock Rights vest one third on each of the third, fourth and fifth anniversaries of the date of award. May be advanced to an earlier date in certain circumstances, e.g. retirement.
3 The weighted average closing price of the shares immediately before the dates on which rights vested was £9.83.
Beneficial Corporation: 1990 Non-Qualified Stock Option Plan HSBC Holdings ordinary shares of US$0.50
Date of award
Exercise price (US$)
Exercisable from
Exercisable until
Options at 1 January 2006
Options exercised during year1
Options lapsed during year
Options at 31 December 2006
20 Nov 1996 7.86 20 Nov 1997 20 Nov 2006 244,175 244,175 – – 14 Nov 1997 9.20 14 Nov 1998 14 Nov 2007 131,248 – – 131,248 19 Nov 1997 9.39 19 Nov 1998 19 Nov 2007 383,946 74,721 – 309,225 1 Dec 1997 9.68 1 Dec 1998 1 Dec 2007 49,218 – – 49,218
1 The weighted average closing price of the shares immediately before the dates on which options were exercised was £9.77.
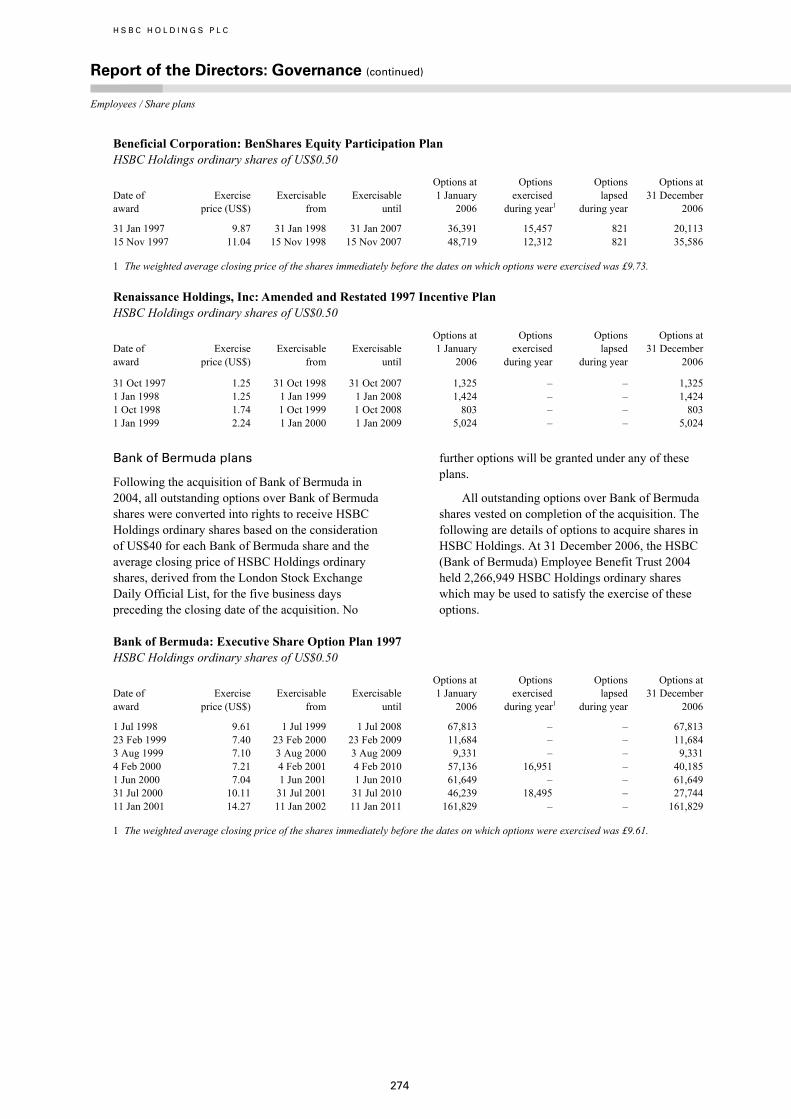
H S B C H O L D I N G S P L C
Report of the Directors: Governance (continued) Employees / Share plans
274
Beneficial Corporation: BenShares Equity Participation Plan HSBC Holdings ordinary shares of US$0.50
Date of award
Exercise price (US$)
Exercisable from
Exercisable until
Options at 1 January 2006
Options exercised during year1
Options lapsed during year
Options at 31 December 2006
31 Jan 1997 9.87 31 Jan 1998 31 Jan 2007 36,391 15,457 821 20,113 15 Nov 1997 11.04 15 Nov 1998 15 Nov 2007 48,719 12,312 821 35,586
1 The weighted average closing price of the shares immediately before the dates on which options were exercised was £9.73.
Renaissance Holdings, Inc: Amended and Restated 1997 Incentive Plan HSBC Holdings ordinary shares of US$0.50
Date of award
Exercise price (US$)
Exercisable from
Exercisable until
Options at 1 January 2006
Options exercised during year
Options lapsed during year
Options at 31 December 2006
31 Oct 1997 1.25 31 Oct 1998 31 Oct 2007 1,325 – – 1,325 1 Jan 1998 1.25 1 Jan 1999 1 Jan 2008 1,424 – – 1,424 1 Oct 1998 1.74 1 Oct 1999 1 Oct 2008 803 – – 803 1 Jan 1999 2.24 1 Jan 2000 1 Jan 2009 5,024 – – 5,024
Bank of Bermuda plans
Following the acquisition of Bank of Bermuda in 2004, all outstanding options over Bank of Bermuda shares were converted into rights to receive HSBC Holdings ordinary shares based on the consideration of US$40 for each Bank of Bermuda share and the average closing price of HSBC Holdings ordinary shares, derived from the London Stock Exchange Daily Official List, for the five business days preceding the closing date of the acquisition. No
further options will be granted under any of these plans.
All outstanding options over Bank of Bermuda shares vested on completion of the acquisition. The following are details of options to acquire shares in HSBC Holdings. At 31 December 2006, the HSBC (Bank of Bermuda) Employee Benefit Trust 2004 held 2,266,949 HSBC Holdings ordinary shares which may be used to satisfy the exercise of these options.
Bank of Bermuda: Executive Share Option Plan 1997 HSBC Holdings ordinary shares of US$0.50
Date of award
Exercise price (US$)
Exercisable from
Exercisable until
Options at 1 January 2006
Options exercised during year1
Options lapsed during year
Options at 31 December 2006
1 Jul 1998 9.61 1 Jul 1999 1 Jul 2008 67,813 – – 67,813 23 Feb 1999 7.40 23 Feb 2000 23 Feb 2009 11,684 – – 11,684 3 Aug 1999 7.10 3 Aug 2000 3 Aug 2009 9,331 – – 9,331 4 Feb 2000 7.21 4 Feb 2001 4 Feb 2010 57,136 16,951 – 40,185 1 Jun 2000 7.04 1 Jun 2001 1 Jun 2010 61,649 – – 61,649 31 Jul 2000 10.11 31 Jul 2001 31 Jul 2010 46,239 18,495 – 27,744 11 Jan 2001 14.27 11 Jan 2002 11 Jan 2011 161,829 – – 161,829
1 The weighted average closing price of the shares immediately before the dates on which options were exercised was £9.61.
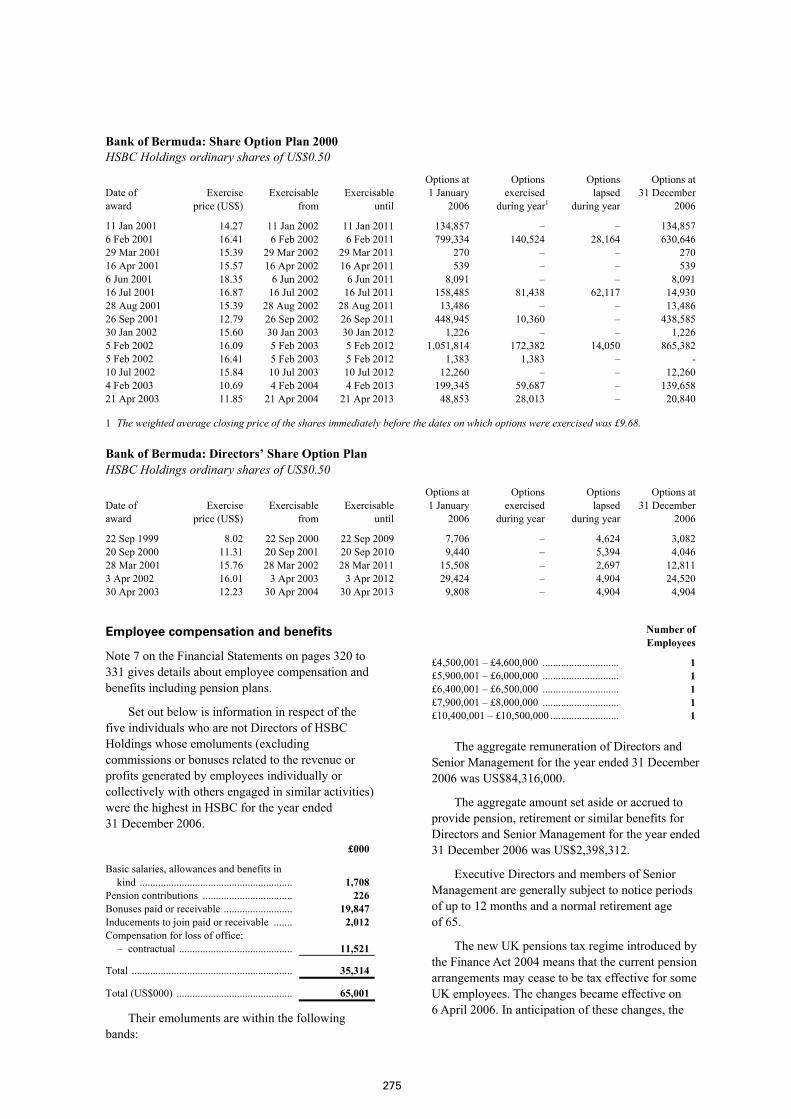
275
Bank of Bermuda: Share Option Plan 2000 HSBC Holdings ordinary shares of US$0.50
Date of award
Exercise price (US$)
Exercisable from
Exercisable until
Options at 1 January 2006
Options exercised during year1
Options lapsed during year
Options at 31 December 2006
11 Jan 2001 14.27 11 Jan 2002 11 Jan 2011 134,857 – – 134,8576 Feb 2001 16.41 6 Feb 2002 6 Feb 2011 799,334 140,524 28,164 630,64629 Mar 2001 15.39 29 Mar 2002 29 Mar 2011 270 – – 27016 Apr 2001 15.57 16 Apr 2002 16 Apr 2011 539 – – 5396 Jun 2001 18.35 6 Jun 2002 6 Jun 2011 8,091 – – 8,09116 Jul 2001 16.87 16 Jul 2002 16 Jul 2011 158,485 81,438 62,117 14,93028 Aug 2001 15.39 28 Aug 2002 28 Aug 2011 13,486 – – 13,48626 Sep 2001 12.79 26 Sep 2002 26 Sep 2011 448,945 10,360 – 438,58530 Jan 2002 15.60 30 Jan 2003 30 Jan 2012 1,226 – – 1,2265 Feb 2002 16.09 5 Feb 2003 5 Feb 2012 1,051,814 172,382 14,050 865,3825 Feb 2002 16.41 5 Feb 2003 5 Feb 2012 1,383 1,383 – -10 Jul 2002 15.84 10 Jul 2003 10 Jul 2012 12,260 – – 12,2604 Feb 2003 10.69 4 Feb 2004 4 Feb 2013 199,345 59,687 – 139,65821 Apr 2003 11.85 21 Apr 2004 21 Apr 2013 48,853 28,013 – 20,840
1 The weighted average closing price of the shares immediately before the dates on which options were exercised was £9.68.
Bank of Bermuda: Directors’ Share Option Plan HSBC Holdings ordinary shares of US$0.50
Date of award
Exercise price (US$)
Exercisable from
Exercisable until
Options at 1 January 2006
Options exercised during year
Options lapsed during year
Options at 31 December 2006
22 Sep 1999 8.02 22 Sep 2000 22 Sep 2009 7,706 – 4,624 3,08220 Sep 2000 11.31 20 Sep 2001 20 Sep 2010 9,440 – 5,394 4,04628 Mar 2001 15.76 28 Mar 2002 28 Mar 2011 15,508 – 2,697 12,8113 Apr 2002 16.01 3 Apr 2003 3 Apr 2012 29,424 – 4,904 24,52030 Apr 2003 12.23 30 Apr 2004 30 Apr 2013 9,808 – 4,904 4,904
Employee compensation and benefits
Note 7 on the Financial Statements on pages 320 to 331 gives details about employee compensation and benefits including pension plans.
Set out below is information in respect of the five individuals who are not Directors of HSBC Holdings whose emoluments (excluding commissions or bonuses related to the revenue or profits generated by employees individually or collectively with others engaged in similar activities) were the highest in HSBC for the year ended 31 December 2006.
£000
Basic salaries, allowances and benefits in kind .......................................................... 1,708
Pension contributions .................................. 226 Bonuses paid or receivable .......................... 19,847 Inducements to join paid or receivable ....... 2,012 Compensation for loss of office:
– contractual ........................................... 11,521
Total ............................................................. 35,314
Total (US$000) ............................................ 65,001
Their emoluments are within the following bands:
Number of Employees
£4,500,001 – £4,600,000 ............................. 1£5,900,001 – £6,000,000 ............................. 1£6,400,001 – £6,500,000 ............................. 1£7,900,001 – £8,000,000 ............................. 1£10,400,001 – £10,500,000 .......................... 1
The aggregate remuneration of Directors and Senior Management for the year ended 31 December 2006 was US$84,316,000.
The aggregate amount set aside or accrued to provide pension, retirement or similar benefits for Directors and Senior Management for the year ended 31 December 2006 was US$2,398,312.
Executive Directors and members of Senior Management are generally subject to notice periods of up to 12 months and a normal retirement age of 65.
The new UK pensions tax regime introduced by the Finance Act 2004 means that the current pension arrangements may cease to be tax effective for some UK employees. The changes became effective on 6 April 2006. In anticipation of these changes, the
H S B C H O L D I N G S P L C
Report of the Directors: Governance (continued) Employees / Corporate responsibility
276
Remuneration Committee established some principles when formulating its policy response:
1 the cost of pension provision should not increase;
2 HSBC should not compensate individuals for changes in the tax regime; and
3 HSBC should make available an effective alternative form of reward where current pension provision is no longer tax effective.
Corporate Responsibility
Corporate Responsibility is the term used at HSBC to describe the Group’s approach to meeting a wide range of non-financial responsibilities which, although not generally enshrined as legal or regulatory requirements, constitute behaviour expected of the Group by its stakeholders, including shareholders, customers and employees. Insofar as these expectations concern HSBC’s impact on the environmental, social and economic well-being of the world at large, Corporate Responsibility influences the Group’s response to encouraging sustainable development.
Investing in sustainability
HSBC seeks to meet society’s expectations by managing all aspects of its business ethically, responsibly and in an increasingly sustainable way. The Group’s key business values include a commitment to the highest personal standards of integrity at all levels and to honesty, transparency and fair dealing in all its business activities. In recent years HSBC has intensified its efforts to embed sustainability into the way it manages risk and business development opportunities. This acknowledges that HSBC’s continuing financial success depends, in part, on its ability to identify and address non-financial considerations which are material to the business.
Recognising that HSBC’s core financial services businesses have the potential to exert the most influence over sustainability issues, a Group Sustainable Development unit was formed in 2005 to work closely with these businesses in all customer groups to help them to manage sustainability risks and to pursue opportunities in environmental markets worldwide. The unit reports directly to the Group Chief Operating Officer.
Group Sustainable Development has three main objectives:
• business development – helping HSBC to identify and develop business opportunities that
assist the Group’s customers to embrace sustainability in their businesses;
• risk management – providing a policy framework to manage and reduce sustainability risks arising from HSBC’s lending and investment businesses; and
• advice – providing policy and guidance for management on sustainability issues as they affect HSBC’s corporate real estate portfolio and supply chain.
HSBC aims for consistency in the implementation of its sustainable development strategy across all Group businesses. The United Nations set Millennium Development Goals of resisting climate change, achieving water purity, encouraging biodiversity and alleviating poverty. HSBC has identified four themes as relevant to its response. These are risk management (policies and processes); business development (carbon, water, forestry and microfinance); operations (buildings, travel, suppliers and IT); and philanthropy (education and environment).
In pursuing its strategy, HSBC Holdings expanded the Group Sustainable Development unit in 2006 to build on existing initiatives and focus on business development opportunities related to the United Nation’s four development goals.
In 2005, HSBC was the first major banking organisation in the world to become carbon neutral. This was achieved by a three-stage carbon management plan: to manage and reduce the Group’s direct emissions; to reduce the carbon intensity of the electricity HSBC uses by buying ‘green’ electricity where feasible; and to offset the remaining carbon dioxide
emissions by purchasing
carbon credits.
During 2006, HSBC’s leadership position in managing its carbon footprint attracted wide-ranging public interest and led to a marked growth in business opportunities presented to the Group in areas such as energy efficiency, low carbon technologies and renewable energy. In recognition of this, and to help clients respond to the challenges and opportunities of creating a lower carbon economy, HSBC launched its carbon finance strategy in 2006. In essence, HSBC will continue to support fossil fuel electricity generation (within the parameters of the Equator Principles and sector-specific risk policies) while working with clients to promote clean energy generation and energy-efficient/renewable energy technologies.
HSBC’s approach to business opportunity is complemented by its management of risk. The
277
Group’s Sustainable Risk Advisory Unit has published policies laying down minimum standards for lending and investment covering relationships with clients in energy, forest land and products, freshwater infrastructure and the chemicals industry, all focusing on how HSBC’s involvement in these environmentally sensitive industries can contribute to sustainable development.
Community involvement
HSBC sees value and opportunity from aligning its longstanding commitment to the environment with its core strategic themes. In 2006, for example, the HSBC Global Education Trust launched ‘Future First’, a five-year programme designed to help street children, children in care and orphans, under which HSBC’s operations around the world will collaborate with local charitable organisations to make a lasting and beneficial difference by supporting projects that bring these children into the mainstream of society. The programme complements HSBC’s sustainable business development focus on poverty, for which a microfinance strategy was developed during 2006.
In recognition of its leadership in merging social, environmental and business objectives, HSBC was named as overall winner in the first Financial Times Sustainable Banking Awards in 2006. The awards, in association with the International Finance Corporation, drew 90 entries from 48 financial institutions around the world. In addition to initiatives noted above, HSBC highlighted ‘Investing in Nature’, its US$50 million, five-year eco-partnership with Earthwatch Institute, WWF and Botanic Gardens Conservation International.
Also in 2006, HSBC’s Group Head Office building in London achieved an overall rating of ‘Excellent’ for site management and operation under the Environmental Assessment Method run by the Building Research Establishment, the UK’s leading environmental standards authority.
Health and safety
The maintenance of appropriate health and safety standards throughout HSBC remains a key responsibility of all managers and HSBC is committed to managing actively all health and safety risks associated with its business. HSBC’s objectives are to identify, remove, reduce or control material risks of fires and of accidents or injuries to employees and visitors.
Health and Safety Policies, Group standards and procedures are set by Group Corporate Real Estate and are implemented by Health, Safety and Fire
Co-ordinators based in each country in which HSBC operates.
Despite the considerable international pressure on terrorist networks over the past few years, the global threat from terrorism persists. HSBC remains committed to maintaining its preparedness and to ensuring the highest standards of health and safety wherever in the world it operates.
Group Security provides regular risk assessments in areas of increased risk to assist management in judging the level of terrorist threat. In addition, Regional Security functions conduct regular security reviews to ensure measures to protect HSBC staff, buildings, assets and information are appropriate for the level of threat.
Supplier payment policy
HSBC Holdings subscribes to the Better Payment Practice Code for all suppliers, the four principles of which are: to agree payment terms at the outset and stick to them; to explain payment procedures to suppliers; to pay bills in accordance with any contract agreed with the supplier or as required by law; and to tell suppliers without delay when an invoice is contested and settle disputes quickly.
Copies of, and information about, the Code are available from: The Department of Trade and Industry, 1 Victoria Street, London SW1H 0ET; and the internet at www.dti.gov.uk/publications.
It is HSBC Holdings’ practice to organise payment to its suppliers through a central accounts function operated by its subsidiary, HSBC Bank. Included in the balance with HSBC Bank is the amount due to trade creditors which, at 31 December 2006, represented 20 days’ average daily purchases of goods and services received from such creditors, calculated in accordance with the Companies Act 1985, as amended by Statutory Instrument 1997/571.
Donations
During the year, HSBC made charitable donations totalling US$86.3 million. Of this amount, US$32.8 million was given for charitable purposes in the UK.
No political donations were made during the year.
At the Annual General Meeting in 2003, shareholders gave authority for HSBC Holdings and HSBC Bank to make EU political donations and incur EU political expenditure up to a maximum aggregate sum of £250,000 and £50,000 respectively over a four-year period as a precautionary measure
H S B C H O L D I N G S P L C
Report of the Directors: Governance (continued) Corporate responsibility / Shareholders
278
in light of the wide definitions in The Political Parties, Elections and Referendums Act 2000. These authorities have not been used.
Corporate responsibility reporting
HSBC provides information in its Corporate Responsibility Report and website (www.hsbc.com/cr) on the extent to which it has complied with its environmental, social and ethical policies. Aspects covered include: how HSBC is implementing and applying the Equator Principles to manage the environmental and social risks in project finance; employee diversity; environmental management; and health and safety. HSBC is using the guidelines of the Global Reporting Initiative in producing its 2006 Corporate Responsibility Report. Third party scrutiny of the assertions made in the report is provided through an assurance process conducted by Den Norske Veritas. HSBC also participates in the Dow Jones Sustainability Index, FTSE4Good and Business in the Community’s Environment Index. HSBC’s Corporate Responsibility Report 2006 will be available at www.hsbc.com/crreport from May 2007.
Shareholders
Dividends for 2006
First, second and third interim dividends for 2006, each of US$0.15 per ordinary share, were paid on 6 July 2006, 4 October 2006, and 18 January 2007 respectively. Note 11 on the Financial Statements gives more information on the dividends declared in 2006. On 5 March 2007, the Directors declared a fourth interim dividend for 2006 of US$0.17 per ordinary share in lieu of a final dividend, which will be payable to ordinary shareholders on 10 May 2007 in cash in US dollars, or in sterling or Hong Kong dollars at exchange rates to be determined on 30 April 2007, with a scrip dividend alternative. As the fourth interim dividend for 2006 was declared after the balance sheet date it has not been included as a creditor at 31 December 2006. The reserves available for distribution at 31 December 2006 are US$12,045 million.
A quarterly dividend of US$15.50 per 6.20 per cent non-cumulative US dollar preference share, Series A (‘Series A dollar preference share’), equivalent to a dividend of US$0.3875 per Series A American Depositary Share, each of which represents one-fortieth of a Series A dollar
preference share was paid on 15 March, 15 June, 15 September and 15 December 2006.
Dividends for 2007
The proposed timetables for the interim dividends in respect of 2007 on the ordinary shares of US$0.50 are given in the Shareholder Information section on pages 435 and 436.
A quarterly dividend of US$15.50 per Series A dollar preference share equivalent to a dividend of US$0.3875 per Series A American Depositary Share, each of which represents one-fortieth of a Series A dollar preference share was declared on 12 February 2007 for payment on 15 March 2007.
Communication with shareholders
Communication with shareholders is given high priority. Extensive information about HSBC’s activities is provided in the Annual Report and Accounts, Annual Review and the Interim Report which are sent to shareholders and are available on www.hsbc.com. There is regular dialogue with institutional investors and enquiries from individuals on matters relating to their shareholdings and the business of HSBC are welcomed and are dealt with in an informative and timely manner. All shareholders are encouraged to attend the Annual General Meeting or the informal meeting of shareholders held in Hong Kong to discuss the progress of HSBC.
Notifiable interests in share capital
According to the register maintained by HSBC Holdings up to 20 January 2007 pursuant to section 211 of the Companies Act 1985:
• Legal and General Investment Management Limited gave notice on 11 June 2002 that it had an interest on 10 June 2002 in 284,604,788 HSBC Holdings ordinary shares, representing 3.01 per cent of the ordinary shares in issue at that date; and
• Barclays PLC gave notice on 6 December 2006 that it had an interest on 29 November 2006 in 438,557,151 HSBC Holdings ordinary shares, representing 3.79 per cent of the ordinary shares in issue at that date.
Since 20 January 2007, no disclosures of major shareholdings have been made to the Company pursuant to the requirements of the Financial Services Authority Disclosure and Transparency Rule 5.

279
There are no notifiable interests in the equity share capital recorded in the register maintained under section 336 of the Securities and Futures Ordinance of Hong Kong.
In compliance with the Rules Governing the Listing of Securities on The Stock Exchange of Hong Kong Limited at least 25 per cent of the total issued share capital of HSBC Holdings has been held by the public at all times during 2006 and up to the date of this Report.
Dealings in HSBC Holdings shares
Except for dealings as intermediaries by HSBC Bank, HSBC Financial Products (France) and The Hongkong and Shanghai Banking Corporation, which are members of a European Economic Area exchange, neither HSBC Holdings nor any subsidiary undertaking has bought, sold or redeemed any securities of HSBC Holdings during the year ended 31 December 2006.
Annual General Meeting
The Annual General Meeting of HSBC Holdings will be held at the Barbican Hall, Barbican Centre, London EC2 on Friday 25 May 2007 at 11.00am.
Resolutions to receive the Annual Report and Accounts and to approve the Directors’ Remuneration Report, the re-election of Directors and the reappointment of KPMG Audit Plc as Auditor will be submitted to the Annual General Meeting. KPMG Audit Plc has expressed its willingness to continue in office and the Group Audit Committee and the Board have recommended that they be reappointed. Resolutions will also be submitted to the Annual General Meeting to renew the authorities for the allotment of shares, the disapplication of pre-emption rights, the purchase of ordinary shares, the scrip dividend alternative, political donations and expenditure, and to seek approval for shareholder electronic communications pursuant to the Companies Act 2006 and for changes to the articles of association.
A live webcast of the Annual General Meeting will be available on www.hsbc.com. From shortly after the conclusion of the Meeting until 30 June 2007 a recording of the proceedings will be available on www.hsbc.com. On behalf of the Board S K Green, Group Chairman 5 March 2007
H S B C H O L D I N G S P L C
Directors’ Remuneration Report Remuneration committee / Principles / Executive Directors
280
Page Remuneration policy (not audited) Remuneration Committee ............................. 280Overall principles .......................................... 280Executive Directors ....................................... 280
Salary ......................................................... 281Annual cash bonus ..................................... 281Long-term incentive plan ........................... 281
2007 awards ........................................... 281Performance conditions ......................... 281Arrangements from 2001-2004 .............. 283Total Shareholder Return ....................... 283
Pensions ..................................................... 284Service contracts ........................................ 284Other directorships .................................... 284
Non-executive Directors ............................... 285Fees ........................................................... 285
Remuneration review (audited) Directors’ emoluments .................................. 286Pensions ........................................................ 286Share plans .................................................... 287
Remuneration Committee
The Remuneration Committee meets regularly to consider human resource issues, particularly terms and conditions of employment, remuneration, retirement benefits, the development of high potential employees and key succession planning. Within the authority delegated by the Board, the Committee is responsible for approving the remuneration policy of HSBC including the terms of bonus plans, share plans and other long-term incentive plans and for agreeing the individual remuneration packages of executive Directors and other senior Group employees. No Directors are involved in deciding their own remuneration. Following each meeting the Committee reports to the Board on its activities. The terms of reference of the Committee are available at www.hsbc.com/ boardcommittees.
The members of the Remuneration Committee throughout 2006 were Sir Mark Moody-Stuart (Chairman), W K L Fung and S Hintze. Sir John Kemp-Welch was a member of the Committee until 26 May 2006. J D Coombe was appointed a member of the Committee on 1 June 2006. From the conclusion of the Annual General Meeting to be held in 2007, W K L Fung and S Hintze will retire as members of the Committee and G Morgan will become a member of the Committee.
There were seven meetings of the Remuneration Committee during 2006. S Hintze and Sir Mark
Moody-Stuart attended all of these meetings and W K L Fung attended six meetings. Sir John Kemp-Welch attended three of the four meetings held before his retirement. J D Coombe attended each of the three meetings held following his appointment.
Towers Perrin, a firm of specialist human resources consultants, has been appointed by the Committee to provide independent advice on executive remuneration issues. As a global firm, Towers Perrin also provides other remuneration, actuarial and retirement consulting services to various parts of HSBC. Other than the provision of expert advice in these areas to the Remuneration Committee and to HSBC, Towers Perrin has no connection with HSBC. Other consultants are used from time to time on specific issues. During the year the Group Chief Executive provided regular briefings to the Remuneration Committee. The Committee received advice from the Group General Manager, Human Resources, P W Boyles, the Senior Executive, Group Reward Management, P M Wood and the Head of Group Performance and Reward, J Beadle.
Overall principles
In carrying out its responsibilities, the Remuneration Committee applies the following key principles:
• to ensure that the total remuneration package (salary, bonus, long-term incentive awards and other benefits) is competitive in relation to comparable organisations in each of the markets in which HSBC operates;
• to offer fair and realistic salaries with an important element of variable pay, differentiated by performance;
• through awards of shares to recognise high performance, retain key talent and provide alignment with the interests of shareholders; and
• to follow a policy of moving progressively from defined benefit to defined contribution pension schemes.
Executive Directors
Consistent with the principles applied by the Committee, there are four key components to executive Directors’ remuneration:
• salary;
• annual cash bonus;
• long-term incentives; and
• pension.
281
To ensure that the executive Directors’ remuneration packages are competitive having regard to the broad international nature of the Group and the scope of its activities, the Remuneration Committee considers market data on senior executive remuneration arrangements within organisations that are considered key competitors. As far as the executive Directors are concerned, these are FTSE30 companies with significant international operations and other major European and where appropriate US parented banks.
Remuneration policy for executive Directors is intended to provide competitive rates of base salary but with the potential for the majority of the value of the remuneration package to be delivered in the form of both short and long-term incentives. This typically results in base salary comprising around 30 per cent of total direct pay and the remaining 70 per cent split between annual bonus and the expected value of Performance Share awards.
The policy adopted in 2006 will also apply in 2007. It is however, kept under regular review and where appropriate, shareholders will be consulted about any proposed changes in policy for subsequent years. Any such changes will also be described in future reports on Directors’ remuneration.
Each component of executive Directors’ remuneration is explained below.
Salary
The Committee reviews salary levels for executive Directors each year and any adjustments made take into account the individual’s performance in the job as well as competitive rates of pay found in comparator organisations.
The table below shows base salaries in 2006 and with effect from 1 March 2007 or, in the case of M F Geoghegan, 1 June 2007.
2007 2006 £000 £000
D J Flint ........................ 700 575 M F Geoghegan ............ 1,070 1,000 S K Green ..................... 1,250 1,250
Annual cash bonus
Cash bonuses for executive Directors are based primarily upon performance measured against a number of key financial targets for the Group. An assessment of individual performance, customer satisfaction and measures of employee engagement are also factors taken into account in determining bonuses for executive Directors.
Performance against these key measures may result in discretionary cash bonuses of up to 250 per cent of basic salary for executive Directors. The table below shows the awards made to the current executive Directors in 2006 in respect of 2005 and in 2007 in respect of 2006.
2007 2006 £000 £000
D J Flint ........................ 500 500 M F Geoghegan ............ 1,750 1,819 S K Green ...................... 1,750 1,750
Long-term incentive plan
In 2005 the vesting of Performance Share awards was made more challenging and highly geared to performance than under the previous arrangements. Under The HSBC Share Plan vesting is now based on two independent measures, relative TSR and growth in earnings per share, both of which are considered by the Remuneration Committee to be key measures of the Group’s overall business success.
Awards under The HSBC Share Plan can be up to a maximum of seven times salary. Individual awards being made in 2007 are set out in the table below.
2007 awards
Face value £000 2007 2006
D J Flint .......................... 2,200 1,600 M F Geoghegan .............. 5,000 2,000 S K Green ........................ 3,750 2,500
Total ................................ 10,950 6,100
It is to be noted that all of the shares will only be released to participants if both performance conditions are fully met. The ‘expected value’ of these awards is 44 per cent of the face value.
Performance conditions
Awards of Performance Shares under The HSBC Share Plan are divided into two equal parts subject to separate performance conditions measured over a three-year performance period (‘the performance period’):
• the Total Shareholder Return award (‘TSR award’): one half of the award of Performance Shares will be subject to a relative TSR measure. TSR is defined as the growth in share value and declared dividend income during the relevant period. In calculating TSR, dividend income is assumed to be reinvested in the underlying shares. As the comparator group
H S B C H O L D I N G S P L C
Directors’ Remuneration Report (continued) Executive Directors
282
includes companies listed on overseas markets, a common currency is used to ensure that TSR is measured on a consistent basis; and
• the earnings per ordinary share award (‘EPS award’): the other half of the Performance Share award will be based upon the absolute growth in EPS achieved by HSBC Holdings. For this purpose, EPS means the profit attributable to the shareholders (expressed in US dollars), divided by the weighted average number of ordinary shares in issue and held outside the Group during the year in question.
The TSR award is based on HSBC’s ranking against a comparator group of 28 major banks. The comparator group will generally comprise the largest banks in the world measured in terms of market capitalisation, but also having regard to the geographic spread and the nature of the activities of each bank. The Remuneration Committee will use these criteria in selecting any replacements to the comparator group that may be necessary during the performance period, for example because a bank ceases to exist or to be quoted or if its relevance to HSBC as a comparator significantly diminishes.
The TSR comparator group during 2006 and also at 5 March 2007 comprises ABN AMRO Holding N.V., Banco Bilbao Vizcaya Argentaria S.A, Banco Santander Central Hispano S.A., Bank of America Corporation, The Bank of New York Company, Inc., Barclays PLC, BNP PARIBAS S.A., Citigroup Inc., Crédit Agricole S.A., Credit Suisse Group, Deutsche Bank AG, HBOS plc, JPMorgan Chase & Co., Lloyds TSB Group plc, Mitsubishi Tokyo Financial Group, Inc., Mizuho Financial Group, Inc., Morgan Stanley, National Australia Bank Limited, Royal Bank of Canada, The Royal Bank of Scotland Group plc, Société Générale, Standard Chartered PLC, UBS AG, UniCredito Italiano S.p.A., US Bancorp, Wachovia Corporation, Wells Fargo & Company and Westpac Banking Corporation.
The extent to which the TSR award will vest will be determined on a sliding scale based on HSBC Holdings’ relative TSR ranking against the comparator group.
For TSR performance in line with the bank ranked 14th, only 30 per cent of the conditional TSR award will vest; if HSBC’s performance is in line with or above the bank ranked 7th in the ranked list all of the TSR award shares will vest.
Vesting between the 14th and 7th ranked banks will be based on HSBC’s position against the ranked list. In simple terms, the percentage vesting will start
at 30 per cent and will rise in 10 per cent increments for each position that HSBC achieves higher than the 14th bank in the ranked list until full vesting is achieved for TSR performance equal to or greater than the 7th bank in the ranked list.
Where HSBC’s performance falls between these incremental steps, account will be taken of HSBC’s TSR performance relative to the banks immediately above and below it. For example, if HSBC’s TSR falls half way between the bank ranked 12th (where, a release of 50 per cent of the TSR award would occur) and the bank ranked 13th (where a release of 40 per cent of the TSR award would occur), then the actual proportion of the TSR award released would be 45 per cent, i.e. half way between 40 per cent and 50 per cent.
For the EPS award, the base measure will be EPS for the financial year preceding that in which the award is made (‘the base year’). EPS will then be compared with the base year over three consecutive financial years commencing with the year in which the award is made. Incremental EPS will be calculated by expressing as a percentage of the EPS of the base year the difference each year of the three-year performance period between the EPS of that year and the EPS of the base year (with a negative percentage for any year in which the EPS is less than the EPS of the base year). These percentages will then be aggregated to arrive at the total incremental EPS for the performance period. In the event that the published EPS for the base year is restated during the performance period to adjust for changes in accounting standards, that restated EPS will be used for the purposes of the EPS performance condition.
The percentage of the conditional EPS award vesting will depend upon the absolute growth in EPS achieved over the three years. 30 per cent of the EPS award will vest if the incremental EPS over the performance period is 24 per cent or more.
The percentage of shares vesting will rise on a straight line proportionate basis to 100 per cent if HSBC’s incremental EPS over the performance period is 52 per cent or more.
No element of the TSR award will vest if over the three-year performance period HSBC’s TSR is below that of the bank ranked 14th in the comparator group list and no element of the EPS award will vest if HSBC’s incremental EPS over the performance period is less than 24 per cent.
To the extent that the performance conditions have not been met at the third anniversary, the shares awarded will be forfeited.
283
In addition, awards will not vest unless the Remuneration Committee is satisfied that HSBC Holdings’ financial performance has shown a sustained improvement in the period since the award date.
In determining whether HSBC has achieved a sustained improvement in performance the Remuneration Committee will take account of all relevant factors but in particular comparisons against the comparator group in areas such as revenue growth and mix, cost efficiency, credit performance, cash return on cash invested, dividend performance and total shareholder return.
Following the three-year performance period, the conditions applying to awards of Performance Shares under The HSBC Share Plan will be tested and vesting will take place shortly afterwards. Shares released will include additional shares equivalent to the value of the dividends payable on the vested shares over the performance period, where permitted by the laws of the relevant jurisdiction.
If events occur which cause the Remuneration Committee to consider that a performance condition has become unfair or impractical, the right is reserved to the Remuneration Committee, if it considers it appropriate to do so, to amend, relax or waive the condition.
Awards will vest in full immediately in cases of death. In the event of redundancy, retirement on grounds of injury or ill health, early retirement by agreement, normal retirement and where a participant ceases to be employed by HSBC, awards will normally vest at the end of the vesting period on a time-apportioned basis to the extent that the performance conditions have been satisfied. In the event of a change of control, awards will normally vest immediately and on a time-apportioned basis to the extent that the TSR performance condition has been satisfied. Awards will normally be forfeited if the participant is dismissed for cause or resigns from HSBC. In all these circumstances the Committee retains discretion to ensure fair and reasonable treatment.
Arrangements from 2001-2004
Between 2001 and 2004, awards of Performance shares were made under the HSBC Holdings Restricted Share Plan 2000. Vesting was linked to the attainment of predetermined TSR targets over a three-year period from the date of the award.
For awards made in 2003 the initial performance period was three years but the performance target was not achieved at the third anniversary of the date
of award. The test is due to be applied again in March 2007 in respect of the 2003 awards. If it is passed, full vesting and transfer of the shares will take place on the fifth anniversary of the date of grant, i.e. in March 2008. If it fails it will be subject to a final test in March 2008. For awards made in 2004 the performance conditions are the same but, if the performance test is not passed at the third anniversary, i.e. in March 2007, the shares will be forfeited.
In addition to these performance conditions, none of the outstanding awards will vest unless the Remuneration Committee is satisfied that, during the performance period, HSBC has achieved sustained growth. The Remuneration Committee retains discretion to recommend early release of shares awarded in certain circumstances, for example, retirement, redundancy or ill health.
When events occur which cause the Remuneration Committee to consider that the performance conditions have become unfair or impractical, the right is reserved for the Committee to amend or substitute the performance conditions. Whilst the Committee decided that options granted in 2003 under the HSBC Holdings Group Share Option Plan to employees below senior executive level could vest in March 2006 notwithstanding the failure to achieve the TSR performance condition, the awards of Performance Shares made in 2003 under the HSBC Holdings Restricted Share Plan 2000 to the 400 or so most senior executives of the Group continue to be subject to the pre-established TSR benchmark performance conditions, as set out above.
Total Shareholder Return
Graphs 1 to 4 below show HSBC Holdings’ TSR performance against the following:
• Graph 1: the benchmark TSR for Performance Shares awarded in March 2003;
• Graph 2: The Financial Times-Stock Exchange FTSE 100;
• Graph 3: The Morgan Stanley Capital International (‘MSCI’) World Index; and
• Graph 4: The MSCI Financials Index.
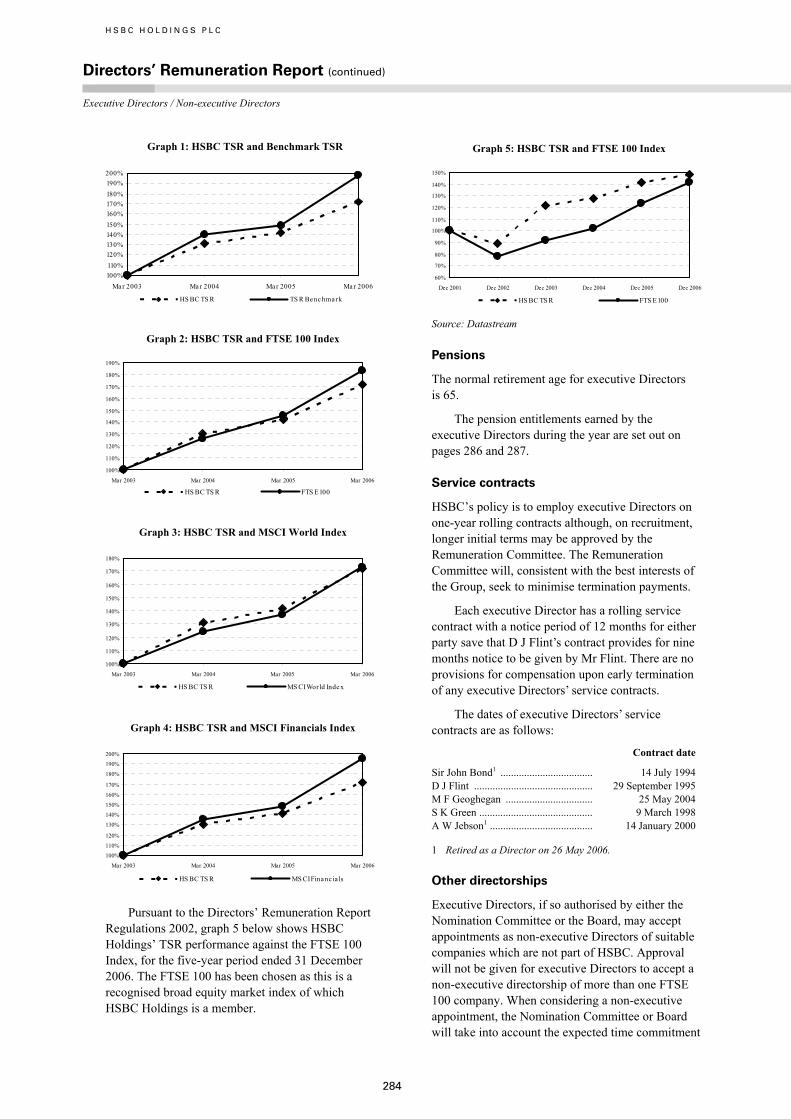
H S B C H O L D I N G S P L C
Directors’ Remuneration Report (continued) Executive Directors / Non-executive Directors
284
Graph 1: HSBC TSR and Benchmark TSR
100%110%120%130%140%150%160%170%180%190%200%
Ma r 2003 Ma r 2004 Ma r 2005 Ma r 2006
HS BC TS R TS R Benc hma rk
Graph 2: HSBC TSR and FTSE 100 Index
100%
110%
120%
130%
140%
150%
160%
170%
180%
190%
Mar 2003 Mar 2004 Mar 2005 Mar 2006
HS BC TS R FTS E 100
Graph 3: HSBC TSR and MSCI World Index
100%
110%
120%
130%
140%
150%
160%
170%
180%
Mar 2003 Mar 2004 Mar 2005 Mar 2006
HS BC TS R MS CI World Inde x
Graph 4: HSBC TSR and MSCI Financials Index
100%
110%
120%
130%
140%
150%
160%
170%
180%
190%
200%
Mar 2003 Mar 2004 Mar 2005 Mar 2006
HS BC TS R MS CI Fina nc ia ls
Pursuant to the Directors’ Remuneration Report Regulations 2002, graph 5 below shows HSBC Holdings’ TSR performance against the FTSE 100 Index, for the five-year period ended 31 December 2006. The FTSE 100 has been chosen as this is a recognised broad equity market index of which HSBC Holdings is a member.
Graph 5: HSBC TSR and FTSE 100 Index
60%
70%
80%
90%
100%
110%
120%
130%
140%
150%
Dec 2001 Dec 2002 Dec 2003 Dec 2004 Dec 2005 Dec 2006
HS BC TS R FTS E 100
Source: Datastream
Pensions
The normal retirement age for executive Directors is 65.
The pension entitlements earned by the executive Directors during the year are set out on pages 286 and 287.
Service contracts
HSBC’s policy is to employ executive Directors on one-year rolling contracts although, on recruitment, longer initial terms may be approved by the Remuneration Committee. The Remuneration Committee will, consistent with the best interests of the Group, seek to minimise termination payments.
Each executive Director has a rolling service contract with a notice period of 12 months for either party save that D J Flint’s contract provides for nine months notice to be given by Mr Flint. There are no provisions for compensation upon early termination of any executive Directors’ service contracts.
The dates of executive Directors’ service contracts are as follows:
Contract date
Sir John Bond1 ................................... 14 July 1994 D J Flint ............................................. 29 September 1995 M F Geoghegan ................................. 25 May 2004 S K Green ........................................... 9 March 1998 A W Jebson1 ....................................... 14 January 2000
1 Retired as a Director on 26 May 2006.
Other directorships
Executive Directors, if so authorised by either the Nomination Committee or the Board, may accept appointments as non-executive Directors of suitable companies which are not part of HSBC. Approval will not be given for executive Directors to accept a non-executive directorship of more than one FTSE 100 company. When considering a non-executive appointment, the Nomination Committee or Board will take into account the expected time commitment
285
of such appointment. The time commitment for executive Directors’ external appointments will be reviewed as part of the annual Board review. Any remuneration receivable in respect of an external appointment is normally paid to HSBC, unless otherwise approved by the Remuneration Committee.
Sir John Bond retained his fees as a non-executive Director of the Ford Motor Company, which were provided partly in the form of restricted shares, which become unrestricted over a period of five years. During the period from 1 January to 26 May 2006, when Sir John Bond retired as a Director of HSBC Holdings, the fees received were US$32,000 in cash and US$48,000 deferred into Ford common stock units. In addition, Ford provided US$200,000 of life assurance and US$500,000 of accidental death or dismemberment insurance. The life assurance can be continued after retirement from the board or Sir John Bond could elect to have it reduced to US$100,000 and receive US$15,000 a year for life. The accidental death or dismemberment insurance ends upon retirement from the board.
Non-executive Directors
Non-executive Directors are appointed for fixed terms not exceeding three years, subject to their re-election by shareholders at subsequent Annual General Meetings. Non-executive Directors have no service contract and are not eligible to participate in HSBC’s share plans. Non-executive Directors’ terms of appointment will expire as follows: in 2007, R K F Ch’ien, S Hintze and H Sohmen; in 2008,
Lord Butler, Baroness Dunn, J D Coombe, W K L Fung, J W J Hughes-Hallett and Sir Brian Moffat; in 2009, S W Newton, S M Robertson and Sir Brian Williamson; and in 2010, R A Fairhead, Sir Mark Moody-Stuart and G Morgan.
Fees
Non-executive Directors’ fees are regularly reviewed and compared with other large international companies. The current fee, which was approved by shareholders in 2006, is £65,000 per annum.
In addition, non-executive Directors receive the following fees:
Chairman, Audit Committee ...................... £50,000 p.a.Member, Audit Committee ......................... £20,000 p.a.
During 2006, seven meetings of the Group Audit Committee were held.
Chairman, Remuneration Committee ......... £40,000 p.a.Member, Remuneration Committee ........... £20,000 p.a.
During 2006, seven meetings of the Remuneration Committee were held.
Chairman, Nomination Committee ............ £30,000 p.a.Member, Nomination Committee ............... £20,000 p.a.
During 2006, four meetings of the Nomination Committee were held.
Chairman, Corporate Responsibility Committee .............................................. £30,000 p.a.
Member, Corporate Responsibility Committee .............................................. £20,000 p.a.
During 2006, five meetings of the Corporate Responsibility Committee were held.
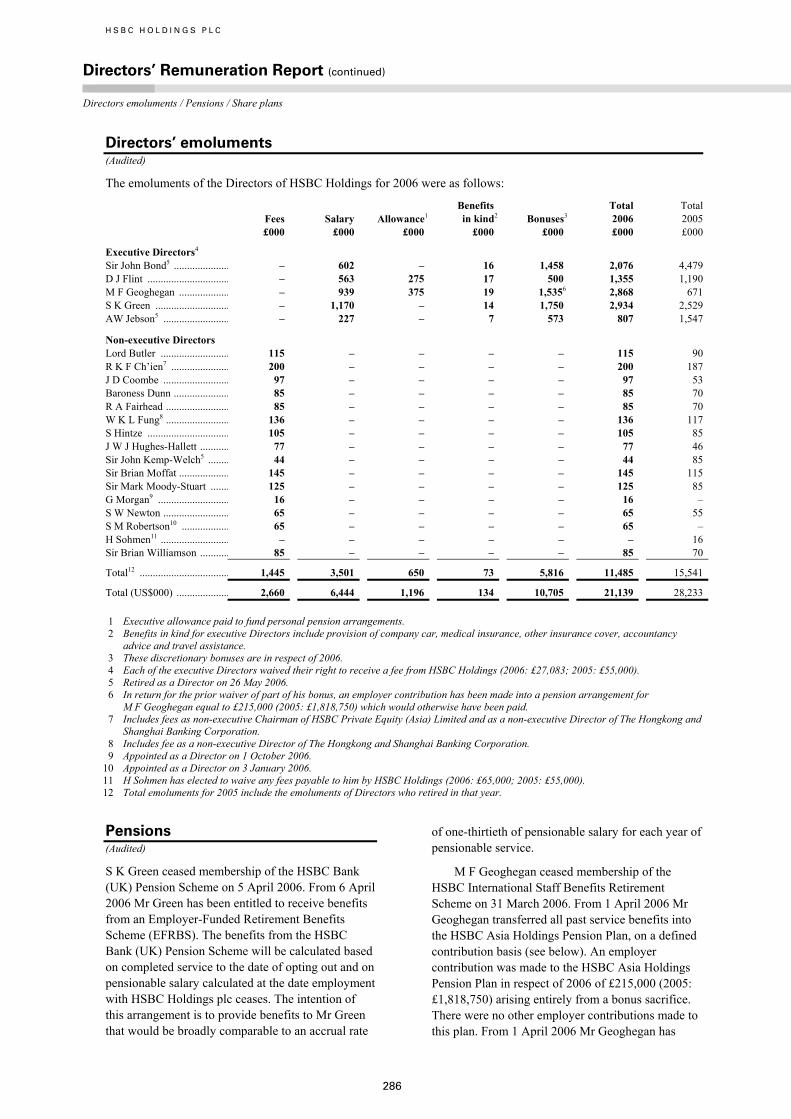
H S B C H O L D I N G S P L C
Directors’ Remuneration Report (continued) Directors emoluments / Pensions / Share plans
286
Directors’ emoluments (Audited)
The emoluments of the Directors of HSBC Holdings for 2006 were as follows:
Fees Salary Allowance1 Benefits in kind2 Bonuses3
Total 2006
Total 2005
£000 £000 £000 £000 £000 £000 £000
Executive Directors4 Sir John Bond5 ..................... – 602 – 16 1,458 2,076 4,479 D J Flint ............................... – 563 275 17 500 1,355 1,190 M F Geoghegan ................... – 939 375 19 1,5356 2,868 671 S K Green ............................ – 1,170 – 14 1,750 2,934 2,529 AW Jebson5 ......................... – 227 – 7 573 807 1,547
Non-executive Directors Lord Butler .......................... 115 – – – – 115 90 R K F Ch’ien7 ...................... 200 – – – – 200 187 J D Coombe ......................... 97 – – – – 97 53 Baroness Dunn ..................... 85 – – – – 85 70 R A Fairhead ........................ 85 – – – – 85 70 W K L Fung8 ........................ 136 – – – – 136 117 S Hintze ............................... 105 – – – – 105 85 J W J Hughes-Hallett ........... 77 – – – – 77 46 Sir John Kemp-Welch5 ........ 44 – – – – 44 85 Sir Brian Moffat ................... 145 – – – – 145 115 Sir Mark Moody-Stuart ....... 125 – – – – 125 85 G Morgan9 ........................... 16 – – – – 16 – S W Newton ......................... 65 – – – – 65 55 S M Robertson10 .................. 65 – – – – 65 – H Sohmen11 .......................... – – – – – – 16 Sir Brian Williamson ........... 85 – – – – 85 70
Total12 .................................. 1,445 3,501 650 73 5,816 11,485 15,541
Total (US$000) .................... 2,660 6,444 1,196 134 10,705 21,139 28,233 1 Executive allowance paid to fund personal pension arrangements. 2 Benefits in kind for executive Directors include provision of company car, medical insurance, other insurance cover, accountancy
advice and travel assistance. 3 These discretionary bonuses are in respect of 2006. 4 Each of the executive Directors waived their right to receive a fee from HSBC Holdings (2006: £27,083; 2005: £55,000). 5 Retired as a Director on 26 May 2006. 6 In return for the prior waiver of part of his bonus, an employer contribution has been made into a pension arrangement for
M F Geoghegan equal to £215,000 (2005: £1,818,750) which would otherwise have been paid. 7 Includes fees as non-executive Chairman of HSBC Private Equity (Asia) Limited and as a non-executive Director of The Hongkong and
Shanghai Banking Corporation. 8 Includes fee as a non-executive Director of The Hongkong and Shanghai Banking Corporation. 9 Appointed as a Director on 1 October 2006.
10 Appointed as a Director on 3 January 2006. 11 H Sohmen has elected to waive any fees payable to him by HSBC Holdings (2006: £65,000; 2005: £55,000). 12 Total emoluments for 2005 include the emoluments of Directors who retired in that year.
Pensions (Audited)
S K Green ceased membership of the HSBC Bank (UK) Pension Scheme on 5 April 2006. From 6 April 2006 Mr Green has been entitled to receive benefits from an Employer-Funded Retirement Benefits Scheme (EFRBS). The benefits from the HSBC Bank (UK) Pension Scheme will be calculated based on completed service to the date of opting out and on pensionable salary calculated at the date employment with HSBC Holdings plc ceases. The intention of this arrangement is to provide benefits to Mr Green that would be broadly comparable to an accrual rate
of one-thirtieth of pensionable salary for each year of pensionable service.
M F Geoghegan ceased membership of the HSBC International Staff Benefits Retirement Scheme on 31 March 2006. From 1 April 2006 Mr Geoghegan transferred all past service benefits into the HSBC Asia Holdings Pension Plan, on a defined contribution basis (see below). An employer contribution was made to the HSBC Asia Holdings Pension Plan in respect of 2006 of £215,000 (2005: £1,818,750) arising entirely from a bonus sacrifice. There were no other employer contributions made to this plan. From 1 April 2006 Mr Geoghegan has
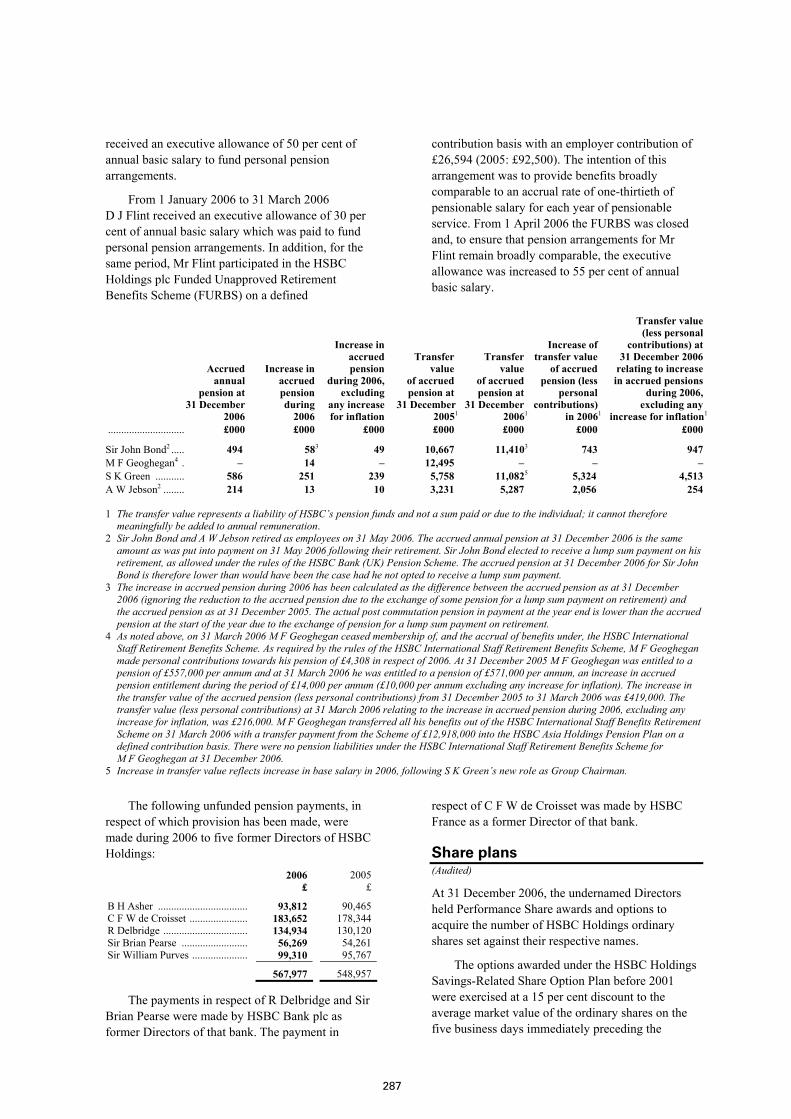
287
received an executive allowance of 50 per cent of annual basic salary to fund personal pension arrangements.
From 1 January 2006 to 31 March 2006 D J Flint received an executive allowance of 30 per cent of annual basic salary which was paid to fund personal pension arrangements. In addition, for the same period, Mr Flint participated in the HSBC Holdings plc Funded Unapproved Retirement Benefits Scheme (FURBS) on a defined
contribution basis with an employer contribution of £26,594 (2005: £92,500). The intention of this arrangement was to provide benefits broadly comparable to an accrual rate of one-thirtieth of pensionable salary for each year of pensionable service. From 1 April 2006 the FURBS was closed and, to ensure that pension arrangements for Mr Flint remain broadly comparable, the executive allowance was increased to 55 per cent of annual basic salary.
Accrued annual pension at 31 December 2006
Increase in accrued pension during 2006
Increase in accrued pension during 2006, excluding any increase for inflation
Transfer value of accrued pension at 31 December 20051
Transfer value of accrued pension at 31 December 20061
Increase of transfer value of accrued pension (less personal contributions) in 20061
Transfer value (less personal contributions) at 31 December 2006 relating to increase in accrued pensions during 2006, excluding any increase for inflation1
............................. £000 £000 £000 £000 £000 £000 £000
Sir John Bond2 ..... 494 583 49 10,667 11,4103 743 947 M F Geoghegan4 . – 14 – 12,495 – – – S K Green ........... 586 251 239 5,758 11,0825 5,324 4,513 A W Jebson2 ........ 214 13 10 3,231 5,287 2,056 254
1 The transfer value represents a liability of HSBC’s pension funds and not a sum paid or due to the individual; it cannot therefore meaningfully be added to annual remuneration.
2 Sir John Bond and A W Jebson retired as employees on 31 May 2006. The accrued annual pension at 31 December 2006 is the same amount as was put into payment on 31 May 2006 following their retirement. Sir John Bond elected to receive a lump sum payment on his retirement, as allowed under the rules of the HSBC Bank (UK) Pension Scheme. The accrued pension at 31 December 2006 for Sir John Bond is therefore lower than would have been the case had he not opted to receive a lump sum payment.
3 The increase in accrued pension during 2006 has been calculated as the difference between the accrued pension as at 31 December 2006 (ignoring the reduction to the accrued pension due to the exchange of some pension for a lump sum payment on retirement) and the accrued pension as at 31 December 2005. The actual post commutation pension in payment at the year end is lower than the accrued pension at the start of the year due to the exchange of pension for a lump sum payment on retirement.
4 As noted above, on 31 March 2006 M F Geoghegan ceased membership of, and the accrual of benefits under, the HSBC International Staff Retirement Benefits Scheme. As required by the rules of the HSBC International Staff Retirement Benefits Scheme, M F Geoghegan made personal contributions towards his pension of £4,308 in respect of 2006. At 31 December 2005 M F Geoghegan was entitled to a pension of £557,000 per annum and at 31 March 2006 he was entitled to a pension of £571,000 per annum, an increase in accrued pension entitlement during the period of £14,000 per annum (£10,000 per annum excluding any increase for inflation). The increase in the transfer value of the accrued pension (less personal contributions) from 31 December 2005 to 31 March 2006 was £419,000. The transfer value (less personal contributions) at 31 March 2006 relating to the increase in accrued pension during 2006, excluding any increase for inflation, was £216,000. M F Geoghegan transferred all his benefits out of the HSBC International Staff Benefits Retirement Scheme on 31 March 2006 with a transfer payment from the Scheme of £12,918,000 into the HSBC Asia Holdings Pension Plan on a defined contribution basis. There were no pension liabilities under the HSBC International Staff Retirement Benefits Scheme for M F Geoghegan at 31 December 2006.
5 Increase in transfer value reflects increase in base salary in 2006, following S K Green’s new role as Group Chairman.
The following unfunded pension payments, in respect of which provision has been made, were made during 2006 to five former Directors of HSBC Holdings:
2006 £
2005 £
B H Asher .................................. 93,812 90,465 C F W de Croisset ...................... 183,652 178,344 R Delbridge ................................ 134,934 130,120 Sir Brian Pearse ......................... 56,269 54,261 Sir William Purves ..................... 99,310 95,767
567,977 548,957
The payments in respect of R Delbridge and Sir Brian Pearse were made by HSBC Bank plc as former Directors of that bank. The payment in
respect of C F W de Croisset was made by HSBC France as a former Director of that bank.
Share plans (Audited)
At 31 December 2006, the undernamed Directors held Performance Share awards and options to acquire the number of HSBC Holdings ordinary shares set against their respective names.
The options awarded under the HSBC Holdings Savings-Related Share Option Plan before 2001 were exercised at a 15 per cent discount to the average market value of the ordinary shares on the five business days immediately preceding the
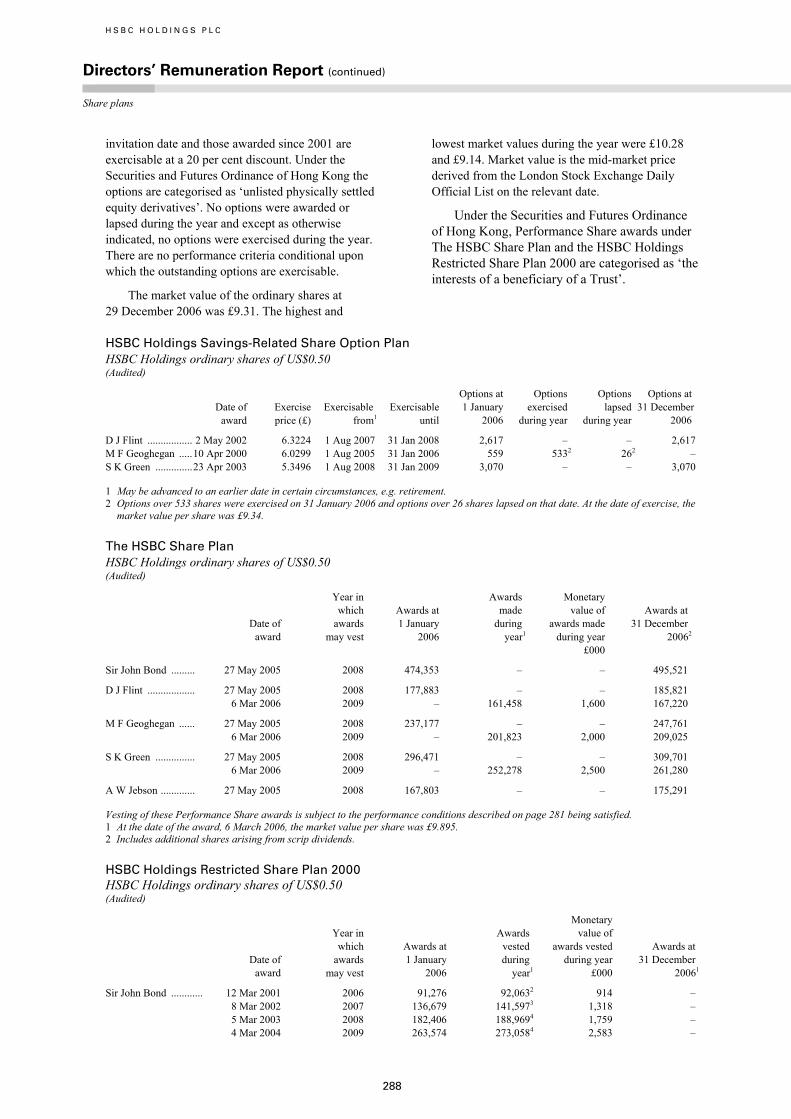
H S B C H O L D I N G S P L C
Directors’ Remuneration Report (continued) Share plans
288
invitation date and those awarded since 2001 are exercisable at a 20 per cent discount. Under the Securities and Futures Ordinance of Hong Kong the options are categorised as ‘unlisted physically settled equity derivatives’. No options were awarded or lapsed during the year and except as otherwise indicated, no options were exercised during the year. There are no performance criteria conditional upon which the outstanding options are exercisable.
The market value of the ordinary shares at 29 December 2006 was £9.31. The highest and
lowest market values during the year were £10.28 and £9.14. Market value is the mid-market price derived from the London Stock Exchange Daily Official List on the relevant date.
Under the Securities and Futures Ordinance of Hong Kong, Performance Share awards under The HSBC Share Plan and the HSBC Holdings Restricted Share Plan 2000 are categorised as ‘the interests of a beneficiary of a Trust’.
HSBC Holdings Savings-Related Share Option Plan HSBC Holdings ordinary shares of US$0.50 (Audited)
Date of award
Exercise price (£)
Exercisable from1
Exercisable until
Options at 1 January 2006
Options exercised during year
Options lapsed during year
Options at 31 December 2006
D J Flint ................. 2 May 2002 6.3224 1 Aug 2007 31 Jan 2008 2,617 – – 2,617 M F Geoghegan ..... 10 Apr 2000 6.0299 1 Aug 2005 31 Jan 2006 559 5332 262 – S K Green .............. 23 Apr 2003 5.3496 1 Aug 2008 31 Jan 2009 3,070 – – 3,070
1 May be advanced to an earlier date in certain circumstances, e.g. retirement. 2 Options over 533 shares were exercised on 31 January 2006 and options over 26 shares lapsed on that date. At the date of exercise, the
market value per share was £9.34.
The HSBC Share Plan HSBC Holdings ordinary shares of US$0.50 (Audited)
Date of award
Year in which awards may vest
Awards at 1 January 2006
Awards made during year1
Monetary value of awards made during year
Awards at 31 December 20062
£000
Sir John Bond ......... 27 May 2005 2008 474,353 – – 495,521
D J Flint .................. 27 May 2005 2008 177,883 – – 185,821 6 Mar 2006 2009 – 161,458 1,600 167,220
M F Geoghegan ...... 27 May 2005 2008 237,177 – – 247,761 6 Mar 2006 2009 – 201,823 2,000 209,025
S K Green ............... 27 May 2005 2008 296,471 – – 309,701 6 Mar 2006 2009 – 252,278 2,500 261,280
A W Jebson ............. 27 May 2005 2008 167,803 – – 175,291
Vesting of these Performance Share awards is subject to the performance conditions described on page 281 being satisfied. 1 At the date of the award, 6 March 2006, the market value per share was £9.895. 2 Includes additional shares arising from scrip dividends.
HSBC Holdings Restricted Share Plan 2000 HSBC Holdings ordinary shares of US$0.50 (Audited)
Date of award
Year in which awards may vest
Awards at 1 January 2006
Awards vested during year1
Monetary value of awards vested during year £000
Awards at 31 December 20061
Sir John Bond ............ 12 Mar 2001 2006 91,276 92,0632 914 – 8 Mar 2002 2007 136,679 141,5973 1,318 – 5 Mar 2003 2008 182,406 188,9694 1,759 – 4 Mar 2004 2009 263,574 273,0584 2,583 –
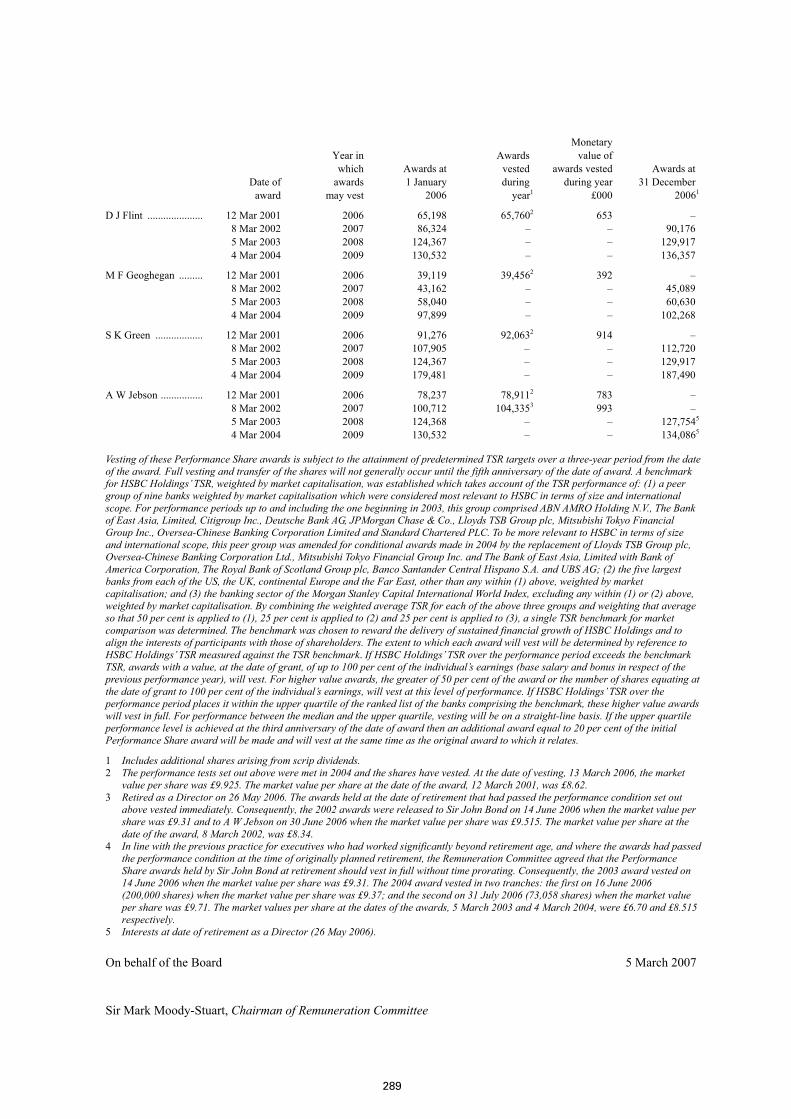
289
Date of award
Year in which awards may vest
Awards at 1 January 2006
Awards vested during year1
Monetary value of awards vested during year £000
Awards at 31 December 20061
D J Flint ..................... 12 Mar 2001 2006 65,198 65,7602 653 – 8 Mar 2002 2007 86,324 – – 90,176 5 Mar 2003 2008 124,367 – – 129,917 4 Mar 2004 2009 130,532 – – 136,357
M F Geoghegan ......... 12 Mar 2001 2006 39,119 39,4562 392 – 8 Mar 2002 2007 43,162 – – 45,089 5 Mar 2003 2008 58,040 – – 60,630 4 Mar 2004 2009 97,899 – – 102,268
S K Green .................. 12 Mar 2001 2006 91,276 92,0632 914 – 8 Mar 2002 2007 107,905 – – 112,720 5 Mar 2003 2008 124,367 – – 129,917 4 Mar 2004 2009 179,481 – – 187,490
A W Jebson ................ 12 Mar 2001 2006 78,237 78,9112 783 – 8 Mar 2002 2007 100,712 104,3353 993 – 5 Mar 2003 2008 124,368 – – 127,7545
4 Mar 2004 2009 130,532 – – 134,0865
Vesting of these Performance Share awards is subject to the attainment of predetermined TSR targets over a three-year period from the date of the award. Full vesting and transfer of the shares will not generally occur until the fifth anniversary of the date of award. A benchmark for HSBC Holdings’ TSR, weighted by market capitalisation, was established which takes account of the TSR performance of: (1) a peer group of nine banks weighted by market capitalisation which were considered most relevant to HSBC in terms of size and international scope. For performance periods up to and including the one beginning in 2003, this group comprised ABN AMRO Holding N.V., The Bank of East Asia, Limited, Citigroup Inc., Deutsche Bank AG, JPMorgan Chase & Co., Lloyds TSB Group plc, Mitsubishi Tokyo Financial Group Inc., Oversea-Chinese Banking Corporation Limited and Standard Chartered PLC. To be more relevant to HSBC in terms of size and international scope, this peer group was amended for conditional awards made in 2004 by the replacement of Lloyds TSB Group plc, Oversea-Chinese Banking Corporation Ltd., Mitsubishi Tokyo Financial Group Inc. and The Bank of East Asia, Limited with Bank of America Corporation, The Royal Bank of Scotland Group plc, Banco Santander Central Hispano S.A. and UBS AG; (2) the five largest banks from each of the US, the UK, continental Europe and the Far East, other than any within (1) above, weighted by market capitalisation; and (3) the banking sector of the Morgan Stanley Capital International World Index, excluding any within (1) or (2) above, weighted by market capitalisation. By combining the weighted average TSR for each of the above three groups and weighting that average so that 50 per cent is applied to (1), 25 per cent is applied to (2) and 25 per cent is applied to (3), a single TSR benchmark for market comparison was determined. The benchmark was chosen to reward the delivery of sustained financial growth of HSBC Holdings and to align the interests of participants with those of shareholders. The extent to which each award will vest will be determined by reference to HSBC Holdings’ TSR measured against the TSR benchmark. If HSBC Holdings’ TSR over the performance period exceeds the benchmark TSR, awards with a value, at the date of grant, of up to 100 per cent of the individual’s earnings (base salary and bonus in respect of the previous performance year), will vest. For higher value awards, the greater of 50 per cent of the award or the number of shares equating at the date of grant to 100 per cent of the individual’s earnings, will vest at this level of performance. If HSBC Holdings’ TSR over the performance period places it within the upper quartile of the ranked list of the banks comprising the benchmark, these higher value awards will vest in full. For performance between the median and the upper quartile, vesting will be on a straight-line basis. If the upper quartile performance level is achieved at the third anniversary of the date of award then an additional award equal to 20 per cent of the initial Performance Share award will be made and will vest at the same time as the original award to which it relates.
1 Includes additional shares arising from scrip dividends. 2 The performance tests set out above were met in 2004 and the shares have vested. At the date of vesting, 13 March 2006, the market
value per share was £9.925. The market value per share at the date of the award, 12 March 2001, was £8.62. 3 Retired as a Director on 26 May 2006. The awards held at the date of retirement that had passed the performance condition set out
above vested immediately. Consequently, the 2002 awards were released to Sir John Bond on 14 June 2006 when the market value per share was £9.31 and to A W Jebson on 30 June 2006 when the market value per share was £9.515. The market value per share at the date of the award, 8 March 2002, was £8.34.
4 In line with the previous practice for executives who had worked significantly beyond retirement age, and where the awards had passed the performance condition at the time of originally planned retirement, the Remuneration Committee agreed that the Performance Share awards held by Sir John Bond at retirement should vest in full without time prorating. Consequently, the 2003 award vested on 14 June 2006 when the market value per share was £9.31. The 2004 award vested in two tranches: the first on 16 June 2006 (200,000 shares) when the market value per share was £9.37; and the second on 31 July 2006 (73,058 shares) when the market value per share was £9.71. The market values per share at the dates of the awards, 5 March 2003 and 4 March 2004, were £6.70 and £8.515 respectively.
5 Interests at date of retirement as a Director (26 May 2006).
On behalf of the Board 5 March 2007
Sir Mark Moody-Stuart, Chairman of Remuneration Committee
Related Documents