Services Singapore July 24, 2021 THIS REPORT HAS BEEN PREPARED BY MAYBANK KIM ENG RESEARCH SEE PAGE 17 FOR IMPORTANT DISCLOSURES AND ANALYST CERTIFICATIONS Co. Reg No: 198700034E MICA (P) : 099/03/2012 Tear Sheet Insert Eric Ong [email protected] (65) 6231 5924 HRnetGroup Ltd (HRNET SP) You're Hired Leading Asia-based recruitment firm; initiate BUY HRnetGroup (HRnet) is one of the largest Asia Pacific-based recruitment companies outside Japan operating in 13 Asian cities and serving more than 3,000 clients across 23 industry segments. We are initiating coverage on HRnet with a BUY and TP of SGD0.99, pegged at 18x FY22E P/E. This implies a slight premium to global peers’ average, which is justifiable given its more superior ROE and a strong net cash position of SGD332m (or 42% of its market capitalisation). At current level, the stock is still trading at an undemanding valuation of 9x (ex-cash) FY21E P/E. Twin engines of complementary businesses We like the Group’s synergistic and balanced business model that is supported by two complementary businesses. Its flexible staffing business provides a relatively stable and steady revenue stream during economic downturns, while the professional recruitment business generally performs well during periods of economic expansion. In our view, the provision of both services allows HRnet to be resilient through economic cycles, while offering comprehensive recruitment solutions to its highly- diversified customer base (FY20: top ten customers were 22% of revenues). Proxy to improving employment outlook We see HRnet as a good proxy for an impending recovery in labour markets, underpinned by: 1) improving economic indicators; 2) positive hiring sentiment by employers; as well as 3) further reopening due to mass vaccination across the regions. In FY20, Singapore accounted for 72% of revenue and 54.5% of gross profit. We think North Asia could gradually become a bigger contributor going forward, as the group builds on its presence there via the expansion of existing brands and potential M&As. Cash-generative, asset-light business model The Group’s business is highly cash generative, being backed by an asset- light model and flexible cost base, the latter per unique remuneration structure via profit sharing incentive and productive salesforce (defined as consultants who achieve gross profit of 3x his/her payroll costs). Moreover, management is also ramping up its investments in technology such as digital staffing platform to further improve productivity, as well as deliver a better product and enhance the user experience of its clients. Share Price SGD 0.78 12m Price Target SGD 0.99 (+28%) BUY Company Description Statistics 52w high/low (SGD) 3m avg turnover (USDm) Free float (%) Issued shares (m) Market capitalisation Major shareholders: 77.0% 2.5% 1.3% 1,003 0.4 HRnetGroup provides personnel recruitment and human resource related services under two key segments: Professional Recruitment and Flexible Staffing. Simco Global Ltd. Fidelity Management & Research Co. LLC Vanda 1 Investments Pte Ltd. 0.80/0.44 19.6 SGD777.1M USD572M Price Performance 80 85 90 95 100 105 110 115 120 125 0.40 0.45 0.50 0.55 0.60 0.65 0.70 0.75 0.80 0.85 Jul-19 Oct-19 Jan-20 Apr-20 Jul-20 Oct-20 Jan-21 Apr-21 HRnetGroup Ltd - (LHS, SGD) HRnetGroup Ltd / Straits Times Index - (RHS, %) -1M -3M -12M Absolute (%) 13 17 60 Relative to index (%) 13 19 33 Source: FactSet FYE Dec (SGD m) FY19A FY20A FY21E FY22E FY23E Revenue 423 433 466 492 510 EBITDA 81 71 75 82 88 Core net profit 52 47 50 55 60 Core EPS (cts) 5.1 4.7 5.0 5.5 6.0 Core EPS growth (%) 7.4 (8.9) 7.3 9.7 8.9 Net DPS (cts) 2.8 2.5 2.7 2.9 3.2 Core P/E (x) 12.2 11.7 15.5 14.1 12.9 P/BV (x) 1.9 1.6 2.2 2.0 1.9 Net dividend yield (%) 4.5 4.6 3.4 3.8 4.1 ROAE (%) 15.5 14.1 14.6 15.0 15.2 ROAA (%) 12.5 10.8 10.8 11.3 11.6 EV/EBITDA (x) 4.7 3.2 5.8 5.1 4.4 Net gearing (%) (incl perps) net cash net cash net cash net cash net cash Consensus net profit - - 57 63 67 MKE vs. Consensus (%) - - (11.7) (12.0) (10.7)

Welcome message from author
This document is posted to help you gain knowledge. Please leave a comment to let me know what you think about it! Share it to your friends and learn new things together.
Transcript
Serv
ices
Sin
gapore
0.78
July 24, 2021
THIS REPORT HAS BEEN PREPARED BY MAYBANK KIM ENG RESEARCH
SEE PAGE 17 FOR IMPORTANT DISCLOSURES AND ANALYST CERTIFICATIONS
Co. Reg No: 198700034E MICA (P) : 099/03/2012
Tear Sheet Insert
Eric Ong [email protected] (65) 6231 5924
HRnetGroup Ltd (HRNET SP)
You're Hired
Leading Asia-based recruitment firm; initiate BUY
HRnetGroup (HRnet) is one of the largest Asia Pacific-based recruitment
companies outside Japan operating in 13 Asian cities and serving more than
3,000 clients across 23 industry segments. We are initiating coverage on
HRnet with a BUY and TP of SGD0.99, pegged at 18x FY22E P/E. This
implies a slight premium to global peers’ average, which is justifiable
given its more superior ROE and a strong net cash position of SGD332m (or
42% of its market capitalisation). At current level, the stock is still trading
at an undemanding valuation of 9x (ex-cash) FY21E P/E.
Twin engines of complementary businesses
We like the Group’s synergistic and balanced business model that is
supported by two complementary businesses. Its flexible staffing business
provides a relatively stable and steady revenue stream during economic
downturns, while the professional recruitment business generally
performs well during periods of economic expansion. In our view, the
provision of both services allows HRnet to be resilient through economic
cycles, while offering comprehensive recruitment solutions to its highly-
diversified customer base (FY20: top ten customers were 22% of revenues).
Proxy to improving employment outlook
We see HRnet as a good proxy for an impending recovery in labour markets,
underpinned by: 1) improving economic indicators; 2) positive hiring
sentiment by employers; as well as 3) further reopening due to mass
vaccination across the regions. In FY20, Singapore accounted for 72% of
revenue and 54.5% of gross profit. We think North Asia could gradually
become a bigger contributor going forward, as the group builds on its
presence there via the expansion of existing brands and potential M&As.
Cash-generative, asset-light business model
The Group’s business is highly cash generative, being backed by an asset-
light model and flexible cost base, the latter per unique remuneration
structure via profit sharing incentive and productive salesforce (defined
as consultants who achieve gross profit of 3x his/her payroll costs).
Moreover, management is also ramping up its investments in technology
such as digital staffing platform to further improve productivity, as well as
deliver a better product and enhance the user experience of its clients.
Share Price SGD 0.78
12m Price Target SGD 0.99 (+28%)
BUY
Company Description
Statistics
52w high/low (SGD)
3m avg turnover (USDm)
Free float (%)
Issued shares (m)
Market capitalisation
Major shareholders:
77.0%
2.5%
1.3%
1,003
0.4
HRnetGroup provides personnel recruitment and
human resource related services under two key
segments: Professional Recruitment and Flexible
Staffing.
Simco Global Ltd.
Fidelity Management & Research Co. LLC
Vanda 1 Investments Pte Ltd.
0.80/0.44
19.6
SGD777.1M
USD572M
Price Performance
80
85
90
95
100
105
110
115
120
125
0.40
0.45
0.50
0.55
0.60
0.65
0.70
0.75
0.80
0.85
Jul-19 Oct-19 Jan-20 Apr-20 Jul-20 Oct-20 Jan-21 Apr-21
HRnetGroup Ltd - (LHS, SGD) HRnetGroup Ltd / Straits Times Index - (RHS, %)
-1M -3M -12M
Absolute (%) 13 17 60
Relative to index (%) 13 19 33
Source: FactSet
FYE Dec (SGD m) FY19A FY20A FY21E FY22E FY23E
Revenue 423 433 466 492 510
EBITDA 81 71 75 82 88
Core net profit 52 47 50 55 60
Core EPS (cts) 5.1 4.7 5.0 5.5 6.0
Core EPS growth (%) 7.4 (8.9) 7.3 9.7 8.9
Net DPS (cts) 2.8 2.5 2.7 2.9 3.2
Core P/E (x) 12.2 11.7 15.5 14.1 12.9
P/BV (x) 1.9 1.6 2.2 2.0 1.9
Net dividend yield (%) 4.5 4.6 3.4 3.8 4.1
ROAE (%) 15.5 14.1 14.6 15.0 15.2
ROAA (%) 12.5 10.8 10.8 11.3 11.6
EV/EBITDA (x) 4.7 3.2 5.8 5.1 4.4
Net gearing (%) (incl perps) net cash net cash net cash net cash net cash
Consensus net profit - - 57 63 67
MKE vs. Consensus (%) - - (11.7) (12.0) (10.7)
July 24, 2021 2
HRnetGroup Ltd
Value Proposition
Balanced business model with professional recruitment and
flexible staffing segments that are complementary through
economic cycles and help customer retention.
Geographical diversification and multi-disciplinary focus
help it serve clients with varied staffing needs and with
multi-country presence in APAC.
Has 3,000+ clients, including several Fortune 500 companies
operating in the region.
Co-ownership is a key advantage in staff retention and
motivation, which makes up about 25% of its permanent staff
base in FY20.
According to Frost & Sullivan, HRnet is the largest
recruitment player in Singapore in terms of number of
licensed consultants and revenue. Highly diversified customer base
Source: Company
Price Drivers
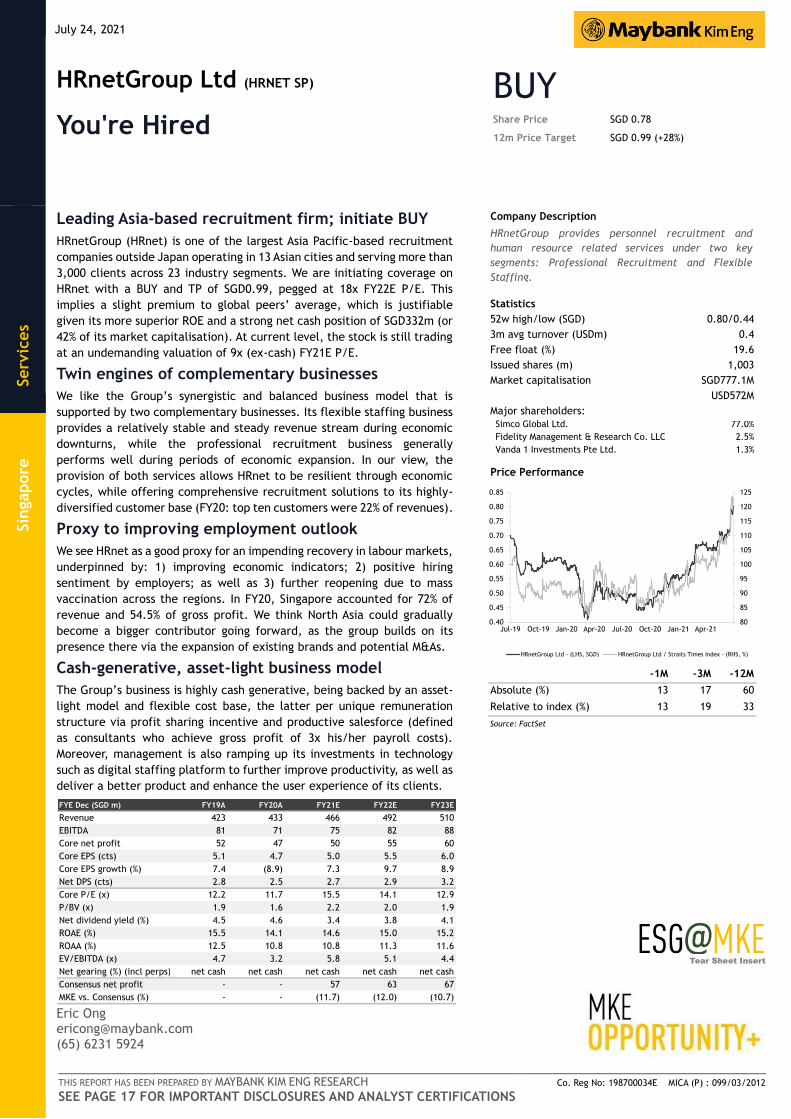
Historical share price trend
Source: Company, Maybank Kim Eng
1. On 2 Aug '18. HRnet acquired 100% stake in Career
Personnel for HKD800k, which is in the business of flexible
staffing and provides temp and contract personnel
predominantly to HK government agencies.
2. On 21 Mar '19. the Group incorporates RecruitFirst in
Taiwan to operate the business of flexible staffing and
human resource outsourcing.
3. On 2 Aug '19, it paid GBP21m for a 25% interest in Staffline
– a leading workforce recruitment and training
organisation providing services mainly in the UK and
Ireland, to both government/commercial customers.
4. On 17 Jan '20, HRnet set up a JV, PT Recruit First Indonesia
(RFI), to provide manpower services such as domestic
manpower selection, outsourcing, and placement and
other management consultancy service.
Financial Metrics
Two complementary businesses provide margin resilience in
economic and recruitment cycles, as seen by relatively
stable margins over past the three and a half years.
Commands decent ROE of 14-15% despite its significantly
ungeared balance sheet.
Low capex intensity with strong free cashflow generation.
Does not require high working capital commitments as
flexible staffing does not involve talent ‘inventory’.
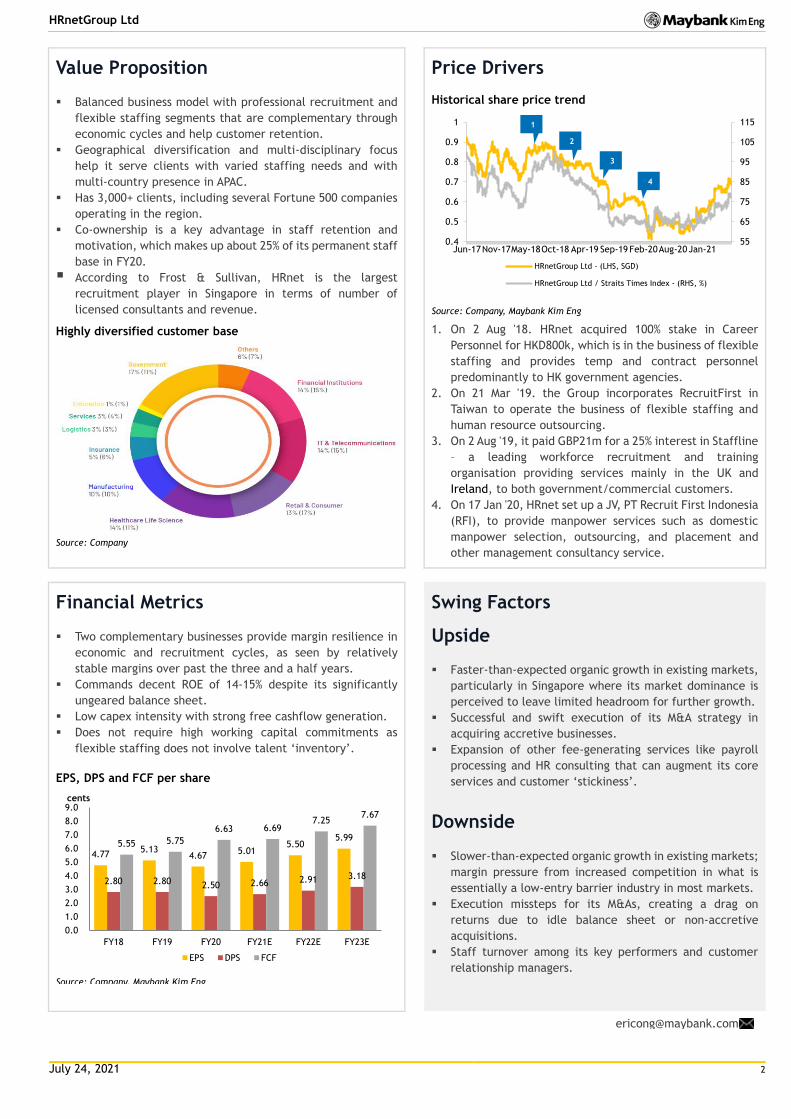
EPS, DPS and FCF per share
Source: Company, Maybank Kim Eng
Swing Factors
Upside
Faster-than-expected organic growth in existing markets,
particularly in Singapore where its market dominance is
perceived to leave limited headroom for further growth.
Successful and swift execution of its M&A strategy in
acquiring accretive businesses.
Expansion of other fee-generating services like payroll
processing and HR consulting that can augment its core
services and customer ‘stickiness’.
Downside
Slower-than-expected organic growth in existing markets;
margin pressure from increased competition in what is
essentially a low-entry barrier industry in most markets.
Execution missteps for its M&As, creating a drag on
returns due to idle balance sheet or non-accretive
acquisitions.
Staff turnover among its key performers and customer
relationship managers.
55
65
75
85
95
105
115
0.4
0.5
0.6
0.7
0.8
0.9
1
Jun-17Nov-17May-18Oct-18 Apr-19 Sep-19 Feb-20Aug-20 Jan-21
HRnetGroup Ltd - (LHS, SGD)
HRnetGroup Ltd / Straits Times Index - (RHS, %)
4.775.13
4.675.01
5.505.99
2.80 2.80 2.50 2.66 2.91 3.18
5.55 5.75
6.63 6.697.25
7.67
0.0
1.0
2.0
3.0
4.0
5.0
6.0
7.0
8.0
9.0
FY18 FY19 FY20 FY21E FY22E FY23E
cents
EPS DPS FCF
1
2
3
4
July 24, 2021 3
HRnetGroup Ltd
Risk Rating & Score¹ NOT RATED
Score Momentum² na
Last Updated na
Controversy Score³ (Updated: na)
na
Business Model & Industry Issues
As a recruitment firm, the Group’s key asset is human capital and hence, it places the development, engagement and retention
of its own staff high on the list of priorities. By enabling their growth and progression, this also helps to cultivate a highly driven
and effective workforce.
The HR industry is also increasingly going digital. These trends lean towards a need for reassessment of various aspects of its
business ranging from internal areas such as its own benefits management, working arrangements, and training & education for
its workforce, to external-facing elements such as methods of outreach to clientele and candidates, and helping to bridge the
gap between the employees and employers.
Its unique Co-Ownership plans further provide the opportunity for high-performers to unleash the entrepreneurship spirit in
them, invest in the Group, and/or a new venture and share in its success as well as its risk of failure.
Material E issues
Over the past 1.5 years, remote working or work-from-home
has become the standard for many amid the lingering
COVID-19 pandemic. In a way, this is also better for the
environment.
With fewer people in the office at any one time, the group
may find that they can afford to downsize, cutting down on
office space and energy usage. It will also mean a reduction
in people on the roads driving in to work.
Key G metrics and issues
The board consists of six directors, of which half (3) are
independent and the rest are Sim family members i.e., Mr
Sim Yong Siang, Mr Sim Joo Siang and Ms. Adeline Sim.
The nominating, audit and remuneration committees are
chaired by independent directors.
None of the independent directors have served on the
board beyond nine years from the date of his or her first
appointment.
SIMCO Ltd’s (controlled by the Sim family) deemed stake
in the company is 77.7%.
Key management/ directors’ compensation accounted for
3.8%/1.8% of total employee compensation in 2020.
External auditor is Deloitt & Touche LLP (appointed on 12
Aug ’20).
Recruitment is a heavily regulated industry with the
Ministry of Manpower leading the regulations. Non-
compliance will lead to costly fines and reputational
damage.
It has therefore put in place a whistle-blowing policy and
channels for employees to report any suspicious and non-
compliant practices.
In 2020, there were no incidents of corruption or non-
compliance with laws or regulations resulting in significant
fines and non-monetary sanctions.
Material S issues
Whenever HRnet starts an overseas business unit, it always
seeks to localise leadership roles. This allows the group to
kickstart operations as a local business with a staff
population that is acutely aware of the nuances and
intricacies involved when serving the domestic market.
It has also committed to the UN’s Sustainable Development
Goals, in particular with regard to promoting sustainable
economic growth, decent work for all, and reducing
inequalities.
¹Risk Rating & Score - derived by Sustainalytics and assesses the company’s exposure to unmanaged ESG risks. Scores range between 0 - 50 in order of increasing severity with low/high scores & ratings representing negligible/significant risk to the company’s enterprise value, respectively, from ESG-driven financial impacts. ²Score Momentum - indicates changes to the company's score since the last update – a negative integer indicates a company’s improving risk score; a positive integer indicates a deterioration. ³Controversy Score - reported periodically by Sustainalytics in the event of material ESG-related incident(s), with the impact severity scores of these events ranging from Category 0-5 (0 - no reports; 1 - negligible risks; ...; 5 - poses serious risks & indicative of potential structural deficiencies at the company).
July 24, 2021 4
HRnetGroup Ltd
Focus charts
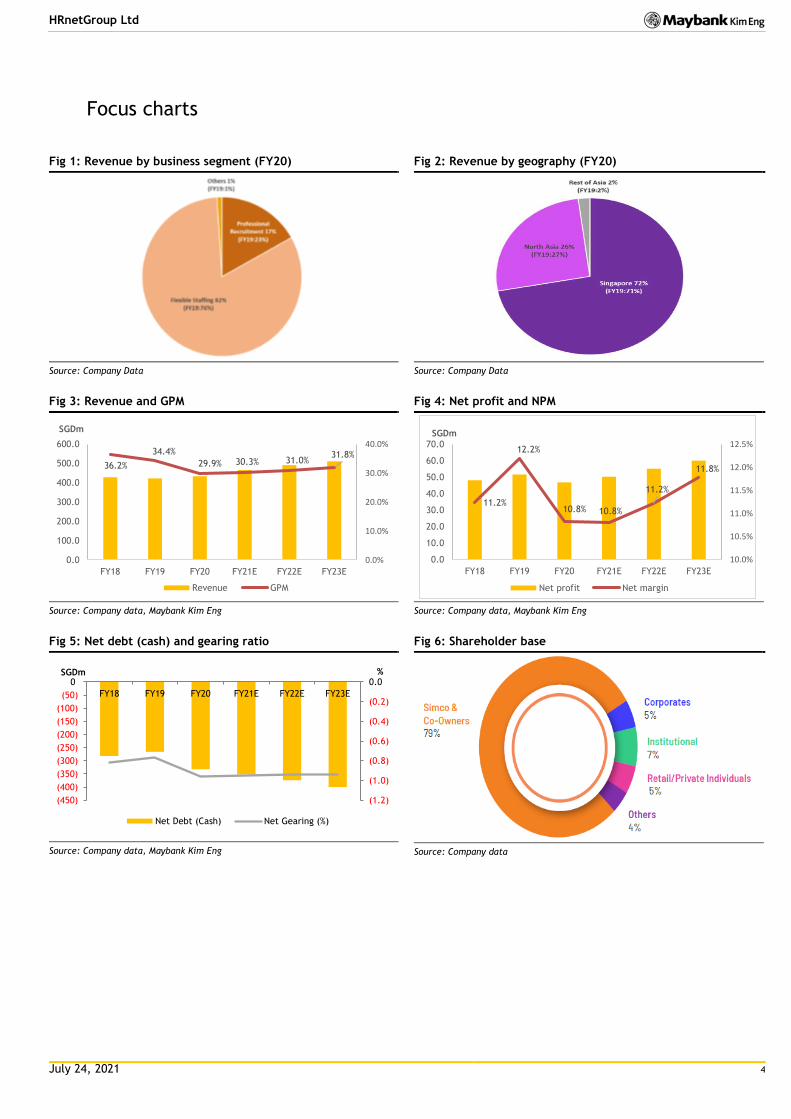
Fig 1: Revenue by business segment (FY20)
Source: Company Data
Fig 2: Revenue by geography (FY20)
Source: Company Data
Fig 3: Revenue and GPM
Source: Company data, Maybank Kim Eng
Fig 4: Net profit and NPM
Source: Company data, Maybank Kim Eng
Fig 5: Net debt (cash) and gearing ratio
Source: Company data, Maybank Kim Eng
Fig 6: Shareholder base
Source: Company data
36.2%
34.4%
29.9% 30.3% 31.0%31.8%
0.0%
10.0%
20.0%
30.0%
40.0%
0.0
100.0
200.0
300.0
400.0
500.0
600.0
FY18 FY19 FY20 FY21E FY22E FY23E
SGDm
Revenue GPM
11.2%
12.2%
10.8% 10.8%
11.2%
11.8%
10.0%
10.5%
11.0%
11.5%
12.0%
12.5%
0.0
10.0
20.0
30.0
40.0
50.0
60.0
70.0
FY18 FY19 FY20 FY21E FY22E FY23E
SGDm
Net profit Net margin
(1.2)
(1.0)
(0.8)
(0.6)
(0.4)
(0.2)
0.0
(450)
(400)
(350)
(300)
(250)
(200)
(150)
(100)
(50)
0
FY18 FY19 FY20 FY21E FY22E FY23E
%SGDm
Net Debt (Cash) Net Gearing (%)
July 24, 2021 5
HRnetGroup Ltd
1. Investment thesis
1.1 Growth powered by twin engines of complementary
businesses
HRnet’s strong growth has been powered by its twin engines of
complementary businesses, namely professional recruitment and flexible
staffing. While these businesses are different, they are highly
complementary and have resulted in a synergistic and balanced business
model.
First, the combination of providing temporary and permanent recruitment
solutions allows the Group to foster deep relationships with its corporate
customers as it is able to provide comprehensive recruitment and staffing
solutions across junior to senior positions.
Second, its flexible staffing business provides HRnet with a relatively stable
and steady revenue stream in an economic downturn as businesses prefer
to keep costs variable to respond to uncertain environment. On the other
hand, professional recruitment business generally performs well during
periods of economic growth as customers are more willing to increase
permanent headcount to meet business expansion plans and needs.
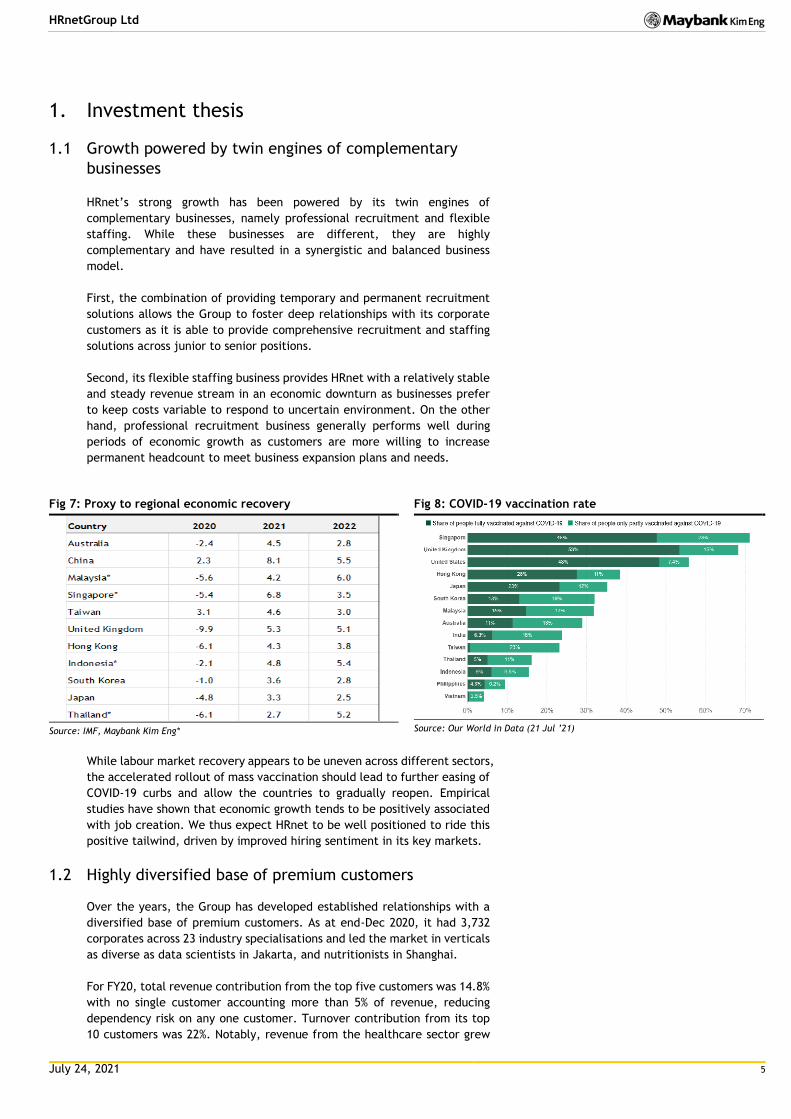
Fig 7: Proxy to regional economic recovery
Source: IMF, Maybank Kim Eng*
Fig 8: COVID-19 vaccination rate
Source: Our World in Data (21 Jul ’21)
While labour market recovery appears to be uneven across different sectors,
the accelerated rollout of mass vaccination should lead to further easing of
COVID-19 curbs and allow the countries to gradually reopen. Empirical
studies have shown that economic growth tends to be positively associated
with job creation. We thus expect HRnet to be well positioned to ride this
positive tailwind, driven by improved hiring sentiment in its key markets.
1.2 Highly diversified base of premium customers
Over the years, the Group has developed established relationships with a
diversified base of premium customers. As at end-Dec 2020, it had 3,732
corporates across 23 industry specialisations and led the market in verticals
as diverse as data scientists in Jakarta, and nutritionists in Shanghai.
For FY20, total revenue contribution from the top five customers was 14.8%
with no single customer accounting more than 5% of revenue, reducing
dependency risk on any one customer. Turnover contribution from its top
10 customers was 22%. Notably, revenue from the healthcare sector grew
July 24, 2021 6
HRnetGroup Ltd
by 28% to constitute 14.4% (2019: 11.5%) of total revenue, while the
government sector grew by 68.2% to constitute 17.3% (2019: 10.5%).
Fig 9: Diversified base of customers
Source: Company
As can be seem from Fig 9, the top five clients have been its customers
since early 2000. The Group believes this is a testament to the quality of
its services and ability to adapt to its customers’ changing needs even as
their businesses evolve. The diversification across its customer base reduces
over-dependency risk, ensures varied revenue streams, and reduces its
vulnerability to sector and geography-specific risks.
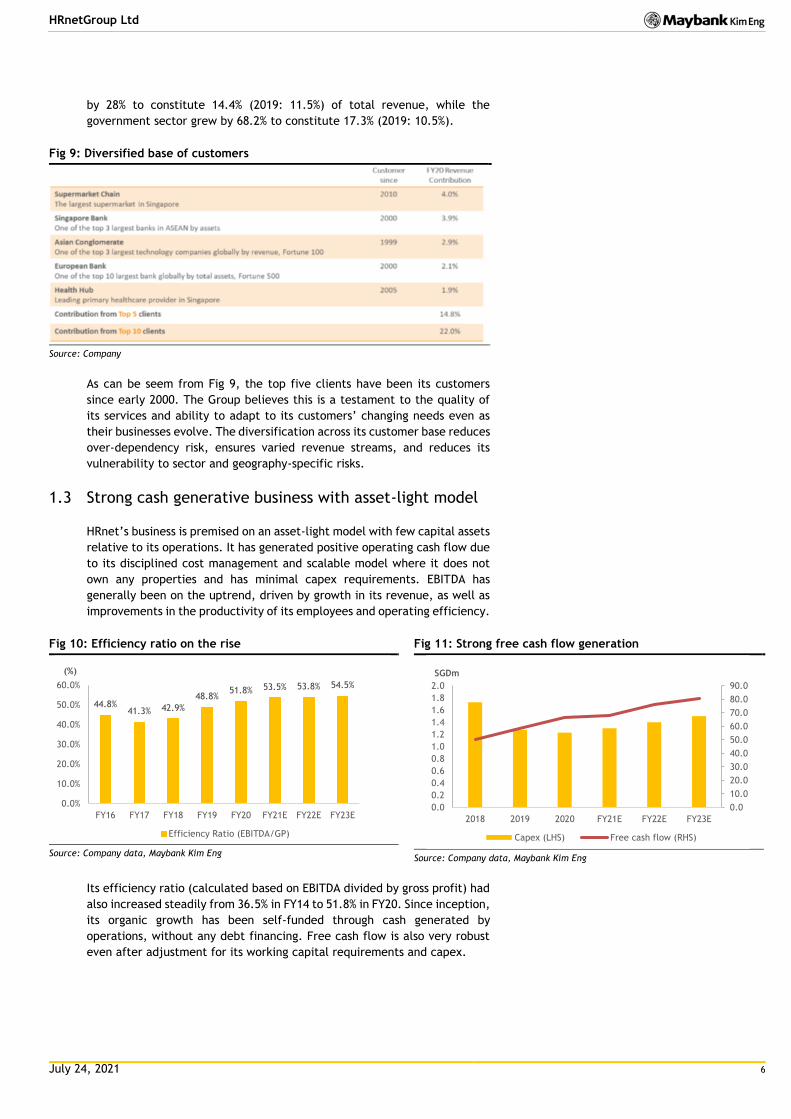
1.3 Strong cash generative business with asset-light model
HRnet’s business is premised on an asset-light model with few capital assets
relative to its operations. It has generated positive operating cash flow due
to its disciplined cost management and scalable model where it does not
own any properties and has minimal capex requirements. EBITDA has
generally been on the uptrend, driven by growth in its revenue, as well as
improvements in the productivity of its employees and operating efficiency.
Fig 10: Efficiency ratio on the rise
Source: Company data, Maybank Kim Eng
Fig 11: Strong free cash flow generation
Source: Company data, Maybank Kim Eng
Its efficiency ratio (calculated based on EBITDA divided by gross profit) had
also increased steadily from 36.5% in FY14 to 51.8% in FY20. Since inception,
its organic growth has been self-funded through cash generated by
operations, without any debt financing. Free cash flow is also very robust
even after adjustment for its working capital requirements and capex.
44.8%41.3% 42.9%
48.8%51.8% 53.5% 53.8% 54.5%
0.0%
10.0%
20.0%
30.0%
40.0%
50.0%
60.0%
FY16 FY17 FY18 FY19 FY20 FY21E FY22E FY23E
(%)
Efficiency Ratio (EBITDA/GP)
0.0
10.0
20.0
30.0
40.0
50.0
60.0
70.0
80.0
90.0
0.0
0.2
0.4
0.6
0.8
1.0
1.2
1.4
1.6
1.8
2.0
2018 2019 2020 FY21E FY22E FY23E
SGDm
Capex (LHS) Free cash flow (RHS)
July 24, 2021 7
HRnetGroup Ltd
2. Corporate information
HRnet is the largest Asia-based recruitment agency in Asia Pacific
(excluding Japan), as compared to other key players within the professional
recruitment and flexible staffing industry with presence in Asia Pacific. As
of end-Dec 2020, the Group had 264 registered consultants, which makes it
one of the largest agencies in Singapore.
Currently, it operates in 13 Asian growth cities, namely, Singapore (HQ),
Kuala Lumpur, Jakarta, Bangkok, Hong Kong, Taipei, Guangzhou, Shanghai,
Beijing, Shenzhen, Suzhou, Tokyo and Seoul.
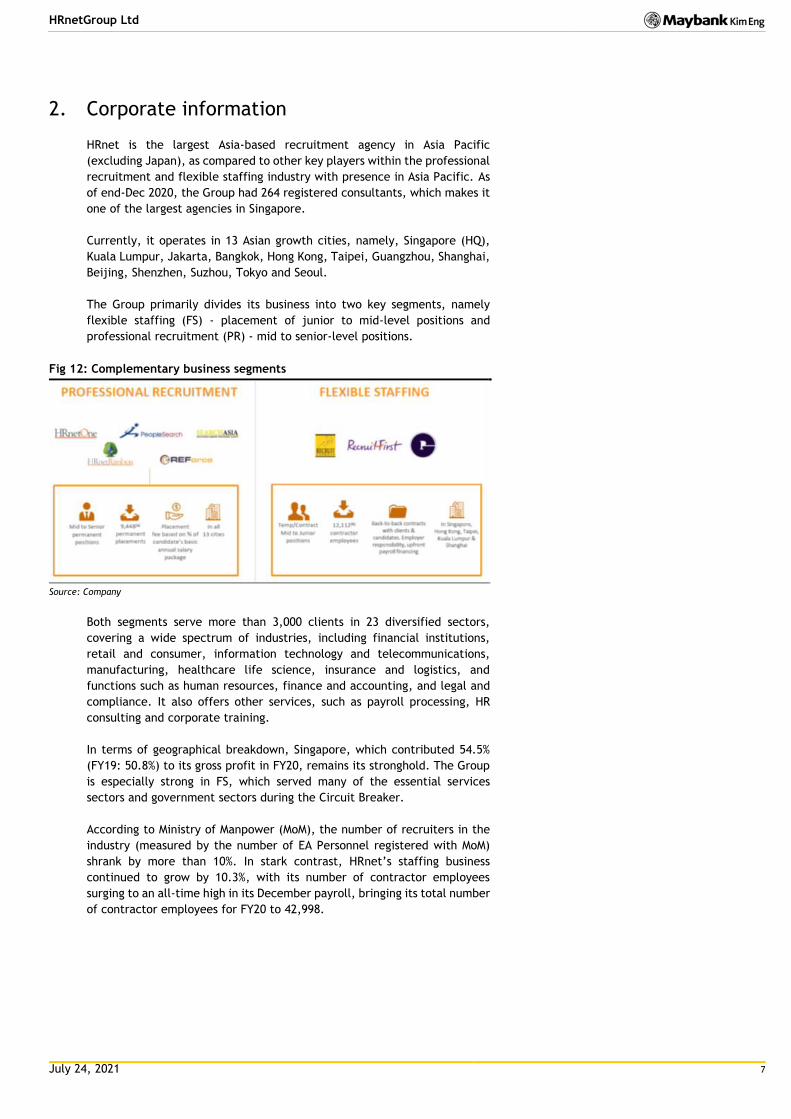
The Group primarily divides its business into two key segments, namely
flexible staffing (FS) - placement of junior to mid-level positions and
professional recruitment (PR) - mid to senior-level positions.
Fig 12: Complementary business segments
Source: Company
Both segments serve more than 3,000 clients in 23 diversified sectors,
covering a wide spectrum of industries, including financial institutions,
retail and consumer, information technology and telecommunications,
manufacturing, healthcare life science, insurance and logistics, and
functions such as human resources, finance and accounting, and legal and
compliance. It also offers other services, such as payroll processing, HR
consulting and corporate training.
In terms of geographical breakdown, Singapore, which contributed 54.5%
(FY19: 50.8%) to its gross profit in FY20, remains its stronghold. The Group
is especially strong in FS, which served many of the essential services
sectors and government sectors during the Circuit Breaker.
According to Ministry of Manpower (MoM), the number of recruiters in the
industry (measured by the number of EA Personnel registered with MoM)
shrank by more than 10%. In stark contrast, HRnet’s staffing business
continued to grow by 10.3%, with its number of contractor employees
surging to an all-time high in its December payroll, bringing its total number
of contractor employees for FY20 to 42,998.
July 24, 2021 8
HRnetGroup Ltd
3. Industry outlook
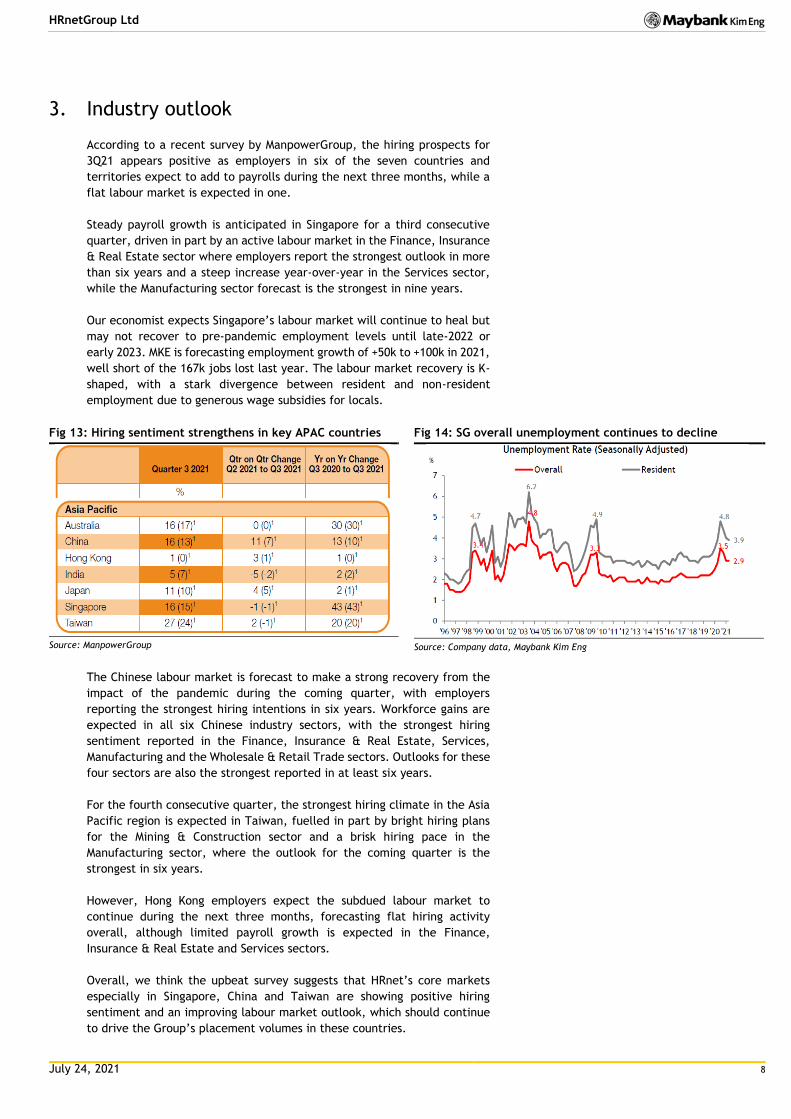
According to a recent survey by ManpowerGroup, the hiring prospects for
3Q21 appears positive as employers in six of the seven countries and
territories expect to add to payrolls during the next three months, while a
flat labour market is expected in one.
Steady payroll growth is anticipated in Singapore for a third consecutive
quarter, driven in part by an active labour market in the Finance, Insurance
& Real Estate sector where employers report the strongest outlook in more
than six years and a steep increase year-over-year in the Services sector,
while the Manufacturing sector forecast is the strongest in nine years.
Our economist expects Singapore’s labour market will continue to heal but
may not recover to pre-pandemic employment levels until late-2022 or
early 2023. MKE is forecasting employment growth of +50k to +100k in 2021,
well short of the 167k jobs lost last year. The labour market recovery is K-
shaped, with a stark divergence between resident and non-resident
employment due to generous wage subsidies for locals.
Fig 13: Hiring sentiment strengthens in key APAC countries
Source: ManpowerGroup
Fig 14: SG overall unemployment continues to decline
Source: Company data, Maybank Kim Eng
The Chinese labour market is forecast to make a strong recovery from the
impact of the pandemic during the coming quarter, with employers
reporting the strongest hiring intentions in six years. Workforce gains are
expected in all six Chinese industry sectors, with the strongest hiring
sentiment reported in the Finance, Insurance & Real Estate, Services,
Manufacturing and the Wholesale & Retail Trade sectors. Outlooks for these
four sectors are also the strongest reported in at least six years.
For the fourth consecutive quarter, the strongest hiring climate in the Asia
Pacific region is expected in Taiwan, fuelled in part by bright hiring plans
for the Mining & Construction sector and a brisk hiring pace in the
Manufacturing sector, where the outlook for the coming quarter is the
strongest in six years.
However, Hong Kong employers expect the subdued labour market to
continue during the next three months, forecasting flat hiring activity
overall, although limited payroll growth is expected in the Finance,
Insurance & Real Estate and Services sectors.
Overall, we think the upbeat survey suggests that HRnet’s core markets
especially in Singapore, China and Taiwan are showing positive hiring
sentiment and an improving labour market outlook, which should continue
to drive the Group’s placement volumes in these countries.
July 24, 2021 9
HRnetGroup Ltd
4. Financial analysis
Despite the ongoing pandemic, we expect HRnet to remain on its growth
trajectory after posting record FY20 revenue. In fact, FS recorded an all-
time high revenue of SGD357.6m (FY19: SGD324.2m), an increase of 10.3%
YoY. With benefit of a full-year operation, the RecruitFirst start-ups of 2019
in Taipei, Kuala Lumpur and Shanghai contributed to 38.4% of the increase
of the FS in 2020. RecruitFirst was also launched in Jakarta in 2020.
However, PR revenue was SGD72.6m (2019: SGD95.9m), a reduction of
24.3% YoY. The number of placements declined by 17.7% YoY to 7,022 (2019:
8,530). This is not surprising as companies typically shied away from taking
on permanent headcount when they are unsure what market demand would
look like during periods of economic uncertainties.
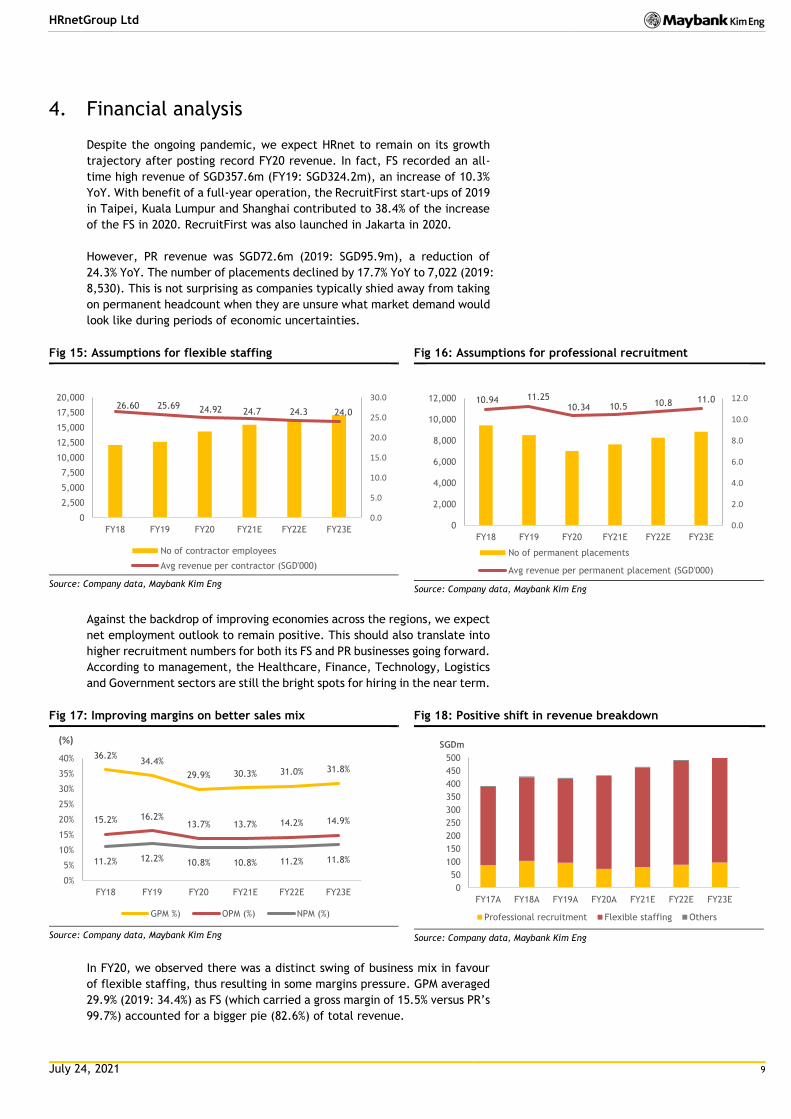
Fig 15: Assumptions for flexible staffing
Source: Company data, Maybank Kim Eng
Fig 16: Assumptions for professional recruitment
Source: Company data, Maybank Kim Eng
Against the backdrop of improving economies across the regions, we expect
net employment outlook to remain positive. This should also translate into
higher recruitment numbers for both its FS and PR businesses going forward.
According to management, the Healthcare, Finance, Technology, Logistics
and Government sectors are still the bright spots for hiring in the near term.
Fig 17: Improving margins on better sales mix
Source: Company data, Maybank Kim Eng
Fig 18: Positive shift in revenue breakdown
Source: Company data, Maybank Kim Eng
In FY20, we observed there was a distinct swing of business mix in favour
of flexible staffing, thus resulting in some margins pressure. GPM averaged
29.9% (2019: 34.4%) as FS (which carried a gross margin of 15.5% versus PR’s
99.7%) accounted for a bigger pie (82.6%) of total revenue.
26.60 25.69 24.92 24.7 24.3 24.0
0.0
5.0
10.0
15.0
20.0
25.0
30.0
0
2,500
5,000
7,500
10,000
12,500
15,000
17,500
20,000
FY18 FY19 FY20 FY21E FY22E FY23E
No of contractor employees
Avg revenue per contractor (SGD'000)
10.94 11.2510.34 10.5 10.8 11.0
0.0
2.0
4.0
6.0
8.0
10.0
12.0
0
2,000
4,000
6,000
8,000
10,000
12,000
FY18 FY19 FY20 FY21E FY22E FY23E
No of permanent placements
Avg revenue per permanent placement (SGD'000)
36.2%34.4%
29.9% 30.3% 31.0% 31.8%
15.2% 16.2%13.7% 13.7% 14.2% 14.9%
11.2% 12.2% 10.8% 10.8% 11.2% 11.8%
0%
5%
10%
15%
20%
25%
30%
35%
40%
FY18 FY19 FY20 FY21E FY22E FY23E
(%)
GPM %) OPM (%) NPM (%)
0
50
100
150
200
250
300
350
400
450
500
FY17A FY18A FY19A FY20A FY21E FY22E FY23E
SGDm
Professional recruitment Flexible staffing Others
July 24, 2021 10
HRnetGroup Ltd
That said, we think profit margins should expand in tandem with better
sales mix and continued tight control of operating expenses. However, this
may be partly offset by a reduction in government subsidies (FY20:
SGD11.7m), which mainly comprised of pandemic-related relief schemes by
various governments of countries that the Group operates in.
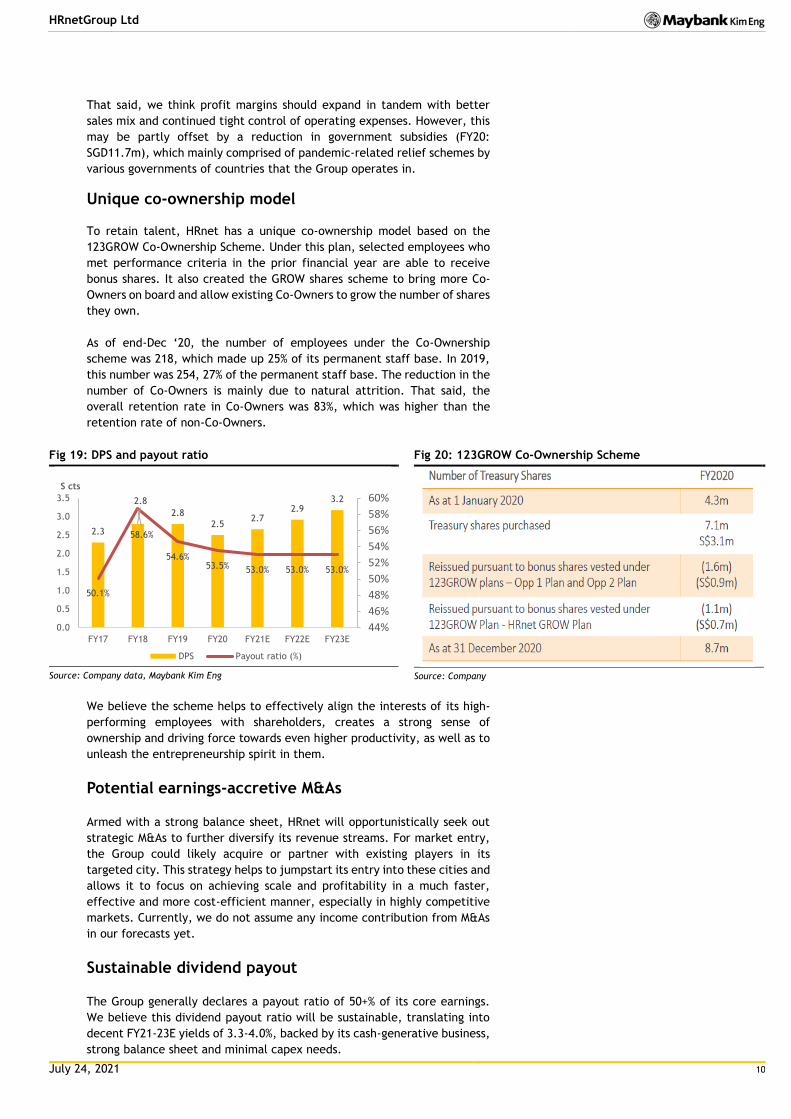
Unique co-ownership model
To retain talent, HRnet has a unique co-ownership model based on the
123GROW Co-Ownership Scheme. Under this plan, selected employees who
met performance criteria in the prior financial year are able to receive
bonus shares. It also created the GROW shares scheme to bring more Co-
Owners on board and allow existing Co-Owners to grow the number of shares
they own.
As of end-Dec ‘20, the number of employees under the Co-Ownership
scheme was 218, which made up 25% of its permanent staff base. In 2019,
this number was 254, 27% of the permanent staff base. The reduction in the
number of Co-Owners is mainly due to natural attrition. That said, the
overall retention rate in Co-Owners was 83%, which was higher than the
retention rate of non-Co-Owners.
Fig 19: DPS and payout ratio
Source: Company data, Maybank Kim Eng
Fig 20: 123GROW Co-Ownership Scheme
Source: Company
We believe the scheme helps to effectively align the interests of its high-
performing employees with shareholders, creates a strong sense of
ownership and driving force towards even higher productivity, as well as to
unleash the entrepreneurship spirit in them.
Potential earnings-accretive M&As
Armed with a strong balance sheet, HRnet will opportunistically seek out
strategic M&As to further diversify its revenue streams. For market entry,
the Group could likely acquire or partner with existing players in its
targeted city. This strategy helps to jumpstart its entry into these cities and
allows it to focus on achieving scale and profitability in a much faster,
effective and more cost-efficient manner, especially in highly competitive
markets. Currently, we do not assume any income contribution from M&As
in our forecasts yet.
Sustainable dividend payout
The Group generally declares a payout ratio of 50+% of its core earnings.
We believe this dividend payout ratio will be sustainable, translating into
decent FY21-23E yields of 3.3-4.0%, backed by its cash-generative business,
strong balance sheet and minimal capex needs.
2.3
2.8
2.8
2.52.7
2.93.2
50.1%
58.6%
54.6%53.5% 53.0% 53.0% 53.0%
44%
46%
48%
50%
52%
54%
56%
58%
60%
0.0
0.5
1.0
1.5
2.0
2.5
3.0
3.5
FY17 FY18 FY19 FY20 FY21E FY22E FY23E
S cts
DPS Payout ratio (%)
July 24, 2021 11
HRnetGroup Ltd
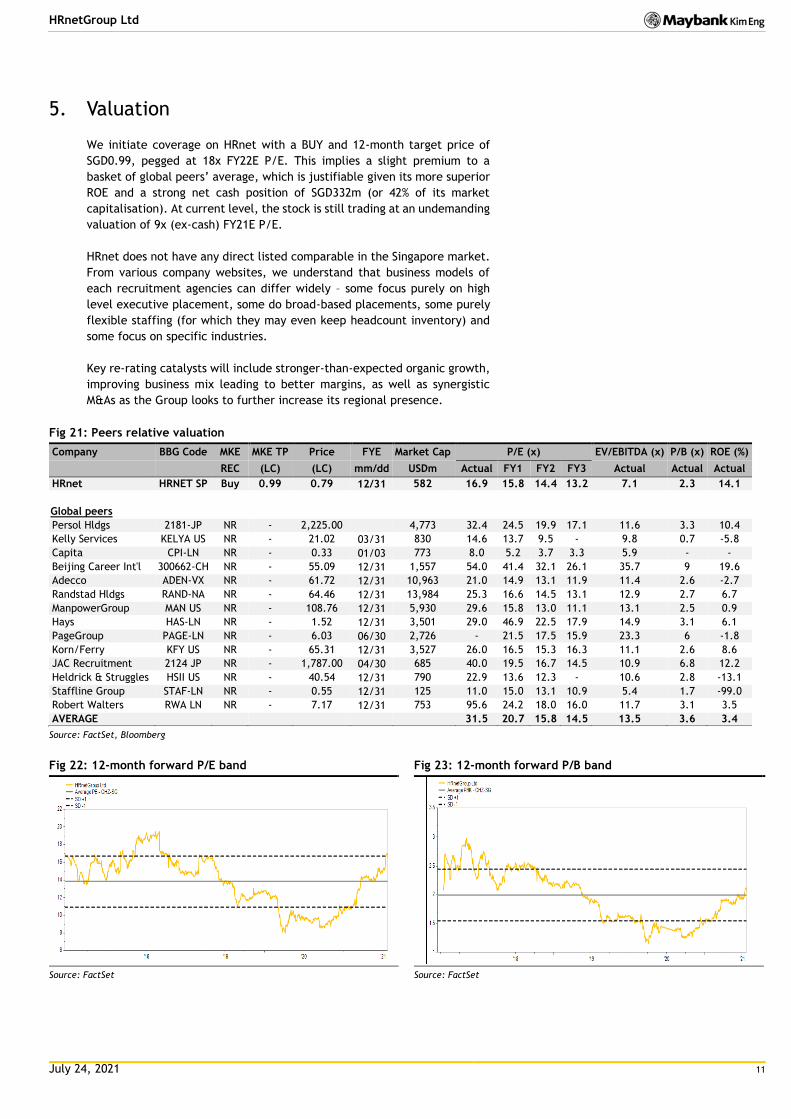
5. Valuation
We initiate coverage on HRnet with a BUY and 12-month target price of
SGD0.99, pegged at 18x FY22E P/E. This implies a slight premium to a
basket of global peers’ average, which is justifiable given its more superior
ROE and a strong net cash position of SGD332m (or 42% of its market
capitalisation). At current level, the stock is still trading at an undemanding
valuation of 9x (ex-cash) FY21E P/E.
HRnet does not have any direct listed comparable in the Singapore market.
From various company websites, we understand that business models of
each recruitment agencies can differ widely – some focus purely on high
level executive placement, some do broad-based placements, some purely
flexible staffing (for which they may even keep headcount inventory) and
some focus on specific industries.
Key re-rating catalysts will include stronger-than-expected organic growth,
improving business mix leading to better margins, as well as synergistic
M&As as the Group looks to further increase its regional presence.
Fig 21: Peers relative valuation
Company BBG Code MKE MKE TP Price FYE Market Cap P/E (x) EV/EBITDA (x) P/B (x) ROE (%)
REC (LC) (LC) mm/dd USDm Actual FY1 FY2 FY3 Actual Actual Actual
HRnet HRNET SP Buy 0.99 0.79 12/31 582 16.9 15.8 14.4 13.2 7.1 2.3 14.1
Global peers
Persol Hldgs 2181-JP NR - 2,225.00 4,773 32.4 24.5 19.9 17.1 11.6 3.3 10.4
Kelly Services KELYA US NR - 21.02 03/31 830 14.6 13.7 9.5 - 9.8 0.7 -5.8
Capita CPI-LN NR - 0.33 01/03 773 8.0 5.2 3.7 3.3 5.9 - -
Beijing Career Int'l 300662-CH NR - 55.09 12/31 1,557 54.0 41.4 32.1 26.1 35.7 9 19.6
Adecco ADEN-VX NR - 61.72 12/31 10,963 21.0 14.9 13.1 11.9 11.4 2.6 -2.7
Randstad Hldgs RAND-NA NR - 64.46 12/31 13,984 25.3 16.6 14.5 13.1 12.9 2.7 6.7
ManpowerGroup MAN US NR - 108.76 12/31 5,930 29.6 15.8 13.0 11.1 13.1 2.5 0.9
Hays HAS-LN NR - 1.52 12/31 3,501 29.0 46.9 22.5 17.9 14.9 3.1 6.1
PageGroup PAGE-LN NR - 6.03 06/30 2,726 - 21.5 17.5 15.9 23.3 6 -1.8
Korn/Ferry KFY US NR - 65.31 12/31 3,527 26.0 16.5 15.3 16.3 11.1 2.6 8.6
JAC Recruitment 2124 JP NR - 1,787.00 04/30 685 40.0 19.5 16.7 14.5 10.9 6.8 12.2
Heldrick & Struggles HSII US NR - 40.54 12/31 790 22.9 13.6 12.3 - 10.6 2.8 -13.1
Staffline Group STAF-LN NR - 0.55 12/31 125 11.0 15.0 13.1 10.9 5.4 1.7 -99.0
Robert Walters RWA LN NR - 7.17 12/31 753 95.6 24.2 18.0 16.0 11.7 3.1 3.5
AVERAGE 31.5 20.7 15.8 14.5 13.5 3.6 3.4
Source: FactSet, Bloomberg
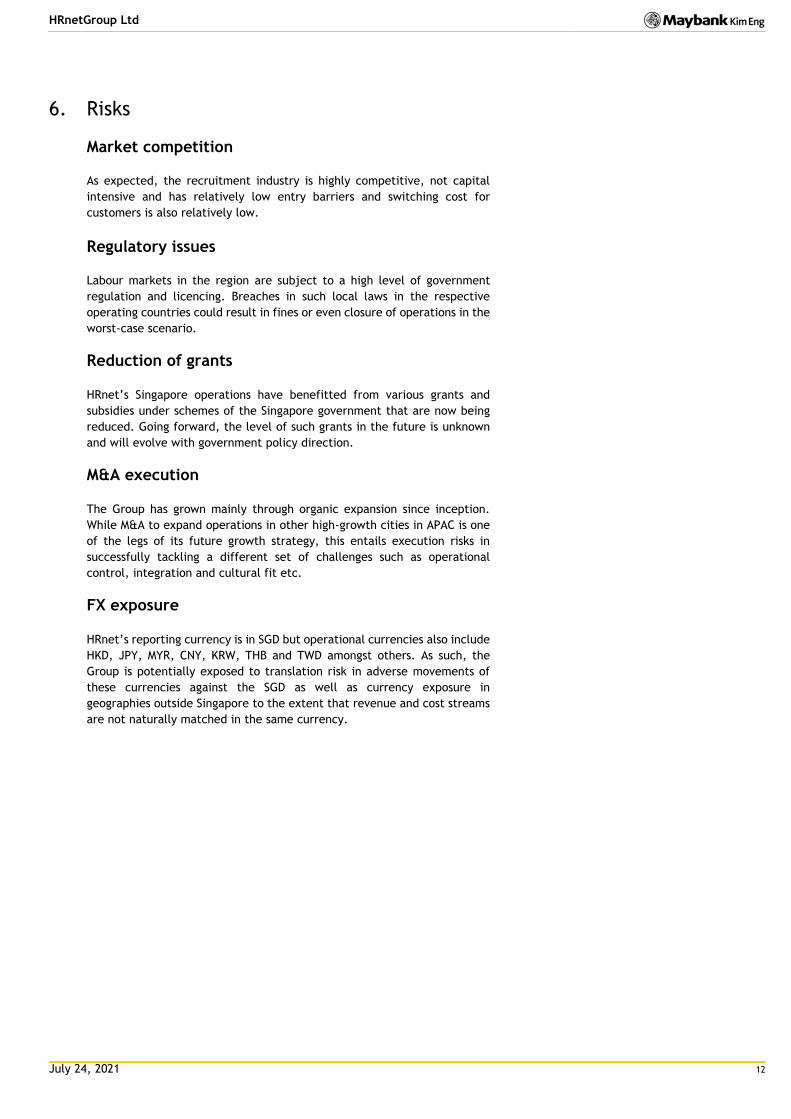
Fig 22: 12-month forward P/E band
Source: FactSet
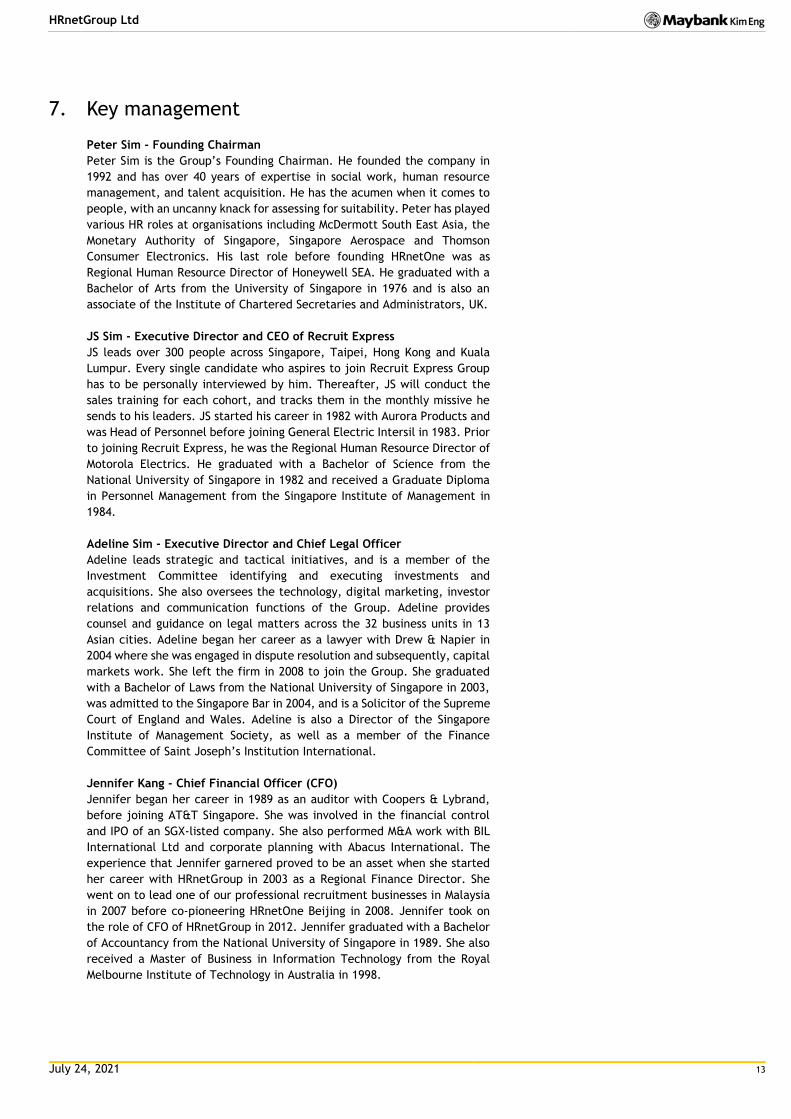
Fig 23: 12-month forward P/B band
Source: FactSet
July 24, 2021 12
HRnetGroup Ltd
6. Risks
Market competition
As expected, the recruitment industry is highly competitive, not capital
intensive and has relatively low entry barriers and switching cost for
customers is also relatively low.
Regulatory issues
Labour markets in the region are subject to a high level of government
regulation and licencing. Breaches in such local laws in the respective
operating countries could result in fines or even closure of operations in the
worst-case scenario.
Reduction of grants
HRnet’s Singapore operations have benefitted from various grants and
subsidies under schemes of the Singapore government that are now being
reduced. Going forward, the level of such grants in the future is unknown
and will evolve with government policy direction.
M&A execution
The Group has grown mainly through organic expansion since inception.
While M&A to expand operations in other high-growth cities in APAC is one
of the legs of its future growth strategy, this entails execution risks in
successfully tackling a different set of challenges such as operational
control, integration and cultural fit etc.
FX exposure
HRnet’s reporting currency is in SGD but operational currencies also include
HKD, JPY, MYR, CNY, KRW, THB and TWD amongst others. As such, the
Group is potentially exposed to translation risk in adverse movements of
these currencies against the SGD as well as currency exposure in
geographies outside Singapore to the extent that revenue and cost streams
are not naturally matched in the same currency.
July 24, 2021 13
HRnetGroup Ltd
7. Key management
Peter Sim - Founding Chairman
Peter Sim is the Group’s Founding Chairman. He founded the company in
1992 and has over 40 years of expertise in social work, human resource
management, and talent acquisition. He has the acumen when it comes to
people, with an uncanny knack for assessing for suitability. Peter has played
various HR roles at organisations including McDermott South East Asia, the
Monetary Authority of Singapore, Singapore Aerospace and Thomson
Consumer Electronics. His last role before founding HRnetOne was as
Regional Human Resource Director of Honeywell SEA. He graduated with a
Bachelor of Arts from the University of Singapore in 1976 and is also an
associate of the Institute of Chartered Secretaries and Administrators, UK.
JS Sim - Executive Director and CEO of Recruit Express
JS leads over 300 people across Singapore, Taipei, Hong Kong and Kuala
Lumpur. Every single candidate who aspires to join Recruit Express Group
has to be personally interviewed by him. Thereafter, JS will conduct the
sales training for each cohort, and tracks them in the monthly missive he
sends to his leaders. JS started his career in 1982 with Aurora Products and
was Head of Personnel before joining General Electric Intersil in 1983. Prior
to joining Recruit Express, he was the Regional Human Resource Director of
Motorola Electrics. He graduated with a Bachelor of Science from the
National University of Singapore in 1982 and received a Graduate Diploma
in Personnel Management from the Singapore Institute of Management in
1984.
Adeline Sim - Executive Director and Chief Legal Officer
Adeline leads strategic and tactical initiatives, and is a member of the
Investment Committee identifying and executing investments and
acquisitions. She also oversees the technology, digital marketing, investor
relations and communication functions of the Group. Adeline provides
counsel and guidance on legal matters across the 32 business units in 13
Asian cities. Adeline began her career as a lawyer with Drew & Napier in
2004 where she was engaged in dispute resolution and subsequently, capital
markets work. She left the firm in 2008 to join the Group. She graduated
with a Bachelor of Laws from the National University of Singapore in 2003,
was admitted to the Singapore Bar in 2004, and is a Solicitor of the Supreme
Court of England and Wales. Adeline is also a Director of the Singapore
Institute of Management Society, as well as a member of the Finance
Committee of Saint Joseph’s Institution International.
Jennifer Kang - Chief Financial Officer (CFO)
Jennifer began her career in 1989 as an auditor with Coopers & Lybrand,
before joining AT&T Singapore. She was involved in the financial control
and IPO of an SGX-listed company. She also performed M&A work with BIL
International Ltd and corporate planning with Abacus International. The
experience that Jennifer garnered proved to be an asset when she started
her career with HRnetGroup in 2003 as a Regional Finance Director. She
went on to lead one of our professional recruitment businesses in Malaysia
in 2007 before co-pioneering HRnetOne Beijing in 2008. Jennifer took on
the role of CFO of HRnetGroup in 2012. Jennifer graduated with a Bachelor
of Accountancy from the National University of Singapore in 1989. She also
received a Master of Business in Information Technology from the Royal
Melbourne Institute of Technology in Australia in 1998.
July 24, 2021 14
HRnetGroup Ltd
FYE 31 Dec FY19A FY20A FY21E FY22E FY23E
Key Metrics
P/E (reported) (x) 13.5 10.8 15.5 14.1 12.9
Core P/E (x) 12.2 11.7 15.5 14.1 12.9
P/BV (x) 1.9 1.6 2.2 2.0 1.9
P/NTA (x) 2.0 1.7 2.3 2.1 2.0
Net dividend yield (%) 4.5 4.6 3.4 3.8 4.1
FCF yield (%) 11.2 19.1 8.6 9.4 9.9
EV/EBITDA (x) 4.7 3.2 5.8 5.1 4.4
EV/EBIT (x) 5.5 3.9 6.9 6.0 5.2
INCOME STATEMENT (SGD m)
Revenue 423.1 433.0 465.6 491.5 510.2
EBITDA 80.8 71.4 75.5 81.9 88.3
Depreciation (1.0) (1.2) (1.4) (1.6) (1.8)
Amortisation (5.6) (8.6) (10.2) (10.5) (10.8)
EBIT 68.7 59.4 63.9 69.8 75.8
Net interest income /(exp) (0.3) (0.4) (0.5) (0.6) (0.7)
Associates & JV 0.0 0.0 0.0 0.0 0.0
Exceptionals 0.0 0.0 0.0 0.0 0.0
Other pretax income 0.0 0.0 0.0 0.0 0.0
Pretax profit 68.4 59.0 63.4 69.2 75.1
Income tax (12.6) (9.2) (10.1) (11.1) (12.0)
Minorities (4.2) (2.9) (3.0) (3.0) (3.0)
Discontinued operations 0.0 0.0 0.0 0.0 0.0
Reported net profit 51.6 46.9 50.3 55.1 60.1
Core net profit 51.6 46.9 50.3 55.1 60.1
BALANCE SHEET (SGD m)
Cash & Short Term Investments 266.2 332.2 352.1 374.2 399.6
Accounts receivable 81.6 72.9 76.5 80.3 83.2
Inventory 0.0 0.0 0.0 0.0 0.0
Reinsurance assets 0.0 0.0 0.0 0.0 0.0
Property, Plant & Equip (net) 1.6 1.5 1.6 1.6 1.6
Intangible assets 20.8 14.7 14.7 14.7 14.7
Investment in Associates & JVs 0.0 0.0 0.0 0.0 0.0
Other assets 49.1 31.0 31.0 31.0 31.0
Total assets 419.3 452.4 476.0 501.9 530.1
ST interest bearing debt 0.0 0.0 0.0 0.0 0.0
Accounts payable 45.1 82.1 82.1 82.1 82.1
Insurance contract liabilities 0.0 0.0 0.0 0.0 0.0
LT interest bearing debt 0.0 0.0 0.0 0.0 0.0
Other liabilities 28.0 23.0 23.0 23.0 23.0
Total Liabilities 72.7 105.2 105.2 105.2 105.2
Shareholders Equity 332.0 331.7 355.3 381.2 409.4
Minority Interest 14.6 15.5 15.5 15.5 15.5
Total shareholder equity 346.6 347.1 370.8 396.7 424.9
Total liabilities and equity 419.3 452.4 476.0 501.9 530.1
CASH FLOW (SGD m)
Pretax profit 68.4 59.0 63.4 69.2 75.1
Depreciation & amortisation 12.1 11.9 11.6 12.1 12.6
Adj net interest (income)/exp 0.0 0.0 0.0 0.0 0.0
Change in working capital 4.7 44.0 3.6 3.9 2.8
Cash taxes paid (13.2) (9.5) (10.1) (11.1) (12.0)
Other operating cash flow 0.0 0.0 0.0 0.0 0.0
Cash flow from operations 71.9 105.5 68.4 74.1 78.4
Capex (1.3) (1.2) (1.3) (1.4) (1.5)
Free cash flow 70.6 104.2 67.1 72.7 76.9
Dividends paid (30.0) (30.1) (26.6) (29.2) (31.8)
Equity raised / (purchased) 0.0 0.0 0.0 0.0 0.0
Change in Debt 0.0 0.0 0.0 0.0 0.0
Other invest/financing cash flow (69.9) (15.4) (20.5) (21.4) (19.7)
Effect of exch rate changes 0.0 0.0 0.0 0.0 0.0
Net cash flow (29.3) 58.7 19.9 22.0 25.4
July 24, 2021 15
HRnetGroup Ltd
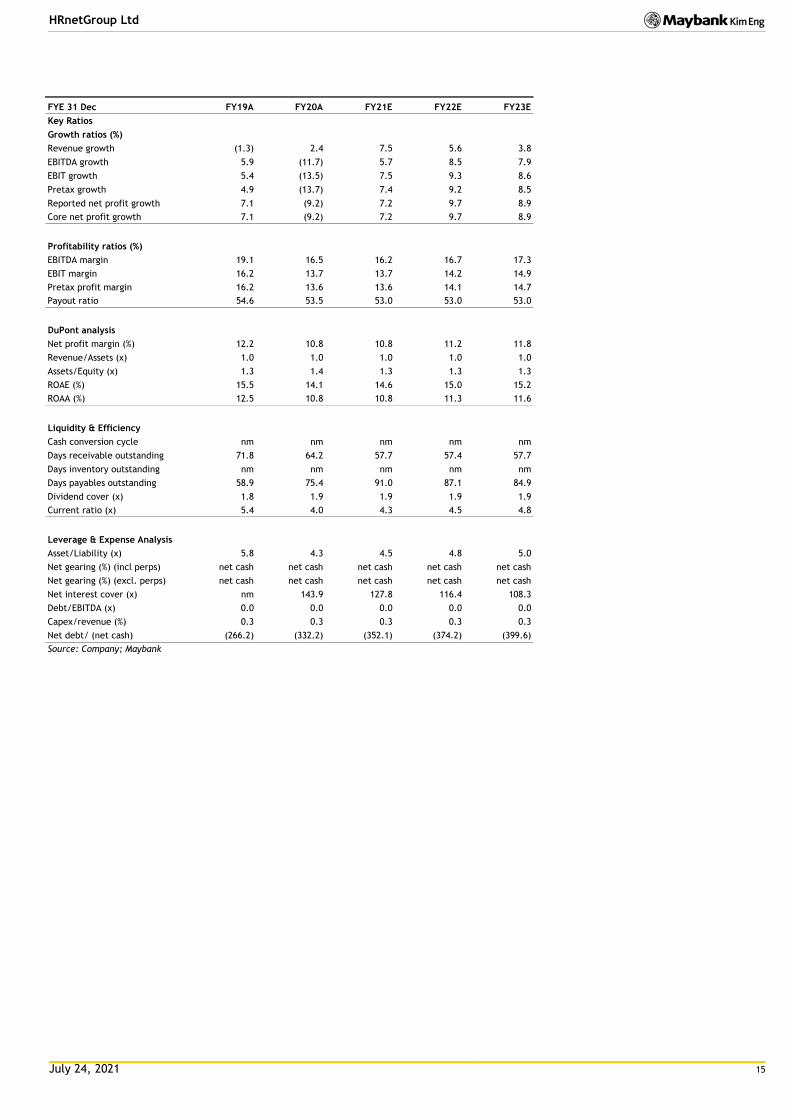
FYE 31 Dec FY19A FY20A FY21E FY22E FY23E
Key Ratios
Growth ratios (%)
Revenue growth (1.3) 2.4 7.5 5.6 3.8
EBITDA growth 5.9 (11.7) 5.7 8.5 7.9
EBIT growth 5.4 (13.5) 7.5 9.3 8.6
Pretax growth 4.9 (13.7) 7.4 9.2 8.5
Reported net profit growth 7.1 (9.2) 7.2 9.7 8.9
Core net profit growth 7.1 (9.2) 7.2 9.7 8.9
Profitability ratios (%)
EBITDA margin 19.1 16.5 16.2 16.7 17.3
EBIT margin 16.2 13.7 13.7 14.2 14.9
Pretax profit margin 16.2 13.6 13.6 14.1 14.7
Payout ratio 54.6 53.5 53.0 53.0 53.0
DuPont analysis
Net profit margin (%) 12.2 10.8 10.8 11.2 11.8
Revenue/Assets (x) 1.0 1.0 1.0 1.0 1.0
Assets/Equity (x) 1.3 1.4 1.3 1.3 1.3
ROAE (%) 15.5 14.1 14.6 15.0 15.2
ROAA (%) 12.5 10.8 10.8 11.3 11.6
Liquidity & Efficiency
Cash conversion cycle nm nm nm nm nm
Days receivable outstanding 71.8 64.2 57.7 57.4 57.7
Days inventory outstanding nm nm nm nm nm
Days payables outstanding 58.9 75.4 91.0 87.1 84.9
Dividend cover (x) 1.8 1.9 1.9 1.9 1.9
Current ratio (x) 5.4 4.0 4.3 4.5 4.8
Leverage & Expense Analysis
Asset/Liability (x) 5.8 4.3 4.5 4.8 5.0
Net gearing (%) (incl perps) net cash net cash net cash net cash net cash
Net gearing (%) (excl. perps) net cash net cash net cash net cash net cash
Net interest cover (x) nm 143.9 127.8 116.4 108.3
Debt/EBITDA (x) 0.0 0.0 0.0 0.0 0.0
Capex/revenue (%) 0.3 0.3 0.3 0.3 0.3
Net debt/ (net cash) (266.2) (332.2) (352.1) (374.2) (399.6)
Source: Company; Maybank
July 24, 2021 16
HRnetGroup Ltd
Research Offices
ECONOMICS
Suhaimi ILIAS Chief Economist Malaysia | Philippines | Global (603) 2297 8682 [email protected]
CHUA Hak Bin Regional Thematic Macroeconomist (65) 6231 5830 [email protected]
LEE Ju Ye Singapore | Thailand | Indonesia (65) 6231 5844 [email protected]
Linda LIU Singapore | Vietnam | Cambodia | Myanmar | Laos (65) 6231 5847 [email protected]
Dr Zamros DZULKAFLI (603) 2082 6818 [email protected]
Ramesh LANKANATHAN (603) 2297 8685 [email protected]
FX
Saktiandi SUPAAT Head of FX Research (65) 6320 1379 [email protected]
Christopher WONG (65) 6320 1347 [email protected]
TAN Yanxi (65) 6320 1378 [email protected]
Fiona LIM (65) 6320 1374 [email protected]
STRATEGY
Anand PATHMAKANTHAN
ASEAN (603) 2297 8783 [email protected]
FIXED INCOME
Winson PHOON, ACA (65) 6340 1079 [email protected]
SE THO Mun Yi (603) 2074 7606 [email protected]
REGIONAL EQUITIES
Anand PATHMAKANTHAN Head of Regional Equity Research (603) 2297 8783 [email protected]
WONG Chew Hann, CA Head of ASEAN Equity Research (603) 2297 8686 [email protected]
ONG Seng Yeow Research, Technology & Innovation (65) 6231 5839 [email protected]
MALAYSIA
Anand PATHMAKANTHAN Head of Research (603) 2297 8783 [email protected] • Strategy
WONG Chew Hann (603) 2297 8686
[email protected] • Non-Bank Financials (stock exchange) • Construction & Infrastructure
Desmond CH’NG, BFP, FCA (603) 2297 8680 [email protected] • Banking & Finance
LIAW Thong Jung (603) 2297 8688 [email protected] • Oil & Gas Services- Regional • Automotive
ONG Chee Ting, CA (603) 2297 8678 [email protected] • Plantations - Regional
YIN Shao Yang, CPA (603) 2297 8916 [email protected] • Gaming – Regional • Media • Aviation • Non-Bank Financials
TAN Chi Wei, CFA (603) 2297 8690 [email protected] • Power • Telcos
WONG Wei Sum, CFA (603) 2297 8679 [email protected] • Property • Glove
Kevin WONG (603) 2082 6824 [email protected] • REITs • Technology
Jade TAM (603) 2297 8687 [email protected] • Consumer Staples & Discretionary
Fahmi FARID (603) 2297 8676 [email protected] • Software
TEE Sze Chiah Head of Retail Research (603) 2082 6858 [email protected]
Nik Ihsan RAJA ABDULLAH, MSTA, CFTe (603) 2297 8694 [email protected] • Chartist
Amirah AZMI (603) 2082 8769 [email protected] • Retail Research
INDIA
Jigar SHAH Head of Research (91) 22 4223 2632 [email protected] • Strategy • Oil & Gas • Automobile • Cement
Neerav DALAL (91) 22 4223 2606 [email protected] • Software Technology • Telcos
Vikram RAMALINGAM (91) 22 4223 2607 [email protected] • Automobile • Media
SINGAPORE
Thilan WICKRAMASINGHE Head of Research (65) 6231 5840 [email protected] • Banking & Finance - Regional • Consumer
CHUA Su Tye (65) 6231 5842 [email protected] • REITs - Regional
LAI Gene Lih, CFA (65) 6231 5832 [email protected] • Technology • Healthcare
Kareen CHAN (65) 6231 5926 [email protected] • Transport • Telcos • Consumer
Eric ONG (65) 6231 5924 [email protected] • SMIDs
Matthew SHIM (65) 6231 5929 [email protected]
• Retail Research
PHILIPPINES
Jacqui de JESUS Head of Research (63) 2 8849 8840 [email protected] • Strategy • Conglomerates
Rachelleen RODRIGUEZ, CFA (63) 2 8849 8843 [email protected] • Banking & Finance • Transport • Telcos
Benedict CLEMENTE (63) 2 8849 8846 [email protected] • Utilities
Daphne SZE (63) 2 8849 8847 [email protected] • Consumer
VIETNAM
Quan Trong Thanh Head of Research (84 28) 44 555 888 ext 8184 [email protected] • Banks
Hoang Huy, CFA (84 28) 44 555 888 ext 8181 [email protected] • Strategy • Technology
Le Nguyen Nhat Chuyen (84 28) 44 555 888 ext 8082 [email protected] • Oil & Gas
Nguyen Thi Sony Tra Mi (84 28) 44 555 888 ext 8084 [email protected] • Consumer
Tyler Manh Dung Nguyen (84 28) 44 555 888 ext 8085 [email protected] • Utilities • Property
Tran Thi Thu Thao (84 28) 44 555 888 ext 8180 [email protected] • Industrials
Nguyen Thi Ngan Tuyen Head of Retail Research (84 28) 44 555 888 ext 8081 [email protected] • Retail Research
Nguyen Thanh Lam (84 28) 44 555 888 ext 8086 [email protected] • Technical Analysis
INDONESIA
Isnaputra ISKANDAR Head of Research (62) 21 8066 8680 [email protected] • Strategy • Metals & Mining • Cement • Autos • Consumer • Utility
Rahmi MARINA (62) 21 8066 8689 [email protected] • Banking & Finance
Willy GOUTAMA (62) 21 8066 8500 [email protected] • Consumer
Farah OKTAVIANI (62) 21 8066 8691 [email protected] • Construction
THAILAND
Maria LAPIZ Head of Institutional Research
Dir (66) 2257 0250 | (66) 2658 6300 ext 1399 [email protected] • Strategy • Consumer • Materials • Services
Jesada TECHAHUSDIN, CFA (66) 2658 6300 ext 1395 [email protected] • Banking & Finance
Kaushal LADHA, CFA (66) 2658 6300 ext 1392 [email protected] • Oil & Gas – Regional • Petrochemicals - Regional • Utilities
Vanida GEISLER, CPA (66) 2658 6300 ext 1394 [email protected] • Property • REITs
Yuwanee PROMMAPORN (66) 2658 6300 ext 1393 Yuwanee.P @maybank-ke.co.th • Services • Healthcare
Ekachai TARAPORNTIP Head of Retail Research (66) 2658 5000 ext 1530 [email protected]
Surachai PRAMUALCHAROENKIT (66) 2658 5000 ext 1470 [email protected] • Auto • Conmat • Contractor • Steel
Suttatip PEERASUB (66) 2658 5000 ext 1430 [email protected] • Food & Beverage • Commerce
Jaroonpan WATTANAWONG (66) 2658 5000 ext 1404 [email protected] • Transportation • Small cap
Thanatphat SUKSRICHAVALIT (66) 2658 5000 ext 1401 [email protected] • Media • Electronics
Wijit ARAYAPISIT (66) 2658 5000 ext 1450 [email protected] • Strategist
Theerasate PROMPONG
(66) 2658 5000 ext 1400 [email protected] • Equity Portfolio Strategist
Apiwat TAVESIRIVATE
(66) 2658 5000 ext 1310
• Chartist and TFEX
July 24, 2021 17
HRnetGroup Ltd
APPENDIX I: TERMS FOR PROVISION OF REPORT, DISCLAIMERS AND DISCLOSURES
DISCLAIMERS This research report is prepared for general circulation and for information purposes only and under no circumstances should it be considered or intended as an offer to sell or a solicitation of an offer to buy the securities referred to herein. Investors should note that values of such securities, if any, may fluctuate and that each security’s price or value may rise or fall. Opinions or recommendations contained herein are in form of technical ratings and fundamental ratings. Technical ratings may differ fr om fundamental ratings as technical valuations apply different methodologies and are purely based on price and volume-related information extracted from the relevant jurisdiction’s stock exchange in the equity analysis. Accordingly, investors’ returns may be less than the original sum invested. Past performance is not necessarily a guide to future performance. This report is not intended to provide personal investment advice and does not take into account the specific investment objectives, the financial situation and the particular needs of persons who may receive or read this report. Investors should therefore seek financial, legal and other advice regarding the appropriateness of investing in any securities or the investment strategies discussed or recommended in this report.
The information contained herein has been obtained from sources believed to be reliable but such sources have not been independently verified by Maybank Investment Bank Berhad, its subsidiary and affiliates (collectively, “MKE”) and consequently no representation is made as to the accuracy or completeness of this report by MKE and it should not be relied upon as such. Accordingly, MKE and its officers, directors, associates, connected parties and/or employees (collectively, “Representatives”) shall not be liable for any direct, indirect or consequential losses or damages that may arise from the use or reliance of this report. Any information, opinions or recommendations contained herein are subject to change at any time, without prior notice.
This report may contain forward looking statements which are often but not always identified by the use of words such as “anticipate”, “believe”, “estimate”, “intend”, “plan”, “expect”, “forecast”, “predict” and “project” and statements that an event or result “may”, “will”, “can”, “should”, “could” or “might” occur or be achieved and other similar expressions. Such forward looking statements are based on assumptions made and information currently available to us and are subject to certain risks and uncertainties that could cause the actual results to differ materially from those expressed in any forward looking statements. Readers are cautioned not to place undue relevance on these forward-looking statements. MKE expressly disclaims any obligation to update or revise any such forward looking statements to reflect new information, events or c ircumstances after the date of this publication or to reflect the occurrence of unanticipated events.
MKE and its officers, directors and employees, including persons involved in the preparation or issuance of this report, may, to the extent permitted by law, from time to time participate or invest in financing transactions with the issuer(s) of the securities mentioned in this report, perform services for or solic it business from such issuers, and/or have a position or holding, or other material interest, or effect transactions, in such securities or options thereon, or other investments related thereto. In addition, it may make markets in the securities mentioned in the material presented in this report. One or more directors, officers and/or employees of MKE may be a director of the issuers of the securities mentioned in this report to the extent permitted by law.
This report is prepared for the use of MKE’s clients and may not be reproduced, altered in any way, transmitted to, copied or distributed to any other party in whole or in part in any form or manner without the prior express written consent of MKE and MKE and its Representatives accepts no liability whatsoever for t he actions of third parties in this respect.
This report is not directed to or intended for distribution to or use by any person or entity who is a citizen or resident of or located in any locality, state, country or other jurisdiction where such distribution, publication, availability or use would be contrary to law or regulation. This report is for distribution only under such circumstances as may be permitted by applicable law. The securities described herein may not be eligible for sale in all jurisdictions or to certain categories of investors. Without prejudice to the foregoing, the reader is to note that additional disclaimers, warnings or qualifications may apply based on geographical location of the person or entity receiving this repor t.
Malaysia Opinions or recommendations contained herein are in the form of technical ratings and fundamental ratings. Technical ratings may differ from fundamental ratings as technical valuations apply different methodologies and are purely based on price and volume-related information extracted from Bursa Malaysia Securities Berhad in the equity analysis.
Singapore This report has been produced as of the date hereof and the information herein may be subject to change. Maybank Kim Eng Research Pte. Ltd. (“Maybank KERPL”) in Singapore has no obligation to update such information for any recipient. For distribution in Singapore, recipients of this report are to contact Maybank KERPL in Singapore in respect of any matters arising from, or in connection with, this report. If the recipient of this report is not an accredited investor, expert investor or institutional investor (as defined under Section 4A of the Singapore Securities and Futures Act), Maybank KERPL shall be legally liable for the contents of this report, with such liability being limited to the extent (if any) as permitted by law.
Thailand Except as specifically permitted, no part of this presentation may be reproduced or distributed in any manner without the prior written permission of Maybank Kim Eng Securities (Thailand) Public Company Limited. Maybank Kim Eng Securities (Thailand) Public Company Limited (“MBKET”) accepts no liability whatsoever for the actions of third parties in this respect.
Due to different characteristics, objectives and strategies of institutional and retail investors, the research products of MBKET Institutional and Retail Research departments may differ in either recommendation or target price, or both. MBKET reserves the rights to disseminate MBKET Retail Research reports to institutional investors who have requested to receive it. If you are an authorised recipient, you hereby tacitly acknowledge that the research reports from MBKET Retail Research are first produced in Thai and there is a time lag in the release of the translated English version.
The disclosure of the survey result of the Thai Institute of Directors Association (“IOD”) regarding corporate governance is made pursuant to the policy of the Office of the Securities and Exchange Commission. The survey of the IOD is based on the information of a company listed on the Stock Exchange of Thailand and the market for Alternative Investment disclosed to the public and able to be accessed by a general public investor. The result, therefore, is from the perspective of a third party. It is not an evaluation of operation and is not based on inside information. The survey result is as of the date appearing in the Corporate Governance Report of Thai Listed Companies. As a result, the s urvey may be changed after that date. MBKET does not confirm nor certify the accuracy of such survey result.
The disclosure of the Anti-Corruption Progress Indicators of a listed company on the Stock Exchange of Thailand, which is assessed by Thaipat Institute, is made in order to comply with the policy and sustainable development plan for the listed companies of the Office of the Securities and Exchange Commission. Thaipat Institute made this assessment based on the information received from the listed company, as stipulated in the form for the assessment of Anti-corruption which refers to the Annual Registration Statement (Form 56-1), Annual Report (Form 56-2), or other relevant documents or reports of such listed company. The assessment result is therefore made from the perspective o f Thaipat Institute that is a third party. It is not an assessment of operation and is not based on any inside information. Since this assessment is only the assessment result as of the date appearing in the assessment result, it may be changed after that date or when there is any change to the relevant information. Nevertheless, MBKET does not confirm, verify, or certify the accuracy and completeness of the assessment result.
US This third-party research report is distributed in the United States (“US”) to Major US Institutional Investors (as defined in Rule 15a-6 under the Securities Exchange Act of 1934, as amended) only by Maybank Kim Eng Securities USA Inc (“Maybank KESUSA”), a broker-dealer registered in the US (registered under Section 15 of the Securities Exchange Act of 1934, as amended). All responsibility for the distribution of this report by Maybank KESUSA in the US shall be borne by Maybank KESUSA. This report is not directed at you if MKE is prohibited or restricted by any legislation or regulation in any jurisdiction from making it available to you. You should satisfy yourself before reading it that Maybank KESUSA is permitted to provide research material concerning investments to you under relevant legislation and regulations. All U.S. persons receiving and/or accessing this report and wishing to effect transactions in any security mentioned within must do so with: Maybank Kim Eng Securities USA Inc. 400 Park Avenue, 11th Floor, New York, New York 10022, 1-(212) 688-8886 and not with, the issuer of this report.
July 24, 2021 18
HRnetGroup Ltd
Disclosure of Interest
Malaysia: MKE and its Representatives may from time to time have positions or be materially interested in the securities referred to herein and may further act as market maker or may have assumed an underwriting commitment or deal with such securities and may also perform or seek to perform investment banking services, advisory and other services for or relating to those companies. Singapore: As of 24 July 2021, Maybank KERPL and the covering analyst do not have any interest in any companies recommended in this research report. Thailand: MBKET may have a business relationship with or may possibly be an issuer of derivative warrants on the securities /companies mentioned in the research report. Therefore, Investors should exercise their own judgment before making any investment decisions. MBKET, its associates, directors, connected parties and/or employees may from time to time have interests and/or underwriting commitments in the securities mentioned in this report. Hong Kong: As of 24 July 2021, KESHK and the authoring analyst do not have any interest in any companies recommended in this research report. India: As of 24 July 2021, and at the end of the month immediately preceding the date of publication of the research report, KESI, authoring analyst or their associate / relative does not hold any financial interest or any actual or beneficial ownership in any shares or having any conflict of interest in the subject companies except as otherwise disclosed in the research report.
In the past twelve months KESI and authoring analyst or their associate did not receive any compensation or other benefits from the subject companies or third party in connection wi th the research report on any account what so ever except as otherwise disclosed in the research report.
MKE may have, within the last three years, served as manager or co-manager of a public offering of securities for, or currently may make a primary market in issues of, any or all of the entities mentioned in this report or may be providing, or have provided within the previous 12 months, significant advice or investment services in relation to the investment concerned or a related investment and may receive compensation for the services provided from the companies covered in this report.
OTHERS
Analyst Certification of Independence
The views expressed in this research report accurately reflect the analyst’s personal views about any and all of the subject securities or issuers; and no part of the research analyst’s compensation was, is or will be, directly or indirectly, related to the specific recommendations or views expressed in the report.
Reminder
Structured securities are complex instruments, typically involve a high degree of risk and are intended for sale only to soph isticated investors who are capable of understanding and assuming the risks involved. The market value of any structured security may be affected by changes in economic, financial and politic al factors (including, but not limited to, spot and forward interest and exchange rates), time to maturity, market conditions and volatility and the credit quality of any issuer or reference issuer. Any investor interested in purchasing a structured product should conduct its own analysis of the product and consult with its own professional advisers as to the risks involved in making such a purchase.
No part of this material may be copied, photocopied or duplicated in any form by any means or redistributed without the prior consent of MKE.
Definition of Ratings
Maybank Kim Eng Research uses the following rating system
BUY Return is expected to be above 10% in the next 12 months (including dividends)
HOLD Return is expected to be between 0% to 10% in the next 12 months (including dividends)
SELL Return is expected to be below 0% in the next 12 months (including dividends)
Applicability of Ratings
The respective analyst maintains a coverage universe of stocks, the list of which may be adjusted according to needs. Investment ratings are only applicable to the stocks which form part of the coverage universe. Reports on companies which are not part of the coverage do not carry investment ratings as we do not actively follow developments in these companies.
UK This document is being distributed by Maybank Kim Eng Securities (London) Ltd (“Maybank KESL”) which is authorized and regulated, by the Financial Conduct Authority and is for Informational Purposes only. This document is not intended for distribution to anyone defined as a Retail Client under the Financial Services and Markets Act 2000 within the UK. Any inclusion of a third party link is for the recipients convenience only, and that the firm does not take any responsibility for its comments or accuracy, and that access to such links is at the individuals own risk. Nothing in this report should be considered as constituting legal, accounting or tax advice, and that for accurate guidance recipients should consult with their own independent tax advisers.
DISCLOSURES
Legal Entities Disclosures Malaysia: This report is issued and distributed in Malaysia by Maybank Investment Bank Berhad (15938- H) which is a Participating Organization of Bursa Malaysia Berhad and a holder of Capital Markets and Services License issued by the Securities Commission in Malaysia. Singapore: This report is distributed in Singapore by Maybank KERPL (Co. Reg No 198700034E) which is regulated by the Monetary Authority of Singapore. Indonesia: PT Maybank Kim Eng Securities (“PTMKES”) (Reg. No. KEP-251/PM/1992) is a member of the Indonesia Stock Exchange and is regulated by the Financial Services Authority (Indonesia). Thailand: MBKET (Reg. No.0107545000314) is a member of the Stock Exchange of Thailand and is regulated by the Ministry of Finance and the Securities and Exchange Commission. Philippines: Maybank ATRKES (Reg. No.01-2004-00019) is a member of the Philippines Stock Exchange and is regulated by the Securities and Exchange Commission. Vietnam: Maybank Kim Eng Securities Limited (License Number: 117/GP-UBCK) is licensed under the State Securities Commission of Vietnam. Hong Kong: KESHK (Central Entity No AAD284) is regulated by the Securities and Futures Commission. India: Kim Eng Securities India Private Limited (“KESI”) is a participant of the National Stock Exchange of India Limited and the Bombay Stock Exchange and is regulated by Securities and Exchange Board of India (“SEBI”) (Reg. No. INZ000010538). KESI is also registered with SEBI as Category 1 Merchant Banker (Reg. No. INM 000011708) and as Research Analyst (Reg No: INH000000057) US: Maybank KESUSA is a member of/ and is authorized and regulated by the FINRA – Broker ID 27861. UK: Maybank KESL (Reg No 2377538) is authorized and regulated by the Financial Conduct Authority.
July 24, 2021 19
HRnetGroup Ltd
Malaysia Maybank Investment Bank Berhad
(A Participating Organisation of
Bursa Malaysia Securities Berhad)
33rd Floor, Menara Maybank,
100 Jalan Tun Perak,
50050 Kuala Lumpur
Tel: (603) 2059 1888;
Fax: (603) 2078 4194
Singapore Maybank Kim Eng Securities Pte Ltd
Maybank Kim Eng Research Pte Ltd
50 North Canal Road
Singapore 059304
Tel: (65) 6336 9090
London Maybank Kim Eng Securities
(London) Ltd
PNB House
77 Queen Victoria Street
London EC4V 4AY, UK
Tel: (44) 20 7332 0221
Fax: (44) 20 7332 0302
New York Maybank Kim Eng Securities USA
Inc
400 Park Avenue, 11th Floor
New York, New York 10022,
U.S.A.
Tel: (212) 688 8886
Fax: (212) 688 3500
Stockbroking Business:
Level 8, Tower C, Dataran Maybank,
No.1, Jalan Maarof
59000 Kuala Lumpur
Tel: (603) 2297 8888
Fax: (603) 2282 5136
Hong Kong Kim Eng Securities (HK) Ltd
28/F, Lee Garden Three,
1 Sunning Road, Causeway Bay,
Hong Kong
Tel: (852) 2268 0800
Fax: (852) 2877 0104
Indonesia PT Maybank Kim Eng Securities
Sentral Senayan III, 22nd Floor
Jl. Asia Afrika No. 8
Gelora Bung Karno, Senayan
Jakarta 10270, Indonesia
Tel: (62) 21 2557 1188
Fax: (62) 21 2557 1189
India Kim Eng Securities India Pvt Ltd
1101, 11th floor, A Wing, Kanakia
Wall Street, Chakala, Andheri -
Kurla Road, Andheri East,
Mumbai City - 400 093, India
Tel: (91) 22 6623 2600
Fax: (91) 22 6623 2604
Philippines Maybank ATR Kim Eng Securities Inc.
17/F, Tower One & Exchange Plaza
Ayala Triangle, Ayala Avenue
Makati City, Philippines 1200
Tel: (63) 2 8849 8888
Fax: (63) 2 8848 5738
Thailand Maybank Kim Eng Securities
(Thailand) Public Company Limited
999/9 The Offices at Central World,
20th - 21st Floor,
Rama 1 Road Pathumwan,
Bangkok 10330, Thailand
Tel: (66) 2 658 6817 (sales)
Tel: (66) 2 658 6801 (research)
Vietnam Maybank Kim Eng Securities Limited
4A-15+16 Floor Vincom Center Dong
Khoi, 72 Le Thanh Ton St. District 1
Ho Chi Minh City, Vietnam
Tel : (84) 844 555 888
Fax : (84) 8 38 271 030
Saudi Arabia In association with
Anfaal Capital
Ground Floor, KANOO Building
No.1 - Al-Faisaliyah,Madina Road,
P.O.Box 126575 Jeddah 21352
Kingdom of Saudi Arabia
Tel: (966) 920023423
South Asia Sales Trading Kevin Foy
Regional Head Sales Trading
Tel: (65) 6636-3620
US Toll Free: 1-866-406-7447
North Asia Sales Trading Andrew Lee
Tel: (852) 2268 0283
US Toll Free: 1 877 837 7635
Indonesia Iwan Atmadjaja [email protected] (62) 21 8066 8555
London Greg Smith [email protected] Tel: (44) 207-332-0221
New York James Lynch [email protected] Tel: (212) 688 8886
India Sanjay Makhija [email protected] Tel: (91)-22-6623-2629
Philippines Keith Roy [email protected] Tel: (63) 2 848-5288
www.maybank-ke.com | www.maybank-keresearch.com
Related Documents