Pallavi et al. / SGVU Journal of Pharmaceutical Research & Education, 2017, 2(1), 243-260 243 Review Article SGVU Journal of Pharmaceutical Research & Education Journal homepage: http://www.gyanvihar.org/researchjournals HPLC METHOD DEVELOPMENT - A REVIEW Ms Pallavi Nemgonda Patil* Suresh Gyan Vihar University, Jaipur, Rajastan India. Abstract- They may be utilized as the basis for decisions relating to administering the drug to patients, play important roles in new discovery, development, manufacture of pharmaceutical drugs and various other studies related to humans and animals. Analytical method validation required during drug development and manufacturing and these analytical methods are fit for their intended purpose. To comply with the requirements of GMP pharmaceutical industries should have an overall validation policy which documents how validation will be performed. This article mainly focuses on the optimization of HPLC conditions. A sequence of events required for method development and analytical validation are described. Key Words: HPLC, Analytical method validation, Pharmaceutical analysis, Specificity, Precision, Accuracy. INTRODUCTION- PARTITION CHROMATOGRAPHY Partition chromatography can be subdivided into (i) liquid-liquid chromatography and (ii) bonded-phase chromatography. • With liquid-liquid, a liquid stationary phase is retained on the surface of the packing by physical adsorption. • With bonded-phase, the stationary phase is bonded chemically to the support surfaces. Early partition chromatography was the liquid-liquid type; now the bonded-phase method has become predominate because of certain disadvantages of liquid-liquid systems. • One of these disadvantages is the loss of stationary phase by dissolution in the mobile phase, which requires periodic recoating of the support particles. • Furthermore, stationary-phase solubility problems prohibit the use of liquid-phase packings for gradient elution.

Welcome message from author
This document is posted to help you gain knowledge. Please leave a comment to let me know what you think about it! Share it to your friends and learn new things together.
Transcript
Pallavi et al. / SGVU Journal of Pharmaceutical Research & Education, 2017, 2(1), 243-260
243
Review Article
SGVU Journal of Pharmaceutical Research & Education
Journal homepage: http://www.gyanvihar.org/researchjournals
HPLC METHOD DEVELOPMENT - A REVIEW
Ms Pallavi Nemgonda Patil*
Suresh Gyan Vihar University, Jaipur, Rajastan India.
Abstract-
They may be utilized as the basis for decisions relating to administering the drug to patients,
play important roles in new discovery, development, manufacture of pharmaceutical drugs and
various other studies related to humans and animals. Analytical method validation required
during drug development and manufacturing and these analytical methods are fit for their
intended purpose. To comply with the requirements of GMP pharmaceutical industries should
have an overall validation policy which documents how validation will be performed. This
article mainly focuses on the optimization of HPLC conditions. A sequence of events required
for method development and analytical validation are described.
Key Words: HPLC, Analytical method validation, Pharmaceutical analysis, Specificity,
Precision, Accuracy.
INTRODUCTION-
PARTITION CHROMATOGRAPHY
Partition chromatography can be subdivided into
(i) liquid-liquid chromatography and
(ii) bonded-phase chromatography.
• With liquid-liquid, a liquid stationary phase is retained on the surface of the packing by
physical adsorption.
• With bonded-phase, the stationary phase is bonded chemically to the support surfaces.
Early partition chromatography was the liquid-liquid type; now the bonded-phase method has
become predominate because of certain disadvantages of liquid-liquid systems.
• One of these disadvantages is the loss of stationary phase by dissolution in the mobile
phase, which requires periodic recoating of the support particles.
• Furthermore, stationary-phase solubility problems prohibit the use of liquid-phase
packings for gradient elution.
Pallavi et al. / SGVU Journal of Pharmaceutical Research & Education, 2017, 2(1), 243-260
244
Columns for Bonded-Phase Chromatography
The supports for the majority of bonded-phase packings for partition chromatography are
prepared from rigid silica, or silica-based, compositions. These solids are formed as uniform,
porous, mechanically sturdy particles commonly having diameters of 3, 5, or 10m. The surface
of fully hydrolyzed silica is made up of chemically reactive silanol groups. The most useful
bonded-phase coatings are siloxanes formed by reaction of the hydrolyzed surface with an
organochlorosilane
Figure-1 HPLC PARTS
Pallavi et al. / SGVU Journal of Pharmaceutical Research & Education, 2017, 2(1), 243-260
245
HPLC classified by
I.BASED ON MODE OF SEPERATION
1. Normal phase chromatography - stationary phase is polar (hydrophilic) and mobile face is
non-polar (hydrophobic).
2. Reverse phase chromatography- stationary phase is non-polar (hydrophobic) and mobile face
is Polar (hydrophilic).
• Polar-Polar bonds and Non Polar-Non Polar bonds have more affinity than Polar-Non Polar
bonds.
Reverse phase chromatography is more commonly used as drugs are usually hydrophilic
• II.BASED ON PRINCIPLE OF SEPERATION
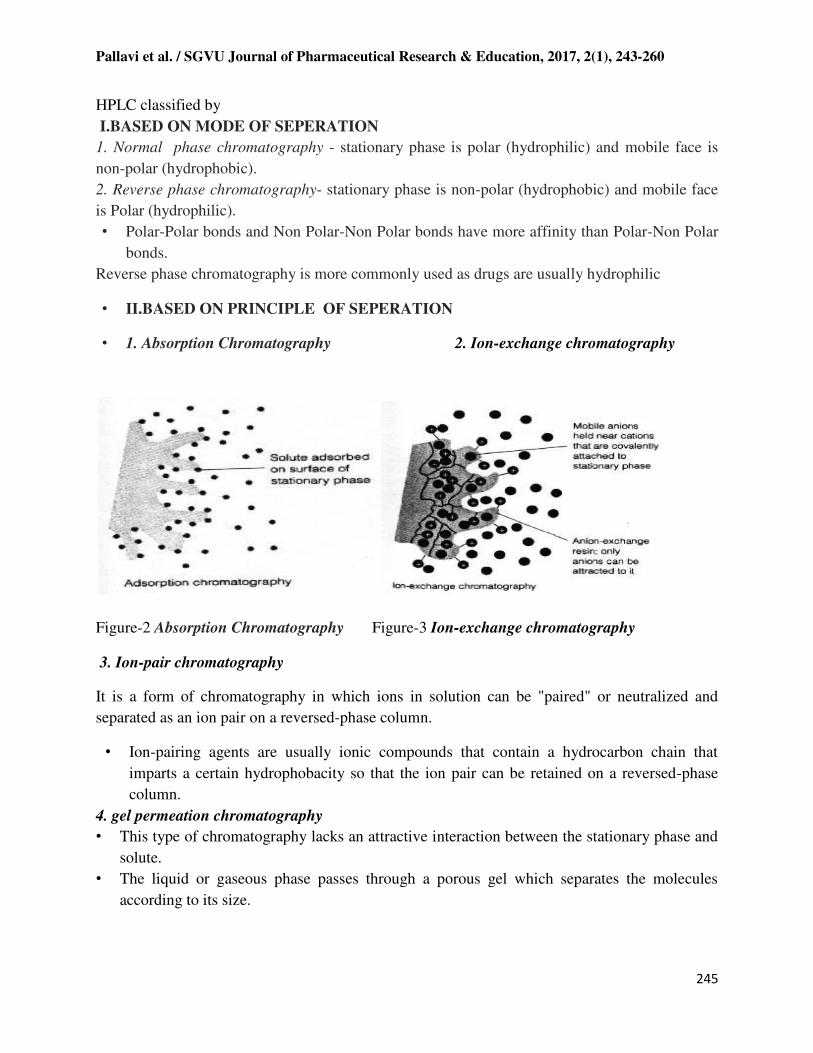
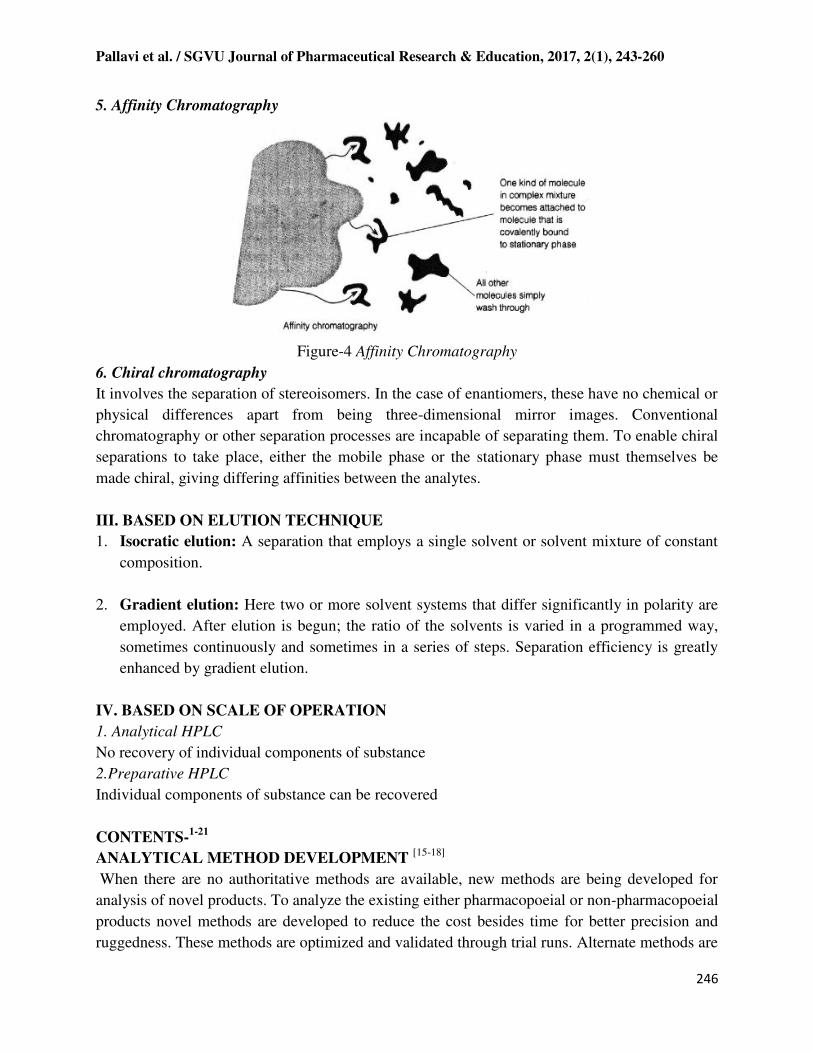
• 1. Absorption Chromatography 2. Ion-exchange chromatography
Figure-2 Absorption Chromatography Figure-3 Ion-exchange chromatography
3. Ion-pair chromatography
It is a form of chromatography in which ions in solution can be "paired" or neutralized and
separated as an ion pair on a reversed-phase column.
• Ion-pairing agents are usually ionic compounds that contain a hydrocarbon chain that
imparts a certain hydrophobacity so that the ion pair can be retained on a reversed-phase
column.
4. gel permeation chromatography
• This type of chromatography lacks an attractive interaction between the stationary phase and
solute.
• The liquid or gaseous phase passes through a porous gel which separates the molecules
according to its size.
Pallavi et al. / SGVU Journal of Pharmaceutical Research & Education, 2017, 2(1), 243-260
246
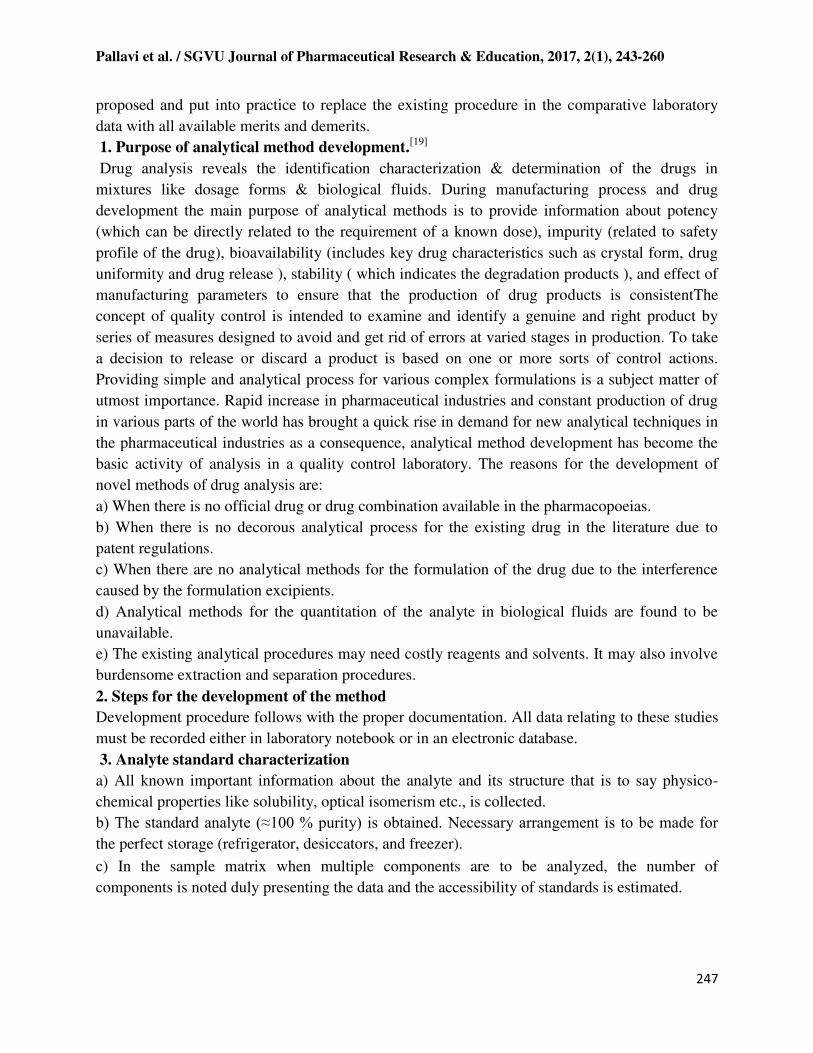
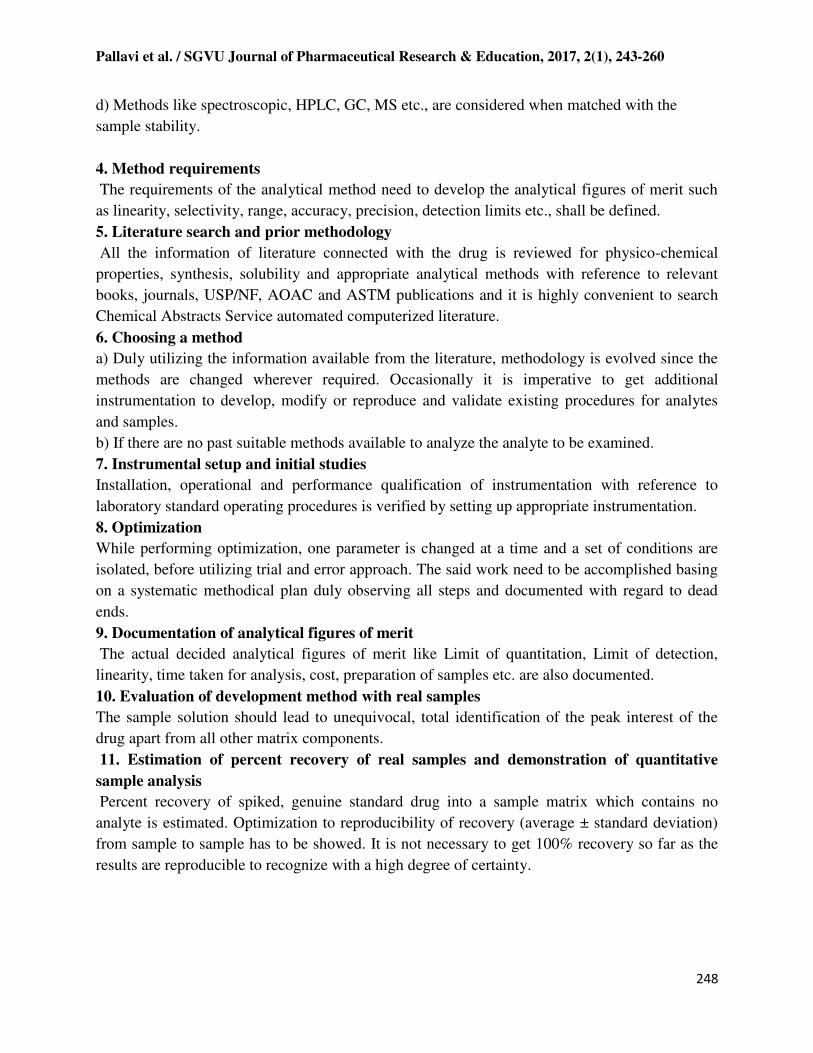
5. Affinity Chromatography
Figure-4 Affinity Chromatography
6. Chiral chromatography
It involves the separation of stereoisomers. In the case of enantiomers, these have no chemical or
physical differences apart from being three-dimensional mirror images. Conventional
chromatography or other separation processes are incapable of separating them. To enable chiral
separations to take place, either the mobile phase or the stationary phase must themselves be
made chiral, giving differing affinities between the analytes.
III. BASED ON ELUTION TECHNIQUE
1. Isocratic elution: A separation that employs a single solvent or solvent mixture of constant
composition.
2. Gradient elution: Here two or more solvent systems that differ significantly in polarity are
employed. After elution is begun; the ratio of the solvents is varied in a programmed way,
sometimes continuously and sometimes in a series of steps. Separation efficiency is greatly
enhanced by gradient elution.
IV. BASED ON SCALE OF OPERATION
1. Analytical HPLC
No recovery of individual components of substance
2.Preparative HPLC
Individual components of substance can be recovered
CONTENTS-1-21
ANALYTICAL METHOD DEVELOPMENT [15-18]
When there are no authoritative methods are available, new methods are being developed for
analysis of novel products. To analyze the existing either pharmacopoeial or non-pharmacopoeial
products novel methods are developed to reduce the cost besides time for better precision and
ruggedness. These methods are optimized and validated through trial runs. Alternate methods are
Pallavi et al. / SGVU Journal of Pharmaceutical Research & Education, 2017, 2(1), 243-260
247
proposed and put into practice to replace the existing procedure in the comparative laboratory
data with all available merits and demerits.
1. Purpose of analytical method development.[19]
Drug analysis reveals the identification characterization & determination of the drugs in
mixtures like dosage forms & biological fluids. During manufacturing process and drug
development the main purpose of analytical methods is to provide information about potency
(which can be directly related to the requirement of a known dose), impurity (related to safety
profile of the drug), bioavailability (includes key drug characteristics such as crystal form, drug
uniformity and drug release ), stability ( which indicates the degradation products ), and effect of
manufacturing parameters to ensure that the production of drug products is consistentThe
concept of quality control is intended to examine and identify a genuine and right product by
series of measures designed to avoid and get rid of errors at varied stages in production. To take
a decision to release or discard a product is based on one or more sorts of control actions.
Providing simple and analytical process for various complex formulations is a subject matter of
utmost importance. Rapid increase in pharmaceutical industries and constant production of drug
in various parts of the world has brought a quick rise in demand for new analytical techniques in
the pharmaceutical industries as a consequence, analytical method development has become the
basic activity of analysis in a quality control laboratory. The reasons for the development of
novel methods of drug analysis are:
a) When there is no official drug or drug combination available in the pharmacopoeias.
b) When there is no decorous analytical process for the existing drug in the literature due to
patent regulations.
c) When there are no analytical methods for the formulation of the drug due to the interference
caused by the formulation excipients.
d) Analytical methods for the quantitation of the analyte in biological fluids are found to be
unavailable.
e) The existing analytical procedures may need costly reagents and solvents. It may also involve
burdensome extraction and separation procedures.
2. Steps for the development of the method
Development procedure follows with the proper documentation. All data relating to these studies
must be recorded either in laboratory notebook or in an electronic database.
3. Analyte standard characterization
a) All known important information about the analyte and its structure that is to say physico-
chemical properties like solubility, optical isomerism etc., is collected.
b) The standard analyte (≈100 % purity) is obtained. Necessary arrangement is to be made for the perfect storage (refrigerator, desiccators, and freezer).
c) In the sample matrix when multiple components are to be analyzed, the number of
components is noted duly presenting the data and the accessibility of standards is estimated.
Pallavi et al. / SGVU Journal of Pharmaceutical Research & Education, 2017, 2(1), 243-260
248
d) Methods like spectroscopic, HPLC, GC, MS etc., are considered when matched with the
sample stability.
4. Method requirements
The requirements of the analytical method need to develop the analytical figures of merit such
as linearity, selectivity, range, accuracy, precision, detection limits etc., shall be defined.
5. Literature search and prior methodology
All the information of literature connected with the drug is reviewed for physico-chemical
properties, synthesis, solubility and appropriate analytical methods with reference to relevant
books, journals, USP/NF, AOAC and ASTM publications and it is highly convenient to search
Chemical Abstracts Service automated computerized literature.
6. Choosing a method
a) Duly utilizing the information available from the literature, methodology is evolved since the
methods are changed wherever required. Occasionally it is imperative to get additional
instrumentation to develop, modify or reproduce and validate existing procedures for analytes
and samples.
b) If there are no past suitable methods available to analyze the analyte to be examined.
7. Instrumental setup and initial studies
Installation, operational and performance qualification of instrumentation with reference to
laboratory standard operating procedures is verified by setting up appropriate instrumentation.
8. Optimization
While performing optimization, one parameter is changed at a time and a set of conditions are
isolated, before utilizing trial and error approach. The said work need to be accomplished basing
on a systematic methodical plan duly observing all steps and documented with regard to dead
ends.
9. Documentation of analytical figures of merit
The actual decided analytical figures of merit like Limit of quantitation, Limit of detection,
linearity, time taken for analysis, cost, preparation of samples etc. are also documented.
10. Evaluation of development method with real samples
The sample solution should lead to unequivocal, total identification of the peak interest of the
drug apart from all other matrix components.
11. Estimation of percent recovery of real samples and demonstration of quantitative
sample analysis
Percent recovery of spiked, genuine standard drug into a sample matrix which contains no
analyte is estimated. Optimization to reproducibility of recovery (average ± standard deviation)
from sample to sample has to be showed. It is not necessary to get 100% recovery so far as the
results are reproducible to recognize with a high degree of certainty.
Pallavi et al. / SGVU Journal of Pharmaceutical Research & Education, 2017, 2(1), 243-260
249
Steps involve in method development are:
1. Understand the physicochemical properties of drug molecule.
2. Set up HPLC conditions.
3. Preparation of sample solution for method development. /
4. Method optimization.
5. Validation of method
1. Understand the physicochemical properties of drug molecule
Physicochemical properties of a drug molecule play an important role in method development.
For Method development one has to study the physical properties like solubility, polarity, pKa
and pH of the drug molecule. Polarity is a physical property of a compound. It helps an analyst,
to decide the solvent and composition of the mobile phase. In a nonpolar covalent bond, the
electrons are shared equally between two atoms. A polar covalent bond is one in which one atom
has a greater attraction for the electrons than the other atom.
The solubility of molecules can be explained on the basis of the polarity of molecules. Polar, e.g.
water, and nonpolar, e.g. benzene, solvents do not mix. In general, like dissolves like i.e.,
materials with similar polarity are soluble in each other. Selection of diluents is based on the
solubility of analyte. The analyte must be soluble in the diluents and must not react with any of
the diluent components. pH and pKa plays an important role in HPLC method development. The
pH value is defined as the negative of the logarithm to base 10 of the concentration of the
hydrogen ion.
pH = - log10[H3O+]
The acidity or basicity of a substance is defined most typically by the pH value. Selecting a
proper pH for ionizable analytes often leads to symmetrical and sharp peaks in HPLC. Sharp,
symmetrical peaks are necessary in quantitative analysis in order to achieve low detection limits.
2. Set up HPLC conditions
A buffer is a partially neutralised acid which resists changes in pH. Salts such as Sodium Citrate
or Sodium Lactate are normally used to partially neutralise the acid. Buffering Capacity is the
ability of the buffer to resist changes in pH.
(i) Buffering Capacity increases as the molar concentration (molarity) of the buffer salt/acid
solution increases.
(ii) The closer the buffered pH is to the pKa, the greater the Buffering Capacity.
(iii) Buffering Capacity is expressed as the molarity of Sodium Hydroxide required to increase
pH by 1.0.
Consideration of the affect of pH on analyte retention, type of buffer to use, and its
concentration, solubility in the organic modifier and its affect on detection are important in
reversed-phase chromatography (RPC) method development of ionic analytes. An improper
choice of buffer, in terms of buffering species, ionic strength and pH, can result in poor or
irreproducible retention and tailing in reverse-phase separation of polar and ionizable
compounds8, 9
.
Pallavi et al. / SGVU Journal of Pharmaceutical Research & Education, 2017, 2(1), 243-260
250
Buffer selection
Choice of buffer is typically governed by the desired pH. The typical pH range for reversed-
phase on silica-based packing is pH 2 to 8. It is important that the buffer has a pKa close to the
desired pH since buffer controls pH best at their pKa. A rule is to choose a buffer with a pKa
value <2 units of the desired mobile phase Ph.
General considerations during buffer selection:
1. Phosphate is more soluble in methanol/water than in acetonitrile/water or THF/water.
2. Some salt buffers are hygroscopic. This may lead to changes in the chromatography (increased
tailing of basic compounds, and possibly selectivity differences).
3. Ammonium salts are generally more soluble in organic/water mobile phases·
4. TFA can degrade with time, is volatile, absorbs at low UV wavelengths.
5. Microbial growth can quickly occur in buffered mobile phases that contain little or no organic
modifier. This growth will accumulate on column inlets and can damage chromatographic
performance.
6. At pH greater than 7, phosphate buffer accelerates the dissolution of silica and severely
shortens the lifetime of silica-based HPLC columns. If possible, organic buffers should be used
at pH greater than 7.
7. Ammonium bicarbonate buffers usually are prone to pH changes and are usually stable for
only 24 to 48 hours. The pH of this mobile phase tends to become more basic due to the release
of carbon dioxide.
8. After buffers are prepared, they should be filtered through a 0.2-μm filter. 9. Mobile phases should be degassed.
Buffer selection
Generally, a buffer concentration of 10-50 mM is adequate for small molecules. Generally, no
more than 50% organic should be used with a buffer. This will depend on the specific buffer as
well as its concentration. Phosphoric acid and its sodium or potassium salts are the most common
buffer systems for reversed-phase HPLC. Phosphonate buffers can be replaced with sulfonate
buffers when analyzing organophosphate compounds10, 11.
Selection of detector
Detector is a very important part of HPLC. Selection of detector depends on the chemical nature
of analytes, potential interference, limit of detection required, availability and/or cost of detector.
UV-Visible detector is versatile, dual-wavelength absorbance detector for HPLC. This detector
offers the high sensitivity required for routine UV-based applications to low-level impurity
identification and quantitative analysis. Photodiode Array (PDA) Detector offers advanced
optical detection for Waters analytical HPLC, preparative HPLC, or LC/MS system solutions. Its
integrated software and optics innovations deliver high chromatographic and spectral sensitivity.
Refractive Index (RI) Detector offers high sensitivity, stability and reproducibility, which make
this detector the ideal solution for analysis of components with limited or no UV absorption.
Pallavi et al. / SGVU Journal of Pharmaceutical Research & Education, 2017, 2(1), 243-260
251
Multi-Wavelength Fluorescence Detector offers high sensitivity and selectivity fluorescence
detection for quantitating low concentrations of target compounds12.
Mobile phase
Mobile Phase Reservoirs
• Inert container with inert lines leading to the pump are required.
• Reservoir filters (2-10 mm) at reservoir end of solvent delivery lines
• Degassed solvent
- Vacuum filtration
- Sparge with inert gas (N2 or He)
- Ultrasonic under vacuum
Isocratic elution:
A separation that employs a single solvent or solvent mixture of constant composition.
Gradient elution:
Here two or more solvent systems that differ significantly in polarity are employed. After elution
is begun; the ratio of the solvents is varied in a programmed way, sometimes continuously and
sometimes in a series of steps. Separation efficiency is greatly enhanced by gradient elution.
The mobile phase effects resolution, selectivity and efficiency. In reverse phase chromatography,
the mobile phase consists of an aqueous buffer and a non-UV active water miscible organic
solvent. The effect of the organic and aqueous phase and the proportions in which they are mixed
will affect the analysis of the drug molecule. Selection of the mobile-phase and gradient
conditions is dependent on the ionogenic nature of the analyte and the hydrophobicity of the
analytes in the mixture respectively. The aqueous buffer serves several purposes. At low pH, the
mobile phase protonates free silanols on the column and reduces peak tailing. At sufficiently low
pH basic analytes are protonated; when ionized the analyte will elute more quickly but with
improved peak shape. Acidic analytes in buffers of sufficiently low pH will remain uncharged,
increasing retention. Conversely, at higher pH neutral basic compounds will be more retained,
and ionized acidic compounds will elute earlier. Peak splitting may be observed if the pKa of a
compound is similar to the pKa of the buffer, and the analyte elutes as both a charged and
uncharged species. The pH of a buffer will not greatly affect the retention of non-ionizable
sample components.
3. Preparation of sample solutions for method development
The drug substance being analyzed should be stable in solution (diluent). During initial method
development, preparations of the solutions in amber flasks should be performed until it is
determined that the active component is stable at room temperature and does not degrade under
normal laboratory conditions. The sample solution should be filtered; the use of a 0.22 or 0.45
μm pore-size filter is generally recommended for removal of particulates. Filtration is a
preventive maintenance tool for HPLC analyses.17, 18, 19, 20
Pallavi et al. / SGVU Journal of Pharmaceutical Research & Education, 2017, 2(1), 243-260
252
Sample preparation is a critical step of method development that the analyst must investigate.
The effectiveness of the syringe filters is largely determined by their ability to remove
contaminants/insoluble components without leaching undesirable artifacts (i.e., extractables) into
the filtrate. If any additional peaks are observed in the filtered samples, then the diluent must be
filtered to determine if a leachable component is coming from the syringe filter housing/filter.
4. Method optimization
The experimental conditions should be optimized to get desired separations and sensitivity after
getting appropriate separations. Stability indicating assay experimental conditions will be
achieved through planned/systemic examination on parameters including pH (if ionic), mobile
phase components and ratio, gradient, flow rate, sample amounts, Injection volume and diluents
solvent type.
Validation of method
Validation of an analytical procedure is the process by which it is established, by laboratory
studies, that the performance characteristics of the procedure meet the requirements for its
intended use. The methods validation process for analytical procedures begins with the planned
and systematic collection by the applicant of the validation data to support analytical
procedures21. All analytical methods that are intended to be used for analyzing any clinical
samples will need to be validated. The validation of analytical methods is done as per ICH
guidelines.
Components of method validation
The following are typical analytical performance characterstics which may be tested during
methods validation:
1. System Suitability
2. Accuracy
3. Precision
4. Repeatability
5. Intermediate precision
6. Linearity
7. Detection limit
8. Quantitation limit
9. Specificity
10. Range
11. Robustness
12. System suitability determination
13. Forced degradation studies
14. Solution stability studies
4.1. System Suitability
System suitability testing originally believed by the industry of pharmaceuticals to decide
whether a chromatographic system is being utilized day today in a routine manner in
Pallavi et al. / SGVU Journal of Pharmaceutical Research & Education, 2017, 2(1), 243-260
253
pharmaceutical laboratories where quality of results is most important which is suitable for a
definite analysis.
The parameters used in the system suitability tests (SST) report are as follows:
1. Number of theoretical plates or Efficiency (N).
2. Capacity factor (K).
3. Separation or Relative retention (α). 4. Resolution (Rs).
5. Tailing factor (T).
6. Relative Standard Deviation (RSD).
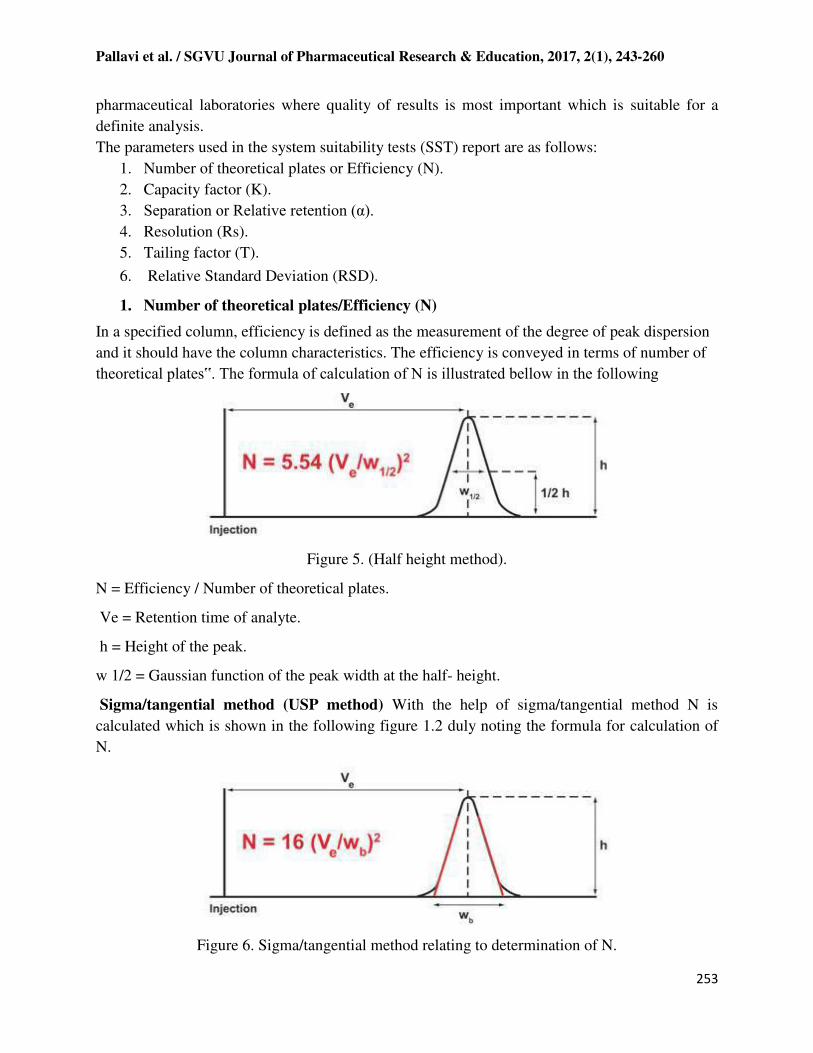
1. Number of theoretical plates/Efficiency (N)
In a specified column, efficiency is defined as the measurement of the degree of peak dispersion
and it should have the column characteristics. The efficiency is conveyed in terms of number of
theoretical plates‟. The formula of calculation of N is illustrated bellow in the following
Figure 5. (Half height method).
N = Efficiency / Number of theoretical plates.
Ve = Retention time of analyte.
h = Height of the peak.
w 1/2 = Gaussian function of the peak width at the half- height.
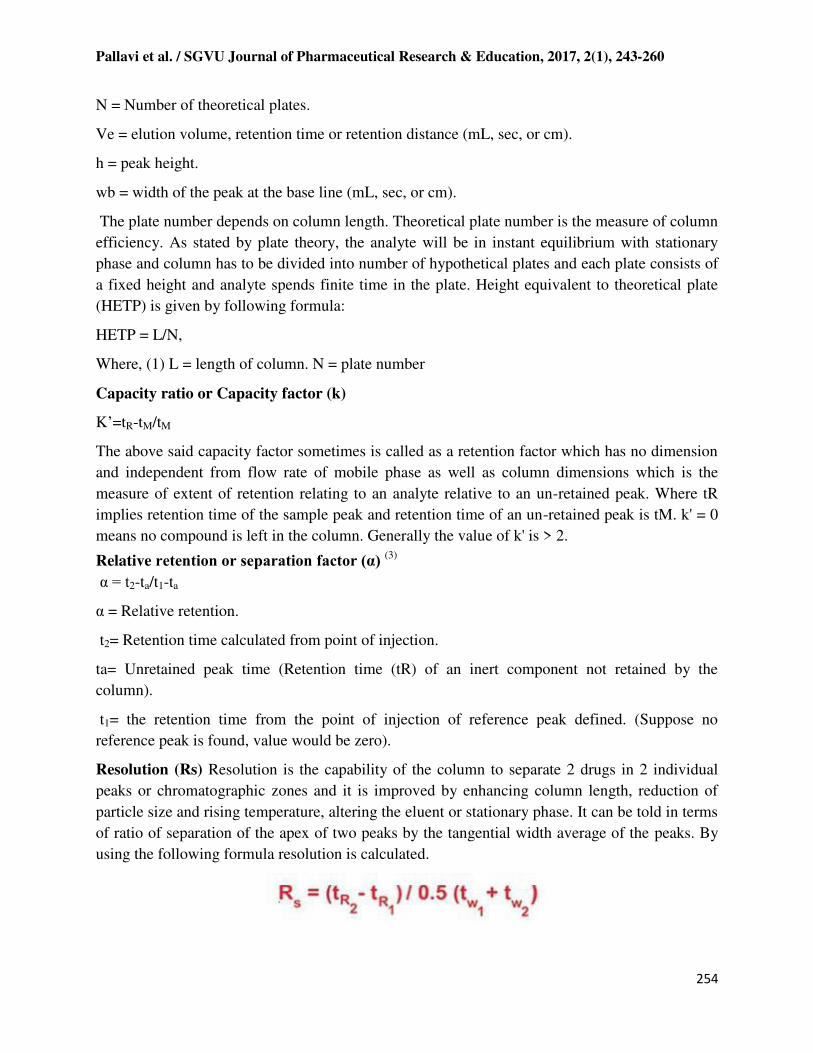
Sigma/tangential method (USP method) With the help of sigma/tangential method N is
calculated which is shown in the following figure 1.2 duly noting the formula for calculation of
N.
Figure 6. Sigma/tangential method relating to determination of N.
Pallavi et al. / SGVU Journal of Pharmaceutical Research & Education, 2017, 2(1), 243-260
254
N = Number of theoretical plates.
Ve = elution volume, retention time or retention distance (mL, sec, or cm).
h = peak height.
wb = width of the peak at the base line (mL, sec, or cm).
The plate number depends on column length. Theoretical plate number is the measure of column
efficiency. As stated by plate theory, the analyte will be in instant equilibrium with stationary
phase and column has to be divided into number of hypothetical plates and each plate consists of
a fixed height and analyte spends finite time in the plate. Height equivalent to theoretical plate
(HETP) is given by following formula:
HETP = L/N,
Where, (1) L = length of column. N = plate number
Capacity ratio or Capacity factor (k)
K’=tR-tM/tM
The above said capacity factor sometimes is called as a retention factor which has no dimension
and independent from flow rate of mobile phase as well as column dimensions which is the
measure of extent of retention relating to an analyte relative to an un-retained peak. Where tR
implies retention time of the sample peak and retention time of an un-retained peak is tM. k' = 0
means no compound is left in the column. Generally the value of k' is > 2.
Relative retention or separation factor (α) (3)
α = t2-ta/t1-ta
α = Relative retention.
t2= Retention time calculated from point of injection.
ta= Unretained peak time (Retention time (tR) of an inert component not retained by the
column).
t1= the retention time from the point of injection of reference peak defined. (Suppose no
reference peak is found, value would be zero).
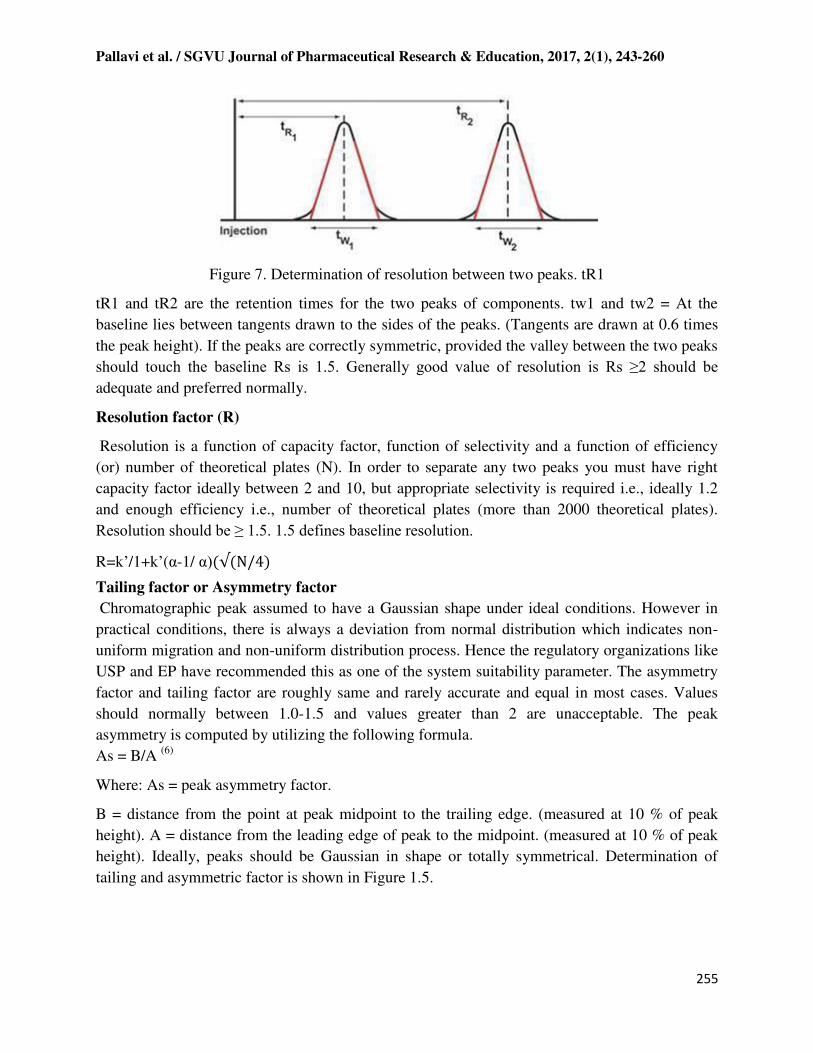
Resolution (Rs) Resolution is the capability of the column to separate 2 drugs in 2 individual
peaks or chromatographic zones and it is improved by enhancing column length, reduction of
particle size and rising temperature, altering the eluent or stationary phase. It can be told in terms
of ratio of separation of the apex of two peaks by the tangential width average of the peaks. By
using the following formula resolution is calculated.
Pallavi et al. / SGVU Journal of Pharmaceutical Research & Education, 2017, 2(1), 243-260
255
Figure 7. Determination of resolution between two peaks. tR1
tR1 and tR2 are the retention times for the two peaks of components. tw1 and tw2 = At the
baseline lies between tangents drawn to the sides of the peaks. (Tangents are drawn at 0.6 times
the peak height). If the peaks are correctly symmetric, provided the valley between the two peaks
should touch the baseline Rs is 1.5. Generally good value of resolution is Rs ≥2 should be adequate and preferred normally.
Resolution factor (R)
Resolution is a function of capacity factor, function of selectivity and a function of efficiency
(or) number of theoretical plates (N). In order to separate any two peaks you must have right
capacity factor ideally between 2 and 10, but appropriate selectivity is required i.e., ideally 1.2
and enough efficiency i.e., number of theoretical plates (more than 2000 theoretical plates).
Resolution should be ≥ 1.5. 1.5 defines baseline resolution.
R=k’/1+k’(α-1/ α) √ N/4
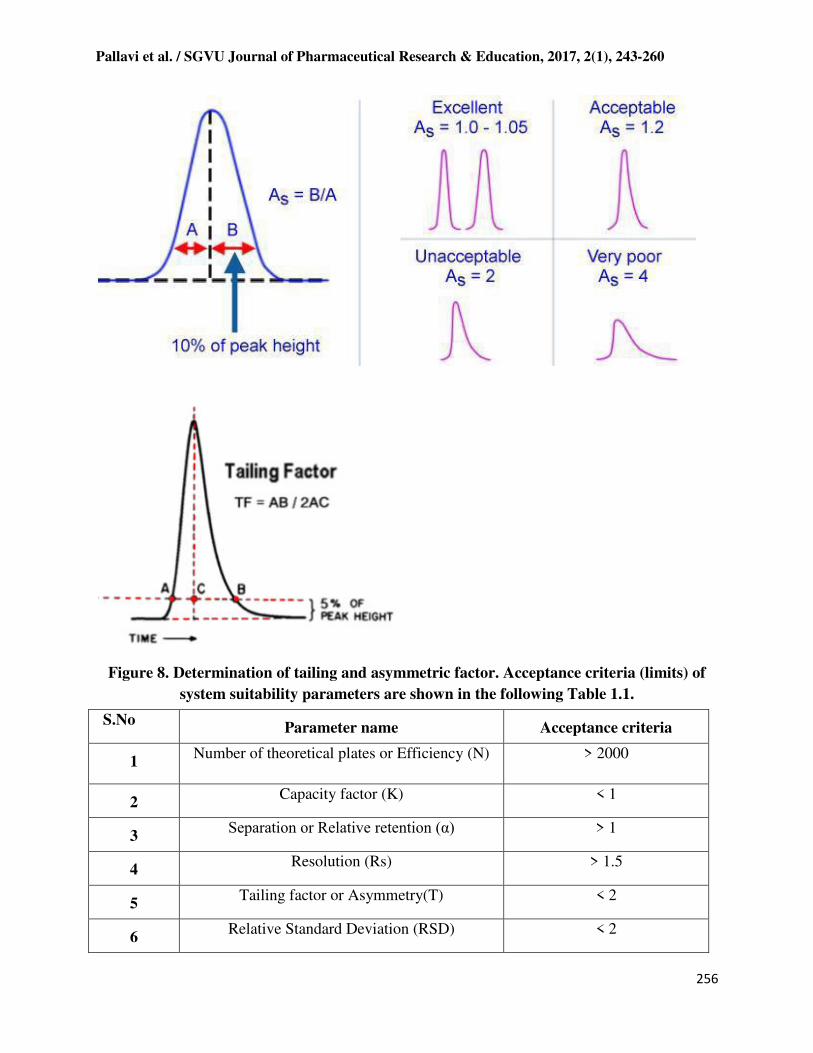
Tailing factor or Asymmetry factor
Chromatographic peak assumed to have a Gaussian shape under ideal conditions. However in
practical conditions, there is always a deviation from normal distribution which indicates non-
uniform migration and non-uniform distribution process. Hence the regulatory organizations like
USP and EP have recommended this as one of the system suitability parameter. The asymmetry
factor and tailing factor are roughly same and rarely accurate and equal in most cases. Values
should normally between 1.0-1.5 and values greater than 2 are unacceptable. The peak
asymmetry is computed by utilizing the following formula.
As = B/A (6)
Where: As = peak asymmetry factor.
B = distance from the point at peak midpoint to the trailing edge. (measured at 10 % of peak
height). A = distance from the leading edge of peak to the midpoint. (measured at 10 % of peak
height). Ideally, peaks should be Gaussian in shape or totally symmetrical. Determination of
tailing and asymmetric factor is shown in Figure 1.5.
Pallavi et al. / SGVU Journal of Pharmaceutical Research & Education, 2017, 2(1), 243-260
256
Figure 8. Determination of tailing and asymmetric factor. Acceptance criteria (limits) of
system suitability parameters are shown in the following Table 1.1.
S.No Parameter name Acceptance criteria
1 Number of theoretical plates or Efficiency (N) > 2000
2 Capacity factor (K) < 1
3 Separation or Relative retention (α) > 1
4 Resolution (Rs) > 1.5
5 Tailing factor or Asymmetry(T) < 2
6 Relative Standard Deviation (RSD) < 2
Pallavi et al. / SGVU Journal of Pharmaceutical Research & Education, 2017, 2(1), 243-260
257
SPECIFICITY
Specificity is the ability to assess unequivocally the analyte in the presence of components which
may be expected to be present. Typically these might include impurities, degradants, matrix, etc.
Lack of specificity of an individual analytical procedure may be compensated by other
supporting analytical procedure(s).
This definition has the following implications:
Identification: To ensure the identity of an analyte.
Purity Tests: Ensure that all the analytical procedures performed allow an accurate
statement of the content of impurities of an analyte, i.e. related substances test, heavy
metals, residual solvents content, etc.
Assay (content or potency): To provide an exact result which allows an accurate
statement on the content or potency of the analyte in a sample.
3. ACCURACY
The accuracy of an analytical procedure expresses the closeness of agreement between the value
which is accepted either as a conventional true value or an accepted reference value and the
value found.
This is sometimes termed trueness.
4. PRECISION
The precision of an analytical procedure expresses the closeness of agreement (degree of scatter)
between a series of measurements obtained from multiple sampling of the same homogeneous
sample under the prescribed conditions. Precision may be considered at three levels:
repeatability, intermediate precision and reproducibility.
Precision should be investigated using homogeneous, authentic samples. However, if it is not
possible to obtain a homogeneous sample it may be investigated using artificially prepared
samples or a sample solution.
The precision of an analytical procedure is usually expressed as the variance, standard deviation
or coefficient of variation of a series of measurements.
4.1. Repeatability
Repeatability expresses the precision under the same operating conditions over a short interval of
time. Repeatability is also termed intra-assay precision .
4.2. Intermediate precision
Intermediate precision expresses within-laboratories variations: different days, different analysts,
different equipment, etc.
Pallavi et al. / SGVU Journal of Pharmaceutical Research & Education, 2017, 2(1), 243-260
258
4.3. Reproducibility
Reproducibility expresses the precision between laboratories (collaborative studies, usually
applied to standardization of methodology).
5. DETECTION LIMIT
The detection limit of an individual analytical procedure is the lowest amount of analyte in a
sample which can be detected but not necessarily quantitated as an exact value.
6. QUANTITATION LIMIT
The quantitation limit of an individual analytical procedure is the lowest amount of analyte in a
sample which can be quantitatively determined with suitable precision and accuracy. The
quantitation limit is a parameter of quantitative assays for low levels of compounds in sample
matrices, and is used particularly for the determination of impurities and/or degradation products.
7. LINEARITY
The linearity of an analytical procedure is its ability (within a given range) to obtain test results
which are directly proportional to the concentration (amount) of analyte in the sample.
8. RANGE
The range of an analytical procedure is the interval between the upper and lower concentration
(amounts) of analyte in the sample (including these concentrations) for which it has been
demonstrated that the analytical procedure has a suitable level of precision, accuracy and
linearity.
9. ROBUSTNESS
The robustness of an analytical procedure is a measure of its capacity to remain unaffected by
small, but deliberate variations in method parameters and provides an indication of its reliability
during normal usage.
Forced Degradation Studies
Forced degradation or stress studies are undertaken to deliberately degrade the sample. These
studies are used to evaluate an analytical method’s ability to measure an active ingredient and its
degradation products, without interference, by generating potential degradation products. During
validation of the method, drug substance are exposed to acid, base, heat, light and oxidizing
agent to produce approximately 10% to 30% degradation of active substance. The studies can
also provide information about the degradation pathways and degradation products that could
form during storage. These studies may also help in the formulation development,
manufacturing, and packaging to improve a drug product. Reasons for carrying out forced
degradation studies include: development and validation of stability-indicating methodology,
determination of degradation pathways of drug substances and drug products, discernment of
degradation products in formulations that are related to drug substances versus those that are
related to non–drug substances.
Pallavi et al. / SGVU Journal of Pharmaceutical Research & Education, 2017, 2(1), 243-260
259
Solution Stability Studies
During validation the stability of standards and samples is established under normal conditions,
normal storage conditions, and sometimes in the instrument to determine if special storage
conditions are necessary, for instance, refrigeration or protection from light27, 28.
HPLC Derivatization Methods
Why derivatize?
Enhance detector response
Improve analyte resolution
Improve analyte peak shape
Improve analyte sensitivity
Establish analyte identity
Improve analyte stability during analysis
Change analyte physical properties
CONCLUSION
The definitions of method validation parameters are well explained. Validation as per ICH
guidelines.
It is an important procedure in the pharmaceutical industry and it is utilized to ensure that
quality is built in to the processes supporting drug development and manufacture.
This review describes the general technique of HPLC method development and validation of
optimized method. The knowledge of the pKa, pH and solubility of the primary compound
is of utmost importance prior to the HPLC method development. Final optimization can be
performed by changing the temperature, gradient slope, and flow rate as well as the type and
concentration of mobile-phase modifiers.
REFERENCES:
1. A Review on Step-by-Step Analytical Method Validation, Panchumarthy Ravisankar*
1IOSR, Journal of Pharmacywww.iosrphr.org Volume 5, Issue 10 (October 2015), PP. 07-19.
2. Development and validation of HPLC method - a review,Vibha Guptaet al, International
Research Journal of Pharmaceutical and Applied Sciences , 2012; 2(4):17-25.
3. A Review: HPLC Method Development and Validation,Santosh Kumar Bhardwaj *et al.
4. International Journal of Analytical and Bioanalytical Chemistry, accepted 20 November
2015.
5. Method Development: a Guide to Basics Quantitative & Qualitative HPLC, LC, GC
chromacademy.
6. Lalit V Sonawane* Bioanalytical Method Validation and Its Pharmaceutical Application- A
Review Pharmaceutica Analytica Acta 2014, 5:3Center for Drug Evaluation and Research
(CDER) Reviewer Guidance
7. ICH Topic Q 2 (R1) Validation of Analytical Procedures:Text and Methodology.
Pallavi et al. / SGVU Journal of Pharmaceutical Research & Education, 2017, 2(1), 243-260
260
8. Validation of Chromatographic Methods.Development and validation of a simple reverse
dphase HPLC-UV method for determination of oleuropein in olive leaves ,Fuad Al-
Rimawi*Elsevier,science direct j ournal of food and drug analysis 22( 2014 ) 285 -289.
9. "Principles of Instrumental Analysis", 5th
edition, Harcourt Publishes Int Company, Skoog,
Holler and Nieman, Chapter 28, p.726-766.
10. "HPLC Columns" Theory, Technology and Practice. Uwe D. Neue, Wiley-VC
11. Handbook of HPLC, Vol.78, by Elena Katz et al. Marcel Dekker Inc.
12. "Instrumental Methods of Chemical Analysis", 5th Edition, Galen W. Ewing, McGraw Hill
Book Company 1988.
13. "HPLC in Pharmaceutical Industry", Fong and Long, Marcel Dekker Series
14. "Instrumental Method of Chemical Analysis" by Chatwal Anand, Himalaya Publishing
House, p.no.615-623.
15. "Practical Pharmaceutical Chemistry", 4th
edition, Part 2, by Beckett and Stenlake, CBS
Publishers and Distributors, P.No.157-174.
16. Govt. of India, Ministry of Health and Family Welfare. Vol. 2. Delhi: Publication by
Controller of Publication; 2007. Indian Pharmacopoeia; pp. 484–554.
17. British Pharmacopoeia. (International ed.) 1993; Vol. 1:429, 483. Published on the
Recommendation of the Medicines Commissions Pursuant to Medicines Act 1968, 1993.
18. United States Pharmacopoeia 29 NF 24, Published on the Recommendation of the Medicines
Commissions Pursuant to Medicines, page no. 587
19. Skoog, West, Holler, Crouch, “Fundamentals of analytical chemistry”, eighth edition, 2009
(Indian edition), cengage learning India pvt ltd , New delhi, pageno. 271-280.
20. A.V Kasture, K.R Mahadik, S.G Wadodkar, H.N. More, “A textbook of pharmaceutical
analysis, Instrumental methods”, Nirali Prakashan, vol.2, 9th edition, page no. 5-7, 28-30.
Related Documents