HPHT Exploration Well Pore Pressure Prediction and Monitoring: Utilising VSP Look-Ahead, MWD Resistivity and MWD Sonic Ray Pratt 1) Peter K. Keller 2) & Solveig Lysen 3) 1) Principal Petrophysicist, TGS UK & Norway. Consultant to Talisman Norway. Formally with Amerada Hess. 2) Advisor Geophysicist, DNO AS, Norway. Formally with Amerada Hess 3) Account Leader, Halliburton, Norway A case study from the Central Graben of the North Sea Overpressure 2008 – Pressure prediction

Welcome message from author
This document is posted to help you gain knowledge. Please leave a comment to let me know what you think about it! Share it to your friends and learn new things together.
Transcript

HPHT Exploration Well
Pore Pressure Prediction and Monitoring:
Utilising VSP Look-Ahead, MWD Resistivity and MWD Sonic
Ray Pratt 1) Peter K. Keller 2) & Solveig Lysen 3) 1) Principal Petrophysicist, TGS UK & Norway. Consultant to Talisman Norway. Formally with Amerada Hess. 2) Advisor Geophysicist, DNO AS, Norway. Formally with Amerada Hess 3) Account Leader, Halliburton, Norway
A case study from the Central Graben of the North Sea
Overpressure 2008 – Pressure prediction
slide 2
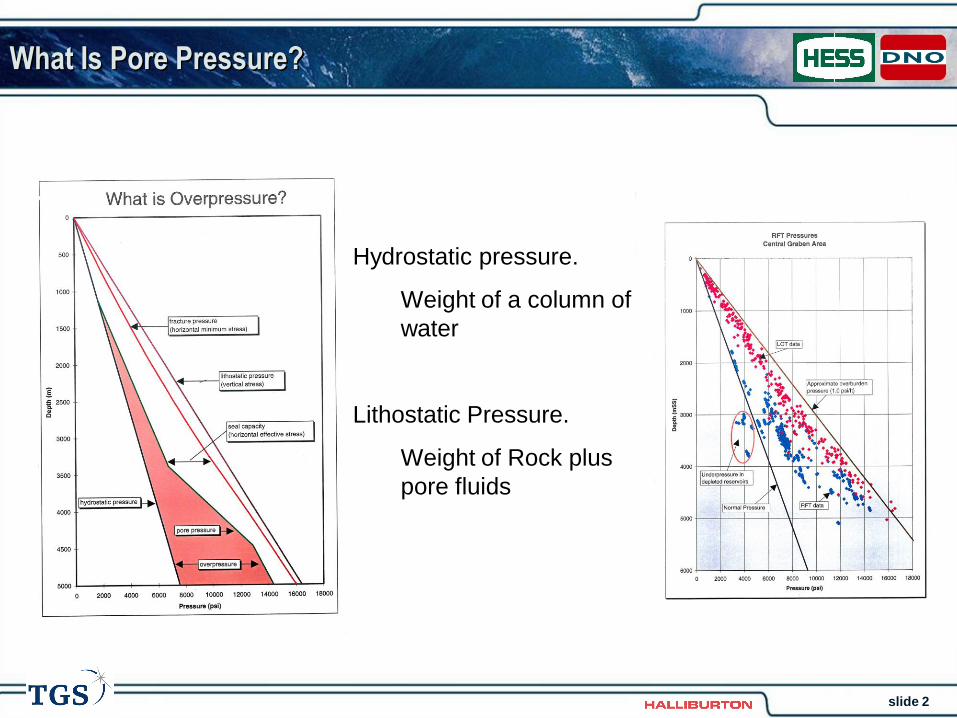
What Is Pore Pressure?
Hydrostatic pressure.
Weight of a column of
water
Lithostatic Pressure.
Weight of Rock plus
pore fluids

slide 3
HTHP Well – NPD Definition
Depth > 4000 , TVD
Estimated SIWHP > 10,000 psi (689 bar)
Estimated Temperature > 150 C
slide 4
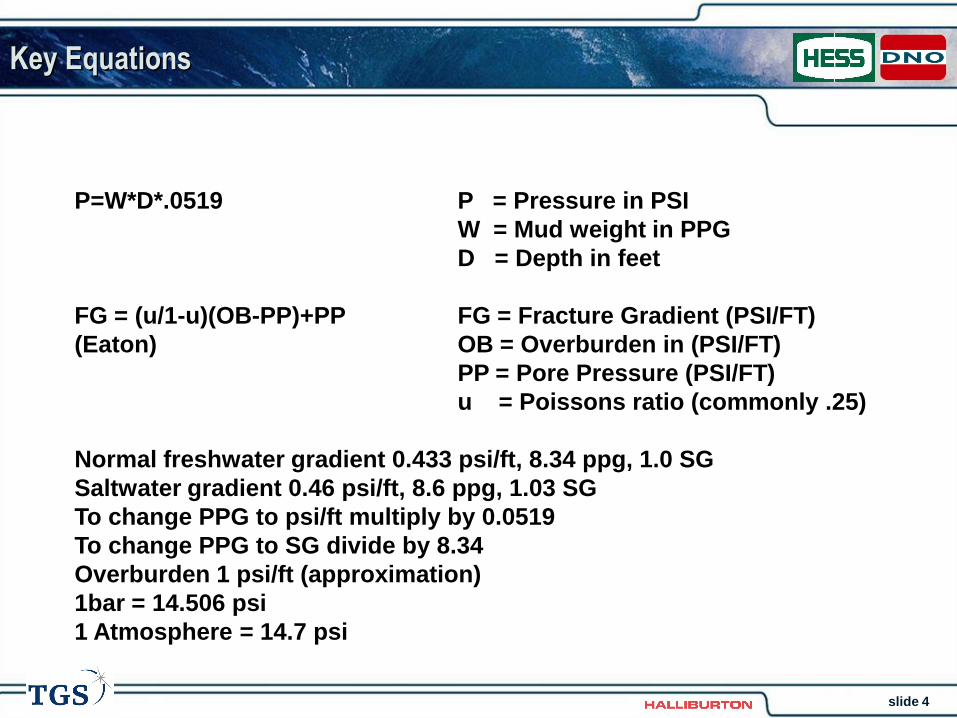
Key Equations
P=W*D*.0519 P = Pressure in PSI
W = Mud weight in PPG
D = Depth in feet
FG = (u/1-u)(OB-PP)+PP FG = Fracture Gradient (PSI/FT)
(Eaton) OB = Overburden in (PSI/FT)
PP = Pore Pressure (PSI/FT)
u = Poissons ratio (commonly .25)
Normal freshwater gradient 0.433 psi/ft, 8.34 ppg, 1.0 SG
Saltwater gradient 0.46 psi/ft, 8.6 ppg, 1.03 SG
To change PPG to psi/ft multiply by 0.0519
To change PPG to SG divide by 8.34
Overburden 1 psi/ft (approximation)
1bar = 14.506 psi
1 Atmosphere = 14.7 psi
slide 5
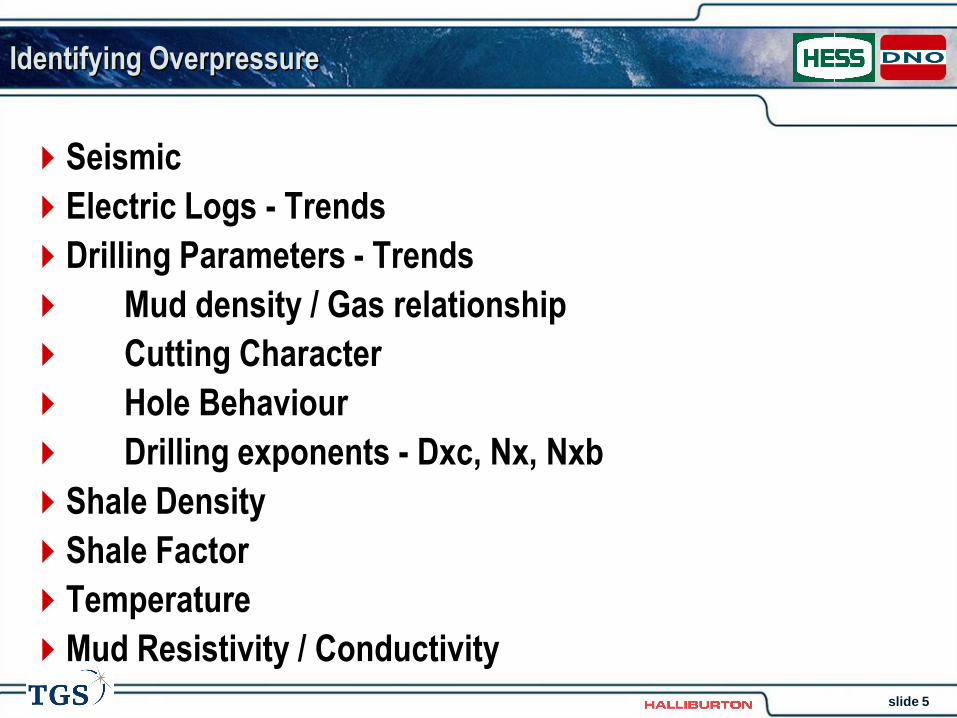
Identifying Overpressure
Seismic
Electric Logs - Trends
Drilling Parameters - Trends
Mud density / Gas relationship
Cutting Character
Hole Behaviour
Drilling exponents - Dxc, Nx, Nxb
Shale Density
Shale Factor
Temperature
Mud Resistivity / Conductivity

slide 6
Causes of Overpressure
Stress Compaction Disequilibrium
Tectonic
Fluid Volume Increase Temperature (aquathermal)
Mineralogical Changes (Chemical)
Smectite to illite, gypsum to anhydrite, calcite re-crystallisation etc
Hydrocarbon generation and cracking
Fluid Movement and Buoyancy Osmosis
Hydraulic head
Fluid density
slide 7
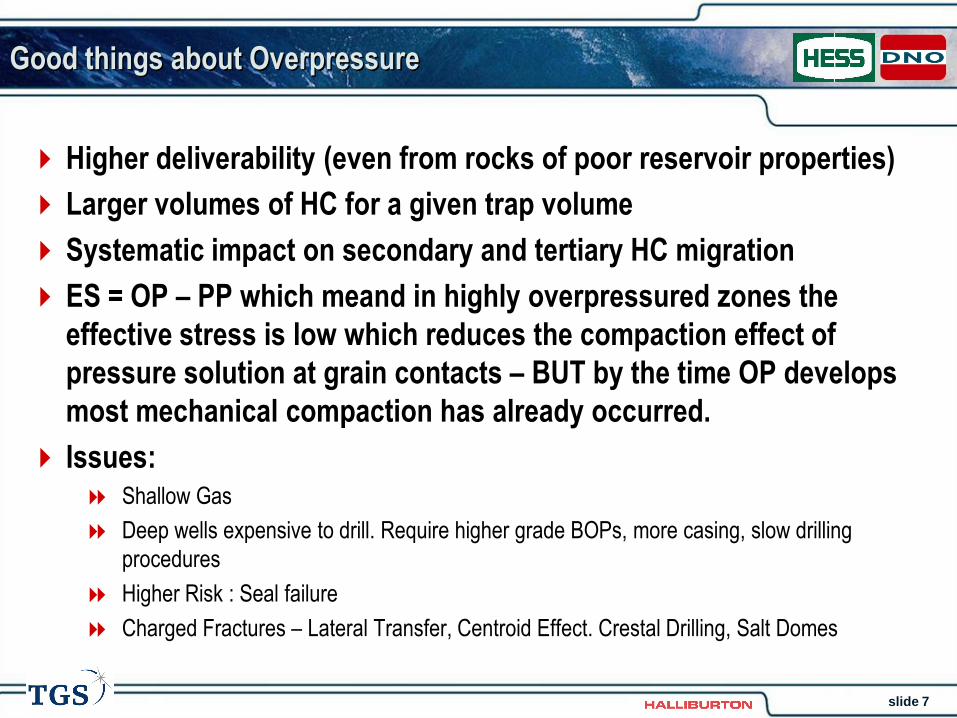
Good things about Overpressure
Higher deliverability (even from rocks of poor reservoir properties)
Larger volumes of HC for a given trap volume
Systematic impact on secondary and tertiary HC migration
ES = OP – PP which meand in highly overpressured zones the
effective stress is low which reduces the compaction effect of
pressure solution at grain contacts – BUT by the time OP develops
most mechanical compaction has already occurred.
Issues: Shallow Gas
Deep wells expensive to drill. Require higher grade BOPs, more casing, slow drilling
procedures
Higher Risk : Seal failure
Charged Fractures – Lateral Transfer, Centroid Effect. Crestal Drilling, Salt Domes
slide 8
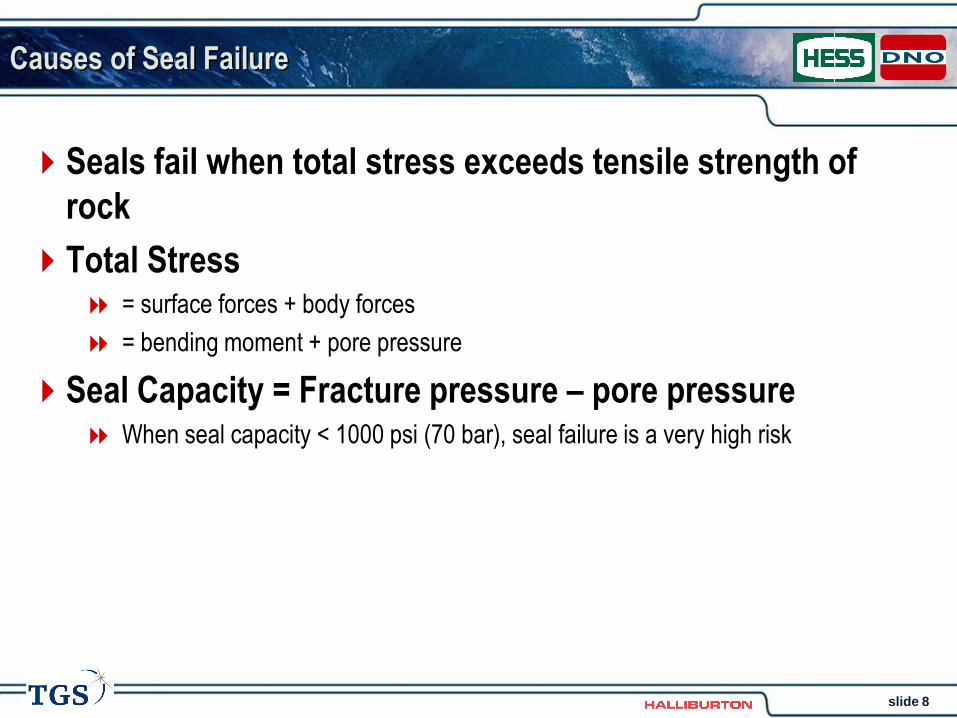
Causes of Seal Failure
Seals fail when total stress exceeds tensile strength of
rock
Total Stress = surface forces + body forces
= bending moment + pore pressure
Seal Capacity = Fracture pressure – pore pressure When seal capacity < 1000 psi (70 bar), seal failure is a very high risk
slide 9
Propogation of Fractures
Fractures provide effective conduits but offer little storage
volume
In a tight system, hydraulic fractures will propogate
upwards until they encounter a system with enough
storage volume to accommodate the excess fluids and
adequately reduce the underlying pore pressure
Upward propagation of fractures in the Central Graben is
facilitated by an upward decrease in tensile strength from
the Jurassic through the chalk.

slide 10
Central Graben Fracture Pressures

slide 11
Understand Seal Failure and understand Migration
The worse the seal the better the conduit
By mapping seal capacity potential you are also mapping
vertical migration potential
Utilize appropriate pore pressure and bending moment
criteria to identify vertical conduits

slide 12
Location Map – Well 2/5-12
N
10km
TYR Well 2/5-12
Exploration well 2/5-12 has been drilled in
2001/2002 by Amerada Hess (op.), DNO, BP,
Enterprise, TFE & Gas de France.
Purpose was to test the Late Jurassic Tyr Four-
way dip closure.
The HPHT nature was technically challenging
mainly with regard to high pore pressure and
consequent risk of loosing the kick margin.

slide 13
Composed Seismic Line Through Tyr Prospect and Adjacent
Wells
SW NE
Balder
Chalk (T & B)
BCU
J71
J63
B U Jurassic
Zechstein
Trias
Target
Sequence
Horizons
2/2-4 2/2-1 2/5-12 2/5-10
A
TYR PROSPECT
A A A

slide 14
RFT Pressures – NSCG Area

slide 15
Jurassic Pressure Regimes of the NSCG Area
Location of the well 2/5-12 between shelf and basin
opens the discussion on which pressure regime will be
encountered.
Basin pressures at reservoir depth predict pressures
close to fracture gradient with low kick tolerance.
Such a setting requires a careful well planning and
experienced operation staff.
Analogue wells from the Central Graben 2/5-6 and 2/4-
14 demonstrated consequences of operational failure.
2/5-12
Target Sequence

slide 16
Analogue Well – 2/5-6
Well Histories Lucky Case!
9 5/8" casing was set at 3539m near the base of the Chalk
Top Jurassic was encountered at 3596m
Drilling proceeded with a 15 PPG (1.8 SG) mud weight
At 3915m a small influx from thin sand was taken and controlled
Drilling proceeded to 3967m where another small sand body was encountered, and the well started to flow.
The MW was steadily increased over a number of days in an attempt to kill the well. It was eventually brought
under temporary control with a static MW of 17.1 PPG (2.05 SG). At 17.4 PPG (2.09 SG) the well started to flow
again but took losses at 55 SPM. After numerous attempts over a period of 13 days the well was killed using a
Temblok plug.
A 7" liner was set and drilling proceeded
On drilling out the liner shoe and a further 5m shale a large sand body of 17.6 PPG (2.11 SG) pore pressure
was entered
Had the liner not been set the well could have been lost!

slide 17
Analogue Well – 2/4-14
Well Histories Unlucky Case!
The 9 5/8" casing was set in the Hod Formation at 4437m. 8.5" hole was drilled with a MW of 17.34 PPG
(2.08 SG). Top Jurassic was encountered at 4702m.
Thin sandstone was drilled at 4707 and 4712m. The gas levels rose cutting the MW to 16.85 PPG (2.02
SG).
The MW was raised to 17.51 PPG (2.10 SG) and at 4714m returns were lost. Lost circulation material,
cured the loss and drilling continued with 17.43 PPG (2.09 SG) to 4734m where the well kicked.
Several attempts to kill the well failed. The drill pipe became stuck so cement was pumped to kill the
well. This was not successful and the pipe started to be forced out of the well. The shear rams were
activated and the BOPs secured. The rig left the well after 30 days of problems.
A re-entry was attempted and discovered that the high pressure had been transmitted up the annulus
and as a consequence the casing had burst at 1370m.
1 year and 3 months after the kick well 2/4-15S killed well 2/4-14!
slide 18
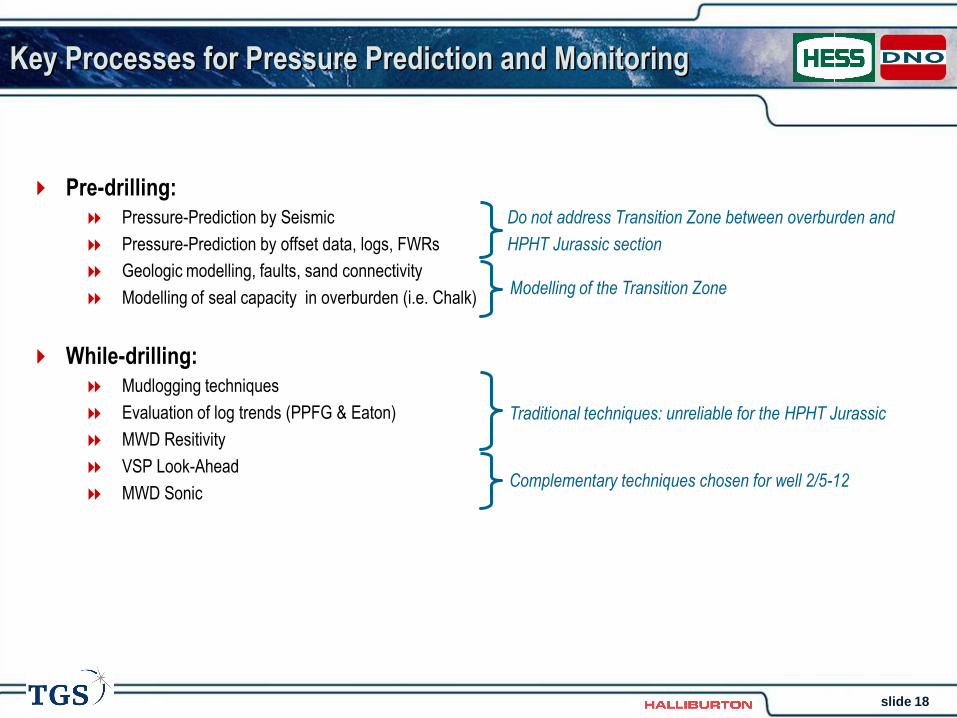
Key Processes for Pressure Prediction and Monitoring
Pre-drilling: Pressure-Prediction by Seismic Do not address Transition Zone between overburden and
Pressure-Prediction by offset data, logs, FWRs HPHT Jurassic section
Geologic modelling, faults, sand connectivity
Modelling of seal capacity in overburden (i.e. Chalk)
While-drilling: Mudlogging techniques
Evaluation of log trends (PPFG & Eaton)
MWD Resitivity
VSP Look-Ahead
MWD Sonic
Modelling of the Transition Zone
Traditional techniques: unreliable for the HPHT Jurassic
Complementary techniques chosen for well 2/5-12

slide 19
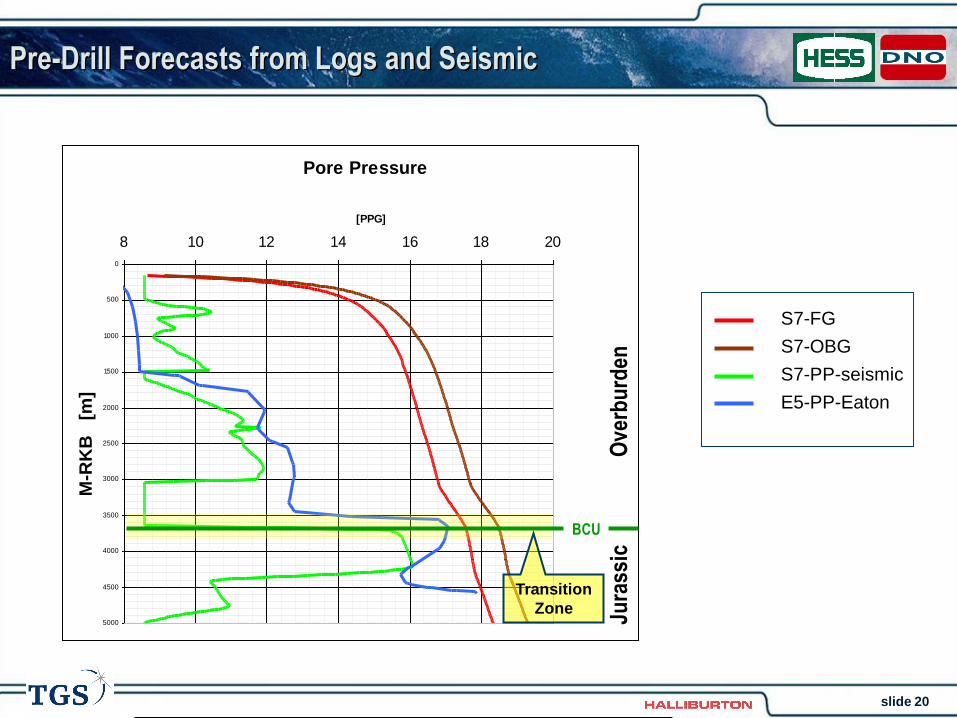
Pre-Drilling: Pressure Prediction
Seismic CSD: Complex seismic Decomposition utilises seismic attenuation to derive pore
pressure
PPRED: Pressures from Seismic Velocities. Generates a seismic line between wells.
Calibrates end points with well data. Small changes in velocity between wells will
have a major impact on PP forecast
High Res DIX and Predictive deapwater rock model
Geologic / Basin Modelling FobosPro
Basinmod
Temis
Well Log Data BP/KS multiwell study
Blaise
Sperry Sun PPFG
Limitations
Seismic
Historically poor
forecasting results.
G / B M
Complicated. Use in
planning but not a
real time tool
Log Data
Often trend line
dependent.
Generally better
after well drilled
than during
slide 20
Pore Pressure
0
500
1000
1500
2000
2500
3000
3500
4000
4500
5000
8 10 12 14 16 18 20
[PPG]
M-R
KB
[
m]
Pre-Drill Forecasts from Logs and Seismic
BCU
Transition
Zone O
verb
urd
en
Jura
ssic
S7-FG
S7-OBG
S7-PP-seismic
E5-PP-Eaton

slide 21
Modelling of Overburden Pressures - NSCG
2000
2200
2400
2600
2800
3000
3200
3400
5500 6000 6500 7000 7500
2_8-14
2_4-2
2_4-3
2_11-10st2
2_8-12
2_8-8
2_8-6
2_7-30
2_7-16
2_7-13
2_7-10
2_7-1
2_5-8
ValTorEk
Valhall Virgin Pressure
Hod Virgin Pressure
Hod Depletion
Ekofisk Virgin Pressure Dep
th s
ub
sea (
m)
Chalk Fields
slide 22
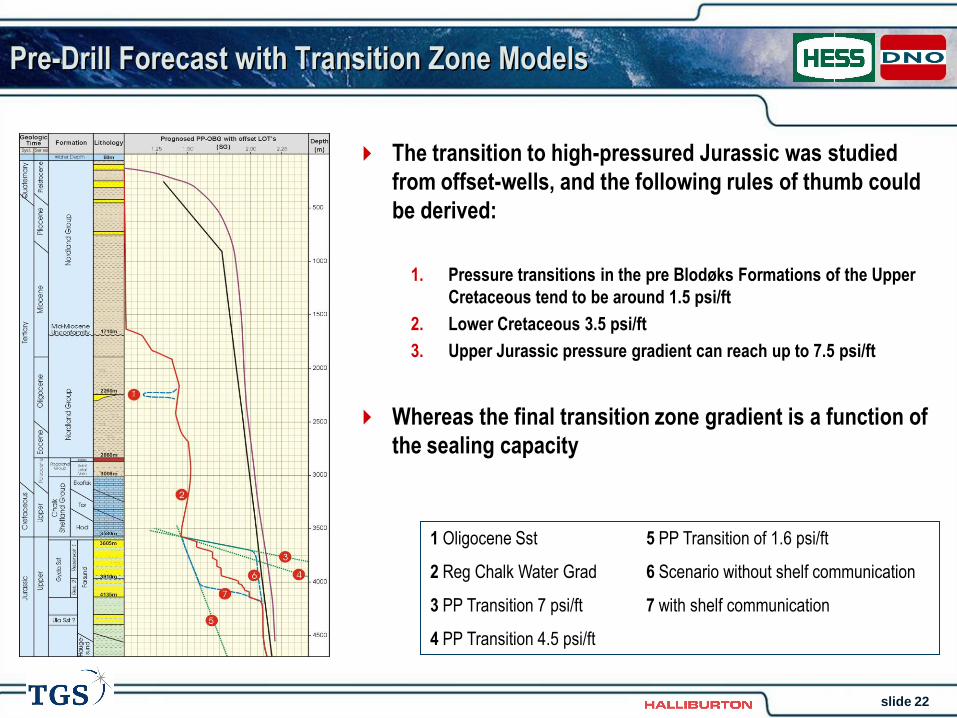
Pre-Drill Forecast with Transition Zone Models
The transition to high-pressured Jurassic was studied
from offset-wells, and the following rules of thumb could
be derived:
1. Pressure transitions in the pre Blodøks Formations of the Upper
Cretaceous tend to be around 1.5 psi/ft
2. Lower Cretaceous 3.5 psi/ft
3. Upper Jurassic pressure gradient can reach up to 7.5 psi/ft
Whereas the final transition zone gradient is a function of
the sealing capacity
1 Oligocene Sst 5 PP Transition of 1.6 psi/ft
2 Reg Chalk Water Grad 6 Scenario without shelf communication
3 PP Transition 7 psi/ft 7 with shelf communication
4 PP Transition 4.5 psi/ft
slide 23
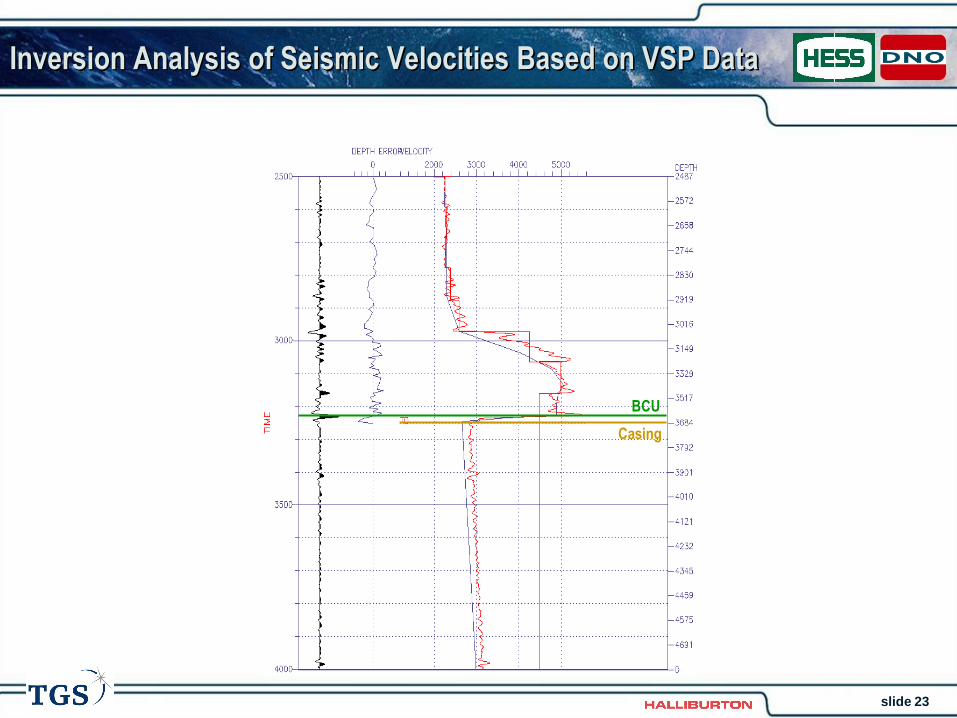
Inversion Analysis of Seismic Velocities Based on VSP Data
BCU
Casing

slide 24
Corridor Stack of the VSP Look-Ahead
sm6
J64
sm1
sm2
sm3
sm7
sm8
BUJ
sm10
sm11
sm5
sm1
A
BCU
J71
TD
VS
P
VS
P lo
ok
-ahea
d
CSTK
8-80Hz
2/5-12
8 1/2”
12 1/4”
TIME

slide 25
Actual Versus Forecasted PP for Transition Zone and
Jurassic
8 9 10 11 12 13 14 15 16 17 18 19 20
3500
3600
3700
3800
3900
4000
4100
4200
Pore Pressure [PPM]
MD
-RK
B
[m]
S7-PP
S7-FG
S7-OBG
BP_KS-PP
Hess-PP & forecast
S7-PP-VSP
PPFG-PP_Dt-VSP
PPFG-PP-RT
PPFG-PP-DT
Mud Wt
LOT

slide 26
Conclusions
2/5-12 was a good example of how to drill a HTHP exploration well. The primary targets were explored and a decision to TD was made in a timely and safe manner, within AFE. Location of the 9 5/8 casing was crucial
Detailed planning of the well design is essential to ensure good picks for casing shoes and operational limits for drilling
Benefits of look-ahead VSP
Highlights potential lithological changes ahead of the bit.
Look-ahead VSP data can be analysed for pressure to update pore pressure forecasts
Sonic and VSP look-ahead allows update of depth model and very accurate depth prognosis before reaching bed boundaries or potential pressure changes
MWD Sonic and resistivity are very useful for pressure analysis whilst drilling. Having two data sets using different measurements for analysis improves the confidence of the analysis
MWD sonic is more reliable than resistivity for pressure prediction, as the sonic velocity is far less susceptible to changes in fluid and rock properties than the resistivity measurement
All of the pressure analysis tools have limitations, therefore reliance on one method is not advisable. Utilising several techniques gives a lot more confidence in the analysed results when they are in close agreement. Increasing background drill gas can be indicative of increasing pore pressure in the lowermost chalk and Lower Cretaceous.
Modelling the pressures utilising offset data is important where the analysis is thought to be weak or problematic. Detailed offset studies are essential to capture this information. Capillary pressure measurements can help determine the sealing capacity of differing lithologies
OBG and FG from Seismic were excellent. The PP was very poor in the Tertiary and Cretaceous, but good in the Jurassic. It gives averaged values for large intervals and is not responsive to transition zones.
Related Documents


