2006 HP Annual Report [Cover depicts a solid green background with a thin white horizontal stretch bar wrapping around the cover. The HP logo sits in the lower right-hand corner. 2006 HP Annual Report sits within the white bar.] Dear Fellow Stockholders, HP made solid progress this past year toward our goal of becoming the world’s leading IT company. We want to create the best technology on the planet — and be the best at selling, servicing and supporting that technology. To get there, we are focusing our portfolio of products and services on simplifying our customers’ experiences with technology and helping them do what they want to do, wherever they are. For example, in our enterprise business, we are working on helping our customers run their businesses with automated, super-efficient data centers. In our imaging and printing business, we are helping customers more rapidly achieve the benefits of printing from a digital source in areas such as commercial printing and retail photo printing. And in our personal systems business, we are working to empower customers with simple, always-connected, mobile computing experiences at work, at home or on the go. While we worked toward these strategic goals, we also improved the health of our financials. Our revenue increased 6 percent in fiscal year 2006 to $91.7 billion. Non-GAAP EPS increased 47 percent to $2.38¹, and GAAP diluted EPS increased 166 percent to $2.18. And we generated record cash flow from operations of $11.4 billion. We also achieved the most balanced profit mix by business group that HP has seen in years. Yet, we still have a lot more work ahead. We are a company that is transforming — not one that has transformed. We have to make it easier for customers to do business with HP. We have to capture more growth opportunities, improve our capital allocation, become more efficient and continue to execute consistently. As we work through this process, we will continue to build on our rich legacy of responsible conduct wherever we do business. We will adhere to our core values and operate every day with uncompromising integrity. Operating Framework Last year, we introduced an operating framework for managing the company and guiding our strategic decisions. It is based on the disciplined management of three interrelated business levers: targeted growth, operational efficiency and capital strategy. We took several steps forward this year in each of these areas, but also see room for more improvement. Targeted Growth We have put a lot of effort into analyzing our future growth opportunities by customer segment, by business group and by geography. One way for us to capitalize on these opportunities is to improve our go-to-market effectiveness. For years, the company has operated under the philosophy that if we build great technology, customers will seek it out. While that has served us well, we are confident we can improve our growth prospects if we become as good at selling our technology as we are at inventing it. We have comprehensively analyzed our sales force to ensure we have enough account managers with the right skills, placed on the right accounts and in the right regions, and aligned with the right growth opportunities. We think this will improve sales results and lower field selling costs. Our channel partners are another area where HP can improve go-to-market effectiveness. Last year, we rolled out several new programs to increase clarity and accountability in how we serve customers. We added new incentive plans to drive more profitable growth for both HP and our partners — encouraging greater attach rates and sales of bundled HP solutions. However, we still have work to do to

hp 2006 annual report (text only)
Jul 07, 2015
Welcome message from author
This document is posted to help you gain knowledge. Please leave a comment to let me know what you think about it! Share it to your friends and learn new things together.
Transcript

2006 HP Annual Report [Cover depicts a solid green background with a thin white horizontal stretch bar wrapping around the cover. The HP logo sits in the lower right-hand corner. 2006 HP Annual Report sits within the white bar.]
Dear Fellow Stockholders, HP made solid progress this past year toward our goal of becoming the world’s leading IT company. We want to create the best technology on the planet — and be the best at selling, servicing and supporting that technology. To get there, we are focusing our portfolio of products and services on simplifying our customers’ experiences with technology and helping them do what they want to do, wherever they are. For example, in our enterprise business, we are working on helping our customers run their businesses with automated, super-efficient data centers. In our imaging and printing business, we are helping customers more rapidly achieve the benefits of printing from a digital source in areas such as commercial printing and retail photo printing. And in our personal systems business, we are working to empower customers with simple, always-connected, mobile computing experiences at work, at home or on the go. While we worked toward these strategic goals, we also improved the health of our financials. Our revenue increased 6 percent in fiscal year 2006 to $91.7 billion. Non-GAAP EPS increased 47 percent to $2.38¹, and GAAP diluted EPS increased 166 percent to $2.18. And we generated record cash flow from operations of $11.4 billion. We also achieved the most balanced profit mix by business group that HP has seen in years. Yet, we still have a lot more work ahead. We are a company that is transforming — not one that has transformed. We have to make it easier for customers to do business with HP. We have to capture more growth opportunities, improve our capital allocation, become more efficient and continue to execute consistently. As we work through this process, we will continue to build on our rich legacy of responsible conduct wherever we do business. We will adhere to our core values and operate every day with uncompromising integrity. Operating Framework Last year, we introduced an operating framework for managing the company and guiding our strategic decisions. It is based on the disciplined management of three interrelated business levers: targeted growth, operational efficiency and capital strategy. We took several steps forward this year in each of these areas, but also see room for more improvement. Targeted Growth We have put a lot of effort into analyzing our future growth opportunities by customer segment, by business group and by geography. One way for us to capitalize on these opportunities is to improve our go-to-market effectiveness. For years, the company has operated under the philosophy that if we build great technology, customers will seek it out. While that has served us well, we are confident we can improve our growth prospects if we become as good at selling our technology as we are at inventing it. We have comprehensively analyzed our sales force to ensure we have enough account managers with the right skills, placed on the right accounts and in the right regions, and aligned with the right growth opportunities. We think this will improve sales results and lower field selling costs. Our channel partners are another area where HP can improve go-to-market effectiveness. Last year, we rolled out several new programs to increase clarity and accountability in how we serve customers. We added new incentive plans to drive more profitable growth for both HP and our partners — encouraging greater attach rates and sales of bundled HP solutions. However, we still have work to do to
make sure these programs achieve their intended outcomes. We are investing in training our sales force and our channel partners to become better strategic partners to our customers — so they can have the same high-quality experience around the globe whether they work with HP or with our partners. Earning customer loyalty and respect through better experiences is critical to improving our growth potential. Finally, to drive growth and achieve a higher return on investment, we need to better align marketing with sales — targeting investments where we want to generate more demand and interacting with customers where they spend more of their time, such as on the Internet. Operational Efficiency As we pursue more growth, we will simultaneously improve our efficiency to increase our speed and effectiveness in the marketplace. Last year, we streamlined our company’s structure, reduced organizational matrices and removed approximately three layers of management. We folded our Global Operations function into our business groups to increase accountability, efficiency and speed, and we lowered costs by substantially completing our restructuring program. The full cost benefit of these efforts will be seen in fiscal year 2007. Moving forward, we see many more opportunities to lower costs. We view our total cost envelope as revenue minus operating profit. In this context, we think the $85.1 billion in fiscal year 2006 costs includes a number of areas to optimize — from real estate to procurement to IT to supply chain, to name just a few. We know a lot more today than we did last year. In real estate alone, we now know costs by employee, business group, country, region and site. We are applying this level of analysis to virtually all areas of the company, scrutinizing how every expense supports our strategy. Capital Strategy As we lower costs, we free up capital to invest in growth. We plan to use these resources to grow market share, increase margins and invest in long-term competitiveness. One example of where we are investing financial capital is in our IT operations. We expect this to result in four business benefits. First, we will lower our costs while increasing capability. Second, we will get better information for running our business and serving customers. Third, we will lower our business risk by having better control of our infrastructure. And fourth, we will do it all with HP technology. We will make our own IT organization the world’s best showcase of HP technology, turning what we are doing for ourselves into a comprehensive offering for customers. Another place we are investing in for growth is our employees. HP is made up of great people who do great work every day. To improve our talent advantage, we will offer programs that give them opportunities to grow and increase their ability to compete. We will provide incentives and rewards to employees who focus on the customer, deliver on their objectives and help HP win. At the end of the day, HP’s success is a direct function of our employees’ success. Business Group Strategies Having a portfolio of three globally scaled businesses creates additional leverage points in several areas across the company, including research and development, sales, marketing and operations. Each of HP’s business groups has a strategy for driving market leadership, and all take advantage of these leverage points in the execution of their strategies. Imaging and Printing Our imaging and printing business is focused on driving the transformation of a mostly analog printing world to one that is all digital. Simply put, the opportunity is to expand our leadership in printers to leadership in printing. For example, as the Internet continues to foster the sharing and printing of digital images, our online photo service, Snapfish by HP, positions us well to lead this new printing ecosystem — powered entirely by HP infrastructure — from our commercial printers and enterprise infrastructure to our retail kiosks and partnerships.

Last year, we acquired the assets of Scitex Vision, a leader in industrial ultra-wide-format digital printing. As we integrate Scitex’s capabilities with the high-end digital commercial printing capabilities of HP’s Indigo business unit, we expect HP to become the dominant player in both of these rapidly growing digital printing markets. We also introduced Edgeline printing, one result of a multi-year, $1.6 billion R&D investment in HP inkjet technology. Edgeline printing broadens our position in the enterprise and graphic arts printing markets, offering customers the high quality and low total cost of ownership of ink with the speed of laser printing. Additionally, as enterprise printing is increasingly moving under the control of chief information officers, we began hiring an enterprise printing sales force to better address expanded printing opportunities, such as outdoor signage, industrial printing, digital publishing and vertical printing applications, and to sell print management solutions more effectively. We intend to grow our market share in these areas. Personal Systems Our personal systems group is focused on driving highly personalized, always-connected, mobile computing experiences across our customer segments. People around the world are increasingly using smart mobile devices to communicate and access their personal and professional digital content. Our strategy with mobile devices, such as notebooks and handhelds, is to engineer complexity away from the user and move more intelligence into the back-end network, where we deliver solutions to our service provider customers. As homes become Internet-enabled and wireless, we see great potential in connecting our range of products (for example, TVs, printers, PCs, storage, servers and networking) to create a new, managed home experience. This will help our customers more easily access and manage their personal, professional and entertainment content throughout their homes. And our recent acquisition of VoodooPC extends our presence in the home to a young, fast-growing gaming market with an advanced, highly personalized, “gamer-centric” product portfolio. Technology Solutions Our enterprise business is focused on helping customers run their businesses on an automated, 24×7, “lights-out” IT infrastructure. Our own internal IT transformation involves building six next-generation data centers, which also will serve as one of the world’s best R&D labs for developing our products. Our IT operations will feature all of the products, services and solutions we offer to enterprise customers. For example, we are applying our blade storage and server products to maximize computing power in the smallest physical space. We are using HP dynamic smart cooling to become significantly more energy efficient. With virtualization technology, we are improving utilization rates across all of our IT resources. The centerpiece of our enterprise solutions is HP software and services. We believe that business technology optimization software is one of the best paths for us to boost the value we offer enterprise customers, enabling them to increase the efficiency of their IT spend, automate their operations and achieve better business outcomes. That is why we acquired Mercury Interactive Corporation. Looking Forward In summary, we made progress in fiscal year 2006, but there is still more work ahead. As we drive the industry trends that play to HP’s strengths, we have much more to accomplish to fully realize our potential. We need to make it easier to do business with HP. We need to better align our human and financial capital to fuel growth and simultaneously take out costs. As we improve in these areas, we expect to increase stockholder value and continue to work toward establishing HP as the world’s leading IT company.
Sincerely, Mark V. Hurd Chairman, Chief Executive Officer and President

¹ Fiscal year 2006 non-GAAP EPS of $2.38 per share equals GAAP diluted EPS of $2.18 per share plus the sum of $0.21 per share relating to charges associated with the amortization of purchased intangible assets, $0.06 per share relating to restructuring charges and $0.02 per share relating to in-process research and development charges, less a $0.01 per share net investment gain and $0.08 per share relating to taxes associated with those adjustments. HP’s management uses non-GAAP EPS to evaluate and forecast HP’s performance before gains, losses or other charges that are considered by HP’s management to be outside of HP’s core business segment operating results. HP believes that presenting non-GAAP EPS in addition to GAAP diluted EPS provides investors with greater transparency to the information used by HP’s management in its financial and operational decision-making. HP further believes that providing this additional non-GAAP information helps investors understand HP’s operating performance and evaluate the efficacy of the methodology and information used by management to evaluate and measure such performance. This additional non-GAAP information is not intended to be considered in isolation or as a substitute for GAAP diluted EPS. HP’s Executive Team Mark V. Hurd Chairman, Chief Executive Officer and President R. Todd Bradley Executive Vice President, Personal Systems Group Charles N. Charnas Acting General Counsel, Vice President and Assistant Secretary Vyomesh I. Joshi Executive Vice President, Imaging and Printing Group Catherine A. Lesjak Executive Vice President and Chief Financial Officer (effective December 2006) Ann M. Livermore Executive Vice President, Technology Solutions Group Catherine T. Lyons Executive Vice President and Chief Marketing Officer Randall D. Mott Executive Vice President and Chief Information Officer Marcela Perez de Alonso Executive Vice President, Human Resources Shane V. Robison Executive Vice President and Chief Strategy & Technology Officer Robert P. Wayman Executive Vice President and Chief Financial Officer (retired December 2006)
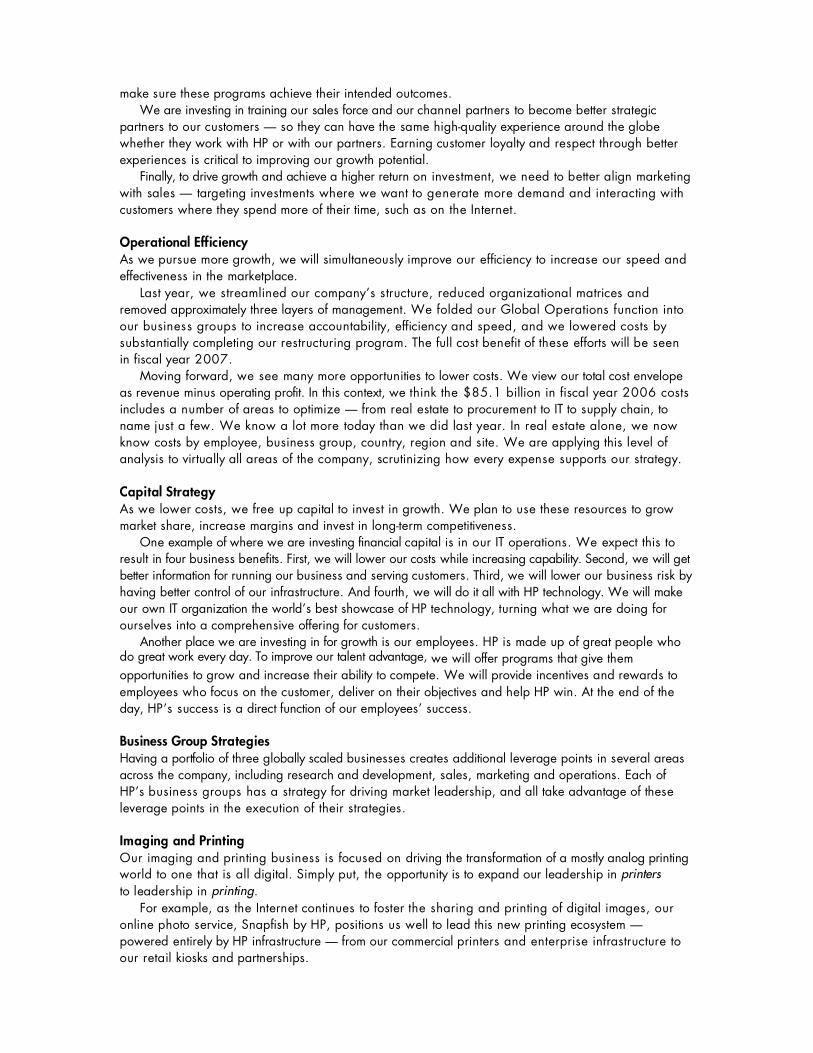
[Bar Chart. Caption: Revenue; Revenue 1Q04, $19.5 billion Revenue 2Q04, $20.1 billion Revenue 3Q04, $18.9 billion Revenue 4Q04, $21.4 billion Revenue 1Q05, $21.5 billion Revenue 2Q05, $21.6 billion Revenue 3Q05, $20.8 billion Revenue 4Q05, $22.9 billion Revenue 1Q06, $22.7 billion Revenue 2Q06, $22.6 billion Revenue 3Q06, $21.9 billion Revenue 4Q06, $24.6 billion] [Pie Chart. Caption: FY06 Revenue By Segment; Imaging & Printing Group 29% Personal Systems Group 32% HP Services 17% Enterprise Storage & Servers 19% HP Financial Services 2% Software & Other 1%] [Pie Chart. Caption: FY06 Revenue By Region; EMEA, 40% up 2% year over year Americas, 44% up 9% year over year; Americas consists of the United States, which was 35%, and Canada and Latin America, which combined were 9% Asia Pacific, 16% up 7% year over year] [Bar chart. Caption: Cash Flow; FY02 Cash flow from operations, $5.4 billion Free cash flow (refer to Cash Flow footnote number 1) $4.1 billion FY03 Cash flow from operations $6.1 billion Free cash flow $4.4 billion FY04 Cash flow from operations $5.1 billion Free cash flow $3.4 billion FY05 Cash flow from operations $8.0 billion Free cash flow $6.6 billion FY06 Cash flow from operations $11.4 billion Free cash flow $9.4 billion Cash Flow footnote number 1: Free cash flow equals cash flow from operations minus net capital expenditures. Free cash flow is a non-GAP liquidity measure that provides useful information to management about the amount of cash available for investment in HP’s businesses, funding strategic acquisitions, repurchasing stock and other purposes. Free cash flow is among the primary indicators management uses as a basis for planning and forecasting future periods. We believe that presenting free cash flow provides investors with a more complete understanding of HP’s underlying operating results and trends and an enhanced overall understanding of HP’s financial performance, liquidity and prospects for the future. This additional non-GAAP information is not meant to be considered in isolation or as a substitute for cash flow from operations prepared in accordance with GAAP.]
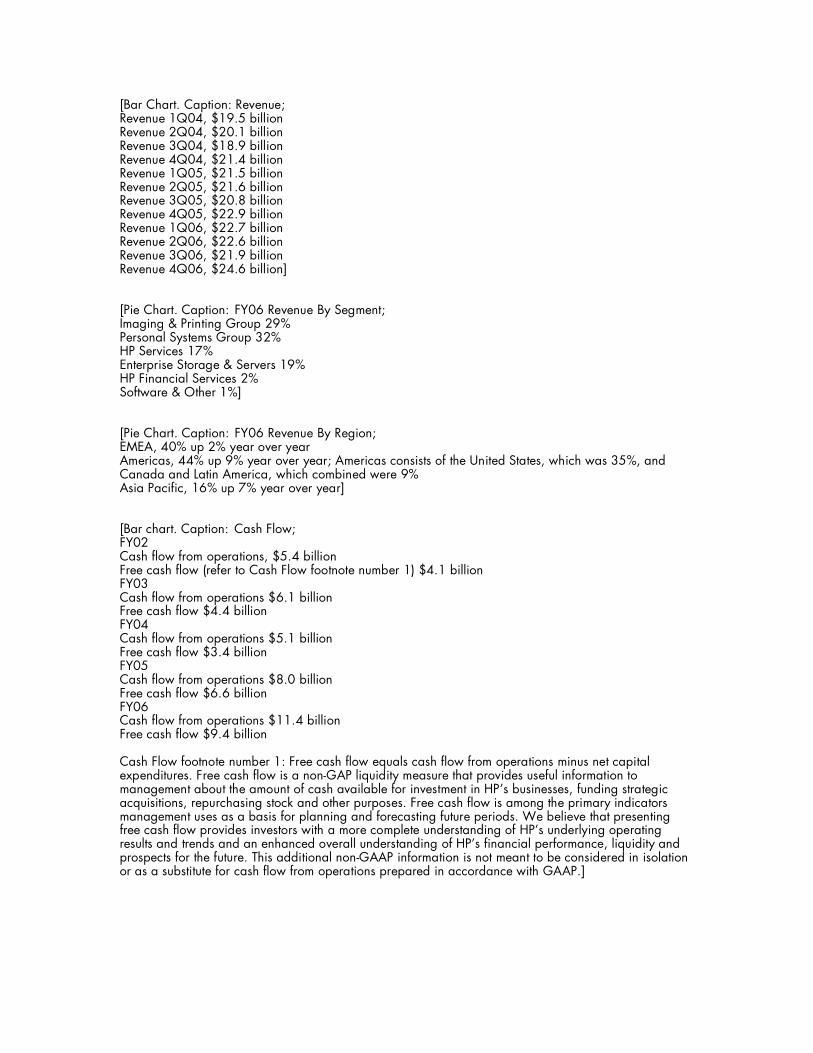
UNITED STATESSECURITIES AND EXCHANGE COMMISSION
Washington, D.C. 20549
FORM 10-K(Mark One)
� ANNUAL REPORT PURSUANT TO SECTION 13 OR 15(d) OF THESECURITIES EXCHANGE ACT OF 1934
For the fiscal year ended: October 31, 2006
Or
� TRANSITION REPORT PURSUANT TO SECTION 13 OR 15(d) OF THESECURITIES EXCHANGE ACT OF 1934
For the transition period from to
Commission file number 1-4423
HEWLETT-PACKARD COMPANY(Exact name of registrant as specified in its charter)
Delaware 94-1081436(State or other jurisdiction of (I.R.S. employerincorporation or organization) identification no.)
3000 Hanover Street, Palo Alto, California 94304(Address of principal executive offices) (Zip code)
Registrant’s telephone number, including area code: (650) 857-1501
Securities registered pursuant to Section 12(b) of the Act:
Title of each class Name of each exchange on which registered
Common stock, par value $0.01 per share New York Stock ExchangeLiquid Yield Option� Notes due 2017 The Nasdaq Stock Market
Securities registered pursuant to Section 12(g) of the Act:None
Indicate by check mark if the registrant is a well-known seasoned issuer as defined in Rule 405 of the Securities Act. Yes � No �
Indicate by check mark if the registrant is not required to file reports pursuant to Section 13 or Section 15(d) of theAct. Yes � No �
Indicate by check mark whether the registrant (1) has filed all reports required to be filed by Section 13 or 15(d) of the SecuritiesExchange Act of 1934 (the ‘‘Exchange Act’’) during the preceding 12 months (or for such shorter period that the registrant was requiredto file such reports), and (2) has been subject to such filing requirements for the past 90 days. Yes � No �
Indicate by check mark if disclosure of delinquent filers pursuant to Item 405 of Regulation S-K is not contained herein, and willnot be contained, to the best of registrant’s knowledge, in definitive proxy or information statements incorporated by reference inPart III of this Form 10-K or any amendment to this Form 10-K. �
Indicate by check mark whether the registrant is a large accelerated filer, an accelerated filer, or a non-accelerated filer. Seedefinition of ‘‘accelerated filer and large accelerated filer’’ in Rule 12b-2 of the Exchange Act.
Large accelerated filer � Accelerated filer � Non-accelerated filer �
Indicate by check mark whether the registrant is a shell company (as defined by Rule 12b-2 of the Exchange Act) Yes � No �
The aggregate market value of the registrant’s common stock held by non-affiliates was $90,860,054,190 based on the last sale priceof common stock on April 28, 2006.
The number of shares of HP common stock outstanding as of November 30, 2006 was 2,720,808,149 shares.
DOCUMENTS INCORPORATED BY REFERENCEDOCUMENT DESCRIPTION 10-K PART
Portions of the Registrant’s notice of annual meeting of stockholders and proxy statement to be filed pursuant to IIIRegulation 14A within 120 days after Registrant’s fiscal year end of October 31, 2006 are incorporated by referenceinto Part III of this Report.
Hewlett-Packard Company
Form 10-K
For the Fiscal Year Ended October 31, 2006
Table of Contents
Page
PART IItem 1. Business . . . . . . . . . . . . . . . . . . . . . . . . . . . . . . . . . . . . . . . . . . . . . . . . . . . . . . . . 3Item 1A. Risk Factors . . . . . . . . . . . . . . . . . . . . . . . . . . . . . . . . . . . . . . . . . . . . . . . . . . . . . 16Item 1B. Unresolved Staff Comments . . . . . . . . . . . . . . . . . . . . . . . . . . . . . . . . . . . . . . . . . 30Item 2. Properties . . . . . . . . . . . . . . . . . . . . . . . . . . . . . . . . . . . . . . . . . . . . . . . . . . . . . . . 30Item 3. Legal Proceedings . . . . . . . . . . . . . . . . . . . . . . . . . . . . . . . . . . . . . . . . . . . . . . . . . 31Item 4. Submission of Matters to a Vote of Security Holders . . . . . . . . . . . . . . . . . . . . . . . 31
PART IIItem 5. Market for Registrant’s Common Equity, Related Stockholder Matters and Issuer
Purchases of Equity Securities . . . . . . . . . . . . . . . . . . . . . . . . . . . . . . . . . . . . . . 32Item 6. Selected Financial Data . . . . . . . . . . . . . . . . . . . . . . . . . . . . . . . . . . . . . . . . . . . . . 33Item 7. Management’s Discussion and Analysis of Financial Condition and Results of
Operations . . . . . . . . . . . . . . . . . . . . . . . . . . . . . . . . . . . . . . . . . . . . . . . . . . . . 35Item 7A. Quantitative and Qualitative Disclosures about Market Risk . . . . . . . . . . . . . . . . . . 68Item 8. Financial Statements and Supplementary Data . . . . . . . . . . . . . . . . . . . . . . . . . . . . 70Item 9. Changes in and Disagreements with Accountants on Accounting and Financial
Disclosures . . . . . . . . . . . . . . . . . . . . . . . . . . . . . . . . . . . . . . . . . . . . . . . . . . . . 142Item 9A. Controls and Procedures . . . . . . . . . . . . . . . . . . . . . . . . . . . . . . . . . . . . . . . . . . . . 142Item 9B. Other Information . . . . . . . . . . . . . . . . . . . . . . . . . . . . . . . . . . . . . . . . . . . . . . . . 142
PART IIIItem 10. Directors and Executive Officers of the Registrant . . . . . . . . . . . . . . . . . . . . . . . . . 143Item 11. Executive Compensation . . . . . . . . . . . . . . . . . . . . . . . . . . . . . . . . . . . . . . . . . . . . 143Item 12. Security Ownership of Certain Beneficial Owners and Management and Related
Stockholder Matters . . . . . . . . . . . . . . . . . . . . . . . . . . . . . . . . . . . . . . . . . . . . . 143Item 13. Certain Relationships and Related Transactions . . . . . . . . . . . . . . . . . . . . . . . . . . . 143Item 14. Principal Accountant Fees and Services . . . . . . . . . . . . . . . . . . . . . . . . . . . . . . . . . 143
PART IVItem 15. Exhibits and Financial Statement Schedules . . . . . . . . . . . . . . . . . . . . . . . . . . . . . . 144

Forward-Looking Statements
This Annual Report on Form 10-K, including ‘‘Management’s Discussion and Analysis of FinancialCondition and Results of Operations’’ in Item 7, contains forward-looking statements that involve risks,uncertainties and assumptions. If the risks or uncertainties ever materialize or the assumptions proveincorrect, the results of Hewlett-Packard Company and its consolidated subsidiaries (‘‘HP’’) may differmaterially from those expressed or implied by such forward-looking statements and assumptions. Allstatements other than statements of historical fact are statements that could be deemed forward-lookingstatements, including but not limited to any projections of revenue, margins, expenses, tax provisions,earnings, cash flows, benefit obligations, share repurchases or other financial items; any statements of theplans, strategies and objectives of management for future operations, including the execution of costreduction programs and restructuring plans; any statements concerning expected development, performanceor market share relating to products or services; any statements regarding future economic conditions orperformance; any statements regarding pending investigations, claims or disputes; any statements ofexpectation or belief; and any statements of assumptions underlying any of the foregoing. Risks, uncertaintiesand assumptions include macroeconomic and geopolitical trends and events; the execution and performanceof contracts by customers, suppliers and partners; the challenge of managing asset levels, including inventory;the difficulty of aligning expense levels with revenue changes; assumptions related to pension and otherpost-retirement costs; expectations and assumptions relating to the execution and timing of cost reductionprograms and restructuring plans; the outcome of pending legislation and accounting pronouncements; theresolution of pending investigations, claims and disputes; and other risks that are described herein, includingbut not limited to the items discussed in ‘‘Risk Factors’’ in Item 1A of this report, and that are otherwisedescribed or updated from time to time in HP’s Securities and Exchange Commission reports. HP assumesno obligation and does not intend to update these forward-looking statements.
Reclassifications
HP has made certain reclassifications to its Consolidated Balance Sheet as of October 31, 2006 and itsConsolidated Statement of Cash Flows for the fiscal year ended October 31, 2006 since HP reported itspreliminary fourth quarter financial results on November 16, 2006. These reclassifications were made inconnection with the completion of an extensive internal and external review of tax data (includingconsolidating and reviewing the tax provisions of numerous domestic and foreign entities) in the ordinarycourse of preparing this Annual Report on Form 10-K. These reclassifications are limited to the ‘‘Othercurrent assets,’’ ‘‘Long-term financing receivables and other assets,’’ ‘‘Taxes on earnings’’ and ‘‘Otherliabilities’’ line items of that Consolidated Balance Sheet and the ‘‘Deferred taxes on earnings’’ and ‘‘Taxeson earnings’’ line items of the Consolidated Statement of Cash Flows and do not affect HP’s previouslyreported Consolidated Statement of Earnings for the fiscal year ended October 31, 2006.
PART I
ITEM 1. Business.
HP is a leading global provider of products, technologies, software, solutions and services toindividual consumers, small and medium sized businesses (‘‘SMBs’’), large enterprises, including thepublic and education sectors. Our offerings span:
• personal computing and other access devices,
• imaging and printing-related products and services,
• enterprise information technology infrastructure, including enterprise storage and servertechnology, enterprise system and network management software, and
• multi-vendor customer services, including technology support and maintenance, consulting andintegration and managed services.
3
HP was incorporated in 1947 under the laws of the State of California as the successor to apartnership founded in 1939 by William R. Hewlett and David Packard. Effective in May 1998, wechanged our state of incorporation from California to Delaware. In May 2002 we acquired CompaqComputer Corporation (‘‘Compaq’’), which significantly expanded the breadth and depth of ourproduct offerings, increased our overall scale and reach, drove substantial improvements in our coststructure and generally improved our competitive position.
HP Products and Services; Segment Information
During fiscal 2006, our operations were organized into seven business segments: Enterprise Storageand Servers (‘‘ESS’’), HP Services (‘‘HPS’’), Software, the Personal Systems Group (‘‘PSG’’), theImaging and Printing Group (‘‘IPG’’), HP Financial Services (‘‘HPFS’’) and Corporate Investments.Given the solution sale approach across our enterprise offerings, and in order to capitalize onup-selling and cross-selling opportunities, ESS, HPS and Software are structured beneath a broaderTechnology Solutions Group (‘‘TSG’’). While TSG is not a business segment, this aggregation providesa supplementary view of our business. In each of the past three fiscal years, industry standard servers,technology services, desktops, notebooks and printing supplies each accounted for more than 10% ofour consolidated net revenue.
A summary of our net revenue, earnings from operations and assets for our segments and businessunits is found in Note 18 to the Consolidated Financial Statements in Item 8, which is incorporatedherein by reference. A discussion of factors potentially affecting our operations is set forth in ‘‘RiskFactors’’ in Item 1A, which is incorporated herein by reference.
Technology Solutions Group
TSG provides servers, storage, software and information technology (‘‘IT’’) services that enableenterprise and midmarket business customers to better manage their current IT environments andtransform them into a business enabler. TSG products help accelerate growth, minimize risk andreduce costs to optimize the business outcomes of customers’ IT investments. Companies around theglobe leverage HP’s infrastructure solutions to deploy next generation data centers and addressbusiness challenges ranging from compliance to business continuity. TSG’s modular IT systems andservices are primarily standards-based and feature differentiated technologies in areas including powerand cooling, unified management, security, virtualization and automation. Each of the three businesssegments within TSG is described in detail below.
Enterprise Storage and Servers
The server market continues to shift towards standards-based architectures as proprietary hardwareand operating systems are replaced by industry standard server platforms that typically offer compellingprice and performance advantages by leveraging standards-based operating systems and microprocessordesigns. At the same time, critical business functions continue to demand scalability and reliability. Byproviding a broad portfolio of storage and server solutions, ESS aims to optimize the combined productsolutions required by different customers and provide solutions for a wide range of operatingenvironments, spanning both the enterprise and the SMB markets. ESS provides storage and serverproducts in a number of categories.
Industry Standard Servers. Industry standard servers include primarily entry-level and mid-rangeProLiant servers, which run primarily on the Windows�,(1) Linux and Novell operating systems andleverage Intel Corporation (‘‘Intel’’) and Advanced Micro Devices (‘‘AMD’’) processors. The businessspans a range of product lines that include pedestal-tower servers, density-optimized rack servers and
(1) Windows� is a registered trademark of Microsoft Corporation.
4
HP’s BladeSystem family of blade servers. In fiscal 2006, HP’s industry standard server businesscontinued to lead the industry in terms of units shipped. HP also has a strong position in blade servers,the fastest-growing segment of the market.
Business Critical Systems. Business Critical Systems include Itanium�(2)-based Integrity serversrunning on the HP-UX, Windows�, Linux and OpenVMS operating systems, including the high-endSuperdome servers and fault-tolerant Integrity NonStop servers. Business Critical Systems also includethe Reduced Instruction Set Computing (‘‘RISC’’)-based servers with the HP 9000 line running on theHP-UX operating system, HP AlphaServers running on both Tru64 UNIX�(3) and OpenVMS, andMIPs-based NonStop servers.
Storage. HP’s StorageWorks offerings include entry-level, mid-range and high-end arrays, storagearea networks, network attached storage, storage management software and virtualization technologies,as well as tape drives, tape libraries and optical archival storage.
HP Services
HPS provides a portfolio of multi-vendor IT services, including technology services, consulting andintegration and managed services, also known as outsourcing. HPS also offers a variety of servicestailored to particular industries such as communications, media and entertainment, manufacturing anddistribution, financial services and the public sector, including government and education services. HPScollaborates with the Enterprise Storage and Servers and Software groups, as well as with third-partysystem integrators and software and networking companies to bring solutions to HP customers. HPSalso works with HP’s Imaging and Printing Group and Personal Systems Group to provide managedprint services, end user workplace services, and mobile workforce productivity solutions to enterprisecustomers.
Technology Services. HPS provides a range of technology services from standalone productsupport to high availability services for complex, global, networked, multi-vendor environments andbusiness continuity and recovery services. This business also manages the delivery of product warrantysupport through its own service organization, as well as through authorized partners.
Consulting and Integration. HPS provides consulting and integration services to architect, designand implement technology and industry-specific solutions for customers. Consulting and integration alsoprovides cross-industry solutions in the areas of architecture and governance, infrastructure,applications and packaged applications, security, IT service management, information management andenterprise Microsoft solutions.
Managed Services. HPS offers IT management services, including comprehensive outsourcing,transformational infrastructure services, client computing managed services, managed web services,application services and business process outsourcing.
Software
Software provides management software solutions, including support, that allow enterprisecustomers to manage their IT infrastructure, operations, applications, IT services and business processesunder the HP OpenView brand. In addition, this segment delivers a suite of comprehensive, carrier-grade software platforms for developing and deploying next-generation voice, data and convergedservices to network and service providers under the HP OpenCall brand.
(2) Itanium� is a registered trademark of Intel Corporation.(3) UNIX� is a registered trademark of The Open Group.
5
HP is focused on extending its distributed systems management leadership position intoapplication, service management and business process management market segments. InDecember, 2005, we acquired the outstanding shares of Peregrine Systems, Inc. (‘‘Peregrine’’). Theacquisition of Peregrine adds key asset and service management components to our HP OpenViewportfolio. In November 2006, we completed our acquisition of Mercury Interactive Corporation(‘‘Mercury’’), an IT management software and services company. The acquisition will combine HPOpenView’s systems, network and IT service management software solutions with Mercury’s applicationmanagement, application delivery, and IT governance offerings. This portfolio of solutions is expectedto enable our customers to reduce IT costs and make better IT decisions by helping them align ITspending with business goals and automate and measure IT program effectiveness.
Personal Systems Group
PSG is one of the leading providers of personal computers (‘‘PCs’’) in the world based on unitvolume shipped and annual revenue. PSG provides commercial PCs, consumer PCs, workstations,handheld computing devices, digital entertainment systems, calculators and other related accessories,software and services for the commercial and consumer markets. We group commercial desktops,commercial notebooks and workstations into commercial clients and consumer desktop and consumernotebooks into consumer clients when describing our performance in these markets. Like the broaderPC market, PSG continues to experience a shift toward mobile products such as notebooks. Bothcommercial and consumer PCs are based predominately on the Windows� operating system and useIntel and AMD processors.
Commercial PCs. PSG offers a variety of personal computers optimized for commercial uses,including enterprise and SMB customers, and for connectivity and manageability in networkedenvironments. These commercial PCs include the HP Compaq business desktops and businessnotebooks, as well as the HP Compaq Tablet PCs.
Consumer PCs. Consumer PCs include the HP Pavilion and Compaq Presario series of multi-media consumer desktop PCs and notebook PCs, as well as HP Media Center PCs, and are targeted atthe home user.
Workstations. Workstations are individual computing products designed for users demandingenhanced performance, such as computer animation, engineering design and other programs requiringhigh-resolution graphics. HP provides workstations that run on UNIX�, Windows� and Linux-basedoperating systems.
Handheld Computing. HP provides a series of HP iPAQ Pocket PC handheld computing devicesthat run on Windows� Mobile software. These products range from value devices such as music orGlobal Positioning System receivers to advanced devices with voice and data capability.
Digital Entertainment. PSG’s digital entertainment products are targeted at the intersection of thepersonal computing and consumer electronics markets and span a range of products and productcategories that allow customers to enjoy a broad range of digital entertainment experiences. PSG’sdigital entertainment products include HD DVD and RW drives and DVD writers; the HP DigitalEntertainment Center, which allows consumers to access their music, movies, home videos and photosfrom a single device via remote control; and plasma and LCD flat-panel televisions.
Imaging and Printing Group
IPG is the leading imaging and printing systems provider in the world for consumer andcommercial printer hardware, printing supplies, printing media and scanning devices. IPG is alsofocused on imaging solutions in the commercial markets, from managed print services solutions toaddressing new growth opportunities in commercial printing in areas such as industrial applications,
6
outdoor signage, and the graphic arts business. When describing our performance in this segment, wegroup inkjet printer units and digital photography and entertainment products and services intoconsumer hardware, LaserJet printers and graphics and imaging products into commercial hardwareand break out printer supplies separately.
Inkjet Printers. Inkjet systems include desktop single function and inkjet all-in-one printers,including photo, productivity and business inkjet printers and scanners.
Digital Photography and Entertainment. Digital imaging products and services include photospecialty printers, photo kiosks, digital cameras, accessories and online photo services through Snapfishin North America. An important part of IPG’s strategy is to provide digital imaging solutions that rivaltraditional imaging for quality, cost and ease of use so that consumers can manage their digital imagingthroughout the home and outside the home.
LaserJet Printers. LaserJet systems include monochrome and color laser printers, printer-basedmulti-function devices and Total Print Management Solutions for enterprise customers. A key initiativein this area of IPG’s business has been and continues to be driving color printing penetration in theoffice.
Graphics and Imaging. Graphics and Imaging products include large format (DesignJet) printers,Indigo and Scitex digital presses, digital publishing solutions and graphics printing solutions. A keyinitiative for IPG is to capture high-value pages by developing compelling solutions for the industrial,commercial printing and graphics segments.
Printer Supplies. Printer supplies include LaserJet toner and inkjet cartridges and other printing-related media. These supplies include HP-branded Vivera and ColorSphere ink and HP Premium andPremium Plus photo papers, which are designed to work together as a system to produce faster printswith improved resistance to fading, increased print quality and better affordability.
HP Financial Services
HPFS supports and enhances HP’s global product and service solutions, providing a broad rangeof value-added financial life cycle management services. HPFS enables our worldwide customers toacquire complete IT solutions, including hardware, software and services. The group offers leasing,financing, utility programs and asset recovery services, as well as financial asset management servicesfor large global and enterprise customers. HPFS also provides an array of specialized financial servicesto SMBs and educational and governmental entities. HPFS offers innovative, customized and flexiblealternatives to balance unique customer cash flow, technology obsolescence and capacity needs.
Corporate Investments
Corporate Investments is managed by the Office of Strategy and Technology and includes Hewlett-Packard Laboratories, also known as HP Labs, and certain business incubation projects. Revenue inthis segment is attributable to the sale of certain network infrastructure products, including Ethernetswitch products that enhance computing and enterprise solutions under the brand ‘‘ProCurveNetworking.’’ Corporate Investments also derives revenue from licensing specific HP technology tothird parties.
Sales, Marketing and Distribution
We manage our business and report our financial results based on the principal business segmentsdescribed above. Our customers are organized by consumer and commercial customer groups, and
7
distribution is organized by direct and channel. Within the channel, we have various types of partnersthat we utilize for various customer groups. The partners include:
• retailers that sell our products to the public through their own physical or Internet stores;
• resellers that sell our products and services, frequently with their own value-added products orservices, to targeted customer groups;
• distribution partners that supply our solutions to smaller resellers with which we do not havedirect relationships;
• independent distributors that sell our products into geographies or customer segments in whichwe have little or no presence;
• original equipment manufacturers (‘‘OEMs’’) that integrate our products with their ownhardware or software and sell the integrated products;
• independent software vendors (‘‘ISVs’’) that provide their clients with specialized softwareproducts, frequently driving sales of additional non-HP products and services, and often assist usin selling our products and services to clients purchasing their products; and
• systems integrators that provide various levels and kinds of expertise in designing andimplementing custom IT solutions and often partner with HPS to extend their expertise orinfluence the sale of our products and services.
The mix of HP’s business by channel or direct sales differs substantially by business and region. Webelieve that customer buying patterns and different regional market conditions necessitate sales,marketing and distribution to be tailored accordingly. HP is focused on driving efficiencies andproductivity gains in both the direct and indirect business.
TSG manages enterprise and public sector customer relationships and also is charged withsimplifying sales processes across our segments to improve speed and effectiveness of customerdelivery. In this capacity, TSG manages our direct sales for value products including UNIX�, enterprisestorage and software and pre-sales technical consultants, as well as our direct distribution activities forcommercial products and go-to-market activities with systems integrators and ISVs. TSG also drivesHP’s vertical sales and marketing approach in the communication, media and entertainment, financialservices manufacturing and distribution and public sector industries.
PSG manages SMB customer relationships and commercial reseller channels, due largely to thesignificant volume of commercial PCs that HP sells through these channels. In addition to commercialchannel relationships, the volume direct organization, which is charged with the management of directsales for volume products such as commercial PCs and industry standard servers, is hosted within PSG.
IPG manages HP’s overall consumer-related sales and marketing activities, including our annualconsumer product launch for the back-to-school and holiday seasons. IPG also manages consumerchannel relationships with approximately 28,000 third-party retail locations for imaging and printingproducts, as well as other consumer products, including consumer PCs, which provides for a bundledsale opportunity between PCs and IPG products. In addition, IPG manages direct consumer salesthrough www.hp.com.
Manufacturing and Materials
We utilize a number of contract manufacturers (‘‘CMs’’) and original design manufacturers(‘‘ODMs’’) around the world to manufacture HP-designed products. The use of CMs and ODMs isintended to generate cost efficiencies and reduce time to market for certain HP-designed products.Third-party OEMs manufacture some products that we purchase and resell under the HP brand. In
8

addition to our use of CMs and ODMs, we currently manufacture finished products from componentsand sub-assemblies that we acquire from a wide range of vendors.
We utilize two primary methods of fulfilling demand for products: building products to order(‘‘BTO’’) and configuring products to order (‘‘CTO’’). We employ BTO capabilities to maximizemanufacturing efficiencies by producing high volumes of basic product configurations. CTO permitsconfiguration of units to the particular hardware and software customization requirements of certaincustomers. Our inventory management and distribution practices in both BTO and CTO seek tominimize inventory holding periods by taking delivery of the inventory and manufacturing immediatelyprior to the sale or distribution of products to our customers.
We purchase materials, supplies and product subassemblies from a substantial number of vendors.For many of our products, we have existing alternate sources of supply, or such sources are readilyavailable. However, we do rely on sole sources for laser printer engines, LaserJet supplies and parts forproducts with short life cycles (although some of these sources have operations in multiple locations).We are dependent upon Intel as a supplier of processors and Microsoft for various software products.However, we believe that disruptions with these suppliers would result in industry-wide dislocations andtherefore would not disproportionately disadvantage us relative to our competitors. We also have avalued relationship with AMD, and we have continued to see greater acceptance of AMD processors inthe market during fiscal 2006.
Like other participants in the high technology industry, we ordinarily acquire materials andcomponents through a combination of blanket and scheduled purchase orders to support ourrequirements for periods averaging 90 to 120 days. From time to time, we experience significant pricevolatility and supply constraints of certain components that are not available from multiple sources.Frequently, we are able to obtain scarce components for somewhat higher prices on the open market,which may have an impact on gross margin but does not disrupt production. On occasion, we acquirecomponent inventory in anticipation of supply constraints or enter into longer-term pricingcommitments with vendors to improve the priority and availability of supply. See ‘‘Risk Factors—Wedepend on third-party suppliers, and our revenue and gross margin could suffer if we fail to managesupplier issues properly,’’ in Item 1A, which is incorporated herein by reference.
International
Our products and services are available worldwide. We believe this geographic diversity allows usto meet demand on a worldwide basis for both consumer and enterprise customers, draws on businessand technical expertise from a worldwide workforce, provides stability to our operations, allows us todrive economies of scale, provides revenue streams to offset geographic economic trends and offers usan opportunity to access new markets for maturing products. In addition, we believe that future growthis dependent in part on our ability to develop products and sales models that target developingcountries. In this regard, we believe that our broad geographic presence gives us a solid base to buildupon for such future growth.
A summary of our domestic and international net revenue and net property, plant and equipmentis set forth in Note 18 to the Consolidated Financial Statements in Item 8, which is incorporated hereinby reference. Over 60% of our overall net revenue in fiscal 2006 came from outside the United States.The substantial majority of our net revenue originating outside the United States was from customersother than foreign governments.
For a discussion of risks attendant to HP’s foreign operations, see ‘‘Risk Factors—Due to theinternational nature of our business, political or economic changes or other factors could harm ourfuture revenue, costs and expenses and financial condition,’’ in Item 1A, ‘‘Quantitative and QualitativeDisclosure about Market Risk’’ in Item 7A and Note 9 to the Consolidated Financial Statements inItem 8, which are incorporated herein by reference.
9
Research and Development
We remain committed to innovation as a key element of HP’s culture. Our development effortsare focused on designing and developing products, services and solutions that anticipate customers’changing needs and desires and emerging technological trends. Our efforts also are focused onidentifying the areas where we believe we can make a unique contribution and the areas wherepartnering with other leading technology companies will leverage our cost structure and maximize ourcustomers’ experiences.
HP Labs, together with the various research and development groups within the five principalbusiness segments, are responsible for our research and development efforts. HP Labs is part of ourCorporate Investments segment.
Expenditures for research and development in fiscal 2006 were $3.6 billion compared to$3.5 billion in fiscal 2005 and $3.6 billion in fiscal 2004. We anticipate that we will continue to havesignificant research and development expenditures in the future to provide a continuing flow ofinnovative, high-quality products and services to maintain and enhance our competitive position.
For a discussion of risks attendant to our research and development activities, see ‘‘Risk Factors—If we cannot continue to develop, manufacture and market products and services that meet customerrequirements for innovation and quality, our revenue and gross margin may suffer,’’ in Item 1A, whichis incorporated herein by reference.
Patents
Our general policy has been to seek patent protection for those inventions and improvementslikely to be incorporated into our products and services or where proprietary rights will improve ourcompetitive position. At October 31, 2006, our worldwide patent portfolio included over 30,000 patents,which was approximately equivalent to the number of patents in our patent portfolio at the end offiscal 2005 and significantly higher then the 25,000 patents we held at the end of fiscal 2004.
Patents generally have a term of twenty years. As our patent portfolio has been built over time, theremaining terms on the individual patents vary. While we believe that our patents and applications areimportant for maintaining the competitive differentiation of our products and maximizing our return onresearch and development investments, no single patent is in itself essential to us as a whole or any ofour principal business segments.
In addition to developing our patents, we license intellectual property from third parties as wedeem appropriate. We have also granted and continue to grant to others licenses under patents ownedby us when we consider these arrangements to be in our interests. These license arrangements includea number of cross-licenses with third parties.
For a discussion of risks attendant to intellectual property rights, see ‘‘Risk Factors—Our revenue,cost of sales, and expenses may suffer if we cannot continue to license or enforce the intellectualproperty rights on which our business depends or if third parties assert that we violate their intellectualproperty rights,’’ in Item 1A, which is incorporated herein by reference.
Backlog
We believe that backlog is not a meaningful indicator of future business prospects due to the largevolume of products delivered from shelf or channel partner inventories, the shortening of product lifecycles and the relative portion of net revenue related to our service and support businesses. Therefore,we believe that backlog information is not material to an understanding of our overall business.
10
Seasonality
General economic conditions have an impact on our business and financial results. From time totime, the markets in which we sell our products experience weak economic conditions that maynegatively affect sales. We experience some seasonal trends in the sale of our products and services.For example, sales to governments (particularly sales to the U.S. government) often are stronger in thethird calendar quarter, European sales often are weaker in the summer months and consumer salesoften are stronger in the fourth calendar quarter. Demand during the spring and early summer monthsalso may be adversely impacted by market anticipation of seasonal trends. See ‘‘Risk Factors—Oursales cycle makes planning and inventory management difficult and future financial results lesspredictable,’’ in Item 1A, which is incorporated herein by reference.
Competition
We encounter aggressive competition in all areas of our business activity. We compete primarily onthe basis of technology, performance, price, quality, reliability, brand, reputation, distribution, range ofproducts and services, ease of use of our products, account relationships, customer training, service andsupport, security and availability of application software and our Internet infrastructure offerings.
The markets for each of our business segments are characterized by vigorous competition amongmajor corporations with long-established positions and a large number of new and rapidly growingfirms. Product life cycles are short, and to remain competitive we must develop new products andservices, periodically enhance our existing products and services and compete effectively on the basis ofthe factors listed above. In addition, we compete with many of our current and potential partners,including OEMs that design, manufacture and often market their products under their own brandnames. Our successful management of these competitive partner relationships will continue to becritical to our future success. Moreover, we anticipate that we will have to continue to adjust prices onmany of our products and services to stay competitive.
On an overall basis we are among the largest U.S.-based companies offering our range of generalpurpose computers and personal information, imaging and printing products for industrial, scientific,business and consumer applications, and IT services. We are the leader or among the leaders in each ofour principal business segments.
The competitive environments in which each segment operates are described below:
Enterprise Storage and Servers. The areas in which ESS operates are intensely competitive and arecharacterized by rapid and ongoing technological innovation and price reductions. Our competitorsrange from broad solutions providers such as International Business Machines Corporation (‘‘IBM’’) tomore focused competitors such as EMC Corporation in storage, Dell, Inc. (‘‘Dell’’) in industry standardservers, and Sun Microsystems, Inc. in UNIX�-based servers. We believe that our importantcompetitive advantages in this segment include our broad range of server and storage products andrelated software and services, our global reach, our significant intellectual property portfolio andresearch and development capabilities, which will contribute to further enhancements of our productofferings and our ability to cross sell our portfolio and leverage scale advantages in everything frombrand to procurement leverage.
HP Services. The principal areas in which HPS competes are technology services, consulting andintegration and managed services. The technology services and consulting and integration markets havebeen under significant pressure as customers scrutinize their IT spending. However, this trend hasbenefited the managed services business as customers attempt to reduce their IT costs and focus theirresources on their core businesses. Our key competitors in this segment include IBM Global Services,systems integration firms such as Accenture Ltd., outsourcing firms such as Electronic Data SystemsCorporation and offshore companies. Many of our competitors are able to offer a wide range ofservices through a global network of service providers, and some of our competitors enjoy significant
11

brand recognition. HPS teams with many companies that offer services which allow us to extend ourreach and augment our capabilities. Our competitive advantages include our global deliveryorganization, our deep technical expertise, our diagnostic and IT management tools as well as ourability to offer customers alternative service offerings from hardware support to consulting todatacenter outsourcing.
Software. Our software competitors include companies focused on providing software solutions forIT management, such as BMC Software Inc, CA Inc., and IBM Tivoli Software.
Personal Systems Group. The areas in which PSG operates are intensely competitive and arecharacterized by rapid price reductions and inventory depreciation. Our primary competitors for thebranded personal computers are Dell, Acer Inc, Apple Computer, Inc., Gateway, Inc., Lenovo GroupLimited and Toshiba Corporation. In particular regions, we also experience competition from localcompanies and from generically-branded or ‘‘white box’’ manufacturers. Our competitive advantagesinclude our broad product portfolio, our innovation and research and development capabilities, ourbrand and procurement leverage, our ability to cross sell our portfolio of offerings, our extensiveservice and support offerings and the availability of our broad based distribution of products from retailand commercial channels to direct sales.
Imaging and Printing Group. We are the leading imaging and printing systems provider in theworld for printer hardware, printing supplies and scanning devices. We believe that our brandrecognition, reputation for quality, breadth of product offerings and large customer base are importantcompetitive advantages. However, the markets for printer hardware and associated supplies are highlycompetitive, especially with respect to pricing and the introduction of new products and features. IPG’skey competitors include Canon USA, Inc., Lexmark International, Inc., Xerox Corporation (‘‘Xerox’’),Seiko Epson Corporation, Samsung Electronics Co. Ltd. and Dell. In addition, independent suppliersoffer refill and remanufactured alternatives for our supplies which, although generally offering lowerprint quality and reliability, may be offered at lower prices and put pressure on our supplies sales andmargins. Other companies also have developed and marketed new compatible cartridges for HP’s laserand inkjet products, particularly in jurisdictions outside of the United States where adequateintellectual property protection may not exist. In recent years, we and our competitors have regularlylowered prices on printer hardware both to reach new customers and in response to the competitiveenvironment. Important areas for future growth include digital photography in the home and outsidethe home, printer-based multi-function devices in the office space, digital presses in our imaging andgraphics space and driving color printing expansion in the office. While we encounter competitors insome product categories whose current market share is greater than ours, such as Xerox in copiers andHeidelberger Druckmaschinen Aktiengesellschaft in publishing, we believe we will provide importantnew contributions in the home, the office and publishing environments by providing comprehensivesolutions.
HP Financial Services. In our financing business, our competitors are captive financing companies,mainly IBM Global Financing, as well as banks and financial institutions. We believe our competitiveadvantage in this business over banks and financial institutions is our ability to finance products,services and total solutions.
For a discussion of risks attendant to these competitive factors, see ‘‘Risk Factors—Thecompetitive pressures we face could harm our revenue, gross margin and prospects,’’ in Item 1A, whichis incorporated herein by reference.
Environment
Some of our operations use substances regulated under various federal, state, local andinternational laws governing the environment, including laws governing the discharge of pollutants intothe air and water, the management and disposal of hazardous substances and wastes and the cleanup of
12
contaminated sites. Many of our products are subject to various federal, state, local and internationallaws governing chemical substances in products, including laws regulating the manufacture anddistribution of chemical substances and laws restricting the presence of certain substances in electronicsproducts. We could incur substantial costs, including cleanup costs, fines and civil or criminal sanctions,third-party damage or personal injury claims, if we were to violate or become liable underenvironmental laws or if our products become non-compliant with environmental laws. We also faceincreasing complexity in our product design and procurement operations as we adjust to new andfuture requirements relating to the materials composition of our products, including the restrictions onlead, cadmium and certain other substances that apply to specified electronics products put on themarket in the European Union (the ‘‘EU’’) as of July 1, 2006 (Restriction of Hazardous SubstancesDirective) and similar legislation in China, the labeling provisions of which go into effect March 1,2007. We also could face significant costs and liabilities in connection with product take-backlegislation. The EU has enacted the Waste Electrical and Electronic Equipment Directive, which makesproducers of electrical goods, including computers and printers, financially responsible for specifiedcollection, recycling, treatment and disposal of past and future covered products. The deadline for theindividual member states of the EU to enact the directive in their respective countries was August 13,2004 (such legislation, together with the directive, the ‘‘WEEE Legislation’’). Producers participating inthe market became financially responsible for implementing their responsibilities under the WEEELegislation beginning in August 2005. Implementation in certain EU member states has been delayedinto 2006 and 2007. Similar legislation has been or may be enacted in other jurisdictions, including inthe United States, Canada, Mexico, China and Japan. It is our policy to apply strict standards forenvironmental protection to sites inside and outside the United States, even if we are not subject toregulations imposed by local governments. The liability for environmental remediation and otherenvironmental costs is accrued when HP considers it probable and can reasonably estimate the costs.Environmental costs and accruals are presently not material to our operations or financial position, andwe do not currently anticipate material capital expenditures for environmental control facilities.
Executive Officers:
Mark V. Hurd; age 49; Chairman, Chief Executive Officer and President
Mr. Hurd has served as Chief Executive Officer, President and a member of the Board ofDirectors since April 1, 2005 and as Chairman since September 22, 2006. Prior to that, he served asChief Executive Officer of NCR Corporation, a technology company, from March 2003 to March 2005and as President of NCR from July 2001 to March 2005. From September 2002 to March 2003,Mr. Hurd was the Chief Operating Officer of NCR, and from July 2000 until March 2003 he was ChiefOperating Officer of NCR’s Teradata data-warehousing division.
R. Todd Bradley; age 48; Executive Vice President, Personal Systems Group
Mr. Bradley was elected Executive Vice President in June 2005. From October 2003 to June 2005,he served as the Chief Executive Officer of palmOne Inc., a mobile computing company. Mr. Bradleyalso served as President and Chief Operating Officer of palmOne from May 2002 until October 2003,and from June 2001 to May 2002 he served as Executive Vice President and Chief Operating Officer ofpalmOne.
Charles N. Charnas; age 48; Acting General Counsel, Vice President and Assistant Secretary
Mr. Charnas was elected Assistant Secretary in 1999 and has served as Acting General Counselsince September 2006. He was appointed Vice President and Deputy General Counsel in 2002. Since1999, he has headed the Corporate, Securities and Mergers and Acquisitions Section of HP’s worldwideLegal Department. Mr. Charnas is not an executive officer for purposes of Section 16 of the SecuritiesExchange Act of 1934.
13
Jon E. Flaxman; age 49; Senior Vice President, Controller and Principal Accounting Officer
Mr. Flaxman was elected Principal Accounting Officer on February 8, 2005. He was elected SeniorVice President in 2002 after serving as Vice President and Controller since May 2001.
Brian Humphries; age 33; Vice President, Investor Relations
Mr. Humphries was elected Vice President in 2004. Since July 2004, he has served as VicePresident of Investor Relations. From August 2003 to June 2004, he was Director of FinancialCommunications. From May 2002 to July 2003, he was director of Finance for Industry StandardServers. Before HP’s acquisition of Compaq, he served as Compaq’s Director of Investor Relationsfrom May 1999 to May 2002.
Vyomesh Joshi; age 52; Executive Vice President, Imaging and Printing Group
Mr. Joshi was elected Executive Vice President in 2002 after serving as Vice President sinceJanuary 2001. He became President of the Imaging and Printing Group in February 2001. Mr. Joshialso served as Chairman of Phogenix Imaging LLC, a joint venture between HP and Kodak, from 2000until May 2003, when Phogenix was dissolved. Mr. Joshi also is a director of Yahoo! Inc.
Richard H. Lampman; age 61; Senior Vice President of Research, Director of HP Labs
Mr. Lampman was elected Senior Vice President in 2002. He has served as the director of HPLabs since 1999. Mr. Lampman has announced his intention to retire in fiscal 2007.
Catherine A. Lesjak; age 47; Senior Vice President and Treasurer
Ms. Lesjak was elected Senior Vice President and Treasurer in 2003. From May 2002 to July 2003,she was Vice President of Finance for Enterprise Marketing and Solutions and Vice President ofFinance for the Software Global Business Unit. From June 2000 to May 2002, Ms. Lesjak wasController for the Software Solutions Organization. In December 2006, Ms. Lesjak was electedExecutive Vice President and Chief Financial Officer effective upon the effectiveness of the retirementof the current Executive Vice President and Chief Financial Officer, Robert P. Wayman.
Ann M. Livermore; age 48; Executive Vice President, Technology Solutions Group
Ms. Livermore was elected Executive Vice President in 2002 after serving as Vice President since1995. Since May 2004, she has led the Technology Solutions Group. In April 2001, she becamePresident of HP Services. Ms. Livermore also is a director of United Parcel Service, Inc.
Catherine T. Lyons; age 50; Executive Vice President and Chief Marketing Officer
Ms. Lyons was elected Executive Vice President and Chief Marketing Officer in June 2005. FromSeptember 2003 to June 2005, she was Senior Vice President of Business Imaging and Printing, andfrom 2001 to 2003, Ms. Lyons was Vice President and General Manager for the Inkjet SuppliesDivision.
Randall D. Mott; age 50; Executive Vice President and Chief Information Officer
Mr. Mott was elected Executive Vice President and Chief Information Officer in July 2005. From2000 to June 2005, Mr. Mott was Senior Vice President and Chief Information Officer of Dell, Inc.
14
Marcela Perez de Alonso; age 52; Executive Vice President, Human Resources
Ms. Perez de Alonso was elected Executive Vice President, Human Resources in January 2004.From 1999 until she joined HP in January 2004, Ms. Perez de Alonso was Division Head of CitigroupNorth Latin America Consumer Bank, in charge of the retail business operations of Citigroup inPuerto Rico, Venezuela, Colombia, Peru, Panama, the Bahamas and the Dominican Republic and alsoin charge of deposit products for the international retail bank until 2002.
Shane V. Robison; age 53; Executive Vice President and Chief Strategy and Technology Officer
Mr. Robison was elected Senior Vice President in 2002 in connection with HP’s acquisition ofCompaq. He has served as Chief Strategy and Technology Officer since May 2002. Prior to joining HP,Mr. Robison served as Senior Vice President, Technology and Chief Technology Officer at Compaqfrom 2000 to May 2002.
Robert P. Wayman; age 61; Executive Vice President and Chief Financial Officer
Mr. Wayman has served as Executive Vice President since December 1992 and Chief FinancialOfficer since 1984. Mr. Wayman served as interim CEO from February 2005 through March 2005. Hewas elected to HP’s Board of Directors in February 2005 and previously had served on the Board from1993 to 2002. Mr. Wayman also is a director of Con-way Inc. and Sybase Inc. Mr. Wayman will retirefrom his position as Executive Vice President and Chief Financial Officer effective on December 31,2006.
Employees
We had approximately 156,000 employees worldwide as of October 31, 2006.
Available Information and Exchange Certifications
Our Annual Report on Form 10-K, Quarterly Reports on Form 10-Q, Current Reports onForm 8-K and amendments to reports filed or furnished pursuant to Sections 13(a) and 15(d) of theSecurities Exchange Act of 1934, as amended, are available on our website at http://investor.hp.com, assoon as reasonably practicable after HP electronically files such reports with, or furnishes those reportsto, the Securities and Exchange Commission. HP’s Corporate Governance Guidelines, Board ofDirectors committee charters (including the charters of the Audit Committee, HR and CompensationCommittee, and Nominating and Governance Committee) and code of ethics entitled ‘‘Standards ofBusiness Conduct’’ also are available at that same location on our website. Stockholders may requestfree copies of these documents from:
Hewlett-Packard CompanyAttention: Investor Relations
3000 Hanover StreetPalo Alto, CA 94304
(866) GET-HPQ1 or (866) 438-4771http://investor.hp.com/docreq.cfm
We submitted the certification of the CEO of HP required by Section 303A.12(a) of the New YorkStock Exchange (NYSE) Listed Company Manual, relating to HP’s compliance with the NYSE’scorporate governance listing standards, to the NYSE on March 17, 2006 with no qualifications.
We included the certifications of the CEO and the CFO of HP required by Section 302 of theSarbanes-Oxley Act of 2002 and related rules, relating to the quality of HP’s public disclosure, in thisAnnual Report on Form 10-K as Exhibits 31.1 and 31.2.
15
ITEM 1A. Risk Factors.
Because of the following factors, as well as other variables affecting our operating results, pastfinancial performance may not be a reliable indicator of future performance, and historical trendsshould not be used to anticipate results or trends in future periods.
The competitive pressures we face could harm our revenue, gross margin and prospects.
We encounter aggressive competition from numerous and varied competitors in all areas of ourbusiness, and our competitors may target our key market segments. We compete primarily on the basisof technology, performance, price, quality, reliability, brand, reputation, distribution, range of productsand services, ease of use of our products, account relationships, customer training, service and support,security, availability of application software, and Internet infrastructure offerings. If our products,services, support and cost structure do not enable us to compete successfully based on any of thosecriteria, our operations, results and prospects could be harmed.
Unlike many of our competitors, we have a portfolio of businesses and must allocate resourcesacross these businesses while competing with companies that specialize in one or more of these productlines. As a result, we may invest less in certain areas of our businesses than our competitors do, andthese competitors may have greater financial, technical and marketing resources available to them thanour businesses that compete against them. Industry consolidation also may affect competition bycreating larger, more homogeneous and potentially stronger competitors in the markets in which wecompete, and our competitors also may affect our business by entering into exclusive arrangements withexisting or potential customers or suppliers.
We may have to continue to lower the prices of many of our products and services to staycompetitive, while at the same time trying to maintain or improve revenue and gross margin. Themarkets in which we do business, particularly the personal computer and printing markets, are highlycompetitive, and we encounter aggressive price competition for all of our products and services fromnumerous companies globally. Over the past several years, price competition in the market for personalcomputers, printers and related products has been particularly intense as competitors have aggressivelycut prices and lowered their product margins for these products. Our results of operations and financialcondition may be adversely affected by these and other industry-wide pricing pressures.
Because our business model is based on providing innovative and high quality products, we mayspend a proportionately greater amount on research and development than some of our competitors. Ifwe cannot proportionately decrease our cost structure on a timely basis in response to competitive pricepressures, our gross margin and therefore our profitability could be adversely affected. In addition, ifour pricing and other factors are not sufficiently competitive, or if there is an adverse reaction to ourproduct decisions, we may lose market share in certain areas, which could adversely affect our revenueand prospects.
Even if we are able to maintain or increase market share for a particular product, revenue coulddecline because the product is in a maturing industry. Revenue and margins also could decline due toincreased competition from other types of products. For example, refill and remanufactured alternativesfor some of HP’s LaserJet toner and inkjet cartridges compete with HP’s supplies business. In addition,other companies have developed and marketed new compatible cartridges for HP’s LaserJet and inkjetproducts, particularly in jurisdictions outside of the United States where adequate intellectual propertyprotection may not exist. HP expects competitive refill and remanufacturing and cloned cartridgeactivity to continue to pressure margins in IPG, which in turn has a significant impact on HP marginsand profitability overall.
16

If we cannot continue to develop, manufacture and market products and services that meet customerrequirements for innovation and quality, our revenue and gross margin may suffer.
The process of developing new high technology products and services and enhancing existingproducts and services is complex, costly and uncertain, and any failure by us to anticipate customers’changing needs and emerging technological trends accurately could significantly harm our market shareand results of operations. We must make long-term investments, develop or obtain appropriateintellectual property and commit significant resources before knowing whether our predictions willaccurately reflect customer demand for our products and services. After we develop a product, we mustbe able to manufacture appropriate volumes quickly and at low costs. To accomplish this, we mustaccurately forecast volumes, mixes of products and configurations that meet customer requirements,and we may not succeed at all or within a given product’s life cycle. Any delay in the development,production or marketing of a new product could result in our not being among the first to market,which could further harm our competitive position.
In the course of conducting our business, we must adequately address quality issues associated withour products and services, including defects in our engineering, design and manufacturing processes, aswell as defects in third-party components included in our products. In order to address quality issues,we work extensively with our customers and suppliers and engage in product testing to determine thecause of the problem and to determine appropriate solutions. However, we may have limited ability tocontrol quality issues, particularly with respect to faulty components manufactured by third parties. Ifwe are unable to determine the cause, find an appropriate solution or offer a temporary fix (or‘‘patch’’), we may delay shipment to customers, which would delay revenue recognition and couldadversely affect our revenue and reported results. Finding solutions to quality issues can be expensiveand may result in additional warranty, replacement and other costs, adversely affecting our profits. Ifnew or existing customers have difficulty operating our products, our operating margins could beadversely affected, and we could face possible claims if we fail to meet our customers’ expectations. Inaddition, quality issues can impair our relationships with new or existing customers and adversely affectour reputation, which could have a material adverse effect on our operating results.
If we do not effectively manage our product and services transitions, our revenue may suffer.
Many of the industries in which we compete are characterized by rapid technological advances inhardware performance, software functionality and features, frequent introduction of new products, shortproduct life cycles, and continual improvement in product price characteristics relative to productperformance. Among the risks associated with the introduction of new products and services are delaysin development or manufacturing, variations in costs, delays in customer purchases or reductions inprice of existing products in anticipation of new introductions, difficulty in predicting customer demandfor the new offerings and effectively managing inventory levels so that they are in line with anticipateddemand, risks associated with customer qualification and evaluation of new products and the risk thatnew products may have quality or other defects or may not be supported adequately by applicationsoftware. The introduction of new products by our suppliers, such as the release of the WindowsVista� operating system by Microsoft during HP’s first fiscal quarter of 2007, also may result in delaysin customer purchases and difficulty in predicting customer demand. If we do not make an effectivetransition from existing products and services to future offerings, our revenue may decline.
Our revenue and gross margin also may suffer due to the timing of product or serviceintroductions by our suppliers and competitors. This is especially challenging when a product has ashort life cycle or a competitor introduces a new product just before our own product introduction.Furthermore, sales of our new products and services may replace sales, or result in discounting of someof our current offerings, offsetting the benefit of even a successful introduction. There also may beoverlaps in the current products and services of HP and portfolios acquired through mergers andacquisitions that we must manage. In addition, it may be difficult to ensure performance of new
17
customer contracts in accordance with our revenue, margin and cost estimates and to achieveoperational efficiencies embedded in our estimates. Given the competitive nature of our industry, if anyof these risks materializes, future demand for our products and services and our results of operationsmay suffer.
Our revenue, cost of sales, and expenses may suffer if we cannot continue to license or enforce theintellectual property rights on which our business depends or if third parties assert that we violate theirintellectual property rights.
We rely upon patent, copyright, trademark and trade secret laws in the United States and similarlaws in other countries, and agreements with our employees, customers, suppliers and other parties, toestablish and maintain our intellectual property rights in technology and products used in ouroperations. However, any of our direct or indirect intellectual property rights could be challenged,invalidated or circumvented, or such intellectual property rights may not be sufficient to permit us totake advantage of current market trends or otherwise to provide competitive advantages, which couldresult in costly product redesign efforts, discontinuance of certain product offerings or othercompetitive harm. Further, the laws of certain countries do not protect our proprietary rights to thesame extent as the laws of the United States. Therefore, in certain jurisdictions we may be unable toprotect our proprietary technology adequately against unauthorized third-party copying or use, whichcould adversely affect our competitive position.
Because of the rapid pace of technological change in the information technology industry, much ofour business and many of our products rely on key technologies developed or licensed by third parties.We may not be able to obtain or to continue to obtain licenses and technologies from these thirdparties at all or on reasonable terms, or such third parties may demand cross-licenses to our intellectualproperty. In addition, it is possible that as a consequence of a merger or acquisition transaction thirdparties may obtain licenses to some of our intellectual property rights or our business may be subject tocertain restrictions that were not in place prior to the transaction. Consequently, we may lose acompetitive advantage with respect to these intellectual property rights or we may be required to enterinto costly arrangements in order to terminate or limit these rights.
Third parties also may claim that we or customers indemnified by us are infringing upon theirintellectual property rights. For example, in recent years, individuals and groups have begun purchasingintellectual property assets for the sole purpose of making claims of infringement and attempting toextract settlements from large companies such as HP. If we cannot or do not license the infringedtechnology at all or on reasonable terms or substitute similar technology from another source, ouroperations could suffer. Even if we believe that the claims are without merit, the claims can betime-consuming and costly to defend and divert management’s attention and resources away from ourbusiness. Claims of intellectual property infringement also might require us to redesign affectedproducts, enter into costly settlement or license agreements or pay costly damage awards, or face atemporary or permanent injunction prohibiting us from marketing or selling certain of our products.Even if we have an agreement to indemnify us against such costs, the indemnifying party may beunable to uphold its contractual agreements to us.
Finally, our costs of operations could be affected on an ongoing basis by the imposition ofcopyright levies or similar fees. In certain countries (primarily in Europe), proceedings are ongoingagainst HP seeking to impose levies upon equipment (such as multifunction devices and printers) andalleging that the copyright owners are entitled to compensation because these devices enablereproducing copyrighted content. Other countries that do not yet have levies on these types of devicesare expected to extend existing levy schemes. The ultimate impact of these potential copyright levies orsimilar fees, including the number of units impacted, the amount of levies imposed and the ability ofHP to recover such amounts through increased prices, remains uncertain.
18

Economic uncertainty could affect adversely our revenue, gross margin and expenses.
Our revenue and gross margin depend significantly on general economic conditions and thedemand for computing and imaging products and services in the markets in which we compete.Economic weakness and constrained IT spending has previously resulted, and may result in the future,in decreased revenue, gross margin, earnings or growth rates and problems with our ability to manageinventory levels and collect customer receivables. We could experience such economic weakness andreduced spending, particularly in our consumer businesses, due to the effects of high fuel costs. Inaddition, customer financial difficulties have previously resulted, and could result in the future, inincreases in bad debt write-offs and additions to reserves in our receivables portfolio, inability by ourlessees to make required lease payments and reduction in the value of leased equipment upon itsreturn to us compared to the value estimated at lease inception. We also have experienced, and mayexperience in the future, gross margin declines in certain businesses, reflecting the effect of items suchas competitive pricing pressures, inventory write-downs, charges associated with the cancellation ofplanned production line expansion, and increases in pension and post-retirement benefit expenses.Economic downturns also may lead to restructuring actions and associated expenses. Uncertainty aboutfuture economic conditions makes it difficult for us to forecast operating results and to make decisionsabout future investments. Delays or reductions in information technology spending could have amaterial adverse effect on demand for our products and services, and consequently our results ofoperations, prospects and stock price.
Terrorist acts, conflicts and wars may seriously harm our business and revenue, costs and expenses andfinancial condition and stock price.
Terrorist acts, conflicts or wars (wherever located around the world) may cause damage ordisruption to HP, our employees, facilities, partners, suppliers, distributors, resellers or customers. Thepotential for future attacks, the national and international responses to attacks or perceived threats tonational security, and other actual or potential conflicts or wars, including the ongoing militaryoperations in Iraq, have created many economic and political uncertainties. In addition, as a majormulti-national company with headquarters and significant operations located in the United States,actions against or by the United States may impact our business or employees. Although it isimpossible to predict the occurrences or consequences of any such events, they could result in adecrease in demand for our products, make it difficult or impossible to deliver products to ourcustomers or to receive components from our suppliers, create delays and inefficiencies in our supplychain and result in the need to impose employee travel restrictions. We are predominantly uninsuredfor losses and interruptions caused by terrorist acts, conflicts and wars.
Due to the international nature of our business, political or economic changes or other factors could harmour future revenue, costs and expenses and financial condition.
Sales outside the United States make up more than 60% of our net revenue. Our future revenue,gross margin, expenses and financial condition also could suffer due to a variety of internationalfactors, including:
• ongoing instability or changes in a country’s or region’s economic or political conditions,including inflation, recession, interest rate fluctuations and actual or anticipated military orpolitical conflicts;
• longer accounts receivable cycles and financial instability among customers;
• trade regulations and procedures and actions affecting production, pricing and marketing ofproducts;
• local labor conditions and regulations;
19
• managing a geographically dispersed workforce;
• changes in the regulatory or legal environment;
• differing technology standards or customer requirements;
• import, export or other business licensing requirements or requirements relating to makingforeign direct investments, which could affect our ability to obtain favorable terms forcomponents or lead to penalties or restrictions;
• difficulties associated with repatriating cash generated or held abroad in a tax-efficient mannerand changes in tax laws; and
• fluctuations in freight costs and disruptions in the transportation and shipping infrastructure atimportant geographic points of exit and entry for our products and shipments.
The factors described above also could disrupt our product and component manufacturing and keysuppliers located outside of the United States. For example, we rely on manufacturers in Taiwan for theproduction of notebook computers and other suppliers in Asia for product assembly and manufacture.
As more than 60% of our sales are from countries outside of the United States, other currencies,particularly the euro and the Japanese yen, can have an impact on HP’s results (expressed in U.S.dollars). Currency variations also contribute to variations in sales of products and services in impactedjurisdictions. In addition, currency variations can adversely affect margins on sales of our products incountries outside of the United States and margins on sales of products that include componentsobtained from suppliers located outside of the United States. We use a combination of forwardcontracts and options designated as cash flow hedges to protect against foreign currency exchange raterisks. Such hedging activities may be ineffective or may not offset more than a portion of the adversefinancial impact resulting from currency variations. Gains or losses associated with hedging activitiesalso may impact our revenue and to a lesser extent our cost of sales and financial condition.
In many foreign countries, particularly in those with developing economies, it is common to engagein business practices that are prohibited by laws and regulations applicable to us, such as the ForeignCorrupt Practices Act. Although we implement policies and procedures designed to ensure compliancewith these laws, our employees, contractors and agents, as well as those companies to which weoutsource certain of our business operations, may take actions in violation of our policies. Any suchviolation, even if prohibited by our policies, could have a material adverse effect on our business.
Business disruptions could seriously harm our future revenue and financial condition and increase our costsand expenses.
Our worldwide operations could be subject to earthquakes, power shortages, telecommunicationsfailures, water shortages, tsunamis, floods, hurricanes, typhoons, fires, extreme weather conditions,medical epidemics and other natural or manmade disasters or business interruptions, for which we arepredominantly self-insured. The occurrence of any of these business disruptions could seriously harmour revenue and financial condition and increase our costs and expenses. Our corporate headquarters,and a portion of our research and development activities, are located in California, and other criticalbusiness operations and some of our suppliers are located in California and Asia, near majorearthquake faults. The ultimate impact on us, our significant suppliers and our general infrastructure ofbeing located near major earthquake faults is unknown, but our revenue, profitability and financialcondition could suffer in the event of a major earthquake or other natural disaster. In addition, someareas, including California and parts of the East Coast, Southwest and Midwest of the United States,have previously experienced, and may experience in the future, major power shortages and blackouts.These blackouts could cause disruptions to our operations or the operations of our suppliers,distributors and resellers, or customers. Moreover, our planned consolidation of all of our worldwide ITdata centers into six centers located in the southern U.S. could increase the impact on us of a naturaldisaster or other business disruption occurring in that geographic area.
20
If we fail to manage the distribution of our products and services properly, our revenue, gross margin andprofitability could suffer.
We use a variety of different distribution methods to sell our products and services, includingthird-party resellers and distributors and both direct and indirect sales to both enterprise accounts andconsumers. Successfully managing the interaction of our direct and indirect channel efforts to reachvarious potential customer segments for our products and services is a complex process. Moreover,since each distribution method has distinct risks and gross margins, our failure to implement the mostadvantageous balance in the delivery model for our products and services could adversely affect ourrevenue and gross margins and therefore our profitability. Other distribution risks are described below.
• Our financial results could be materially adversely affected due to channel conflicts or if the financialconditions of our channel partners were to weaken.
Our future operating results may be adversely affected by any conflicts that might arisebetween our various sales channels, the loss or deterioration of any alliance or distributionarrangement or the loss of retail shelf space. Moreover, some of our wholesale and retaildistributors may have insufficient financial resources and may not be able to withstandchanges in business conditions, including economic weakness and industry consolidation. Manyof our significant distributors operate on narrow product margins and have been negativelyaffected by business pressures. Considerable trade receivables that are not covered bycollateral or credit insurance are outstanding with our distribution and retail channel partners.Revenue from indirect sales could suffer, and we could experience disruptions in distributionif our distributors’ financial conditions or operations weaken.
• Our inventory management is complex as we continue to sell a significant mix of products throughdistributors.
We must manage inventory effectively, particularly with respect to sales to distributors, whichinvolves forecasting demand and pricing issues. Distributors may increase orders duringperiods of product shortages, cancel orders if their inventory is too high or delay orders inanticipation of new products. Distributors also may adjust their orders in response to thesupply of our products and the products of our competitors and seasonal fluctuations inend-user demand. Our reliance upon indirect distribution methods may reduce visibility todemand and pricing issues, and therefore make forecasting more difficult. If we have excess orobsolete inventory, we may have to reduce our prices and write down inventory. Moreover,our use of indirect distribution channels may limit our willingness or ability to adjust pricesquickly and otherwise to respond to pricing changes by competitors. We also may have limitedability to estimate future product rebate redemptions in order to price our productseffectively.
We depend on third-party suppliers, and our revenue and gross margin could suffer if we fail to managesupplier issues properly.
Our operations depend on our ability to anticipate our needs for components, products andservices and our suppliers’ ability to deliver sufficient quantities of quality components, products andservices at reasonable prices in time for us to meet critical schedules. Given the wide variety of systems,products and services that we offer, the large number of our suppliers and contract manufacturers thatare dispersed across the globe, and the long lead times that are required to manufacture, assemble anddeliver certain components and products, problems could arise in planning production and managinginventory levels that could seriously harm us. Other supplier problems that we could face includecomponent shortages, excess supply, risks related to the terms of our contracts with suppliers, risksassociated with contingent workers, and risks related to our relationships with single source suppliers,as described below.
21
• Shortages. Occasionally we may experience a shortage of, or a delay in receiving, certain suppliesas a result of strong demand, capacity constraints, supplier financial weaknesses, disputes withsuppliers (some of which are also customers), other problems experienced by suppliers orproblems faced during the transition to new suppliers. If shortages or delays persist, the price ofthese supplies may increase, we may be exposed to quality issues or the supplies may not beavailable at all. We may not be able to secure enough supplies at reasonable prices or ofacceptable quality to build products or provide services in a timely manner in the quantities oraccording to the specifications needed. Accordingly, our revenue and gross margin could sufferas we could lose time-sensitive sales, incur additional freight costs or be unable to pass on priceincreases to our customers. If we cannot adequately address supply issues, we might have toreengineer some products or service offerings, resulting in further costs and delays.
• Oversupply. In order to secure supplies for the provision of products or services, at times we maymake advance payments to suppliers or enter into non-cancelable commitments with vendors. Inaddition, we may purchase supplies strategically in advance of demand to take advantage offavorable pricing or to address concerns about the availability of future supplies. If we fail toanticipate customer demand properly, a temporary oversupply could result in excess or obsoletecomponents, which could adversely affect our gross margin.
• Contractual terms. As a result of binding price or purchase commitments with vendors, we maybe obligated to purchase supplies or services at prices that are higher than those available in thecurrent market and be limited in our ability to respond to changing market conditions. In theevent that we become committed to purchase supplies or services for prices in excess of thecurrent market price, we may be at a disadvantage to competitors who have access tocomponents or services at lower prices, and our gross margin could suffer. In addition, many ofour competitors obtain products or components from the same CMs, ODMs and suppliers thatwe utilize. Our competitors may obtain better pricing and other terms and more favorableallocations of products and components during periods of limited supply, and our ability toengage in relationships with certain CMs, ODMs and suppliers could be limited. In addition,certain of our CMs, ODMs and suppliers may decide in the future to discontinue conductingbusiness with us. Any of these actions by our competitors, CMs, ODMs or suppliers couldadversely affect our future operating results and financial condition.
• Contingent workers. We also rely on third-party suppliers for the provision of contingent workers,and our failure to manage our use of such workers effectively could adversely affect our resultsof operations. As described in Note 17 to the Consolidated Financial Statements, we have beenexposed to various legal claims relating to the status of contingent workers and could facesimilar claims in the future. We may be subject to shortages, oversupply or fixed contractualterms relating to contingent workers, as described above. Our ability to manage the size of, andcosts associated with, the contingent workforce may be subject to additional constraints imposedby local laws.
• Single source suppliers. Our use of single source suppliers for certain components couldexacerbate our supplier issues. We obtain a significant number of components from singlesources due to technology, availability, price, quality or other considerations. For example, werely on Intel to provide us with a sufficient supply of processors for many of our PCs,workstations, handheld computing devices and servers, and some of those processors arecustomized for our products. New products that we introduce may utilize custom componentsobtained from only one source initially until we have evaluated whether there is a need foradditional suppliers. Replacing a single source supplier could delay production of some productsas replacement suppliers initially may be subject to capacity constraints or other outputlimitations. For some components, such as customized components and some of the processorsthat we obtain from Intel, alternative sources may not exist or those alternative sources may be
22
unable to produce the quantities of those components necessary to satisfy our productionrequirements. In addition, we sometimes purchase components from single source suppliersunder short-term agreements that contain favorable pricing and other terms but that may beunilaterally modified or terminated by the supplier with limited notice and with little or nopenalty. The performance of such single source suppliers under those agreements (and therenewal or extension of those agreements upon similar terms) may affect the quality, quantityand price of supplies to HP. The loss of a single source supplier, the deterioration of ourrelationship with a single source supplier, or any unilateral modification to the contractual termsunder which we are supplied components by a single source supplier could adversely effect ourrevenue and gross margins.
The revenue and profitability of our operations have historically varied, which makes our future financialresults less predictable.
Our revenue, gross margin and profit vary among our products and services, customer groups andgeographic markets and therefore will likely be different in future periods than our current results.Overall gross margins and profitability in any given period are dependent partially on the product,customer and geographic mix reflected in that period’s net revenue. In particular, IPG and certain ofits business units such as printer supplies contribute significantly to our gross margin and profitability.Competition, lawsuits, investigations and other risks affecting IPG therefore may have a significantimpact on our overall gross margin and profitability. Certain segments, and ESS in particular, have ahigher fixed cost structure than others and may experience significant operating profit volatility on aquarterly basis. In addition, newer geographic markets may be relatively less profitable due toinvestments associated with entering those markets and local pricing pressures. Market trends,competitive pressures, commoditization of products, seasonal rebates, increased component or shippingcosts, regulatory impacts and other factors may result in reductions in revenue or pressure on grossmargins of certain segments in a given period, which may necessitate adjustments to our operations.
Unanticipated changes in HP’s tax provisions or exposure to additional income tax liabilities could affectour profitability.
We are subject to income taxes in the United States and numerous foreign jurisdictions. Our taxliabilities are affected by the amounts we charge for inventory, services, licenses, funding and otheritems in intercompany transactions. We are subject to ongoing tax audits in various jurisdictions. Taxauthorities may disagree with our intercompany charges or other matters and assess additional taxes.We regularly assess the likely outcomes of these audits in order to determine the appropriateness ofour tax provision. However, there can be no assurance that we will accurately predict the outcomes ofthese audits, and the actual outcomes of these audits could have a material impact on our net incomeor financial condition. In addition, our effective tax rate in the future could be adversely affected bychanges in the mix of earnings in countries with differing statutory tax rates, changes in the valuation ofdeferred tax assets and liabilities, changes in tax laws and the discovery of new information in thecourse of our tax return preparation process. In particular, the carrying value of deferred tax assets,which are predominantly in the United States, is dependent on our ability to generate future taxableincome in the United States. Any of these changes could affect our profitability. Furthermore, our taxprovisions could be adversely affected as a result of any new interpretative accounting guidance relatedto accounting for uncertain tax positions.
Our sales cycle makes planning and inventory management difficult and future financial results lesspredictable.
Our quarterly sales have reflected a pattern in which a disproportionate percentage of eachquarter’s total sales occur towards the end of such quarter. This uneven sales pattern makes prediction
23
of revenue, earnings and working capital for each financial period difficult, increases the risk ofunanticipated variations in quarterly results and financial condition and places pressure on ourinventory management and logistics systems. If predicted demand is substantially greater than orders,there will be excess inventory. Alternatively, if orders substantially exceed predicted demand, we maynot be able to fulfill all of the orders received in the last few weeks of each quarter. Otherdevelopments late in a quarter, such as a systems failure, component pricing movements or globallogistics disruptions, could adversely impact inventory levels and results of operations in a manner thatis disproportionate to the number of days in the quarter affected.
We experience some seasonal trends in the sale of our products that also may produce variationsin quarterly results and financial condition. For example, sales to governments (particularly sales to theUnited States government) are often stronger in the third calendar quarter, consumer sales are oftenstronger in the fourth calendar quarter, and many customers whose fiscal and calendar years are thesame spend their remaining capital budget authorizations in the fourth calendar quarter prior to newbudget constraints in the first calendar quarter of the following year. European sales are often weakerduring the summer months. Demand during the spring and early summer also may be adverselyimpacted by market anticipation of seasonal trends. Moreover, to the extent that we introduce newproducts in anticipation of seasonal demand trends, our discounting of existing products may adverselyaffect our gross margin prior to or shortly after such product launches. Typically, our third fiscalquarter is our weakest and our fourth fiscal quarter is our strongest. Many of the factors that createand affect seasonal trends are beyond our control.
Any failure by us to execute planned cost reductions successfully could result in total costs and expenses thatare greater than expected.
Historically, we have undertaken restructuring and other cost reduction plans to bring operationalexpenses to appropriate levels for each of our businesses, while simultaneously implementing extensivenew company-wide expense control programs. In July 2005, we announced workforce restructurings aswell as reductions through a U.S. early retirement program. We now expect these programs to involvethe elimination or early retirement of approximately 15,200 positions worldwide through the firstquarter of fiscal 2007. We expect to reinvest a significant portion of the cost savings from these actionsto offset market forces or to be reinvested in our businesses to strengthen HP’s competitiveness,particularly through hiring in key areas. We may have further workforce reductions or rebalancingactions in the future. Significant risks associated with these actions and other workforce managementissues that may impair our ability to achieve anticipated cost reductions or may otherwise harm ourbusiness include delays in implementation of anticipated workforce reductions in highly regulatedlocations outside of the United States, particularly in Europe and Asia, and increased costs associatedwith workforce reductions in those locations, redundancies among restructuring programs, decreases inemployee morale and the failure to meet operational targets due to the loss of employees, particularlysales employees.
During HP’s third fiscal quarter of 2006, we announced a multi-year plan to reduce IT spending byconsolidating HP’s 85 data centers worldwide into six larger centers located in three U.S. cities, afour-year program to reduce real estate costs by consolidating several hundred HP real estate locationsworldwide to fewer core sites, and a plan to integrate the activities carried out by our GlobalOperations organization directly into our business segments. Such actions are expected to result ininstances of accelerated depreciation or asset impairment when we vacate facilities or cease usingequipment before the end of their respective lease term or asset life. Our ability to achieve theanticipated cost savings and other benefits from these initiatives within the expected time frame issubject to many estimates and assumptions, including assumptions regarding the costs and timing ofactivities in connection with these initiatives. These estimates and assumptions are subject to significanteconomic, competitive and other uncertainties some of which are beyond our control. If these
24

assumptions are not realized and we experience delays, or if other unforeseen events occur, ourbusiness and results of operations could be adversely affected.
In order to be successful, we must attract, retain and motivate key employees, and failure to do so couldseriously harm us.
In order to be successful, we must attract, retain and motivate executives and other key employees,including those in managerial, technical, sales, marketing and IT support positions. We also must keepemployees focused on HP’s strategies and goals, which may be more difficult due to uncertaintysurrounding the workforce reduction efforts and the pension and retiree medical benefit plan changesannounced in July 2005. Hiring and retaining qualified executives, engineers, skilled solutions providersin the IT support business and qualified sales representatives are critical to our future, and competitionfor experienced employees in the IT industry can be intense. The failure to hire or loss of keyemployees could have a significant impact on our operations.
Cost reduction efforts associated with our share-based payment awards and other compensation and benefitprograms could adversely affect our ability to attract and retain employees.
We have historically used stock options and other forms of share-based payment awards as keycomponents of our total rewards employee compensation program in order to align employees’interests with the interests of our stockholders, encourage employee retention and provide competitivecompensation and benefit packages. HP began recording charges to earnings for stock-basedcompensation expense in the first quarter of fiscal 2006 in accordance with Statement of FinancialAccounting Standards No. 123 (revised 2004), ‘‘Share-Based Payment’’. As a result, we will incurincreased compensation costs associated with our stock-based compensation programs. Moreover,difficulties relating to obtaining stockholder approval of equity compensation plans could make itharder or more expensive for us to grant share-based payment awards to employees in the future. Likeother companies, HP has reviewed its equity compensation strategy in light of the current regulatoryand competitive environment and has decided to reduce the total number of options granted toemployees and the number of employees who receive share-based payment awards. Due to this changein our stock-based compensation strategy, combined with the pension and other benefit plan changesundertaken to reduce costs and our increasing reliance on variable pay, we may find it difficult toattract, retain and motivate employees, and any such difficulty could materially adversely affect ourbusiness.
HP’s stock price has historically fluctuated and may continue to fluctuate, which may make future prices ofHP’s stock difficult to predict.
HP’s stock price, like that of other technology companies, can be volatile. Some of the factors thatcan affect our stock price are:
• speculation in the press or investment community about, or actual changes in, our executiveteam, strategic position, business, organizational structure, operations, financial condition,financial reporting and results, effectiveness of cost cutting efforts, prospects or extraordinarytransactions;
• the announcement of new products, services, technological innovations or acquisitions by HP orcompetitors; and
• quarterly increases or decreases in revenue, gross margin or earnings, changes in estimates bythe investment community or guidance provided by HP, and variations between actual andestimated financial results.
25

General or industry-specific market conditions or stock market performance or domestic orinternational macroeconomic and geopolitical factors unrelated to HP’s performance also may affectthe price of HP common stock. For these reasons, investors should not rely on recent trends to predictfuture stock prices, financial condition, results of operations or cash flows. In addition, followingperiods of volatility in a company’s securities, securities class action litigation against a company issometimes instituted. If instituted against HP, this type of litigation could result in substantial costs andthe diversion of management time and resources.
System security risks and systems integration issues could disrupt our internal operations or informationtechnology services provided to customers, and any such disruption could harm our revenue, increase ourexpenses and harm our reputation and stock price.
Experienced computer programmers and hackers may be able to penetrate our network securityand misappropriate our confidential information or that of third parties, create system disruptions orcause shutdowns. In addition, computer programmers and hackers may be able to develop and deployviruses, worms, and other malicious software programs that attack our products or otherwise exploitany security vulnerabilities of our products. As a result, we could incur significant expenses inaddressing problems created by security breaches of our network and any security vulnerabilities of ourproducts. Moreover, we could lose existing or potential customers for information technologyoutsourcing services or other information technology solutions or incur significant expenses inconnection with our customers’ system failures or any actual or perceived security vulnerabilities in ourproducts. In addition, sophisticated hardware and operating system software and applications that weproduce or procure from third parties may contain defects in design or manufacture, including ‘‘bugs’’and other problems that could unexpectedly interfere with the operation of the system. The costs to usto eliminate or alleviate security problems, bugs, viruses, worms, malicious software programs andsecurity vulnerabilities could be significant, and the efforts to address these problems could result ininterruptions, delays, cessation of service and loss of existing or potential customers that may impedeour sales, manufacturing, distribution or other critical functions.
Portions of our IT infrastructure also may experience interruptions, delays or cessations of serviceor produce errors in connection with systems integration or migration work that takes place from timeto time. We may not be successful in implementing new systems and transitioning data, including ourplanned consolidation of all of our worldwide IT data centers into six centers, which could causebusiness disruptions and be more expensive, time consuming, disruptive and resource-intensive. Suchdisruptions could adversely impact our ability to fulfill orders and interrupt other processes. Delayedsales, lower margins or lost customers resulting from these disruptions have adversely affected in thepast, and in the future could adversely affect, our financial results, stock price and reputation.
Any failure by us to manage, complete and integrate acquisitions, divestitures and other significanttransactions successfully could harm our financial results, business and prospects and may result infinancial results that are different than expected.
As part of our business strategy, we frequently engage in discussions with third parties regardingpossible investments, acquisitions, strategic alliances, joint ventures, divestitures and outsourcingtransactions (‘‘extraordinary transactions’’) and enter into agreements relating to such extraordinarytransactions in order to further our business objectives. In order to pursue this strategy successfully, wemust identify suitable candidates for and successfully complete extraordinary transactions, some ofwhich may be large and complex, and manage post-closing issues such as the integration of acquiredcompanies or employees. Integration and other risks of extraordinary transactions can be morepronounced for larger and more complicated transactions, or if multiple transactions are pursuedsimultaneously. If we fail to identify and complete successfully extraordinary transactions that furtherour strategic objectives, we may be required to expend resources to develop products and technology
26

internally, we may be at a competitive disadvantage or we may be adversely affected by negative marketperceptions, any of which may have a material adverse effect on our revenue, gross margin andprofitability.
Integration issues are complex, time-consuming and expensive and, without proper planning andimplementation, could significantly disrupt our business. The challenges involved in integration include:
• combining product offerings and entering into new markets in which we are not experienced;
• convincing customers and distributors that the transaction will not diminish client servicestandards or business focus, preventing customers and distributors from deferring purchasingdecisions or switching to other suppliers (which could result in our incurring additionalobligations in order to address customer uncertainty), and coordinating sales, marketing anddistribution efforts;
• consolidating and rationalizing corporate IT infrastructure, which may include multiple legacysystems from various acquisitions and integrating software code;
• minimizing the diversion of management attention from ongoing business concerns;
• persuading employees that business cultures are compatible, maintaining employee morale andretaining key employees, engaging with employee works councils representing an acquiredcompany’s non-U.S. employees, integrating employees into HP, correctly estimating employeebenefit costs and implementing restructuring programs;
• coordinating and combining administrative, manufacturing, research and development and otheroperations, subsidiaries, facilities and relationships with third parties in accordance with locallaws and other obligations while maintaining adequate standards, controls and procedures;
• achieving savings from supply chain integration; and
• managing integration issues shortly after or pending the completion of other independenttransactions.
We evaluate and enter into significant extraordinary transactions on an ongoing basis. We may notfully realize all of the anticipated benefits of any extraordinary transaction, and the timeframe forachieving benefits of an extraordinary transaction may depend partially upon the actions of employees,suppliers or other third parties. In addition, the pricing and other terms of our contracts forextraordinary transactions require us to make estimates and assumptions at the time we enter intothese contracts, and, during the course of our due diligence, we may not identify all of the factorsnecessary to estimate our costs accurately. Any increased or unexpected costs, unanticipated delays orfailure to achieve contractual obligations could make these agreements less profitable or unprofitable.
Managing extraordinary transactions requires varying levels of management resources, which maydivert our attention from other business operations. These extraordinary transactions also have resultedand in the future may result in significant costs and expenses and charges to earnings, including thoserelated to severance pay, early retirement costs, employee benefit costs, asset impairment charges,charges from the elimination of duplicative facilities and contracts, in-process research anddevelopment charges, inventory adjustments, assumed litigation and other liabilities, legal, accountingand financial advisory fees, and required payments to executive officers and key employees underretention plans. Moreover, HP has incurred and will incur additional depreciation and amortizationexpense over the useful lives of certain assets acquired in connection with extraordinary transactions,and, to the extent that the value of goodwill or intangible assets with indefinite lives acquired inconnection with an extraordinary transaction becomes impaired, we may be required to incur additionalmaterial charges relating to the impairment of those assets. In order to complete an acquisition, wemay issue common stock, potentially creating dilution for existing stockholders, or borrow, affecting our
27
financial condition and potentially our credit ratings. Any prior or future downgrades in our creditrating associated with an acquisition could adversely affect our ability to borrow and result in morerestrictive borrowing terms. In addition, HP’s effective tax rate on an ongoing basis is uncertain, andextraordinary transactions could impact our effective tax rate. We also may experience risks relating tothe challenges and costs of closing an extraordinary transaction and the risk that an announcedextraordinary transaction may not close. As a result, any completed, pending or future transactions maycontribute to financial results that differ from the investment community’s expectations in a givenquarter.
We cannot predict the outcome of various regulatory inquiries and stockholder derivative action lawsuitsarising out of the processes employed in the investigation into leaks of HP confidential information tomembers of the media, and we may be named in additional regulatory inquiries and stockholder litigation,all of which could result in significant legal and other expenses.
The Attorney General of the State of California, the Committee on Energy and Commerce of theU.S. House of Representatives, the United States Attorney’s Office for the Northern District ofCalifornia, the Division of Enforcement of the SEC and the Federal Communications Commission areall conducting or have conducted inquiries or investigations relating to the processes employed in theinvestigation into leaks of HP confidential information to members of the media. Four stockholderderivative lawsuits also have been filed in California (all of which have been consolidated into a singlelawsuit) and two in Delaware purportedly on behalf of HP stockholders seeking to recover damagesand to obtain specified injunctive relief stemming from the activities of the leak investigations. Otherregulatory inquiries or investigations may be commenced by other U.S. federal, state or foreignregulatory agencies, and we may in the future be subject to additional litigation or other proceedingsarising in relation to these matters. The period of time necessary to resolve these regulatory inquiriesand investigations and stockholder lawsuits is uncertain, and the expense of responding to theseinquiries and defending such litigation may be significant. In addition, we may be obligated toindemnify (and advance legal expenses to) former or current directors, officers or employees inaccordance with the terms of our certificate of incorporation, bylaws, other applicable agreements, andDelaware law. Further, if we enter into settlement agreements or are subject to an adverse findingresulting from any of these inquiries, we could be required to pay fines or penalties or have otherremedies imposed upon us.
We have entered into an agreement with the California Attorney General to resolve civil claimsrelating to the leak investigation. Under the terms of the agreement, which includes an injunction, wehave agreed to pay a total of $14.5 million and to implement and maintain for five years a series ofmeasures designed to ensure that HP’s corporate investigations are conducted in accordance withCalifornia law and the company’s high ethical standards. If we fail to implement and maintain thesemeasures as required under the agreement, we could be subject to civil or criminal penalties.
Unforeseen environmental costs could impact our future net earnings.
Some of our operations use substances regulated under various federal, state and internationallaws governing the environment, including laws governing the discharge of pollutants into the air andwater, the management and disposal of hazardous substances and wastes and the cleanup ofcontaminated sites. Many of our products are subject to various federal, state and international lawsgoverning chemical substances in products, including laws regulating the manufacture and distributionof chemical substances and laws restricting the presence of certain substances in electronics products.We could incur substantial costs, including cleanup costs, fines and civil or criminal sanctions, third-party property damage or personal injury claims, or our products could be enjoined from enteringcertain jurisdictions, if we were to violate or become liable under environmental laws or if our productsbecome non-compliant with environmental laws. We also face increasing complexity in our product
28
design and procurement operations as we adjust to new and future requirements relating to thematerials composition of our products, including the restrictions on lead, cadmium and certain othersubstances that apply to specified electronics products put on the market in the European Union as ofJuly 1, 2006 (Restriction of Hazardous Substances Directive) and similar legislation in China, thelabeling provisions of which go into effect on March 1, 2007 in China. The ultimate costs underenvironmental laws and the timing of these costs are difficult to predict, and liability under someenvironmental laws relating to contaminated sites can be imposed retroactively and on a joint andseveral basis. It is our policy to apply strict standards for environmental protection to sites inside andoutside the United States, even when we are not subject to local government regulations. We also couldface significant costs and liabilities in connection with product take-back legislation. We record aliability for environmental remediation and other environmental costs when we consider the costs to beprobable and the amount of the costs can be reasonably estimated. The EU has enacted the WasteElectrical and Electronic Equipment Directive, which makes producers of electrical goods, includingcomputers and printers, financially responsible for specified collection, recycling, treatment and disposalof past and future covered products. The deadline for the individual member states of the EU to enactthe directive in their respective countries was August 13, 2004 (such legislation, together with thedirective, the ‘‘WEEE Legislation’’). Producers participating in the market became financiallyresponsible for implementing these responsibilities beginning in August 2005. Implementation in certainEU member states has been delayed into 2006 and 2007. HP’s potential liability resulting from theWEEE Legislation may be substantial. Similar legislation has been or may be enacted in otherjurisdictions, including in the United States, Canada, Mexico, China and Japan, the cumulative impactof which could be significant.
Some anti-takeover provisions contained in our certificate of incorporation and bylaws, as well as provisionsof Delaware law, could impair a takeover attempt.
We have provisions in our certificate of incorporation and bylaws, each of which could have theeffect of rendering more difficult or discouraging an acquisition of HP deemed undesirable by ourBoard of Directors. These include provisions:
• authorizing blank check preferred stock, which HP could issue with voting, liquidation, dividendand other rights superior to our common stock;
• limiting the liability of, and providing indemnification to, HP’s directors and officers;
• specifying that HP stockholders may take action only at a duly called annual or special meetingof stockholders and otherwise in accordance with our bylaws and limiting the ability of ourstockholders to call special meetings;
• requiring advance notice of proposals by HP stockholders for business to be conducted atstockholder meetings and for nominations of candidates for election to our Board of Directors;
• requiring a vote by the holders of two-thirds of HP’s outstanding shares to amend certain bylawsrelating to HP stockholder meetings, the Board of Directors and indemnification; and
• controlling the procedures for conduct of HP Board and stockholder meetings and election,appointment and removal of HP directors.
These provisions, alone or together, could deter or delay hostile takeovers, proxy contests andchanges in control or management of HP. As a Delaware corporation, HP also is subject to provisionsof Delaware law, including Section 203 of the Delaware General Corporation Law, which preventssome stockholders from engaging in certain business combinations without approval of the holders ofsubstantially all of HP’s outstanding common stock.
29
Any provision of our certificate of incorporation or bylaws or Delaware law that has the effect ofdelaying or deterring a change in control of HP could limit the opportunity for our stockholders toreceive a premium for their shares of HP common stock and also could affect the price that someinvestors are willing to pay for HP common stock.
ITEM 1B. Unresolved Staff Comments.
Not applicable.
ITEM 2. Properties.
As of October 31, 2006, we owned or leased a total of approximately 64 million square feet ofspace worldwide. We believe that our existing properties are in good condition and are suitable for theconduct of our business.
As of October 31, 2006, our sales and support operations occupied approximately 12 millionsquare feet. We own 42% of the space used for sales and support activities and lease the remaining58%.
Our manufacturing plants, research and development facilities and warehouse and administrativefacilities occupied approximately 52 million square feet. We own 56% of our manufacturing, researchand development, warehouse and administrative space and lease the remaining 44%. Our plants areequipped with machinery, most of which we own and which, in part, we developed to meet the specialrequirements of our manufacturing processes. At the end of fiscal 2006, we were productively utilizingthe majority of the space in our facilities, while executing our previously announced plans toconsolidate our 85 data centers into six larger centers and to reduce our real estate costs and increaseour productive utilization by consolidating several hundred real estate locations worldwide to fewercore sites over the next four years.
As indicated above, we have seven business segments: ESS, HPS, Software, PSG, IPG, HPFS, andCorporate Investments. Because of the interrelation of these segments, a majority of these segmentsuse substantially all of the properties at least in part, and we retain the flexibility to use each of theproperties in whole or in part for each of the segments.
Our principal executive offices, including global headquarters, are located at 3000 Hanover Street,Palo Alto, California, United States of America. The locations of our headquarters of geographicoperations at October 31, 2006 were as follows:
Headquarters of Geographic Operations
Americas Europe, Middle East, Africa Asia Pacific, including JapanHouston, Texas Geneva, Switzerland Singapore
30
The locations of our major product development and manufacturing facilities and HP Labs atOctober 31, 2006 were as follows:
Product Development and Manufacturing
Americas Europe, Middle East, Africa Hewlett-Packard Laboratories
Cupertino, Fremont, Palo Alto, Herrenberg, Germany Palo Alto, CaliforniaRoseville, San Diego andWoodland, California Dublin, Ireland Bangalore, India
Fort Collins and Colorado Springs, Rehovot and Netanya, Israel Haifa, IsraelColorado
Boise, Idaho Amersfoort, The Netherlands Tokyo, Japan
Indianapolis, Indiana Barcelona, Spain Bristol, United Kingdom
Andover and Marlboro, Erskine, United KingdomMassachusetts
Nashua, New Hampshire Asia Pacific, including Japan
Swedesboro, New Jersey Shanghai, China
Corvallis, Oregon Akishima, Japan
Memphis and Nashville, Tennessee Singapore
Houston, Texas
Sandston, Virginia
Vancouver, Washington
Aguadilla, Puerto Rico
ITEM 3. Legal Proceedings.
Information with respect to this item may be found in Note 17 to the Consolidated FinancialStatements in Item 8, which is incorporated herein by reference.
ITEM 4. Submission of Matters to a Vote of Security Holders.
Not applicable.
31
PART II
ITEM 5. Market for the Registrant’s Common Equity, Related Stockholder Matters and IssuerPurchases of Equity Securities.
Information regarding the market prices of HP common stock and the markets for that stock maybe found in the ‘‘Quarterly Summary’’ in Item 8 and on the cover page of this Form 10-K, respectively,which are incorporated herein by reference. We have paid cash dividends each fiscal year since 1965.The current rate is $0.08 per share per quarter. As of November 30, 2006, there were approximately153,000 stockholders of record. Additional information concerning dividends may be found in ‘‘SelectedFinancial Data’’ in Item 6 and in Item 8, which are incorporated herein by reference.
Recent Sales of Unregistered Securities
There were no unregistered sales of equity securities during fiscal 2006.
Issuer Purchases of Equity Securities
Total Number ofShares Purchased as Approximate Dollar Value of
Total Number Average Part of Publicly Shares that May Yet Beof Shares Price Paid Announced Purchased under the
Period Purchased per Share Plans or Programs Plans or Programs
Month #1(August 2006) . . . . . . . . . . . . . 17,565,587 $32.85 17,565,587 $7,127,610,269
Month #2(September 2006) . . . . . . . . . . 10,789,700 $34.65 10,789,700 $6,753,789,848
Month #3(October 2006) . . . . . . . . . . . . 14,357,900 $36.39 14,357,900 $6,231,316,993
Total . . . . . . . . . . . . . . . . . . . . . 42,713,187 $34.49 42,713,187
HP repurchased shares in the fourth quarter of fiscal 2006 under an ongoing program to managethe dilution created by shares issued under employee stock plans as well as to repurchase sharesopportunistically. This program, which does not have a specific expiration date, authorizes repurchasesin the open market or in private transactions. All shares repurchased in the fourth quarter of fiscal2006, other than shares repurchased under the prepaid variable share purchase program discussedbelow, were purchased in open market transactions.
In addition to the shares that HP repurchased, HP received approximately 13 million shares and34 million shares of common stock, respectively, under its prepaid variable share purchase program(‘‘PVSPP’’) during the three months and fiscal year ended October 31, 2006. HP entered into thePVSPP with a third-party investment bank during the first quarter of fiscal 2006. Under the PVSPP, HPprepaid $1.7 billion in exchange for the right to receive a variable number of shares of its commonstock weekly over a one year period beginning in the second quarter of fiscal 2006 and ending duringthe second quarter of fiscal 2007. The approximately 13 million shares of common stock that HPreceived under the PVSPP reduced the prepaid balance under the PVSPP by $431 million during thefourth quarter of fiscal 2006. Such shares and amounts are reflected in the table above in the monthsthe shares were received. As of October 31, 2006, HP received approximately 34 million shares ofcommon stock under the PVSPP, which reduced the prepaid balance under the PVSPP by $1.1 billion.
The prices at which HP purchases shares under the PVSPP are subject to a minimum andmaximum that were determined in advance of any repurchases being completed, thereby effectivelyhedging HP’s repurchase price. The exact number of shares to be repurchased is based upon thevolume weighted average market price of HP’s shares during each weekly settlement period, subject to
32

the minimum and maximum price as well as regulatory limitations on the number of shares HP ispermitted to repurchase. HP decreases its shares outstanding each settlement period as shares arephysically received. HP will retire all shares repurchased under the PVSPP, and HP will no longer deemthose shares outstanding. See Note 14 to the Consolidated Financial Statements in Item 8 for moredetails.
On August 15, 2006, HP’s Board of Directors authorized an additional $6.0 billion for futurerepurchases of outstanding shares of common stock. As of October 31, 2006, HP had remainingauthorization of approximately $5.6 billion for future share repurchases. Previously authorized sharerepurchases also will be made under the PVSPP until the remaining available balance is exhausted inthe second quarter of fiscal 2007.
ITEM 6. Selected Financial Data.
The information set forth below is not necessarily indicative of results of future operations, andshould be read in conjunction with Item 7, ‘‘Management’s Discussion and Analysis of FinancialCondition and Results of Operations,’’ and the Consolidated Financial Statements and notes theretoincluded in Item 8, ‘‘Financial Statements and Supplementary Data,’’ of this Form 10-K, which areincorporated herein by reference, in order to understand further the factors that may affect thecomparability of the financial data presented below.
HEWLETT-PACKARD COMPANY AND SUBSIDIARIESSelected Financial Data(1)
For the fiscal years ended October 31,
2006 2005 2004 2003 2002
In millions, except per share amounts
Net revenue . . . . . . . . . . . . . . . . . . . . . . . . . . . . . . $91,658 $86,696 $79,905 $73,061 $56,588Earnings (loss) from operations(2) . . . . . . . . . . . . . . $ 6,560 $ 3,473 $ 4,227 $ 2,896 $(1,012)Net earnings (loss)(2)(3) . . . . . . . . . . . . . . . . . . . . . . $ 6,198 $ 2,398 $ 3,497 $ 2,539 $ (903)Net earnings (loss) per share(2)(3)
Basic . . . . . . . . . . . . . . . . . . . . . . . . . . . . . . . . . $ 2.23 $ 0.83 $ 1.16 $ 0.83 $ (0.36)Diluted . . . . . . . . . . . . . . . . . . . . . . . . . . . . . . . . $ 2.18 $ 0.82 $ 1.15 $ 0.83 $ (0.36)
Cash dividends declared per share . . . . . . . . . . . . . . $ 0.32 $ 0.32 $ 0.32 $ 0.32 $ 0.32At year-end:
Total assets . . . . . . . . . . . . . . . . . . . . . . . . . . . . . $81,981 $77,317 $76,138 $74,716 $70,710Long-term debt . . . . . . . . . . . . . . . . . . . . . . . . . . $ 2,490 $ 3,392 $ 4,623 $ 6,494 $ 6,035
(1) HP’s Consolidated Financial Statements and notes thereto reflect HP’s acquisition of Compaq onMay 3, 2002. The occurrence of the acquisition in the middle of fiscal 2002 affects thecomparability of financial information for fiscal years after 2002.
33
(2) Earnings (loss) from operations include the following items:
2006 2005 2004 2003 2002
In millions
Amortization of purchased intangible assets . . . . . . $ 604 $ 622 $603 $ 563 $ 402Stock-based compensation expense . . . . . . . . . . . . 536 104 48 45 84Restructuring charges . . . . . . . . . . . . . . . . . . . . . . 158 1,684 114 800 1,780In-process research and development charges . . . . 52 2 37 1 793Pension curtailment . . . . . . . . . . . . . . . . . . . . . . . — (199) — — —Acquisition-related charges . . . . . . . . . . . . . . . . . . — — 54 280 701Acquisition-related inventory write-downs . . . . . . . — — — — 147
Total charges before taxes . . . . . . . . . . . . . . . . . . . $1,350 $2,213 $856 $1,689 $3,907
Total charges, net of taxes . . . . . . . . . . . . . . . . . . $ 970 $1,583 $604 $1,157 $3,116
(3) Net earnings (loss) include the following items:
2006 2005 2004 2003 2002
In millions
(Gains) losses on investments and early extinguishment ofdebt . . . . . . . . . . . . . . . . . . . . . . . . . . . . . . . . . . . . . . . . $(25) $ 13 $(4) $29 $75
Dispute settlement . . . . . . . . . . . . . . . . . . . . . . . . . . . . . . . — 106 70 — (14)
Total (gains) losses before taxes . . . . . . . . . . . . . . . . . . . . . . $(25) $119 $66 $29 $61
Total (gains) losses, net of taxes . . . . . . . . . . . . . . . . . . . . . $(15) $ 73 $56 $23 $64
34
ITEM 7. Management’s Discussion and Analysis of Financial Condition and Results of Operations.
HEWLETT-PACKARD COMPANY AND SUBSIDIARIES
Management’s Discussion and Analysis ofFinancial Condition and Results of Operations
The following discussion should be read in conjunction with the Consolidated Financial Statementsand the related notes that appear elsewhere in this document.
OVERVIEW
We are a leading global technology company and generate net revenue and earn our profits fromthe sale of products, technologies, solutions and services to consumers, businesses and governments.Our portfolio is broad and includes personal computers, handheld computing devices, home andbusiness imaging and printing devices, publishing systems, storage and servers, a wide array ofinformation technology (‘‘IT’’) services and software solutions. We have seven business segments:Enterprise Storage and Servers (‘‘ESS’’), HP Services (‘‘HPS’’), Software, the Personal Systems Group(‘‘PSG’’), the Imaging and Printing Group (‘‘IPG’’), HP Financial Services (‘‘HPFS’’), and CorporateInvestments. ESS, HPS and Software are structured beneath a broader Technology Solutions Group(‘‘TSG’’). While TSG is not an operating segment, we sometimes provide financial data aggregating thesegments within TSG in order to provide a supplementary view of our business.
Our product and geographic breadth requires us to focus on strategic imperatives within individualproduct categories and to manage across our portfolio in order to drive growth while optimizing coststructure. Our financial results also are impacted by our ability to predict and to respond toindustry-wide trends. For instance, a trend that is significant to our business and financial results is theshift toward standardized products, which presents revenue opportunities for certain of our businessesbut presents an ongoing challenge to our margins. To help address the potential margin impact ofstandardization, we take ongoing actions related to both revenue generation and cost structuremanagement. In the sales and marketing area, we have programs designed to improve the rates atwhich we sell higher-margin configurations or options. We also continue to focus on managingprocurement and labor expenses. Key to our overall efforts in delivering superior products whilemaintaining a world-class cost structure is the increasingly global nature of technology expertise. Thistrend is allowing us to develop a global delivery structure to take advantage of regions where advancedtechnical expertise is available at lower costs.
As part of our efforts to improve efficiencies and reduce costs, we continually evaluate ourworkforce and infrastructure and make adjustments we deem appropriate. When we make adjustmentsto our workforce and infrastructure, we may incur incremental expenses that delay the benefit of amore efficient workforce structure, but we believe that the fundamental shift to more efficient globaldelivery is crucial to maintaining a long-term competitive cost structure. Recent adjustments include:
• Our plans announced in May 2006 to reduce our IT spending by consolidating 85 data centersworldwide into six state-of-the-art centers in three U.S. cities; and
• Our plans announced in July 2006 to reduce our real estate costs by consolidating severalhundred real estate locations worldwide to fewer core sites over the next four years.
We continue to implement the 2005 restructuring plan that was approved by our Board ofDirectors in the fourth quarter of fiscal 2005. As part of that plan, we announced in June 2006 that wewould integrate the activities carried out by our Global Operations organization directly into ourbusiness segments. Under the 2005 restructuring plan, we expect to eliminate approximately 15,200positions through workforce restructuring or early retirement programs. Approximately 14,200 of thesepositions have been eliminated as of October 31, 2006. The majority of the remaining 1,000 positions
35
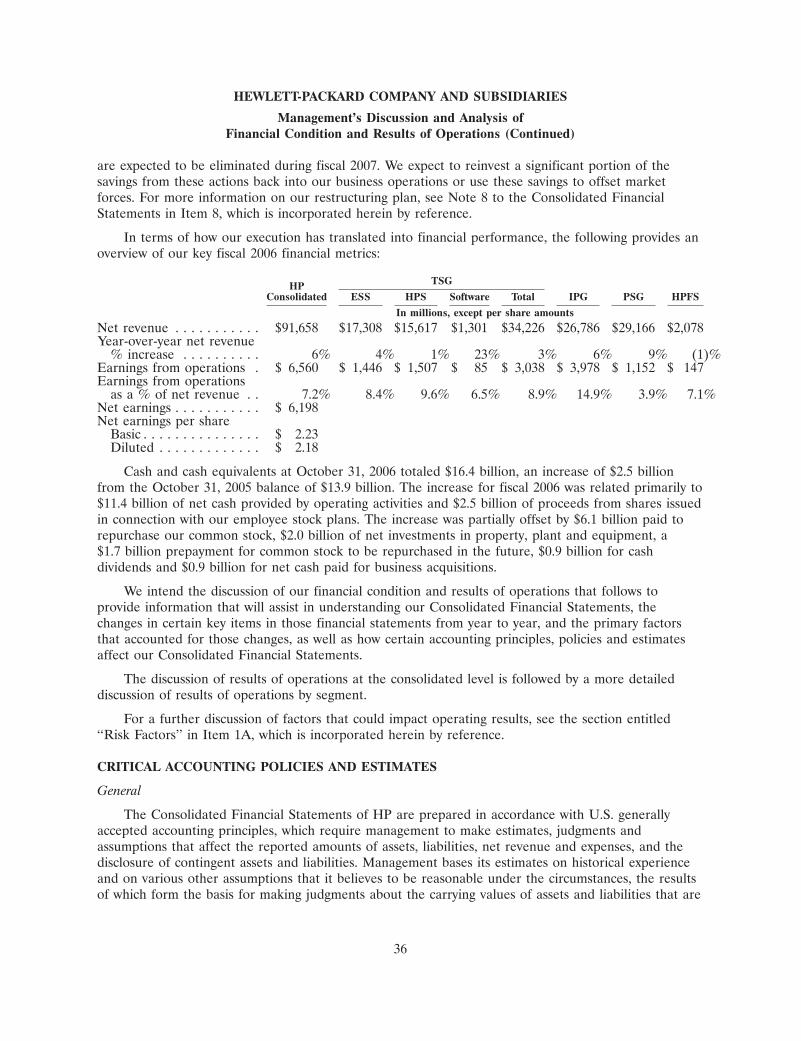
HEWLETT-PACKARD COMPANY AND SUBSIDIARIES
Management’s Discussion and Analysis ofFinancial Condition and Results of Operations (Continued)
are expected to be eliminated during fiscal 2007. We expect to reinvest a significant portion of thesavings from these actions back into our business operations or use these savings to offset marketforces. For more information on our restructuring plan, see Note 8 to the Consolidated FinancialStatements in Item 8, which is incorporated herein by reference.
In terms of how our execution has translated into financial performance, the following provides anoverview of our key fiscal 2006 financial metrics:
TSGHPConsolidated ESS HPS Software Total IPG PSG HPFS
In millions, except per share amounts
Net revenue . . . . . . . . . . . $91,658 $17,308 $15,617 $1,301 $34,226 $26,786 $29,166 $2,078Year-over-year net revenue
% increase . . . . . . . . . . 6% 4% 1% 23% 3% 6% 9% (1)%Earnings from operations . $ 6,560 $ 1,446 $ 1,507 $ 85 $ 3,038 $ 3,978 $ 1,152 $ 147Earnings from operations
as a % of net revenue . . 7.2% 8.4% 9.6% 6.5% 8.9% 14.9% 3.9% 7.1%Net earnings . . . . . . . . . . . $ 6,198Net earnings per share
Basic . . . . . . . . . . . . . . . $ 2.23Diluted . . . . . . . . . . . . . $ 2.18
Cash and cash equivalents at October 31, 2006 totaled $16.4 billion, an increase of $2.5 billionfrom the October 31, 2005 balance of $13.9 billion. The increase for fiscal 2006 was related primarily to$11.4 billion of net cash provided by operating activities and $2.5 billion of proceeds from shares issuedin connection with our employee stock plans. The increase was partially offset by $6.1 billion paid torepurchase our common stock, $2.0 billion of net investments in property, plant and equipment, a$1.7 billion prepayment for common stock to be repurchased in the future, $0.9 billion for cashdividends and $0.9 billion for net cash paid for business acquisitions.
We intend the discussion of our financial condition and results of operations that follows toprovide information that will assist in understanding our Consolidated Financial Statements, thechanges in certain key items in those financial statements from year to year, and the primary factorsthat accounted for those changes, as well as how certain accounting principles, policies and estimatesaffect our Consolidated Financial Statements.
The discussion of results of operations at the consolidated level is followed by a more detaileddiscussion of results of operations by segment.
For a further discussion of factors that could impact operating results, see the section entitled‘‘Risk Factors’’ in Item 1A, which is incorporated herein by reference.
CRITICAL ACCOUNTING POLICIES AND ESTIMATES
General
The Consolidated Financial Statements of HP are prepared in accordance with U.S. generallyaccepted accounting principles, which require management to make estimates, judgments andassumptions that affect the reported amounts of assets, liabilities, net revenue and expenses, and thedisclosure of contingent assets and liabilities. Management bases its estimates on historical experienceand on various other assumptions that it believes to be reasonable under the circumstances, the resultsof which form the basis for making judgments about the carrying values of assets and liabilities that are
36
HEWLETT-PACKARD COMPANY AND SUBSIDIARIES
Management’s Discussion and Analysis ofFinancial Condition and Results of Operations (Continued)
not readily apparent from other sources. Senior management has discussed the development, selectionand disclosure of these estimates with the Audit Committee of HP’s Board of Directors. Managementbelieves that the accounting estimates employed and the resulting balances are reasonable; however,actual results may differ from these estimates under different assumptions or conditions.
An accounting policy is deemed to be critical if it requires an accounting estimate to be madebased on assumptions about matters that are highly uncertain at the time the estimate is made, ifdifferent estimates reasonably could have been used, or if changes in the estimate that are reasonablylikely to occur could materially impact the financial statements. Management believes the followingcritical accounting policies reflect the significant estimates and assumptions used in the preparation ofthe Consolidated Financial Statements.
Revenue Recognition
We enter into contracts to sell our products and services, and, while the majority of our salesagreements contain standard terms and conditions, there are agreements that contain multiple elementsor non-standard terms and conditions. As a result, significant contract interpretation is sometimesrequired to determine the appropriate accounting, including whether the deliverables specified in amultiple element arrangement should be treated as separate units of accounting for revenue recognitionpurposes, and, if so, how the price should be allocated among the elements and when to recognizerevenue for each element. We recognize revenue for delivered elements only when the fair values ofundelivered elements are known, uncertainties regarding customer acceptance are resolved and thereare no customer-negotiated refund or return rights affecting the revenue recognized for deliveredelements. Changes in the allocation of the sales price between elements might impact the timing ofrevenue recognition but would not change the total revenue recognized on the contract.
We recognize revenue as work progresses on certain fixed-price contracts, such as consultingarrangements. Using a proportional performance method, we estimate the total expected labor costs inorder to determine the amount of revenue earned to date. We follow this basis because reasonablydependable estimates of the labor costs applicable to various stages of a contract can be made. Totalcontract profit is subject to revisions throughout the life of the contract. We record changes in revenueas a result of revisions to cost estimates to income in the period in which the facts that give rise to therevision become known.
We record estimated reductions to revenue for customer and distributor programs and incentiveofferings, including price protection, promotions, other volume-based incentives and expected returns.Future market conditions and product transitions may require us to take actions to increase customerincentive offerings, possibly resulting in an incremental reduction of revenue at the time the incentive isoffered. Additionally, certain incentive programs require us to estimate, based on historical experience,the number of customers who will actually redeem the incentive.
Restructuring
We have engaged, and may continue to engage, in restructuring actions, which requiremanagement to utilize significant estimates related to expenses for severance and other employeeseparation costs, realizable values of assets made redundant or obsolete, lease cancellation and otherexit costs. If the actual amounts differ from our estimates, the amount of the restructuring chargescould be materially impacted. For a full description of our restructuring actions, refer to our discussions
37
HEWLETT-PACKARD COMPANY AND SUBSIDIARIES
Management’s Discussion and Analysis ofFinancial Condition and Results of Operations (Continued)
of restructuring in the Results of Operations section and Note 8 to the Consolidated FinancialStatements in Item 8, which are incorporated herein by reference.
Stock-Based Compensation Expense
Effective November 1, 2005, we adopted the fair value recognition provisions of Statement ofFinancial Accounting Standards (‘‘SFAS’’) No. 123 (revised 2004), ‘‘Shared-Based Payment’’(‘‘SFAS 123R’’), using the modified prospective transition method, and therefore have not restatedprior periods’ results. Under this method, we recognize stock-based compensation expense for all share-based payment awards granted after November 1, 2005 and granted prior to but not yet vested as ofNovember 1, 2005, in accordance with SFAS 123R. Under the fair value recognition provisions ofSFAS 123R, we recognize stock-based compensation expense net of an estimated forfeiture rate andrecognize compensation cost for only those shares expected to vest on a straight-line basis over therequisite service period of the award. Prior to SFAS 123R adoption, we accounted for share-basedpayment awards under Accounting Principles Board Opinion No. 25, ‘‘Accounting for Stock Issued toEmployees’’ (‘‘APB 25’’) and, accordingly, generally recognized compensation expense only when wegranted options with a discounted exercise price.
Determining the appropriate fair value model and calculating the fair value of share-basedpayment awards require the input of subjective assumptions, including the expected life of the share-based payment awards and stock price volatility. Management determined that implied volatilitycalculated based on actively traded options on HP common stock is a better indicator of expectedvolatility and future stock price trends than historical volatility. Therefore, expected volatility in fiscalyears 2006 and 2005 was based on a market-based implied volatility. The assumptions used incalculating the fair value of share-based payment awards represent management’s best estimates, butthese estimates involve inherent uncertainties and the application of management judgment. As aresult, if factors change and we use different assumptions, our stock-based compensation expense couldbe materially different in the future. In addition, we are required to estimate the expected forfeiturerate and recognize expense only for those shares expected to vest. If our actual forfeiture rate ismaterially different from our estimate, the stock-based compensation expense could be significantlydifferent from what we have recorded in the current period. See Note 2 to the Consolidated FinancialStatements in Item 8 for a further discussion on stock-based compensation.
Taxes on Earnings
We calculate our current and deferred tax provisions based on estimates and assumptions thatcould differ from the actual results reflected in our income tax returns filed during the subsequent year.We record adjustments based on filed returns when we have identified and finalized them, which isgenerally in the third and fourth quarters of the subsequent year for U.S. federal and state provisions,respectively.
We recognize deferred tax assets and liabilities for the expected tax consequences of temporarydifferences between the tax bases of assets and liabilities and their reported amounts using enacted taxrates in effect for the year in which we expect the differences to reverse. We record a valuationallowance to reduce the deferred tax assets to the amount that we are more likely than not to realize.We have considered future market growth, forecasted earnings, future taxable income, the mix ofearnings in the jurisdictions in which we operate and prudent and feasible tax planning strategies indetermining the need for a valuation allowance. In the event we were to determine that we would notbe able to realize all or part of our net deferred tax assets in the future, we would increase the
38
HEWLETT-PACKARD COMPANY AND SUBSIDIARIES
Management’s Discussion and Analysis ofFinancial Condition and Results of Operations (Continued)
valuation allowance and make a corresponding charge to earnings in the period in which we make suchdetermination. Likewise, if we later determine that we are more likely than not to realize the netdeferred tax assets, we would reverse the applicable portion of the previously provided valuationallowance. In order for us to realize our deferred tax assets we must be able to generate sufficienttaxable income in the tax jurisdictions in which the deferred tax assets are located.
Our effective tax rate includes the impact of certain undistributed foreign earnings for which wehave not provided U.S. taxes because we plan to reinvest such earnings indefinitely outside the UnitedStates. We plan foreign earnings remittance amounts based on projected cash flow needs as well as theworking capital and long-term investment requirements of our foreign subsidiaries and our domesticoperations. Based on these assumptions, we estimate the amount we will distribute to the United Statesand provide the U.S. federal taxes due on these amounts. Further, as a result of certain employmentactions and capital investments HP has undertaken, income from manufacturing activities in certaincountries is subject to reduced tax rates, and in some cases is wholly exempt from taxes, for fiscal yearsthrough 2019. Material changes in our estimates of cash, working capital and long-term investmentrequirements in the various jurisdictions in which we do business could impact our effective tax rate.
We are subject to income taxes in the United States and over sixty foreign countries, and we aresubject to routine corporate income tax audits in many of these jurisdictions. We believe that our taxreturn positions are fully supported, but tax authorities are likely to challenge certain positions, whichmay not be fully sustained. However, our income tax expense includes amounts intended to satisfyincome tax assessments that result from these challenges. Determining the income tax expense for thesepotential assessments and recording the related assets and liabilities requires significant managementjudgments and estimates. We evaluate our income tax contingencies in accordance with SFAS No. 5,‘‘Accounting for Contingencies.’’ We believe that our reserve for income tax liabilities, including relatedinterest, is adequate in relation to the potential for additional tax assessments. The amounts ultimatelypaid upon resolution of audits could be materially different from the amounts previously included inour income tax expense and therefore could have a material impact on our tax provision, net incomeand cash flows. Our reserve for income tax liabilities is attributable primarily to uncertaintiesconcerning the tax treatment of our international operations, including the allocation of income amongdifferent jurisdictions, and related interest. We review our reserves quarterly, and we may adjust suchreserves because of proposed assessments by tax authorities, changes in facts and circumstances,issuance of new regulations or new case law, previously unavailable information obtained during thecourse of an examination, negotiations between tax authorities of different countries concerning ourtransfer prices, execution of Advanced Pricing Agreements, resolution with respect to individual auditissues, the resolution of entire audits, or the expiration of statutes of limitations. Material adjustmentsare most likely to occur in the fiscal years in which major ongoing audits, such as audits by the InternalRevenue Service (‘‘IRS’’), are closed. In addition, our tax contingency reserve includes certain amountsfor potential tax assessments for pre-acquisition tax years of acquired companies which, if released, willimpact the carrying value of goodwill attributable to the acquired company.
Allowance for Doubtful Accounts
We determine our allowance for doubtful accounts using a combination of factors to ensure thatwe have not overstated our trade and financing receivables balances due to uncollectibility. Wemaintain an allowance for doubtful accounts for all customers based on a variety of factors, includingthe length of time receivables are past due, trends in overall weighted average risk rating of the totalportfolio, macroeconomic conditions, significant one-time events, historical experience and the use of
39
HEWLETT-PACKARD COMPANY AND SUBSIDIARIES
Management’s Discussion and Analysis ofFinancial Condition and Results of Operations (Continued)
third-party credit risk models that generate quantitative measures of default probabilities based onmarket factors, and the financial condition of customers. Also, we record specific provisions forindividual accounts when we become aware of a customer’s inability to meet its financial obligations tous, such as in the case of bankruptcy filings or deterioration in the customer’s operating results orfinancial position. If circumstances related to customers change, we would further adjust our estimatesof the recoverability of receivables either upward or downward. The annual provision for doubtfulaccounts is approximately 0.03% of net revenue over the last three fiscal years. Using our third-partycredit risk model at October 31, 2006, a 50-basis-point deterioration in either the weighted averagedefault probabilities of our significant customers or in the overall mix of our portfolio would haveresulted in an approximately $26 million increase to our trade allowance at the end of fiscal year 2006.
Inventory
We state our inventory at the lower of cost or market. We make adjustments to reduce the cost ofinventory to its net realizable value, if required, at the product group level for estimated excess,obsolescence or impaired balances. Factors influencing these adjustments include changes in demand,rapid technological changes, product life cycle and development plans, component cost trends, productpricing, physical deterioration and quality issues. Revisions to these adjustments would be required ifthese factors differ from our estimates.
Valuation of Goodwill and Indefinite-Lived Purchased Intangible Assets
We review goodwill and purchased intangible assets with indefinite lives for impairment annuallyand whenever events or changes in circumstances indicate the carrying value of an asset may not berecoverable in accordance with SFAS No. 142, ‘‘Goodwill and Other Intangible Assets.’’ The provisionsof SFAS No. 142 require that we perform a two-step impairment test on goodwill. In the first step, wecompare the fair value of each reporting unit to its carrying value. Our reporting units are consistentwith the reportable segments identified in Note 18 to the Consolidated Financial Statements in Item 8.We determine the fair value of our reporting units based on a weighting of income and marketapproaches. Under the income approach, we calculate the fair value of a reporting unit based on thepresent value of estimated future cash flows. Under the market approach, we estimate the fair valuebased on market multiples of revenue or earnings for comparable companies. If the fair value of thereporting unit exceeds the carrying value of the net assets assigned to that unit, goodwill is notimpaired and we are not required to perform further testing. If the carrying value of the net assetsassigned to the reporting unit exceeds the fair value of the reporting unit, then we must perform thesecond step of the impairment test in order to determine the implied fair value of the reporting unit’sgoodwill. If the carrying value of a reporting unit’s goodwill exceeds its implied fair value, then werecord an impairment loss equal to the difference. SFAS No. 142 also requires that the fair value of thepurchased intangible assets with indefinite lives be estimated and compared to the carrying value. Weestimate the fair value of these intangible assets using an income approach. We recognize animpairment loss when the estimated fair value of the intangible asset is less than the carrying value.
Determining the fair value of a reporting unit or an indefinite-lived purchased intangible asset isjudgmental in nature and involves the use of significant estimates and assumptions. These estimatesand assumptions include revenue growth rates and operating margins used to calculate projected futurecash flows, risk-adjusted discount rates, assumed royalty rates, future economic and market conditionsand determination of appropriate market comparables. We base our fair value estimates onassumptions we believe to be reasonable but that are unpredictable and inherently uncertain. Actual
40
HEWLETT-PACKARD COMPANY AND SUBSIDIARIES
Management’s Discussion and Analysis ofFinancial Condition and Results of Operations (Continued)
future results may differ from those estimates. In addition, we make certain judgments and assumptionsin allocating shared assets and liabilities to determine the carrying values for each of our reportingunits.
Our annual goodwill impairment analysis, which we performed during the fourth quarter of fiscal2006, did not result in an impairment charge. The excess of fair value over carrying value for each ofHP’s reporting units as of August 1, 2006, the annual testing date, ranged from approximately$350 million to approximately $41.4 billion. In order to evaluate the sensitivity of the fair valuecalculations on the goodwill impairment test, we applied a hypothetical 10% decrease to the fair valuesof each reporting unit. This hypothetical 10% decrease would result in excess fair value over carryingvalue ranging from approximately $200 million to approximately $36.6 billion for each of HP’sreporting units.
Warranty Provision
We provide for the estimated cost of product warranties at the time we recognize revenue. Weevaluate our warranty obligations on a product group basis. Our standard product warranty termsgenerally include post-sales support and repairs or replacement of a product at no additional charge fora specified period of time. While we engage in extensive product quality programs and processes,including actively monitoring and evaluating the quality of our component suppliers, we base ourestimated warranty obligation upon warranty terms, ongoing product failure rates, repair costs, productcall rates, average cost per call, and current period product shipments. If actual product failure rates,repair rates, service delivery costs or post-sales support costs differ from our estimates, we would berequired to make revisions to the estimated warranty liability. Warranty terms generally range from90 days parts-only to three years parts and labor, depending upon the product. Over the last threefiscal years, the annual warranty provision has averaged approximately 3.6% of annual net productrevenue, while actual annual warranty costs have averaged approximately 3.4% of annual net productrevenue.
Retirement Benefits
Our pension and other post-retirement benefit costs and obligations are dependent on variousassumptions. Our major assumptions relate primarily to discount rates, salary growth, long-term returnon plan assets and medical cost trend rates. We base the discount rate assumption on currentinvestment yields of high quality fixed income investments during the retirement benefits maturityperiod. The salary growth assumptions reflect our long-term actual experience and future andnear-term outlook. Long-term return on plan assets is determined based on historical portfolio resultsand management’s expectation of the future economic environment, as well as target asset allocations.Our medical cost trend assumptions are developed based on historical cost data, the near-term outlookand an assessment of likely long-term trends. Actual results that differ from our assumptions areaccumulated and are amortized generally over the estimated future working life of the planparticipants.
Our major assumptions vary by plan and the weighted average rates used are set forth in Note 15to the Consolidated Financial Statements in Item 8, which is incorporated herein by reference. Eachassumption has different sensitivity characteristics, and, in general, changes, if any, have moved in the
41
HEWLETT-PACKARD COMPANY AND SUBSIDIARIES
Management’s Discussion and Analysis ofFinancial Condition and Results of Operations (Continued)
same direction over the last several years. For fiscal 2006, changes in the weighted average rates wouldhave had the following impact on our net periodic benefit cost:
• a decrease of 25 basis points in the long-term rate of return would have increased our netbenefit cost by approximately $31 million;
• a decrease of 25 basis points in the discount rate would have increased our net benefit cost byapproximately $49 million; and
• an increase of 25 basis points in the future compensation rate would have increased our netbenefit cost by approximately $27 million.
RECENT ACCOUNTING PRONOUNCEMENTS
See Note 1 to the Consolidated Financial Statements in Item 8 for a full description of recentaccounting pronouncements, including the expected dates of adoption and estimated effects on resultsof operations and financial condition, which is incorporated herein by reference.
RESULTS OF OPERATIONS
Results of operations in dollars and as a percentage of net revenue were as follows for thefollowing fiscal years ended October 31:
2006 2005(2) 2004(2)
In millions
Net revenue . . . . . . . . . . . . . . . . . . . . . . . . . . $91,658 100.0% $86,696 100.0% $79,905 100.0%Cost of sales(1) . . . . . . . . . . . . . . . . . . . . . . . . 69,427 75.7% 66,440 76.6% 60,811 76.1%
Gross profit . . . . . . . . . . . . . . . . . . . . . . . . . . 22,231 24.3% 20,256 23.4% 19,094 23.9%Research and development . . . . . . . . . . . . . . . 3,591 3.9% 3,490 4.0% 3,563 4.5%Selling, general and administrative . . . . . . . . . . 11,266 12.3% 11,184 13.0% 10,496 13.1%Pension curtailment . . . . . . . . . . . . . . . . . . . . . — — (199) (0.2)% — —Restructuring charges . . . . . . . . . . . . . . . . . . . 158 0.2% 1,684 1.9% 114 0.1%Amortization of purchased intangible assets . . . 604 0.7% 622 0.7% 603 0.8%In-process research and development charges . . 52 — 2 — 37 —Acquisition-related charges . . . . . . . . . . . . . . . — — — — 54 0.1%
Earnings from operations . . . . . . . . . . . . . . . . 6,560 7.2% 3,473 4.0% 4,227 5.3%Interest and other, net . . . . . . . . . . . . . . . . . . 606 0.6% 189 0.2% 35 —Gains (losses) on investments . . . . . . . . . . . . . 25 — (13) — 4 —Dispute settlement . . . . . . . . . . . . . . . . . . . . . — — (106) (0.1)% (70) (0.1)%
Earnings before taxes . . . . . . . . . . . . . . . . . . . 7,191 7.8% 3,543 4.1% 4,196 5.2%Provision for taxes . . . . . . . . . . . . . . . . . . . . . 993 1.0% 1,145 1.3% 699 0.8%
Net earnings . . . . . . . . . . . . . . . . . . . . . . . . . . $ 6,198 6.8% $ 2,398 2.8% $ 3,497 4.4%
(1) Cost of products, cost of services and financing interest.(2) Certain reclassifications have been made to prior year amounts in order to conform to the current
year presentation.
42

HEWLETT-PACKARD COMPANY AND SUBSIDIARIES
Management’s Discussion and Analysis ofFinancial Condition and Results of Operations (Continued)
Net Revenue
The components of weighted average net revenue growth were as follows for the following fiscalyears ended October 31:
2006 2005
Percentage points
Personal Systems Group . . . . . . . . . . . . . . . . . . . . . . . . . . . . . . . . . . . . . . . . . . . . . . 2.8 2.7Imaging and Printing Group . . . . . . . . . . . . . . . . . . . . . . . . . . . . . . . . . . . . . . . . . . . 1.9 1.2Enterprise Storage and Servers . . . . . . . . . . . . . . . . . . . . . . . . . . . . . . . . . . . . . . . . . 0.7 2.0Software . . . . . . . . . . . . . . . . . . . . . . . . . . . . . . . . . . . . . . . . . . . . . . . . . . . . . . . . . 0.3 0.2HP Services . . . . . . . . . . . . . . . . . . . . . . . . . . . . . . . . . . . . . . . . . . . . . . . . . . . . . . . 0.1 2.1HP Financial Services . . . . . . . . . . . . . . . . . . . . . . . . . . . . . . . . . . . . . . . . . . . . . . . . (0.1) 0.3Corporate Investments/Other . . . . . . . . . . . . . . . . . . . . . . . . . . . . . . . . . . . . . . . . . . — —
Total HP . . . . . . . . . . . . . . . . . . . . . . . . . . . . . . . . . . . . . . . . . . . . . . . . . . . . . . . . . 5.7 8.5
In fiscal 2006, HP net revenue increased approximately 6% from the prior year period (7% on aconstant currency basis). The unfavorable currency impact for fiscal 2006 was due primarily to themovement of the dollar against the euro and the yen. U.S. net revenue was $32.2 billion for fiscal 2006,an increase of 6% from the prior year, while international net revenue increased 6% to $59.4 billion.
PSG net revenue increased across all regions as a result of a 15% volume increase. The volumeincrease resulted from strong growth in consumer and commercial markets and significant improvementin emerging markets, which was partially offset by 6% and 7% declines in average selling prices(‘‘ASPs’’) in consumer and commercial clients, respectively. IPG net revenue growth in fiscal 2006 wasdue mainly to increased shipment volumes of printer supplies resulting from the continued expansion ofprinter hardware placements and the strong performance of color-related products. ESS net revenuegrowth was the result primarily of strong unit growth in our industry standard servers business (‘‘ISS’’),Blade revenue growth, increased option attach rates in our ProLiant server line, continued strongperformance in mid-range EVA products within our Storage business and revenue increases from ourIntegrity servers. The ESS growth was moderated by revenue declines in our tape business andPA-RISC and Alpha Server product lines. The net revenue growth in Software for fiscal 2006 was dueprimarily to growth in our OpenView business as a result of the Peregrine acquisition and an increasein support and service contracts. HPS net revenue increased in fiscal 2006 due primarily to revenueincreases in management services driven by new business and existing account growth, which wereoffset by declines in the technology services business resulting from competitive pricing pressures andchanges in the mix of platforms being serviced. The HPFS net revenue decline in fiscal 2006 was dueprimarily to lower used equipment sales.
In fiscal 2005, HP net revenue increased approximately 8% from the prior year period (6% on aconstant currency basis). The favorable currency impact was due primarily to the weakening of thedollar against the euro and the yen for the first three quarters of fiscal 2005 and to a lesser extent inthe fourth fiscal quarter as the dollar strengthened against the euro and the yen during that period.U.S. net revenue was $30.5 billion for fiscal 2005, an increase of 4% from the prior year, whileinternational net revenue increased 11% to $56.2 billion.
In PSG, net revenue increased across all regions as a result of a 13% volume increase in consumerand commercial clients. The volume increase was partially offset by a decline of 4% in ASPs. Notebook
43

HEWLETT-PACKARD COMPANY AND SUBSIDIARIES
Management’s Discussion and Analysis ofFinancial Condition and Results of Operations (Continued)
PC sales were the leading contributor to net revenue growth in PSG. HPS achieved net revenue growthacross all businesses in fiscal 2005 due in large part to the impact of acquisitions (benefiting primarilytechnology services) and favorable currency impacts. Additionally, managed services net revenueincreased due to both new contract signings and additional contract revenue from the installed base. Infiscal 2005, ESS net revenue growth was the result primarily of continued strong sales of industrystandard servers, particularly our ProLiant server line, due to volume increases and higher ASPsresulting from improved option attach rates. IPG net revenue growth in fiscal 2005 was the result ofincreased unit growth of printer supplies, particularly LaserJet toner, as a result of the increasingdemand for color-related products. The demand for color-related products also added to the revenuegrowth in commercial hardware. Both Software and HPFS contributed to HP net revenue growth forfiscal 2005 as growing acceptance of our OpenView product offerings contributed to Software revenuegrowth while higher used equipment sales and a higher mix of operating leases benefited HPFS.
Stock-Based Compensation Expense
Effective November 1, 2005, we adopted the fair value recognition provisions of SFAS 123R usingthe modified prospective transition method and therefore have not restated results for prior periods.Our results of operations in fiscal 2006 were impacted by the recognition of non-cash expense relatedto the fair value of our share-based payment awards. In fiscal 2006, we recorded $536 million in pre-taxstock-based compensation expense based on SFAS 123R, of which $144 million was included in cost ofsales, $70 million was included in research and development expense and $322 million was included insales, general and administrative expense. Total stock-based compensation expense for SFAS 123R, netof taxes, in fiscal 2006 was $376 million. In addition, we recognized an adjustment of $14 million toreduce non-cash stock-based compensation expense which was included as part of our restructuringexpenses. The stock-based compensation expense related to HP-granted employee stock options andthe employee stock purchase plan is recorded at the corporate level and therefore does not have animpact on segment results. See Note 2 to the Consolidated Financial Statements in Item 8, which isincorporated herein by reference.
Gross Margin
The weighted average components of the change in gross margin were as follows for the followingfiscal years ended October 31:
2006 2005
Percentage points
Enterprise Storage and Servers . . . . . . . . . . . . . . . . . . . . . . . . . . . . . . . . . . . . . . . . . 0.4 0.1HP Services . . . . . . . . . . . . . . . . . . . . . . . . . . . . . . . . . . . . . . . . . . . . . . . . . . . . . . . 0.2 (0.5)Imaging and Printing Group . . . . . . . . . . . . . . . . . . . . . . . . . . . . . . . . . . . . . . . . . . . 0.2 (0.8)Software . . . . . . . . . . . . . . . . . . . . . . . . . . . . . . . . . . . . . . . . . . . . . . . . . . . . . . . . . 0.2 0.1Personal Systems Group . . . . . . . . . . . . . . . . . . . . . . . . . . . . . . . . . . . . . . . . . . . . . . 0.1 0.5HP Financial Services . . . . . . . . . . . . . . . . . . . . . . . . . . . . . . . . . . . . . . . . . . . . . . . . (0.1) 0.1Corporate Investments/Other . . . . . . . . . . . . . . . . . . . . . . . . . . . . . . . . . . . . . . . . . . (0.1) —
Total HP . . . . . . . . . . . . . . . . . . . . . . . . . . . . . . . . . . . . . . . . . . . . . . . . . . . . . . . . . 0.9 (0.5)
44
HEWLETT-PACKARD COMPANY AND SUBSIDIARIES
Management’s Discussion and Analysis ofFinancial Condition and Results of Operations (Continued)
Total company gross margin increased in fiscal 2006 as compared to fiscal 2005. The improvementin ESS gross margin in fiscal 2006 was due primarily to a favorable unit mix, improved discountmanagement, and lower component costs. HPS gross margin increase was driven mainly by thecontinued focus on cost structure improvement from delivery efficiencies and cost controls, which werepartially offset by the continued competitive environment in the solutions and services business andhigher fiscal 2006 bonus accruals. For IPG, the gross margin increased in fiscal 2006 due primarily toimproved supplies margins and a favorable portfolio mix shift from hardware to supplies, which werepartially offset by unfavorable consumer hardware margins. The improvement in Software gross marginin fiscal 2006 was due primarily to an increase in revenue and more effective management of thesupport and services costs for OpenView and OpenCall. The gross margin improvement in PSGresulted primarily from reduced warranty expense and supply chain costs as a percentage of revenueand component cost declines. HPFS gross margin was impacted unfavorably in fiscal 2006 due primarilyto competitor pricing pressures, a higher mix of lower margin operating lease assets and lowerrecoveries for bad debts, which were partially offset by lower credit losses in fiscal 2006.
Total company gross margin decreased in fiscal 2005 as compared to fiscal 2004. For IPG, thegross margin decline in fiscal 2005 was attributable primarily to a mix shift within supplies from inkjetcartridges to LaserJet toner and continuing decreases in ASPs within hardware due to strategic pricingactions. The gross margin decline in HPS in fiscal 2005 reflected primarily competitive pricing pressuresand portfolio mix shifts within technology services along with higher employee bonus costs in thesecond half of the fiscal year. In fiscal 2005, ESS gross margin increased slightly as the benefits ofimproved option attach rates in industry standard servers and improved performance in storage helpedto offset the unfavorable impact from the continued mix shift towards industry standard servers withinthe segment and the mix shift to lower margin products within business critical systems. The grossmargin contribution for HPFS and Software increased slightly in fiscal 2005 as lower bad debt expenseincreased gross margin in HPFS, while an increase in both OpenView and OpenCall gross marginsbenefited the Software business. The gross margin improvement in PSG in fiscal 2005 resulted fromcomponent cost declines, product mix shift towards higher margin notebook PCs and reduced warrantycosts.
Operating Expenses
Research and Development
Total research and development (‘‘R&D’’) expense as a percentage of net revenue decreasedslightly in fiscal 2006 as compared to fiscal 2005 due primarily to revenue growing faster than R&Dexpense. R&D expense increased in fiscal 2006 due primarily to higher bonus accruals and stock-basedcompensation expense, which were partially offset by expense controls and cost savings fromrestructuring actions. As a percentage of net revenue, each of our major segments experienced ayear-over-year decrease in R&D expense in fiscal 2006.
In fiscal 2005, total R&D expense as a percentage of net revenue declined from the same periodin the prior year due primarily to savings resulting from workforce reductions and tight expensecontrols. These savings were partially offset by increased costs for the company bonus and costsassociated with the workforce rebalancing actions taken in the first half of the fiscal year. As apercentage of net revenue, each of our segments experienced a decrease in research and developmentexpense in fiscal 2005 as we worked to focus our investments and manage realignment, while alsocontinuing to drive new technologies and business opportunities. Such decreases resulted in part from
45
HEWLETT-PACKARD COMPANY AND SUBSIDIARIES
Management’s Discussion and Analysis ofFinancial Condition and Results of Operations (Continued)
cost control measures, including the benefit from workforce reduction actions in ESS, the consolidationand realignment of certain IPG research and development infrastructure and lower program spending.
Selling, General and Administrative
Selling, general and administrative (‘‘SG&A’’) expense declined as a percentage of net revenueduring fiscal 2006 due primarily to the increase in net revenue outpacing SG&A expense growth. TotalSG&A expense increased slightly during fiscal 2006 as higher bonus accruals and stock-basedcompensation expenses as well as increased marketing spending were offset in part by savings fromexpense controls and restructuring actions and favorable currency impacts due to movement of thedollar against the euro and the yen. As a percentage of net revenue, each of our segments experienceda year-over-year decrease or no change in SG&A expense in fiscal 2006.
SG&A expense decreased slightly as a percentage of net revenue during fiscal 2005, as net revenuegrowth was higher than the growth of SG&A due in part to tight company-wide expense controls. Onan absolute basis, SG&A spending increased 6.6% in fiscal 2005 due primarily to higher employeebonuses earned in the second half of fiscal 2005 and unfavorable currency impacts.
Pension Curtailment
In conjunction with management’s plan to restructure certain of our operations, as discussed inNote 8 to the Consolidated Financial Statements in Item 8, we modified our U.S. retirement programsto align more closely to industry practice. Effective January 1, 2006, we ceased pension accruals andeliminated eligibility for the subsidized retiree medical program for current employees who did notmeet defined criteria based on age and years of service. As a result, we recognized a curtailment gainof $199 million in the fourth quarter of fiscal 2005 stemming from the elimination of future benefitaccruals for the affected employee group. In fiscal 2006, we recognized additional curtailment gains,which were included in our restructuring charges as described below.
For more information on our plan design changes, see Note 15 to the Consolidated FinancialStatements in Item 8, which is incorporated herein by reference.
Restructuring Charges
Restructuring charges in fiscal year 2006 were $158 million. This included a net charge of$233 million related to true-ups of severance and other related restructuring charges for allrestructuring plans, a $6 million termination benefits expense and a $3 million settlement andcurtailment loss from our non-U.S. pension plans related to the fiscal 2005 restructuring plan, whichwas approved by our Board of Directors in the fourth quarter of fiscal 2005. These charges werepartially offset by a $46 million settlement gain from the U.S. pension plans, a $24 million curtailmentgain from the U.S. retiree medical program and a $14 million adjustment to reduce our non-cash stock-based compensation expense, all related to our fiscal 2005 restructuring plan approved in the fourthquarter of fiscal 2005.
The fiscal 2005 restructuring plan was designed to simplify our structure, reduce costs and placegreater focus on our customers. We included original estimates of 15,300 positions to be eliminated inthe fiscal 2005 restructuring plan. Subsequent to the initial estimate, we reduced the number of totalpositions to be eliminated to 15,200. Approximately 14,200 positions have been eliminated as ofOctober 31, 2006 in connection with this restructuring plan, including 3,200 U.S. employees who electedto take early retirement.
46

HEWLETT-PACKARD COMPANY AND SUBSIDIARIES
Management’s Discussion and Analysis ofFinancial Condition and Results of Operations (Continued)
Restructuring charges in fiscal 2005 were $1.7 billion. This included a $1.6 billion charge for thefiscal 2005 restructuring plan approved in the fourth quarter of fiscal 2005. Also of the total charges forfiscal 2005, $109 million was related to severance and related costs associated with the termination ofapproximately 1,450 employees in connection with a restructuring plan approved by our management inthe third quarter of fiscal 2005. All employees under this restructuring plan were terminated as ofOctober 31, 2005. Of the initial restructuring amount, we have paid substantially all of it as ofOctober 31, 2006.
Restructuring costs in fiscal 2004 mainly reflected certain charges relating to the fiscal 2003restructuring plan, which did not meet recognition requirements during fiscal 2003, as well as changesin the original estimates for the fiscal 2003 plan and a fiscal 2002 restructuring plan.
Restructuring liabilities of $638 million at October 31, 2006 are composed primarily of theremaining cash payments to be made for severance relating to the fiscal 2005 restructuring plan andcertain non-U.S. severance benefits and contract termination costs, including canceled facility leases forthe other restructuring plans. We expect to make the majority of the remaining severance paymentsbefore the end of fiscal 2007 and to settle the non-severance obligations by the end of fiscal 2010.
For more information on our restructuring charges, see Note 8 to the Consolidated FinancialStatements in Item 8, which is incorporated herein by reference.
The following table summarizes the major restructuring activities in aggregate and during each offiscal years 2006, 2005 and 2004.
For the fiscal years ended October 31AggregateTotal 2006 2005 2004
In millions, except employee dataRestructuring headcount reductions:
2005 plans—estimate and estimate revisions . . . . . . . . . . . . . . . . . . 16,650 (100) 16,7502005 plans—exits . . . . . . . . . . . . . . . . . . . . . . . . . . . . . . . . . . . (15,650) (9,500) (6,150)
Remaining to exit . . . . . . . . . . . . . . . . . . . . . . . . . . . . . . . . . 1,000
Restructuring program charges:2005 restructuring charges:
Severance and other benefits . . . . . . . . . . . . . . . . . . . . . . . . . . $ 1,780 $ 106 $ 1,674 $ —2003 restructuring charges . . . . . . . . . . . . . . . . . . . . . . . . . . . . . 31 4 (10) 372002 and 2001 restructuring charges . . . . . . . . . . . . . . . . . . . . . . . 145 48 20 77
Total restructuring charges . . . . . . . . . . . . . . . . . . . . . . . . . . $ 1,956 $ 158 $ 1,684 $ 114
Goodwill adjustments relating to restructuring plans . . . . . . . . . . . . . . $ (142) $ (25) $ (44) $ (73)
Fiscal 2005 Workforce Rebalancing
In addition to the restructuring activities described above, in fiscal 2005 we incurred approximately$236 million in workforce rebalancing charges resulting from actions taken by certain business segmentsfor severance and related costs. Workforce rebalancing costs were included in the segment results. Werecorded these costs during the six months ended April 30, 2005. As a result of these workforcerebalancing actions, we reduced headcount by approximately 3,000 employees in certain businesssegments as of October 31, 2005. Of the initial restructuring amount, we have paid substantially all of itas of October 31, 2006.
47
HEWLETT-PACKARD COMPANY AND SUBSIDIARIES
Management’s Discussion and Analysis ofFinancial Condition and Results of Operations (Continued)
Amortization of Purchased Intangible Assets
The decrease in amortization expense in fiscal 2006 as compared to fiscal 2005 was due primarilyto a decrease in amortization expense related to certain intangible assets associated with prioracquisitions including Compaq Computer Corporation (‘‘Compaq’’) acquisition that had reached theend of their amortization period, partially offset by an increase in amortization expense relatedprimarily to the Scitex Vision Ltd. (‘‘Scitex’’), Peregrine Systems, Inc. (‘‘Peregrine’’), and OuterBayTechnologies, Inc. (‘‘OuterBay’’) acquisitions in fiscal year 2006.
The increase in amortization expense in fiscal 2005 as compared to fiscal 2004 was due primarilyto the amortization of intangible assets related to the acquisitions of Triaton in April 2004, Synstar PLC(‘‘Synstar’’) in October 2004 and SAC, LLC (‘‘Snapfish’’) in April 2005, as well as acceleratedamortization related to the early termination of certain acquired customer contracts.
For more information on our amortization of purchased intangibles assets, see Note 7 to theConsolidated Financial Statements in Item 8, which is incorporated herein by reference.
Acquisition-Related Charges
Acquisition-related charges in fiscal 2004 consisted of costs related to Compaq acquisition, whichincluded primarily the amortization of deferred compensation, merger-related inventory adjustmentsand professional fees.
In-Process Research and Development Charges
We record in-process research & development (‘‘IPR&D’’) charges in connection with acquisitionsaccounted for as business combinations, as more fully described in Note 6 to the ConsolidatedFinancial Statements in Item 8. In fiscal 2006, 2005 and 2004 we recorded IPR&D charges of$52 million, $2 million and $37 million, respectively, related to acquisitions during those years.
Interest and Other, Net
Interest and other, net increased by $417 million in fiscal 2006 from fiscal 2005. The increase infiscal 2006 resulted primarily from higher net interest income over the prior year related to highershort-term interest rates in fiscal 2006, net gains from sales of certain real estate properties, and lowerinterest expenses due to our lower average debt balances. The increase in fiscal 2006 also wasattributable to a charge recorded in fiscal 2005 for estimated sales and use taxes and related interestassociated with pre-acquisition Compaq sales and use tax audits as described below.
Interest and other, net increased by $154 million in fiscal 2005 from fiscal 2004. The increase infiscal 2005 was the result primarily of higher short-term U.S. interest rates, which increased the interestincome from our cash balances and reduced the cost associated with foreign exchange hedges.Increased interest expense and a charge related to a sales and use tax audit of Compaq prior to itsacquisition by HP for the fiscal years 1998-2002 partially offset the increase in interest and other, netfor fiscal 2005.
Gains (Losses) on Investments
Net gains in fiscal 2006 resulted primarily from gains on the sale of investments, which were offsetin part by impairment charges on our investment portfolio. Net losses in fiscal 2005 resulted primarilyfrom impairment charges on equity investments in our publicly-traded and privately-held investment
48

HEWLETT-PACKARD COMPANY AND SUBSIDIARIES
Management’s Discussion and Analysis ofFinancial Condition and Results of Operations (Continued)
portfolios. Partially offsetting these losses were gains attributable to the sale of investments. Net gainsin fiscal 2004 were attributable mainly to the realization of a contingent gain associated with a priorperiod divestiture and realized gains from the sale of investments in excess of impairment charges.
Dispute Settlement
In fiscal 2005, we recorded a net total of $106 million in dispute settlement charges. We reached alegal settlement of $141 million in our patent infringement case with Intergraph Hardware TechnologiesCompany (‘‘Intergraph’’) and recorded a charge of $116 million related to a cross-license agreementwith Intergraph for products shipped in prior years. Partially offsetting this amount was a $10 millionrecovery from an individual related to a prior period settlement with the Government of Canada.During fiscal 2004, we recorded $70 million in settlement costs from a dispute with the Government ofCanada. For other settlement matters, see Note 17 to the Consolidated Financial Statements in Item 8,which is incorporated herein by reference.
Provision for Taxes
Our effective tax rate was 13.8%, 32.3% and 16.7% in fiscal 2006, 2005 and 2004, respectively.
The decrease in the overall tax rate in fiscal 2006 from fiscal 2005 was related in part to otherincome tax adjustments of $599 million in fiscal 2006. This included net favorable tax adjustments of$565 million to income tax accruals as a result of the settlement of IRS examinations of our U.S.income tax returns for fiscal years 1993 to 1998. The reductions to the net income tax accruals forthese years related primarily to the resolution of issues with respect to Puerto Rico manufacturing taxincentives and export tax incentives, and other issues involving our non-U.S. operations. In addition,the decrease in the overall tax rate in 2006 from fiscal 2005 was attributable in part to $697 million ofincome tax expense related to items unique to fiscal 2005. The tax expense was the result primarily of$792 million associated with the repatriation of $14.5 billion under the American Jobs Creation Act of2004 (‘‘Jobs Act’’) and $76 million related to additional distributions received from foreign subsidiaries.These tax expenses were offset in part by tax benefits of $177 million resulting from agreements withthe IRS and other governmental authorities.
The increase in the overall tax rate in fiscal 2005 from fiscal 2004 was related primarily to taxexpense associated with the repatriation of $14.5 billion under the provisions of the Jobs Act which waspartially offset by the increase in the tax benefit derived from lower rates in other jurisdictions. TheJobs Act, enacted on October 22, 2004, provided for a temporary 85% dividend received deduction oncertain foreign earnings repatriated during a one-year period. The deduction resulted in anapproximate 5.25% federal tax rate on the repatriated earnings.
In fiscal 2004, our tax rate benefited from net favorable adjustments to previously estimated taxliabilities of $207 million, which decreased the provision for taxes. The most significant favorableadjustments related to the resolution of a California state income tax audit, a net favorable revision toestimated tax accruals upon filing the 2003 U.S. income tax return and a reduction in taxes on foreignearnings due to a change in regulatory policy. These favorable adjustments were offset in part by thenet effect of smaller adjustments to income tax liabilities in various jurisdictions.
For a full reconciliation of our effective tax rate to the U.S. federal statutory rate of 35% andfurther explanation of our provision for taxes, see Note 13 to the Consolidated Financial Statements inItem 8, which is incorporated herein by reference.
49

HEWLETT-PACKARD COMPANY AND SUBSIDIARIES
Management’s Discussion and Analysis ofFinancial Condition and Results of Operations (Continued)
Segment Information
A description of the products and services, as well as financial data, for each segment can befound in Note 18 to the Consolidated Financial Statements in Item 8, which is incorporated herein byreference. We have restated segment financial data for the fiscal years ended October 31, 2005 and2004 to reflect changes in HP’s organizational structure that occurred at the beginning of the firstquarter of fiscal 2006. We describe these changes more fully in Note 18 to the Consolidated FinancialStatements in Item 8. We have presented the business segments in this Form 10-K based on ourmanagement organizational structure as of October 31, 2006 and the distinct nature of variousbusinesses. Future changes to this organizational structure may result in changes to the reportablesegments disclosed. The discussions below include the results of each of our segments.
Technology Solutions Group
ESS, HPS and Software are structured beneath a broader Technology Solutions Group (‘‘TSG’’).We describe the results of the business segments of TSG in more detail below.
Enterprise Storage and Servers
For the fiscal years ended October 31
2006 2005 2004
In millions
Net revenue . . . . . . . . . . . . . . . . . . . . . . . . . . . . . . . . . . . . . . . . . . . $17,308 $16,717 $15,084Earnings from operations . . . . . . . . . . . . . . . . . . . . . . . . . . . . . . . . . $ 1,446 $ 800 $ 157Earnings from operations as a % of net revenue . . . . . . . . . . . . . . . . 8.4% 4.8% 1.0%
The components of weighted average net revenue growth, by business unit were as follows for thefollowing fiscal years ended October 31:
2006 2005
Percentage points
Industry standard servers . . . . . . . . . . . . . . . . . . . . . . . . . . . . . . . . . . . . . . . . . . . 3.6 9.3Storage . . . . . . . . . . . . . . . . . . . . . . . . . . . . . . . . . . . . . . . . . . . . . . . . . . . . . . . . 0.9 1.2Business critical systems . . . . . . . . . . . . . . . . . . . . . . . . . . . . . . . . . . . . . . . . . . . . (1.0) 0.3
Total ESS . . . . . . . . . . . . . . . . . . . . . . . . . . . . . . . . . . . . . . . . . . . . . . . . . . . . . . 3.5 10.8
ESS net revenue increased 4% in fiscal 2006 from fiscal 2005. On a constant currency basis, ESSnet revenue increased 5% in fiscal 2006 from fiscal 2005. The unfavorable currency impact for fiscal2006 was due primarily to the movement of the dollar against the euro and the yen.
The net revenue growth in industry standard servers of 6% in fiscal 2006 compared to fiscal 2005was driven by strong unit growth and the growth in Blade revenue as well as increased option attachrates in the ProLiant server line.
Storage net revenue increased 4% in fiscal 2006 compared to fiscal 2005 due to continued strongperformance in mid-range EVA products within the storage area networks offerings while the tapebusiness decline moderated the overall storage growth.
50
HEWLETT-PACKARD COMPANY AND SUBSIDIARIES
Management’s Discussion and Analysis ofFinancial Condition and Results of Operations (Continued)
Business critical systems net revenue decreased 4% in fiscal 2006 compared to fiscal 2005. Thisdecrease was due primarily to revenue declines in the PA-RISC product line and to the planned phaseout of our Alpha Server product line. The declines were partially offset by net revenue growth in ourIntegrity servers which posted strong net revenue growth, reaching 37% of the business critical systemsrevenue mix in fiscal 2006 up from 20% in the prior fiscal year. Revenue mix from Integrity servers willcontinue to grow as customers migrated from PA-RISC and Alpha products. Integrity server revenue infiscal 2006 also included revenue from Montecito-based Integrity servers which were first shipped in thefourth quarter of fiscal 2006. NonStop server net revenue decreased 2% in fiscal 2006 from the prioryear due primarily to the revenue decrease on the discontinued product line, which was partially offsetby NonStop Integrity product revenue growth.
In fiscal 2006, ESS earnings from operations as a percentage of net revenue increased by3.6 percentage points compared to fiscal 2005, due primarily to an increase in gross margin combinedwith a decrease in operating expenses as a percentage of net revenue. The improvement in grossmargin was due primarily to a favorable unit mix, improved discount management, and lowercomponent costs. The increase was partially offset by a continued mix shift towards industry standardservers within the segment and the ongoing mix shift to lower-margin Integrity products within businesscritical systems. The decrease in operating expense as a percentage of net revenue in fiscal 2006resulted primarily from increased revenue and decreased operating expenses in fiscal 2006. Thedecreased operating expenses reflected the benefits of our expense controls, which were partially offsetby higher bonus accruals in fiscal 2006.
ESS net revenue increased 11% in fiscal 2005 from fiscal 2004. On a constant currency basis, ESSnet revenue increased 9% in fiscal 2005 from fiscal 2004. The favorable currency impact was dueprimarily to the weakening of the dollar against the euro and the yen for the first three quarters offiscal 2005 and to a lesser extent in the fourth fiscal quarter as the dollar strengthened against the euroand the yen during that period.
In fiscal 2005, ESS net revenue growth was due primarily to volume increases and improvedaverage selling prices ASPs in industry standard servers, as a result of both unit growth and increasedoption attach rates in the ProLiant server line. The fiscal 2005 net revenue growth rate in industrystandard servers benefited from certain internal execution problems that unfavorably impacted thebusiness in the second half of fiscal 2004.
Storage net revenue increased 5% in fiscal 2005 compared to fiscal 2004 due to new productintroductions that contributed to the strong performance of mid-range EVA products and improvedstorage sales specialist coverage. In fiscal 2005, storage area networks (‘‘SANs’’) net revenue improvedwhile revenue growth in the tape and supplies businesses remained flat. Fiscal 2005 storage net revenuegrowth rates, in comparison with growth rates in the prior year, benefited from the business challengesthat unfavorably impacted the storage business in the second half of the prior year.
Business critical systems net revenue increased 1% in fiscal 2005 compared to fiscal 2004. Integrityserver net revenue growth for the period was offset partially by revenue decline in the RISC productline and the planned revenue decline in the Alpha Server product line. The Integrity server productline posted net revenue growth for the year, representing 20% of the total business critical systemsrevenue mix, up from 11% in the prior year. In fiscal 2005, HP-UX server net revenue increased 5%from the prior year, and NonStop server net revenue declined due to a mature installed base.
In fiscal 2005, ESS earnings from operations as a percentage of net revenue increased by3.8 percentage points compared to fiscal 2004, due primarily to a combination of a decrease in
51

HEWLETT-PACKARD COMPANY AND SUBSIDIARIES
Management’s Discussion and Analysis ofFinancial Condition and Results of Operations (Continued)
operating expenses as a percentage of net revenue and an increase in gross margin. We recorded$57 million of workforce reduction costs in the first two quarters of fiscal 2005. Our reduced operatingexpenses reflected the benefits of these measures as well as management controls on expense spending,which offset the impact of the higher employee bonus accruals recorded in the second half of the year.The improvement in margin was due primarily to higher option attach rates and improved discountmanagement, which were offset partially by the continued mix shift towards industry standard serverswithin the segment as well as the ongoing mix shift to lower margin products within the businesscritical systems business as Integrity products assumed a greater percentage of business critical systemsnet revenue. In addition, the year-over-year industry standard servers and storage gross marginscomparisons were favorably impacted by execution issues and business challenges that unfavorablyaffected the performance of industry standard servers and storage in the second half of fiscal 2004.
HP Services
For the fiscal years ended October 31
2006 2005 2004
In millions
Net revenue . . . . . . . . . . . . . . . . . . . . . . . . . . . . . . . . . . . . . . . . . $15,617 $15,536 $13,848Earnings from operations . . . . . . . . . . . . . . . . . . . . . . . . . . . . . . . $ 1,507 $ 1,151 $ 1,282Earnings from operations as a % of net revenue . . . . . . . . . . . . . . 9.6% 7.4% 9.3%
The components of weighted average net revenue growth, by business unit, were as follows for thefollowing fiscal years ended October 31:
2006 2005
Percentage points
Technology services . . . . . . . . . . . . . . . . . . . . . . . . . . . . . . . . . . . . . . . . . . . . . . . (1.0) 5.6Managed services . . . . . . . . . . . . . . . . . . . . . . . . . . . . . . . . . . . . . . . . . . . . . . . . . 1.2 4.2Consulting and integration . . . . . . . . . . . . . . . . . . . . . . . . . . . . . . . . . . . . . . . . . . 0.3 2.3Other . . . . . . . . . . . . . . . . . . . . . . . . . . . . . . . . . . . . . . . . . . . . . . . . . . . . . . . . . — 0.1
Total HPS . . . . . . . . . . . . . . . . . . . . . . . . . . . . . . . . . . . . . . . . . . . . . . . . . . . . . . 0.5 12.2
HPS net revenue increased 1% in fiscal 2006 from fiscal 2005. On a constant currency basis, HPSnet revenue increased 2% in fiscal 2006 from fiscal 2005. In fiscal year 2006, the unfavorable currencyimpact was due primarily to the movement of the dollar against the euro and the yen.
Net revenue in technology services decreased 2% in fiscal 2006 from the prior year due primarilyto declines related to competitive pricing pressures and changes in the mix of platforms being serviced.This decline was moderated by growth in our IT solutions business such as integrated support services.
52
HEWLETT-PACKARD COMPANY AND SUBSIDIARIES
Management’s Discussion and Analysis ofFinancial Condition and Results of Operations (Continued)
In fiscal 2006, the 6% growth in managed services net revenue from the prior year was drivenmainly by new business and existing account growth, with continued focus on making more strategicportfolio decisions to improve profitability.
Net revenue in consulting and integration increased 2% in fiscal 2006 from the prior year dueprimarily to improved performance in Asia Pacific and Europe, Middle East and Africa (‘‘EMEA’’).
HPS earnings from operations as a percentage of net revenue in fiscal 2006 increased by2.2 percentage points. The operating margin increase was the result of a combination of an increase ingross margin and a decrease in operating expenses as a percentage of net revenue. The gross marginincrease in HPS was due primarily to the continued focus on cost structure improvement from deliveryefficiencies and cost controls, which were partially offset by the continued competitive environment insolutions and services business and higher fiscal 2006 bonus accruals. In fiscal year 2006, improvedefficiencies in our operating expense structure contributed to the decline in operating expenses as apercentage of net revenue compared to fiscal year 2005 despite the impact of higher bonus accruals infiscal 2006. Technology services operating margin in fiscal 2006 continued to benefit from improveddelivery efficiencies and cost controls as well as portfolio decisions made to improve profitability, all ofwhich were offset in part by the impact of the ongoing portfolio mix shift from higher marginproprietary support to lower margin areas such as multi-vendor integrated support and solutionservices. Managed services operating margin increased in fiscal 2006 due to delivery efficiencies,reduced operating expenses and more strategic portfolio decisions made to improve profitability.Consulting and integration operating margin improved in fiscal 2006 due to more efficient utilization ofour consultants and reduced operating expenses.
HPS net revenue increased 12% in fiscal 2005 from fiscal 2004. On a constant currency basis, HPSnet revenue increased 9% in fiscal 2005 from fiscal 2004. The favorable currency impact was dueprimarily to the weakening of the dollar against the euro and the yen for the first three quarters offiscal 2005 and to a lesser extent in the fourth fiscal quarter as the dollar strengthened against the euroand the yen during that period. Excluding acquisitions made since the first quarter of fiscal 2004, HPSnet revenue growth for fiscal 2005 was 8%. Net revenue in technology services increased 9% in fiscal2005. Excluding acquisitions made since the first quarter of fiscal 2004, technology services net revenuegrowth for fiscal 2005 was 4%.
In fiscal 2005, managed services net revenue increased 24% from the prior-year as a result of anincrease in new contracts, as well as additional revenue from our installed base of large customercontracts, the full year contribution of the Triaton acquisition (which we completed in April 2004) andfavorable currency impacts. Excluding Triaton, managed services net revenue growth was 22% for fiscal2005 compared to the prior fiscal year.
Net revenue in consulting and integration increased 13% in fiscal 2005 from the prior year due tostrong order growth in EMEA and Asia Pacific, as well as the favorable impact of currency.Additionally, the Triaton acquisition added to the revenue growth.
HPS earnings from operations as a percentage of net revenue in fiscal 2005 declined1.9 percentage points. The operating margin decline was the result of the combination of a decline ingross margin offset partially by a decrease in operating expense as a percentage of net revenue. Thegross margin decline in HPS reflected primarily competitive pricing pressures and portfolio mix shiftswithin technology services, as well as the cost of higher employee bonuses recorded in the second halfof the fiscal year, and the absorption of workforce reduction costs in the first half of the year thatamounted to $89 million. The technology services portfolio continues to evolve from higher margin
53
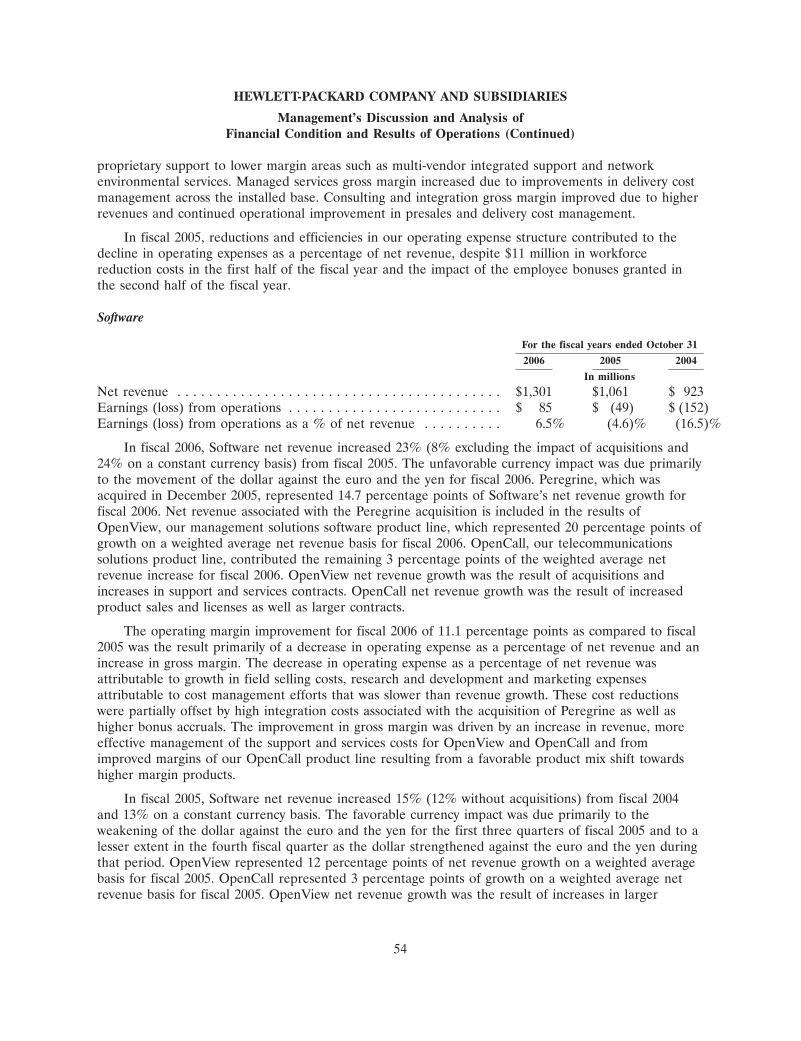
HEWLETT-PACKARD COMPANY AND SUBSIDIARIES
Management’s Discussion and Analysis ofFinancial Condition and Results of Operations (Continued)
proprietary support to lower margin areas such as multi-vendor integrated support and networkenvironmental services. Managed services gross margin increased due to improvements in delivery costmanagement across the installed base. Consulting and integration gross margin improved due to higherrevenues and continued operational improvement in presales and delivery cost management.
In fiscal 2005, reductions and efficiencies in our operating expense structure contributed to thedecline in operating expenses as a percentage of net revenue, despite $11 million in workforcereduction costs in the first half of the fiscal year and the impact of the employee bonuses granted inthe second half of the fiscal year.
Software
For the fiscal years ended October 31
2006 2005 2004
In millions
Net revenue . . . . . . . . . . . . . . . . . . . . . . . . . . . . . . . . . . . . . . . . . $1,301 $1,061 $ 923Earnings (loss) from operations . . . . . . . . . . . . . . . . . . . . . . . . . . . $ 85 $ (49) $ (152)Earnings (loss) from operations as a % of net revenue . . . . . . . . . . 6.5% (4.6)% (16.5)%
In fiscal 2006, Software net revenue increased 23% (8% excluding the impact of acquisitions and24% on a constant currency basis) from fiscal 2005. The unfavorable currency impact was due primarilyto the movement of the dollar against the euro and the yen for fiscal 2006. Peregrine, which wasacquired in December 2005, represented 14.7 percentage points of Software’s net revenue growth forfiscal 2006. Net revenue associated with the Peregrine acquisition is included in the results ofOpenView, our management solutions software product line, which represented 20 percentage points ofgrowth on a weighted average net revenue basis for fiscal 2006. OpenCall, our telecommunicationssolutions product line, contributed the remaining 3 percentage points of the weighted average netrevenue increase for fiscal 2006. OpenView net revenue growth was the result of acquisitions andincreases in support and services contracts. OpenCall net revenue growth was the result of increasedproduct sales and licenses as well as larger contracts.
The operating margin improvement for fiscal 2006 of 11.1 percentage points as compared to fiscal2005 was the result primarily of a decrease in operating expense as a percentage of net revenue and anincrease in gross margin. The decrease in operating expense as a percentage of net revenue wasattributable to growth in field selling costs, research and development and marketing expensesattributable to cost management efforts that was slower than revenue growth. These cost reductionswere partially offset by high integration costs associated with the acquisition of Peregrine as well ashigher bonus accruals. The improvement in gross margin was driven by an increase in revenue, moreeffective management of the support and services costs for OpenView and OpenCall and fromimproved margins of our OpenCall product line resulting from a favorable product mix shift towardshigher margin products.
In fiscal 2005, Software net revenue increased 15% (12% without acquisitions) from fiscal 2004and 13% on a constant currency basis. The favorable currency impact was due primarily to theweakening of the dollar against the euro and the yen for the first three quarters of fiscal 2005 and to alesser extent in the fourth fiscal quarter as the dollar strengthened against the euro and the yen duringthat period. OpenView represented 12 percentage points of net revenue growth on a weighted averagebasis for fiscal 2005. OpenCall represented 3 percentage points of growth on a weighted average netrevenue basis for fiscal 2005. OpenView net revenue growth was the result of increases in larger
54
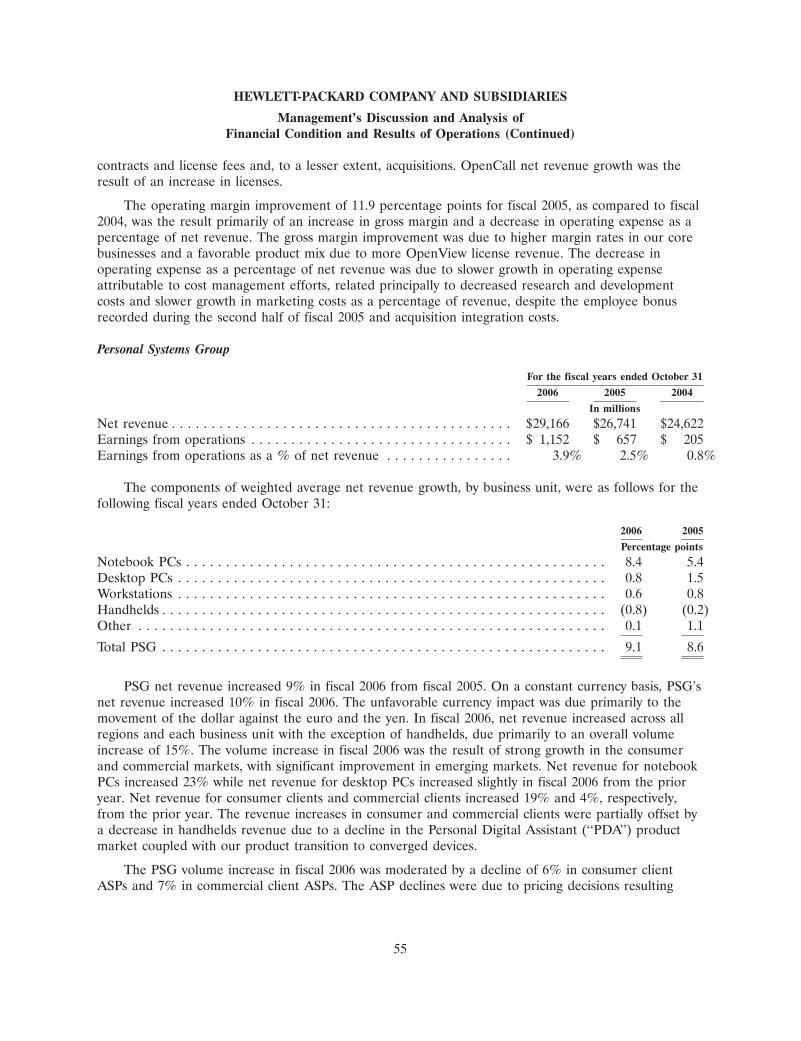
HEWLETT-PACKARD COMPANY AND SUBSIDIARIES
Management’s Discussion and Analysis ofFinancial Condition and Results of Operations (Continued)
contracts and license fees and, to a lesser extent, acquisitions. OpenCall net revenue growth was theresult of an increase in licenses.
The operating margin improvement of 11.9 percentage points for fiscal 2005, as compared to fiscal2004, was the result primarily of an increase in gross margin and a decrease in operating expense as apercentage of net revenue. The gross margin improvement was due to higher margin rates in our corebusinesses and a favorable product mix due to more OpenView license revenue. The decrease inoperating expense as a percentage of net revenue was due to slower growth in operating expenseattributable to cost management efforts, related principally to decreased research and developmentcosts and slower growth in marketing costs as a percentage of revenue, despite the employee bonusrecorded during the second half of fiscal 2005 and acquisition integration costs.
Personal Systems Group
For the fiscal years ended October 31
2006 2005 2004
In millions
Net revenue . . . . . . . . . . . . . . . . . . . . . . . . . . . . . . . . . . . . . . . . . . . $29,166 $26,741 $24,622Earnings from operations . . . . . . . . . . . . . . . . . . . . . . . . . . . . . . . . . $ 1,152 $ 657 $ 205Earnings from operations as a % of net revenue . . . . . . . . . . . . . . . . 3.9% 2.5% 0.8%
The components of weighted average net revenue growth, by business unit, were as follows for thefollowing fiscal years ended October 31:
2006 2005
Percentage points
Notebook PCs . . . . . . . . . . . . . . . . . . . . . . . . . . . . . . . . . . . . . . . . . . . . . . . . . . . . . 8.4 5.4Desktop PCs . . . . . . . . . . . . . . . . . . . . . . . . . . . . . . . . . . . . . . . . . . . . . . . . . . . . . . 0.8 1.5Workstations . . . . . . . . . . . . . . . . . . . . . . . . . . . . . . . . . . . . . . . . . . . . . . . . . . . . . . 0.6 0.8Handhelds . . . . . . . . . . . . . . . . . . . . . . . . . . . . . . . . . . . . . . . . . . . . . . . . . . . . . . . . (0.8) (0.2)Other . . . . . . . . . . . . . . . . . . . . . . . . . . . . . . . . . . . . . . . . . . . . . . . . . . . . . . . . . . . 0.1 1.1
Total PSG . . . . . . . . . . . . . . . . . . . . . . . . . . . . . . . . . . . . . . . . . . . . . . . . . . . . . . . . 9.1 8.6
PSG net revenue increased 9% in fiscal 2006 from fiscal 2005. On a constant currency basis, PSG’snet revenue increased 10% in fiscal 2006. The unfavorable currency impact was due primarily to themovement of the dollar against the euro and the yen. In fiscal 2006, net revenue increased across allregions and each business unit with the exception of handhelds, due primarily to an overall volumeincrease of 15%. The volume increase in fiscal 2006 was the result of strong growth in the consumerand commercial markets, with significant improvement in emerging markets. Net revenue for notebookPCs increased 23% while net revenue for desktop PCs increased slightly in fiscal 2006 from the prioryear. Net revenue for consumer clients and commercial clients increased 19% and 4%, respectively,from the prior year. The revenue increases in consumer and commercial clients were partially offset bya decrease in handhelds revenue due to a decline in the Personal Digital Assistant (‘‘PDA’’) productmarket coupled with our product transition to converged devices.
The PSG volume increase in fiscal 2006 was moderated by a decline of 6% in consumer clientASPs and 7% in commercial client ASPs. The ASP declines were due to pricing decisions resulting
55
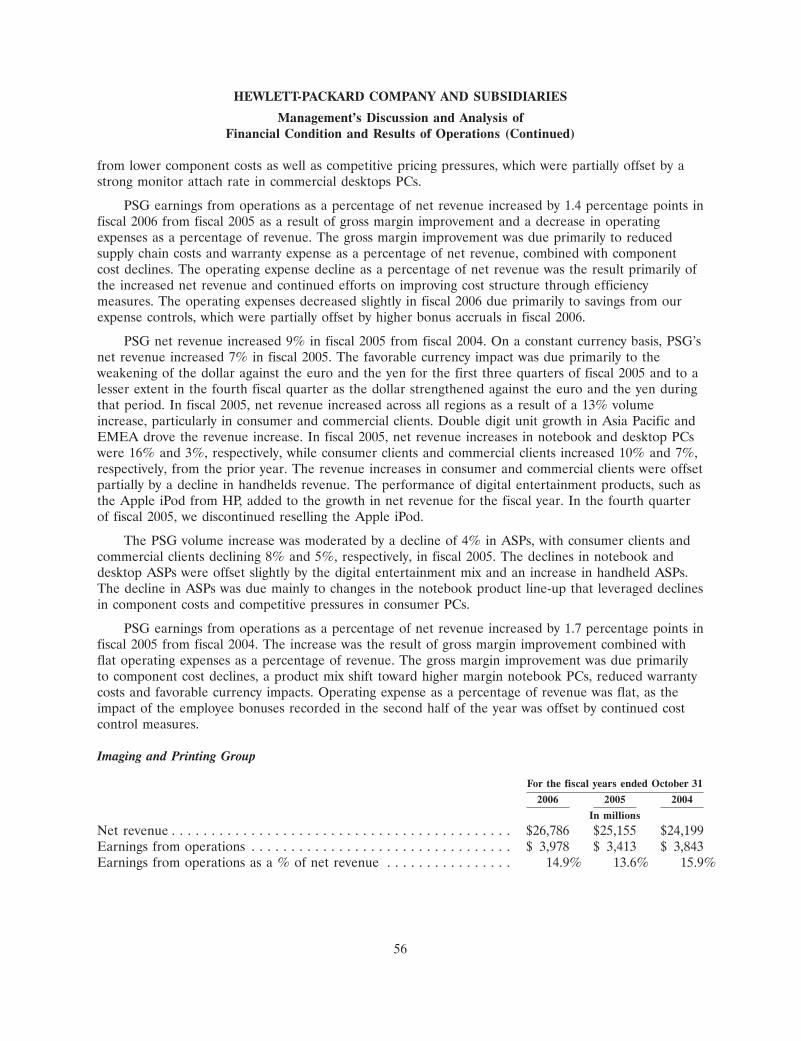
HEWLETT-PACKARD COMPANY AND SUBSIDIARIES
Management’s Discussion and Analysis ofFinancial Condition and Results of Operations (Continued)
from lower component costs as well as competitive pricing pressures, which were partially offset by astrong monitor attach rate in commercial desktops PCs.
PSG earnings from operations as a percentage of net revenue increased by 1.4 percentage points infiscal 2006 from fiscal 2005 as a result of gross margin improvement and a decrease in operatingexpenses as a percentage of revenue. The gross margin improvement was due primarily to reducedsupply chain costs and warranty expense as a percentage of net revenue, combined with componentcost declines. The operating expense decline as a percentage of net revenue was the result primarily ofthe increased net revenue and continued efforts on improving cost structure through efficiencymeasures. The operating expenses decreased slightly in fiscal 2006 due primarily to savings from ourexpense controls, which were partially offset by higher bonus accruals in fiscal 2006.
PSG net revenue increased 9% in fiscal 2005 from fiscal 2004. On a constant currency basis, PSG’snet revenue increased 7% in fiscal 2005. The favorable currency impact was due primarily to theweakening of the dollar against the euro and the yen for the first three quarters of fiscal 2005 and to alesser extent in the fourth fiscal quarter as the dollar strengthened against the euro and the yen duringthat period. In fiscal 2005, net revenue increased across all regions as a result of a 13% volumeincrease, particularly in consumer and commercial clients. Double digit unit growth in Asia Pacific andEMEA drove the revenue increase. In fiscal 2005, net revenue increases in notebook and desktop PCswere 16% and 3%, respectively, while consumer clients and commercial clients increased 10% and 7%,respectively, from the prior year. The revenue increases in consumer and commercial clients were offsetpartially by a decline in handhelds revenue. The performance of digital entertainment products, such asthe Apple iPod from HP, added to the growth in net revenue for the fiscal year. In the fourth quarterof fiscal 2005, we discontinued reselling the Apple iPod.
The PSG volume increase was moderated by a decline of 4% in ASPs, with consumer clients andcommercial clients declining 8% and 5%, respectively, in fiscal 2005. The declines in notebook anddesktop ASPs were offset slightly by the digital entertainment mix and an increase in handheld ASPs.The decline in ASPs was due mainly to changes in the notebook product line-up that leveraged declinesin component costs and competitive pressures in consumer PCs.
PSG earnings from operations as a percentage of net revenue increased by 1.7 percentage points infiscal 2005 from fiscal 2004. The increase was the result of gross margin improvement combined withflat operating expenses as a percentage of revenue. The gross margin improvement was due primarilyto component cost declines, a product mix shift toward higher margin notebook PCs, reduced warrantycosts and favorable currency impacts. Operating expense as a percentage of revenue was flat, as theimpact of the employee bonuses recorded in the second half of the year was offset by continued costcontrol measures.
Imaging and Printing Group
For the fiscal years ended October 31
2006 2005 2004
In millions
Net revenue . . . . . . . . . . . . . . . . . . . . . . . . . . . . . . . . . . . . . . . . . . . $26,786 $25,155 $24,199Earnings from operations . . . . . . . . . . . . . . . . . . . . . . . . . . . . . . . . . $ 3,978 $ 3,413 $ 3,843Earnings from operations as a % of net revenue . . . . . . . . . . . . . . . . 14.9% 13.6% 15.9%
56
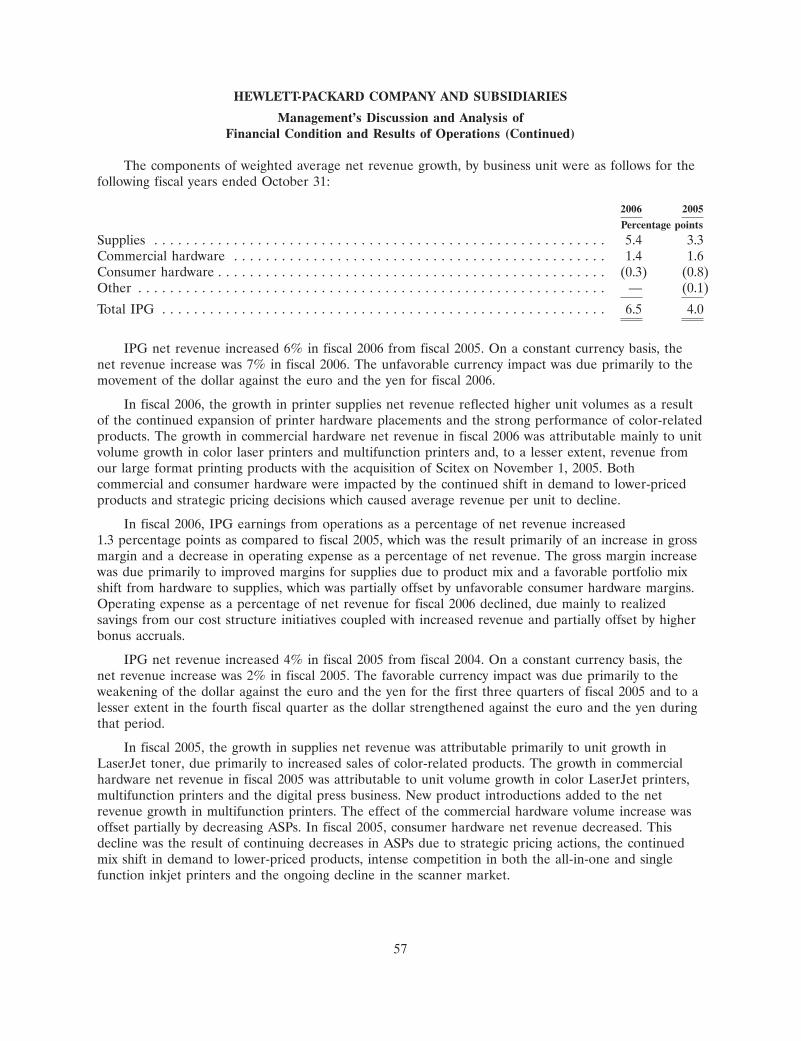
HEWLETT-PACKARD COMPANY AND SUBSIDIARIES
Management’s Discussion and Analysis ofFinancial Condition and Results of Operations (Continued)
The components of weighted average net revenue growth, by business unit were as follows for thefollowing fiscal years ended October 31:
2006 2005
Percentage points
Supplies . . . . . . . . . . . . . . . . . . . . . . . . . . . . . . . . . . . . . . . . . . . . . . . . . . . . . . . . . 5.4 3.3Commercial hardware . . . . . . . . . . . . . . . . . . . . . . . . . . . . . . . . . . . . . . . . . . . . . . . 1.4 1.6Consumer hardware . . . . . . . . . . . . . . . . . . . . . . . . . . . . . . . . . . . . . . . . . . . . . . . . . (0.3) (0.8)Other . . . . . . . . . . . . . . . . . . . . . . . . . . . . . . . . . . . . . . . . . . . . . . . . . . . . . . . . . . . — (0.1)
Total IPG . . . . . . . . . . . . . . . . . . . . . . . . . . . . . . . . . . . . . . . . . . . . . . . . . . . . . . . . 6.5 4.0
IPG net revenue increased 6% in fiscal 2006 from fiscal 2005. On a constant currency basis, thenet revenue increase was 7% in fiscal 2006. The unfavorable currency impact was due primarily to themovement of the dollar against the euro and the yen for fiscal 2006.
In fiscal 2006, the growth in printer supplies net revenue reflected higher unit volumes as a resultof the continued expansion of printer hardware placements and the strong performance of color-relatedproducts. The growth in commercial hardware net revenue in fiscal 2006 was attributable mainly to unitvolume growth in color laser printers and multifunction printers and, to a lesser extent, revenue fromour large format printing products with the acquisition of Scitex on November 1, 2005. Bothcommercial and consumer hardware were impacted by the continued shift in demand to lower-pricedproducts and strategic pricing decisions which caused average revenue per unit to decline.
In fiscal 2006, IPG earnings from operations as a percentage of net revenue increased1.3 percentage points as compared to fiscal 2005, which was the result primarily of an increase in grossmargin and a decrease in operating expense as a percentage of net revenue. The gross margin increasewas due primarily to improved margins for supplies due to product mix and a favorable portfolio mixshift from hardware to supplies, which was partially offset by unfavorable consumer hardware margins.Operating expense as a percentage of net revenue for fiscal 2006 declined, due mainly to realizedsavings from our cost structure initiatives coupled with increased revenue and partially offset by higherbonus accruals.
IPG net revenue increased 4% in fiscal 2005 from fiscal 2004. On a constant currency basis, thenet revenue increase was 2% in fiscal 2005. The favorable currency impact was due primarily to theweakening of the dollar against the euro and the yen for the first three quarters of fiscal 2005 and to alesser extent in the fourth fiscal quarter as the dollar strengthened against the euro and the yen duringthat period.
In fiscal 2005, the growth in supplies net revenue was attributable primarily to unit growth inLaserJet toner, due primarily to increased sales of color-related products. The growth in commercialhardware net revenue in fiscal 2005 was attributable to unit volume growth in color LaserJet printers,multifunction printers and the digital press business. New product introductions added to the netrevenue growth in multifunction printers. The effect of the commercial hardware volume increase wasoffset partially by decreasing ASPs. In fiscal 2005, consumer hardware net revenue decreased. Thisdecline was the result of continuing decreases in ASPs due to strategic pricing actions, the continuedmix shift in demand to lower-priced products, intense competition in both the all-in-one and singlefunction inkjet printers and the ongoing decline in the scanner market.
57

HEWLETT-PACKARD COMPANY AND SUBSIDIARIES
Management’s Discussion and Analysis ofFinancial Condition and Results of Operations (Continued)
In fiscal 2005, IPG earnings from operations as a percentage of net revenue declined by2.3 percentage points due primarily to a decline in gross margin as a percentage of net revenue whichwas offset partially by a decline in operating expenses as a percentage of net revenue. The gross margindecline was attributable to a mix shift within supplies from inkjet cartridges to LaserJet toner, alow-end mix shift in consumer hardware, voluntary severance incentive charges and strategic pricingactions. Operating expense, as a percentage of net revenue, remained relatively flat year-over-year, witha slight increase in spending due to voluntary severance incentive charges taken in the first half of thefiscal year and the second half of the year employee bonus expense offsetting the favorable impact ofheadcount reductions and lower program spending in research and development.
HP Financial Services
For the fiscal years ended October 31
2006 2005 2004
In millions
Net revenue . . . . . . . . . . . . . . . . . . . . . . . . . . . . . . . . . . . . . . . . . $2,078 $2,102 $1,895Earnings from operations . . . . . . . . . . . . . . . . . . . . . . . . . . . . . . . $ 147 $ 213 $ 125Earnings from operations as a % of net revenue . . . . . . . . . . . . . . . 7.1% 10.1% 6.6%
HPFS net revenue decreased by 1% in fiscal 2006 compared to fiscal 2005. The net revenuedecrease was due primarily to lower used equipment sales and other end-of-lease revenue, which werelargely offset by a higher mix of leases classified as operating leases.
In fiscal 2006, the 3.0 percentage point decrease in earnings from operations as a percentage ofnet revenue consisted of a decrease in gross margin, which was partially offset by a decrease inoperating expense as a percentage of net revenue. The gross margin decline was due primarily tocompetitor pricing pressures, a higher mix of lower margin operating lease assets and lower recoveriesfor bad debts, which were partially offset by lower credit losses. The decrease in operating expenses asa percentage of net revenue was the result of cost savings achieved through continued cost controls.
HPFS net revenue increased 11% in fiscal 2005 compared to fiscal 2004. The net revenue increasewas the result primarily of higher used equipment sales and a higher mix of leases classified asoperating leases.
In fiscal 2005, the 3.5 percentage point increase in earnings from operations as a percentage of netrevenue consisted of an increase in gross margin, which was partially offset by an increase in operatingexpense as a percentage of net revenue. The gross margin increase resulted primarily from lower baddebt expense, which was partially offset by a higher mix of lower margin operating lease assets. Thedecrease in bad debt expense was due in part to the release in fiscal 2005 of $40 million of reservesrelated to aged receivables in EMEA that have since been collected. The reserves were established inthe fourth quarter of fiscal 2004. Recoveries from accounts in Latin America previously written-off,lower credit losses and a reduction of reserves resulting from a stronger portfolio risk profile alsocontributed to the decrease in bad debt expense.
The slight increase in operating expense as a percentage of net revenue in fiscal 2005 was theresult mainly of a $62 million net reduction in revenue resulting from the reclassification of certainleases from operating leases to capital leases. This reclassification was the result of a review of theleasing portfolio for appropriate lease classification.
58

HEWLETT-PACKARD COMPANY AND SUBSIDIARIES
Management’s Discussion and Analysis ofFinancial Condition and Results of Operations (Continued)
Financing Originations
For the fiscal years ended October 31
2006 2005 2004
In millions
Total financing originations . . . . . . . . . . . . . . . . . . . . . . . . . . . . . . $3,994 $4,136 $3,852
New financing originations, which represent the amounts of financing provided to customers forequipment and related software and services, and include intercompany activity, decreased 3% in fiscal2006 from fiscal 2005. The decrease reflects lower financing associated with HP product sales.Financing originations increased 7% in fiscal 2005 from fiscal 2004 due to higher financing of HPproduct sales and a favorable currency impact.
Portfolio Assets and Ratios
HPFS maintains a strategy to generate a competitive return on equity by effectively leveraging itsportfolio against the risks associated with interest rates and credit. The HPFS business model is asset-intensive and uses certain internal metrics to measure its performance against other financial servicescompanies, including a segment balance sheet that is derived from our internal management reportingsystem. The accounting policies used to derive these amounts are substantially the same as those usedby the consolidated company. However, certain intercompany loans and accounts that are reflected inthe segment balances are eliminated in our Consolidated Financial Statements.
The portfolio assets and ratios derived from the segment balance sheet for HPFS were as followsfor the following fiscal years ended October 31:
2006 2005
In millions
Portfolio assets(1) . . . . . . . . . . . . . . . . . . . . . . . . . . . . . . . . . . . . . . . . . . . . . . . . . . $7,345 $7,085
Allowance for doubtful accounts . . . . . . . . . . . . . . . . . . . . . . . . . . . . . . . . . . . . . . . 80 111Operating lease equipment reserve . . . . . . . . . . . . . . . . . . . . . . . . . . . . . . . . . . . . . 42 45
Total reserves . . . . . . . . . . . . . . . . . . . . . . . . . . . . . . . . . . . . . . . . . . . . . . . . . . . . . 122 156
Net portfolio assets . . . . . . . . . . . . . . . . . . . . . . . . . . . . . . . . . . . . . . . . . . . . . . . . $7,223 $6,929
Reserve coverage . . . . . . . . . . . . . . . . . . . . . . . . . . . . . . . . . . . . . . . . . . . . . . . . . . 1.7% 2.2%Debt to equity ratio(2) . . . . . . . . . . . . . . . . . . . . . . . . . . . . . . . . . . . . . . . . . . . . . . . 6.0x 5.5x
(1) Portfolio assets include financing receivables of approximately $4.9 billion at October 31, 2006 and$5.0 billion at October 31, 2005 and net equipment under operating leases of $1.5 billion atOctober 31, 2006 and $1.3 billion at October 31, 2005, as disclosed in Note 10 to the ConsolidatedFinancial Statements in Item 8, which is incorporated herein by reference. Portfolio assets alsoinclude capitalized profit on intercompany equipment transactions of approximately $400 million atboth October 31, 2006 and October 31, 2005, and intercompany leases of approximately$500 million at October 31, 2006 and $400 million at October 31, 2005, both of which areeliminated in consolidation.
(2) HPFS debt consists of intercompany equity that is treated as debt for segment reporting purposes,intercompany debt and debt issued directly by HPFS.
59

HEWLETT-PACKARD COMPANY AND SUBSIDIARIES
Management’s Discussion and Analysis ofFinancial Condition and Results of Operations (Continued)
Portfolio assets at October 31, 2006 increased 4% from October 31, 2005. The increase resultedfrom a favorable currency impact and a high level of financing originations in the fourth quarter. Theoverall percentage of portfolio assets reserved decreased due primarily to the write-off of assetscovered by specific reserves and lower reserves resulting from a stronger portfolio risk profile.
HPFS funds its operations mainly through a combination of intercompany debt and equity. Theincrease in the debt to equity ratio reflects a planned increase in portfolio leverage.
Corporate Investments
For the fiscal years ended October 31
2006 2005 2004
In millions
Net revenue . . . . . . . . . . . . . . . . . . . . . . . . . . . . . . . . . . . . . . . . . . $ 566 $ 523 $ 449Loss from operations . . . . . . . . . . . . . . . . . . . . . . . . . . . . . . . . . . . $ (151) $ (174) $ (179)Loss from operations as a % of net revenue . . . . . . . . . . . . . . . . . . . (26.7)% (33.3)% (39.9)%
In fiscal 2006, the majority of the net revenue in Corporate Investments related to networkinfrastructure products, which grew 8% as a result of continued increased sales of gigabit Ethernetswitch products.
Corporate Investments’ loss from operations in fiscal 2006 decreased compared to fiscal 2005 dueprimarily to lower operating expenses related to global alliances and HP Labs and higher gross profitsfrom network infrastructure products. The decrease in operating expenses was due primarily to savingsresulting from restructuring actions and lower program spending. Expenses related to global alliancesand HP Labs contributed to the majority of the loss from operations. Such loss was offset in part byoperating profit from network infrastructure product sales.
In fiscal 2005, the majority of the net revenue in Corporate Investments related to networkinfrastructure products, which increased 20% from fiscal 2004 as a result of continued productenhancements, particularly in gigabit Ethernet switch products.
Expenses related to corporate development, global alliances and HP Labs increased 5% in fiscal2005 from fiscal 2004. The increase was due to higher spending on strategic initiatives and incubationprograms. These expenses, which contributed to the majority of the loss from operations for CorporateInvestments, were offset in part by operating profit from network infrastructure product sales.Corporate Investment’s loss from operations for fiscal 2005 decreased slightly from the prior fiscal yeardue to an increase in operating profit in network infrastructure products as a result of increasingoperating margins, offset partially by an increase in operating expenses related to corporatedevelopment, global alliances and HP Labs. The increase in gross margin was due primarily to afavorable product mix and lower trade discounts as a percentage of net revenue for networkinfrastructure products.
LIQUIDITY AND CAPITAL RESOURCES
Our cash balances are held in numerous locations throughout the world, including substantialamounts held outside of the United States. Most of the amounts held outside of the United Statescould be repatriated to the United States but, under current law, would be subject to United Statesfederal income taxes, less applicable foreign tax credits. Repatriation of some foreign balances isrestricted by local laws. HP has provided for the United States federal tax liability on these amounts for
60
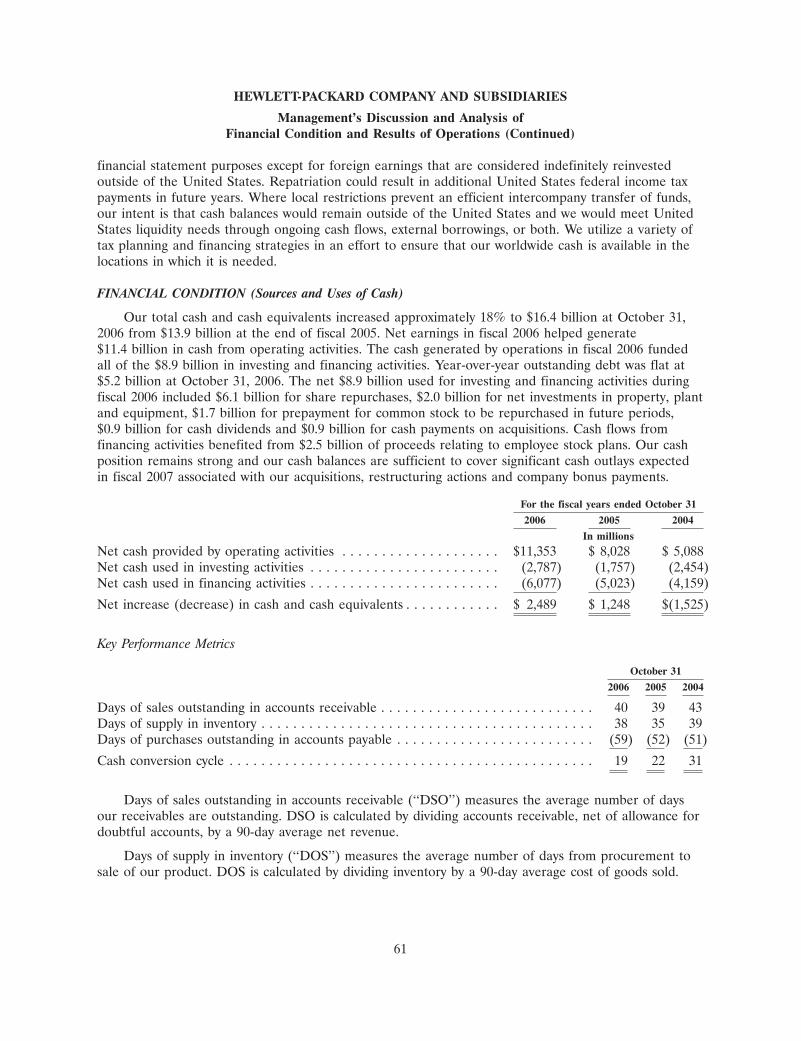
HEWLETT-PACKARD COMPANY AND SUBSIDIARIES
Management’s Discussion and Analysis ofFinancial Condition and Results of Operations (Continued)
financial statement purposes except for foreign earnings that are considered indefinitely reinvestedoutside of the United States. Repatriation could result in additional United States federal income taxpayments in future years. Where local restrictions prevent an efficient intercompany transfer of funds,our intent is that cash balances would remain outside of the United States and we would meet UnitedStates liquidity needs through ongoing cash flows, external borrowings, or both. We utilize a variety oftax planning and financing strategies in an effort to ensure that our worldwide cash is available in thelocations in which it is needed.
FINANCIAL CONDITION (Sources and Uses of Cash)
Our total cash and cash equivalents increased approximately 18% to $16.4 billion at October 31,2006 from $13.9 billion at the end of fiscal 2005. Net earnings in fiscal 2006 helped generate$11.4 billion in cash from operating activities. The cash generated by operations in fiscal 2006 fundedall of the $8.9 billion in investing and financing activities. Year-over-year outstanding debt was flat at$5.2 billion at October 31, 2006. The net $8.9 billion used for investing and financing activities duringfiscal 2006 included $6.1 billion for share repurchases, $2.0 billion for net investments in property, plantand equipment, $1.7 billion for prepayment for common stock to be repurchased in future periods,$0.9 billion for cash dividends and $0.9 billion for cash payments on acquisitions. Cash flows fromfinancing activities benefited from $2.5 billion of proceeds relating to employee stock plans. Our cashposition remains strong and our cash balances are sufficient to cover significant cash outlays expectedin fiscal 2007 associated with our acquisitions, restructuring actions and company bonus payments.
For the fiscal years ended October 31
2006 2005 2004
In millions
Net cash provided by operating activities . . . . . . . . . . . . . . . . . . . . $11,353 $ 8,028 $ 5,088Net cash used in investing activities . . . . . . . . . . . . . . . . . . . . . . . . (2,787) (1,757) (2,454)Net cash used in financing activities . . . . . . . . . . . . . . . . . . . . . . . . (6,077) (5,023) (4,159)
Net increase (decrease) in cash and cash equivalents . . . . . . . . . . . . $ 2,489 $ 1,248 $(1,525)
Key Performance Metrics
October 31
2006 2005 2004
Days of sales outstanding in accounts receivable . . . . . . . . . . . . . . . . . . . . . . . . . . . 40 39 43Days of supply in inventory . . . . . . . . . . . . . . . . . . . . . . . . . . . . . . . . . . . . . . . . . . 38 35 39Days of purchases outstanding in accounts payable . . . . . . . . . . . . . . . . . . . . . . . . . (59) (52) (51)
Cash conversion cycle . . . . . . . . . . . . . . . . . . . . . . . . . . . . . . . . . . . . . . . . . . . . . . 19 22 31
Days of sales outstanding in accounts receivable (‘‘DSO’’) measures the average number of daysour receivables are outstanding. DSO is calculated by dividing accounts receivable, net of allowance fordoubtful accounts, by a 90-day average net revenue.
Days of supply in inventory (‘‘DOS’’) measures the average number of days from procurement tosale of our product. DOS is calculated by dividing inventory by a 90-day average cost of goods sold.
61

HEWLETT-PACKARD COMPANY AND SUBSIDIARIES
Management’s Discussion and Analysis ofFinancial Condition and Results of Operations (Continued)
Days of purchases outstanding in accounts payable (‘‘DPO’’) measures the average number of daysour accounts payable balances are outstanding. DPO is calculated by dividing accounts payable by a90-day average cost of goods sold.
Our working capital requirements depend upon our effective management of the cash conversioncycle, which represents effectively the number of days that elapse from the day we pay for the purchaseof raw materials to the collection of cash from our customers. The cash conversion cycle is the sum ofDSO and DOS less DPO.
2006 Compared to 2005
Operating Activities
Net cash provided by operating activities increased by $3.3 billion during fiscal 2006. The increasein our cash flow from operations was due primarily to higher earnings and lower payments for pensionand taxes, which were partially offset by higher payments for restructuring costs.
Investing Activities
Net cash used in investing activities increased by $1.0 billion during fiscal 2006 due primarily tohigher capital expenditures for property, plant and equipment, lower net proceeds from maturities andsales of investments and higher cash paid for acquisitions.
Financing Activities
Net cash used in financing activities increased by $1.1 billion during fiscal 2006 as compared tofiscal 2005. The increase was due primarily to a $2.5 billion increase in repurchases of common stockand a $1.7 billion prepayment for common stock to be repurchased in future periods. Theseexpenditures were partially offset by a $1.6 billion net increase to financing activities resulting fromhigher borrowings and lower debt payments and $1.4 billion increased proceeds from the issuance ofcommon stock related to our employee stock plans mainly due to increased exercises of employee stockoptions as a result of higher market prices for our common stock during fiscal 2006.
We repurchase shares of our common stock under an ongoing program to manage the dilutioncreated by shares issued under employee benefit plans as well as to repurchase shares opportunistically.This program authorizes repurchases in the open market or in private transactions. In fiscal 2006, wecompleted share repurchases of approximately 188 million shares. Approximately 190 million shareswere settled for $6.1 billion, which included 2 million shares repurchased in transactions that wereexecuted in fiscal 2005 but settled in fiscal 2006, as compared to approximately 150 million sharesrepurchased, of which 148 million shares were settled for $3.5 billion in fiscal 2005.
In addition to the shares we repurchased, we received approximately 34 million shares for anaggregate price of $1.1 billion under a prepaid variable share purchase program (‘‘PVSPP’’) enteredinto with a third-party investment bank during the first quarter of 2006. Under the PVSPP, we prepaid$1.7 billion in the first quarter of fiscal 2006 in exchange for the right to receive a variable number ofshares of our common stock weekly over a one year period beginning in the second quarter of fiscal2006 and ending during the second quarter of fiscal 2007. We recorded the payment as a prepaid stockrepurchase in the stockholders’ equity section of our Consolidated Balance Sheet and included thepayment in the cash flows from financing activities in the Consolidated Statement of Cash Flows. Inconnection with this program, the investment bank has purchased and will continue to trade shares of
62

HEWLETT-PACKARD COMPANY AND SUBSIDIARIES
Management’s Discussion and Analysis ofFinancial Condition and Results of Operations (Continued)
our common stock in the open market over time. The prepaid funds will be expended ratably over theterm of the program.
Under the PVSPP, the prices at which we purchase the shares are subject to a minimum andmaximum price that was determined in advance of any repurchases being completed under theprogram, thereby effectively hedging our repurchase price. The minimum and maximum number ofshares we could receive under the program is 52 million shares and 70 million shares, respectively. Theexact number of shares to be repurchased is based upon the volume weighted average market price ofour shares during each weekly settlement period, subject to the minimum and maximum price as wellas regulatory limitations on the number of shares we are permitted to repurchase. We decrease ourshares outstanding each settlement period as shares are physically received. We will retire all sharesrepurchased under the PVSPP, and we will no longer deem those shares outstanding.
We intend to continue to repurchase shares as a means to manage dilution from the issuance ofshares under employee benefit plans and to purchase shares opportunistically. During fiscal 2006, ourBoard of Directors authorized an additional $10.0 billion for future repurchases of our outstandingshares of common stock. As of October 31, 2006, we had remaining authorization of approximately$5.6 billion for future share repurchases. Previously authorized share repurchases of approximately $600million also will be made under the PVSPP until the remaining available balance is exhausted in thesecond quarter of fiscal 2007.
2005 Compared to 2004
Operating Activities
Net cash provided by operating activities increased by 58% during fiscal 2005. Our cash positionbenefited primarily from our improved cash conversion cycle, which decreased 9 days compared tofiscal 2004 due primarily to improved effectiveness in accounts receivable collection efforts andimproved inventory management. Our cash flow from operations also benefited from delayed paymentsfor restructuring costs and company bonuses. These benefits were offset partially by higher pensioncontributions.
Investing Activities
Net cash used in investing activities decreased by 28% during fiscal 2005 due primarily to lowercash paid for acquisitions and reduced expenditures for property, plant and equipment.
Financing Activities
Net cash used in financing activities increased by 21% during fiscal 2005 as compared to fiscal2004. The increase was due primarily to the maturity of our debt and increased repurchases of ourcommon stock. These cash payments were offset partially by increased proceeds from the issuance ofcommon stock related to our employee stock plans.
We repaid $1.8 billion of debt during fiscal 2005 compared to $0.3 billion during fiscal 2004primarily due to the maturity of the $1.5 billion U.S. Dollar Global Notes and the $0.3 billionMedium-Term Notes assumed from the Compaq acquisition. Also, proceeds from the issuance ofcommon stock under employee plans were $1.2 billion in fiscal 2005 compared to $0.6 billion in fiscal2004, mainly because higher overall market prices during fiscal 2005 led to increased exercises ofemployee stock options.
63
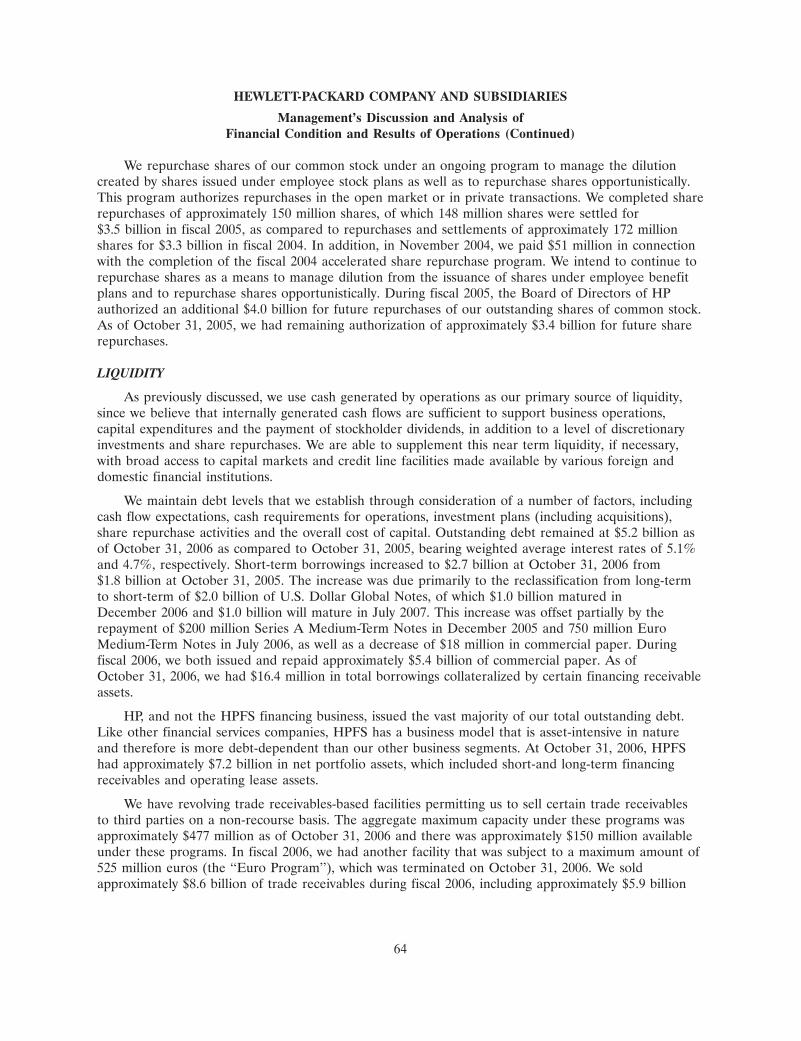
HEWLETT-PACKARD COMPANY AND SUBSIDIARIES
Management’s Discussion and Analysis ofFinancial Condition and Results of Operations (Continued)
We repurchase shares of our common stock under an ongoing program to manage the dilutioncreated by shares issued under employee stock plans as well as to repurchase shares opportunistically.This program authorizes repurchases in the open market or in private transactions. We completed sharerepurchases of approximately 150 million shares, of which 148 million shares were settled for$3.5 billion in fiscal 2005, as compared to repurchases and settlements of approximately 172 millionshares for $3.3 billion in fiscal 2004. In addition, in November 2004, we paid $51 million in connectionwith the completion of the fiscal 2004 accelerated share repurchase program. We intend to continue torepurchase shares as a means to manage dilution from the issuance of shares under employee benefitplans and to repurchase shares opportunistically. During fiscal 2005, the Board of Directors of HPauthorized an additional $4.0 billion for future repurchases of our outstanding shares of common stock.As of October 31, 2005, we had remaining authorization of approximately $3.4 billion for future sharerepurchases.
LIQUIDITY
As previously discussed, we use cash generated by operations as our primary source of liquidity,since we believe that internally generated cash flows are sufficient to support business operations,capital expenditures and the payment of stockholder dividends, in addition to a level of discretionaryinvestments and share repurchases. We are able to supplement this near term liquidity, if necessary,with broad access to capital markets and credit line facilities made available by various foreign anddomestic financial institutions.
We maintain debt levels that we establish through consideration of a number of factors, includingcash flow expectations, cash requirements for operations, investment plans (including acquisitions),share repurchase activities and the overall cost of capital. Outstanding debt remained at $5.2 billion asof October 31, 2006 as compared to October 31, 2005, bearing weighted average interest rates of 5.1%and 4.7%, respectively. Short-term borrowings increased to $2.7 billion at October 31, 2006 from$1.8 billion at October 31, 2005. The increase was due primarily to the reclassification from long-termto short-term of $2.0 billion of U.S. Dollar Global Notes, of which $1.0 billion matured inDecember 2006 and $1.0 billion will mature in July 2007. This increase was offset partially by therepayment of $200 million Series A Medium-Term Notes in December 2005 and 750 million EuroMedium-Term Notes in July 2006, as well as a decrease of $18 million in commercial paper. Duringfiscal 2006, we both issued and repaid approximately $5.4 billion of commercial paper. As ofOctober 31, 2006, we had $16.4 million in total borrowings collateralized by certain financing receivableassets.
HP, and not the HPFS financing business, issued the vast majority of our total outstanding debt.Like other financial services companies, HPFS has a business model that is asset-intensive in natureand therefore is more debt-dependent than our other business segments. At October 31, 2006, HPFShad approximately $7.2 billion in net portfolio assets, which included short-and long-term financingreceivables and operating lease assets.
We have revolving trade receivables-based facilities permitting us to sell certain trade receivablesto third parties on a non-recourse basis. The aggregate maximum capacity under these programs wasapproximately $477 million as of October 31, 2006 and there was approximately $150 million availableunder these programs. In fiscal 2006, we had another facility that was subject to a maximum amount of525 million euros (the ‘‘Euro Program’’), which was terminated on October 31, 2006. We soldapproximately $8.6 billion of trade receivables during fiscal 2006, including approximately $5.9 billion
64
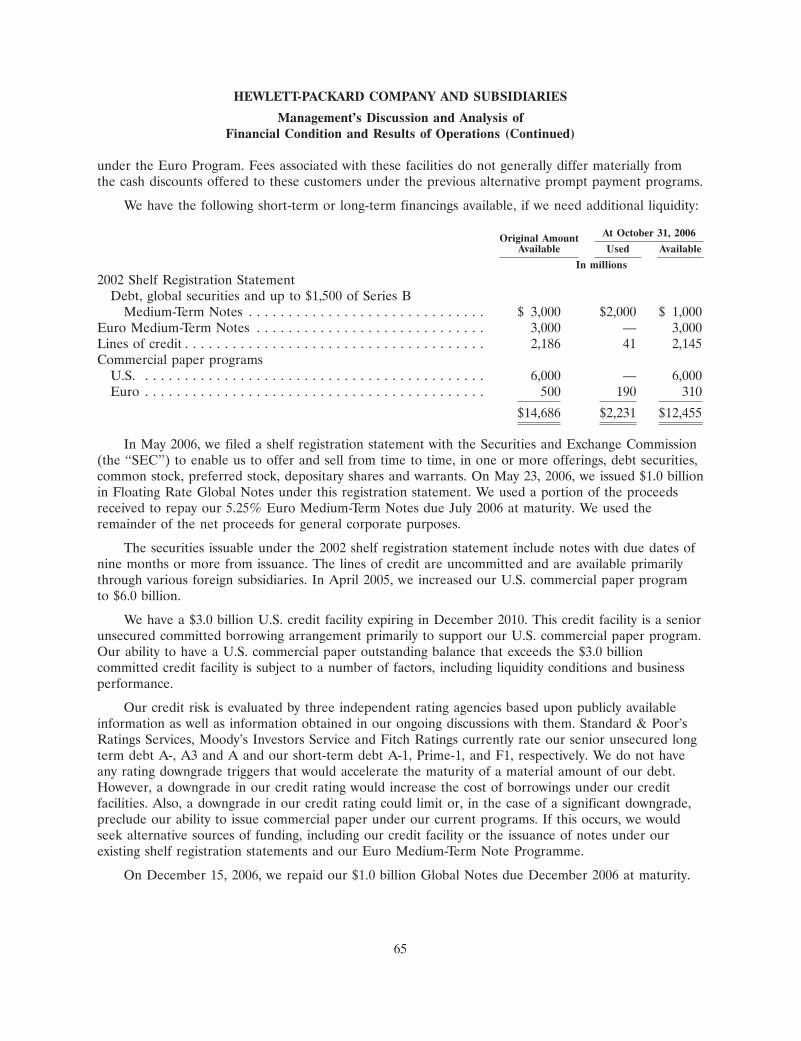
HEWLETT-PACKARD COMPANY AND SUBSIDIARIES
Management’s Discussion and Analysis ofFinancial Condition and Results of Operations (Continued)
under the Euro Program. Fees associated with these facilities do not generally differ materially fromthe cash discounts offered to these customers under the previous alternative prompt payment programs.
We have the following short-term or long-term financings available, if we need additional liquidity:
At October 31, 2006Original AmountAvailable Used Available
In millions
2002 Shelf Registration StatementDebt, global securities and up to $1,500 of Series B
Medium-Term Notes . . . . . . . . . . . . . . . . . . . . . . . . . . . . . . $ 3,000 $2,000 $ 1,000Euro Medium-Term Notes . . . . . . . . . . . . . . . . . . . . . . . . . . . . . 3,000 — 3,000Lines of credit . . . . . . . . . . . . . . . . . . . . . . . . . . . . . . . . . . . . . . 2,186 41 2,145Commercial paper programs
U.S. . . . . . . . . . . . . . . . . . . . . . . . . . . . . . . . . . . . . . . . . . . . 6,000 — 6,000Euro . . . . . . . . . . . . . . . . . . . . . . . . . . . . . . . . . . . . . . . . . . . 500 190 310
$14,686 $2,231 $12,455
In May 2006, we filed a shelf registration statement with the Securities and Exchange Commission(the ‘‘SEC’’) to enable us to offer and sell from time to time, in one or more offerings, debt securities,common stock, preferred stock, depositary shares and warrants. On May 23, 2006, we issued $1.0 billionin Floating Rate Global Notes under this registration statement. We used a portion of the proceedsreceived to repay our 5.25% Euro Medium-Term Notes due July 2006 at maturity. We used theremainder of the net proceeds for general corporate purposes.
The securities issuable under the 2002 shelf registration statement include notes with due dates ofnine months or more from issuance. The lines of credit are uncommitted and are available primarilythrough various foreign subsidiaries. In April 2005, we increased our U.S. commercial paper programto $6.0 billion.
We have a $3.0 billion U.S. credit facility expiring in December 2010. This credit facility is a seniorunsecured committed borrowing arrangement primarily to support our U.S. commercial paper program.Our ability to have a U.S. commercial paper outstanding balance that exceeds the $3.0 billioncommitted credit facility is subject to a number of factors, including liquidity conditions and businessperformance.
Our credit risk is evaluated by three independent rating agencies based upon publicly availableinformation as well as information obtained in our ongoing discussions with them. Standard & Poor’sRatings Services, Moody’s Investors Service and Fitch Ratings currently rate our senior unsecured longterm debt A-, A3 and A and our short-term debt A-1, Prime-1, and F1, respectively. We do not haveany rating downgrade triggers that would accelerate the maturity of a material amount of our debt.However, a downgrade in our credit rating would increase the cost of borrowings under our creditfacilities. Also, a downgrade in our credit rating could limit or, in the case of a significant downgrade,preclude our ability to issue commercial paper under our current programs. If this occurs, we wouldseek alternative sources of funding, including our credit facility or the issuance of notes under ourexisting shelf registration statements and our Euro Medium-Term Note Programme.
On December 15, 2006, we repaid our $1.0 billion Global Notes due December 2006 at maturity.
65

HEWLETT-PACKARD COMPANY AND SUBSIDIARIES
Management’s Discussion and Analysis ofFinancial Condition and Results of Operations (Continued)
Contractual Obligations
The impact that our contractual obligations as of October 31, 2006 are expected to have on ourliquidity and cash flow in future periods was as follows:
Payments Due by Period
Less than More thanTotal 1 Year 1-3 Years 3-5 Years 5 Years
In millions
Long-term debt, including capital lease obligations(1) $4,787 $2,099 $1,597 $ 19 $1,072Operating lease obligations . . . . . . . . . . . . . . . . . . . 2,065 506 718 395 446Purchase obligations(2) . . . . . . . . . . . . . . . . . . . . . . 2,777 2,052 504 198 23
Total . . . . . . . . . . . . . . . . . . . . . . . . . . . . . . . . . . . $9,629 $4,657 $2,819 $612 $1,541
(1) Amounts represent the expected cash payments of our long-term debt and do not include any fairvalue adjustments or discounts. Included in our long-term debt are approximately $52 million ofcapital lease obligations that are secured by certain equipment.
(2) Purchase obligations include agreements to purchase goods or services that are enforceable andlegally binding on us and that specify all significant terms, including fixed or minimum quantitiesto be purchased; fixed, minimum or variable price provisions; and the approximate timing of thetransaction. Purchase obligations exclude agreements that are cancelable without penalty. Thesepurchase obligations are related principally to cost of sales, inventory and other items. Ourpurchase obligation includes the settlement agreement with EMC Corporation (‘‘EMC’’) pursuantto which we agreed to pay $325 million (the net amount of the valuation of EMC’s claims againstus less the valuation of our claims against EMC) to EMC, which we can satisfy through thepurchase for resale or internal use of complementary EMC products in equal installments of$65 million over the next five years, of which the first installment was paid on August 29, 2005. Asof October 31, 2006, the remaining payment to EMC was $260 million. In addition, if EMCpurchases our products during the five-year period, we will be required to purchase an equivalentamount of additional products or services from EMC of up to an aggregate of $108 million.
In November 2006, we completed our acquisition of Mercury. The aggregate purchase price wasapproximately $4.8 billion, consisting of cash paid for outstanding stock, the value of vested employeestock options and estimated direct transaction costs. The acquisition will combine Mercury’s applicationmanagement, application delivery and IT governance capabilities with our broad portfolio ofmanagement solutions.
Funding Commitments
During fiscal 2006, we made approximately $270 million and $31 million of contributions to ourpension plans and U.S. non-qualified plan participants, respectively, and paid $67 million to coverbenefit claims for post-retirement benefit plans. In fiscal 2007, we expect to contribute approximately$120 million to our pension plans and approximately $15 million to cover benefit payments to U.S.non-qualified plan participants. We expect to pay approximately $80 million to cover benefit claims forour post-retirement benefit plans. Our funding policy is to contribute cash to our pension plans so thatwe meet at least the minimum contribution requirements, as established by local government and
66

HEWLETT-PACKARD COMPANY AND SUBSIDIARIES
Management’s Discussion and Analysis ofFinancial Condition and Results of Operations (Continued)
funding and taxing authorities. We expect to use contributions made to the post-retirement plansprimarily for the payment of retiree health claims incurred during the fiscal year.
We will make a significant cash payment associated with our fiscal 2006 bonus programs. Thebonus programs are designed to reward our employees upon achievement of annual performanceobjectives. Bonuses are calculated based on a formula, with targets that are set at the beginning of eachfiscal year. Both the formula and the targets are approved by our Board of Directors.
In fiscal 2006, we substantially outperformed against our targets which will result in a bonus payoutduring the first quarter of fiscal 2007 that will be significantly larger than prior years, resulting in acorresponding reduction in cash flow from operations in that quarter. This bonus was accrued andexpensed, as earned, throughout fiscal 2006.
Also reducing our cash flow from operation in fiscal 2007 will be significant payments associatedwith our restructuring plans. As a result of our approved restructuring plans, we expect future cashexpenditures of approximately $640 million. The majority of this amount is recorded on ourConsolidated Balance Sheet at October 31, 2006. We expect to make cash payments of approximately$549 million in fiscal 2007 and the remaining amount of approximately $91 million over the next fivefiscal years.
Pending Acquisitions
In December 2006, we agreed to acquire Knightsbridge Solutions Holdings Corporation, a privatelyheld services company specializing in the information management areas of business intelligence, datawarehousing, data integration and information quality. The transaction is subject to certain closingconditions and is expected to be completed during our first quarter of fiscal 2007.
Also in December 2006, we agreed to acquire Bitfone Corporation, a privately held global softwareand services company that develops software solutions for mobile device management for the wirelessindustry. The transaction is subject to certain closing conditions and is expected to be completed byFebruary 2007.
Off-Balance Sheet Arrangements
As part of our ongoing business, we do not participate in transactions that generate materialrelationships with unconsolidated entities or financial partnerships, such as entities often referred to asstructured finance or special purpose entities (‘‘SPEs’’), which would have been established for thepurpose of facilitating off-balance sheet arrangements or other contractually narrow or limitedpurposes. As of October 31, 2006, we are not involved in any material unconsolidated SPEs.
Indemnifications
In the ordinary course of business, we enter into contractual arrangements under which we mayagree to indemnify the third-party to such arrangement from any losses incurred relating to the servicesthey perform on behalf of us or for losses arising from certain events as defined within the particularcontract, which may include, for example, litigation or claims relating to past performance. Suchindemnification obligations may not be subject to maximum loss clauses. Historically, payments we havemade related to these indemnifications have been immaterial.
67
ITEM 7A. Quantitative and Qualitative Disclosures About Market Risk.
In the normal course of business, we are exposed to foreign currency exchange rate, interest rateand equity price risks that could impact our financial position and results of operations. Our riskmanagement strategy with respect to these three market risks may include the use of derivativefinancial instruments. We use derivative contracts only to manage existing underlying exposures of HP.Accordingly, we do not use derivative contracts for speculative purposes. Our risks, risk managementstrategy and a sensitivity analysis estimating the effects of changes in fair values for each of theseexposures are outlined below.
Actual gains and losses in the future may differ materially from the sensitivity analyses based onchanges in the timing and amount of interest rate, foreign currency exchange rate and equity pricemovements and our actual exposures and hedges.
Foreign currency exchange rate risk
We are exposed to foreign currency exchange rate risk inherent in our sales commitments,anticipated sales, anticipated purchases and assets, liabilities and debt denominated in currencies otherthan the U.S. dollar. We transact business in approximately 40 currencies worldwide, of which the mostsignificant to our operations for fiscal 2006 were the euro, the Japanese yen and the British pound. Formost currencies, we are a net receiver of the foreign currency and therefore benefit from a weaker U.S.dollar and are adversely affected by a stronger U.S. dollar relative to the foreign currency. Even wherewe are a net receiver, a weaker U.S. dollar may adversely affect certain expense figures taken alone.We use a combination of forward contracts and options designated as cash flow hedges to protectagainst the foreign currency exchange rate risks inherent in our forecasted net revenue and, to a lesserextent, cost of sales denominated in currencies other than the U.S. dollar. In addition, when debt isdenominated in a foreign currency, we may use swaps to exchange the foreign currency principal andinterest obligations for U.S. dollar-denominated amounts to manage the exposure to changes in foreigncurrency exchange rates. We also use other derivatives not designated as hedging instruments underSFAS No. 133, ‘‘Accounting for Derivative Instruments and Hedging Activities,’’ consisting primarily offorward contracts to hedge foreign currency balance sheet exposures. We recognize the gains and losseson foreign currency forward contracts in the same period as the remeasurement losses and gains of therelated foreign currency-denominated exposures. Alternatively, we may choose not to hedge the foreigncurrency risk associated with our foreign currency exposures if such exposure acts as a natural foreigncurrency hedge for other offsetting amounts denominated in the same currency or the currency isdifficult or too expensive to hedge.
We have performed sensitivity analyses as of October 31, 2006 and 2005, using a modelingtechnique that measures the change in the fair values arising from a hypothetical 10% adversemovement in the levels of foreign currency exchange rates relative to the U.S. dollar, with all othervariables held constant. The analyses cover all of our foreign currency contracts offset by the underlyingexposures. The foreign currency exchange rates we used were based on market rates in effect atOctober 31, 2006 and 2005. The sensitivity analyses indicated that a hypothetical 10% adversemovement in foreign currency exchange rates would result in a foreign exchange loss of $104 million atOctober 31, 2006 and $90 million at October 31, 2005.
Interest rate risk
We also are exposed to interest rate risk related to our debt and investment portfolios andfinancing receivables. We issue long-term debt in either U.S. dollars or foreign currencies based onmarket conditions at the time of financing. We then typically use interest rate swaps to modify themarket risk exposures in connection with the debt to achieve primarily U.S. dollar LIBOR-basedfloating interest expense. The swap transactions generally involve the exchange of fixed for floating
68
interest payments. However, we may choose not to swap fixed for floating interest payments or mayterminate a previously executed swap if we believe a larger proportion of fixed-rate debt would bebeneficial. In order to hedge the fair value of certain fixed-rate investments, we may enter into interestrate swaps that convert fixed interest returns into variable interest returns. We may use cash flowhedges to hedge the variability of LIBOR-based interest income received on certain variable-rateinvestments. We may also enter into interest rate swaps that convert variable rate interest returns intofixed-rate interest returns.
We have performed sensitivity analyses as of October 31, 2006 and 2005, using a modelingtechnique that measures the change in the fair values arising from a hypothetical 10% adversemovement in the levels of interest rates across the entire yield curve, with all other variables heldconstant. The analyses cover our debt, investment instruments, financing receivables and interest rateswaps. The analyses use actual maturities for the debt, investments and interest rate swaps andapproximate maturities for financing receivables. The discount rates we used were based on the marketinterest rates in effect at October 31, 2006 and 2005. The sensitivity analyses indicated that ahypothetical 10% adverse movement in interest rates would result in a loss in the fair values of ourdebt and investment instruments and financing receivables, net of interest rate swap positions, of$19 million at October 31, 2006 and $4 million at October 31, 2005.
Equity price risk
We are also exposed to equity price risk inherent in our portfolio of publicly-traded equitysecurities, which had an estimated fair value of $36 million at October 31, 2006 and $64 million atOctober 31, 2005. We monitor our equity investments for impairment on a periodic basis. In the eventthat the carrying value of the equity investment exceeds its fair value, and we determine the decline invalue to be other than temporary, we reduce the carrying value to its current fair value. Generally, wedo not attempt to reduce or eliminate our market exposure on these equity securities. However, wemay use derivative transactions to hedge certain positions from time to time. We do not purchase ourequity securities with the intent to use them for trading or speculative purposes. A hypothetical 30%adverse change in the stock prices of our publicly-traded equity securities would result in a loss in thefair values of our marketable equity securities of $11 million at October 31, 2006 and $19 million atOctober 31, 2005. The aggregate cost of privately-held companies and other investments is $362 millionat October 31, 2006 and $353 million at October 31, 2005.
69
ITEM 8. Financial Statements and Supplementary Data.
Table of Contents
Report of Independent Registered Public Accounting Firm . . . . . . . . . . . . . . . . . . . . . . . . . . . . 71
Management’s Report on Internal Control Over Financial Reporting . . . . . . . . . . . . . . . . . . . . . 73
Consolidated Statements of Earnings . . . . . . . . . . . . . . . . . . . . . . . . . . . . . . . . . . . . . . . . . . . . 74
Consolidated Balance Sheets . . . . . . . . . . . . . . . . . . . . . . . . . . . . . . . . . . . . . . . . . . . . . . . . . . 75
Consolidated Statements of Cash Flows . . . . . . . . . . . . . . . . . . . . . . . . . . . . . . . . . . . . . . . . . . 76
Consolidated Statements of Stockholders’ Equity . . . . . . . . . . . . . . . . . . . . . . . . . . . . . . . . . . . . 77
Notes to Consolidated Financial Statements . . . . . . . . . . . . . . . . . . . . . . . . . . . . . . . . . . . . . . . 78
Note 1: Summary of Significant Accounting Policies . . . . . . . . . . . . . . . . . . . . . . . . . . . . . . . . 78
Note 2: Stock-Based Compensation . . . . . . . . . . . . . . . . . . . . . . . . . . . . . . . . . . . . . . . . . . . . 86
Note 3: Net Earnings Per Share (‘‘EPS’’) . . . . . . . . . . . . . . . . . . . . . . . . . . . . . . . . . . . . . . . . 92
Note 4: Balance Sheet Details . . . . . . . . . . . . . . . . . . . . . . . . . . . . . . . . . . . . . . . . . . . . . . . . 93
Note 5: Supplemental Cash Flow Information . . . . . . . . . . . . . . . . . . . . . . . . . . . . . . . . . . . . 95
Note 6: Acquisitions . . . . . . . . . . . . . . . . . . . . . . . . . . . . . . . . . . . . . . . . . . . . . . . . . . . . . . . 95
Note 7: Goodwill and Purchased Intangible Assets . . . . . . . . . . . . . . . . . . . . . . . . . . . . . . . . . 98
Note 8: Restructuring Charges . . . . . . . . . . . . . . . . . . . . . . . . . . . . . . . . . . . . . . . . . . . . . . . 99
Note 9: Financial Instruments . . . . . . . . . . . . . . . . . . . . . . . . . . . . . . . . . . . . . . . . . . . . . . . . 101
Note 10: Financing Receivables and Operating Leases . . . . . . . . . . . . . . . . . . . . . . . . . . . . . . 106
Note 11: Guarantees . . . . . . . . . . . . . . . . . . . . . . . . . . . . . . . . . . . . . . . . . . . . . . . . . . . . . . 107
Note 12: Borrowings . . . . . . . . . . . . . . . . . . . . . . . . . . . . . . . . . . . . . . . . . . . . . . . . . . . . . . . 108
Note 13: Taxes on Earnings . . . . . . . . . . . . . . . . . . . . . . . . . . . . . . . . . . . . . . . . . . . . . . . . . . 111
Note 14: Stockholders’ Equity . . . . . . . . . . . . . . . . . . . . . . . . . . . . . . . . . . . . . . . . . . . . . . . . 115
Note 15: Retirement and Post-Retirement Benefit Plans . . . . . . . . . . . . . . . . . . . . . . . . . . . . . 117
Note 16: Commitments . . . . . . . . . . . . . . . . . . . . . . . . . . . . . . . . . . . . . . . . . . . . . . . . . . . . . 126
Note 17: Litigation and Contingencies . . . . . . . . . . . . . . . . . . . . . . . . . . . . . . . . . . . . . . . . . . 127
Note 18: Segment Information . . . . . . . . . . . . . . . . . . . . . . . . . . . . . . . . . . . . . . . . . . . . . . . 134
Quarterly Summary . . . . . . . . . . . . . . . . . . . . . . . . . . . . . . . . . . . . . . . . . . . . . . . . . . . . . . . . . 141
70

Report of Independent Registered Public Accounting Firm
To the Board of Directors and Stockholders ofHewlett-Packard Company
We have audited the accompanying consolidated balance sheets of Hewlett-Packard Company andsubsidiaries as of October 31, 2006 and 2005, and the related consolidated statements of earnings,stockholders’ equity and cash flows for each of the three years in the period ended October 31, 2006.Our audits also included the financial statement schedule listed in the Index at Item 15(a)(2). Thesefinancial statements and schedule are the responsibility of the Company’s management. Ourresponsibility is to express an opinion on these financial statements and schedule based on our audits.
We conducted our audits in accordance with the standards of the Public Company AccountingOversight Board (United States). Those standards require that we plan and perform the audit to obtainreasonable assurance about whether the financial statements are free of material misstatement. Anaudit includes examining, on a test basis, evidence supporting the amounts and disclosures in thefinancial statements. An audit also includes assessing the accounting principles used and significantestimates made by management, as well as evaluating the overall financial statement presentation. Webelieve that our audits provide a reasonable basis for our opinion.
In our opinion, the financial statements referred to above present fairly, in all material respects,the consolidated financial position of Hewlett-Packard Company and subsidiaries at October 31, 2006and 2005, and the consolidated results of their operations and their cash flows for each of the threeyears in the period ended October 31, 2006, in conformity with U.S. generally accepted accountingprinciples. Also, in our opinion, the related financial statement schedule, when considered in relation tothe basic financial statements taken as a whole, presents fairly in all material respects the informationset forth therein.
We also have audited, in accordance with the standards of the Public Company AccountingOversight Board (United States), the effectiveness of Hewlett-Packard Company’s internal control overfinancial reporting as of October 31, 2006, based on criteria established in Internal Control—IntegratedFramework issued by the Committee of Sponsoring Organizations of the Treadway Commission and ourreport dated December 15, 2006 expressed an unqualified opinion thereon.
As discussed in Note 1 to the consolidated financial statements, in fiscal year 2006, Hewlett-Packard Company changed its method of accounting for stock-based compensation in accordance withguidance provided in Statement of Financial Accounting Standards No. 123(R), ‘‘Share-BasedPayment’’.
/s/ ERNST & YOUNG LLP
San Jose, CaliforniaDecember 15, 2006
71
Report of Independent Registered Public Accounting Firm
To the Board of Directors and Stockholders ofHewlett-Packard Company
We have audited management’s assessment, included in the accompanying Management’s Reporton Internal Control Over Financial Reporting, that Hewlett-Packard Company maintained effectiveinternal control over financial reporting as of October 31, 2006, based on criteria established in InternalControl—Integrated Framework issued by the Committee of Sponsoring Organizations of the TreadwayCommission (the COSO criteria). Hewlett-Packard Company’s management is responsible formaintaining effective internal control over financial reporting and for its assessment of the effectivenessof internal control over financial reporting. Our responsibility is to express an opinion on management’sassessment and an opinion on the effectiveness of the company’s internal control over financialreporting based on our audit.
We conducted our audit in accordance with the standards of the Public Company AccountingOversight Board (United States). Those standards require that we plan and perform the audit to obtainreasonable assurance about whether effective internal control over financial reporting was maintainedin all material respects. Our audit included obtaining an understanding of internal control overfinancial reporting, evaluating management’s assessment, testing and evaluating the design andoperating effectiveness of internal control, and performing such other procedures as we considerednecessary in the circumstances. We believe that our audit provides a reasonable basis for our opinion.
A company’s internal control over financial reporting is a process designed to provide reasonableassurance regarding the reliability of financial reporting and the preparation of financial statements forexternal purposes in accordance with U.S. generally accepted accounting principles. A company’sinternal control over financial reporting includes those policies and procedures that (1) pertain to themaintenance of records that, in reasonable detail, accurately and fairly reflect the transactions anddispositions of the assets of the company; (2) provide reasonable assurance that transactions arerecorded as necessary to permit preparation of financial statements in accordance with U.S. generallyaccepted accounting principles, and that receipts and expenditures of the company are being made onlyin accordance with authorizations of management and directors of the company; and (3) providereasonable assurance regarding prevention or timely detection of unauthorized acquisition, use, ordisposition of the company’s assets that could have a material effect on the financial statements.
Because of its inherent limitations, internal control over financial reporting may not prevent ordetect misstatements. Also, projections of any evaluation of effectiveness to future periods are subjectto the risk that controls may become inadequate because of changes in conditions, or that the degreeof compliance with the policies or procedures may deteriorate.
In our opinion, management’s assessment that Hewlett-Packard Company maintained effectiveinternal control over financial reporting as of October 31, 2006, is fairly stated, in all material respects,based on the COSO criteria. Also, in our opinion, Hewlett-Packard Company maintained, in allmaterial respects, effective internal control over financial reporting as of October 31, 2006, based onthe COSO criteria.
We also have audited, in accordance with the standards of the Public Company AccountingOversight Board (United States), the accompanying consolidated balance sheets of Hewlett-PackardCompany and subsidiaries as of October 31, 2006 and 2005, and the related consolidated statements ofearnings, stockholders’ equity and cash flows for each of the three years in the period endedOctober 31, 2006 and our report dated December 15, 2006 expressed an unqualified opinion thereon.
/s/ ERNST & YOUNG LLP
San Jose, CaliforniaDecember 15, 2006
72
Management’s Report on Internal Control Over Financial Reporting
HP’s management is responsible for establishing and maintaining adequate internal control overfinancial reporting for HP. HP’s internal control over financial reporting is a process designed toprovide reasonable assurance regarding the reliability of financial reporting and the preparation offinancial statements for external purposes in accordance with U.S. generally accepted accountingprinciples. HP’s internal control over financial reporting includes those policies and procedures that(i) pertain to the maintenance of records that, in reasonable detail, accurately and fairly reflect thetransactions and dispositions of the assets of HP; (ii) provide reasonable assurance that transactions arerecorded as necessary to permit preparation of financial statements in accordance with generallyaccepted accounting principles, and that receipts and expenditures of HP are being made only inaccordance with authorizations of management and directors of HP; and (iii) provide reasonableassurance regarding prevention or timely detection of unauthorized acquisition, use, or disposition ofHP’s assets that could have a material effect on the financial statements.
Because of its inherent limitations, internal control over financial reporting may not prevent ordetect misstatements. Also, projections of any evaluation of effectiveness to future periods are subjectto the risk that controls may become inadequate because of changes in conditions, or that the degreeof compliance with the policies or procedures may deteriorate.
HP’s management assessed the effectiveness of HP’s internal control over financial reporting as ofOctober 31, 2006, utilizing the criteria set forth by the Committee of Sponsoring Organizations of theTreadway Commission (COSO) in Internal Control-Integrated Framework. Based on the assessment byHP’s management, we determined that HP’s internal control over financial reporting was effective as ofOctober 31, 2006. HP management’s assessment of the effectiveness of HP’s internal control overfinancial reporting as of October 31, 2006 has been audited by Ernst & Young LLP, HP’s independentregistered public accounting firm, as stated in their report which appears on page 72 of this AnnualReport on Form 10-K.
/s/ MARK V. HURD /s/ ROBERT P. WAYMAN
Mark V. Hurd Robert P. WaymanChairman, Chief Executive Officer and President Executive Vice President and Chief Financial OfficerDecember 15, 2006 December 15, 2006
73
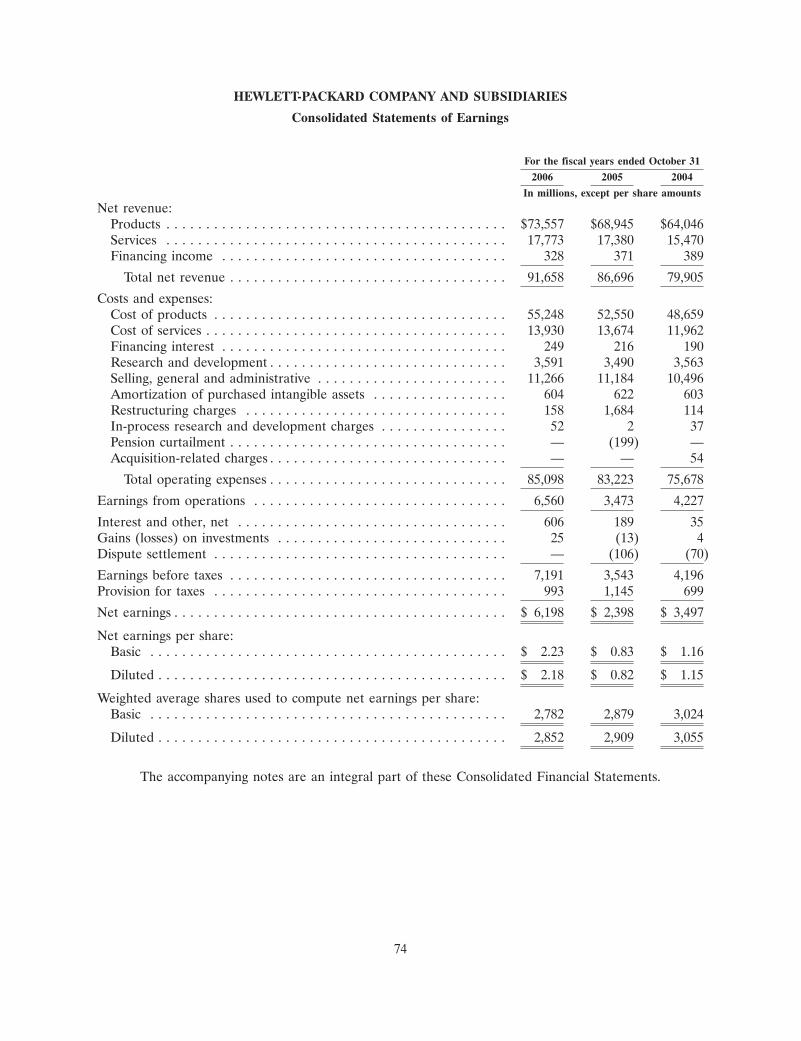
HEWLETT-PACKARD COMPANY AND SUBSIDIARIES
Consolidated Statements of Earnings
For the fiscal years ended October 31
2006 2005 2004
In millions, except per share amounts
Net revenue:Products . . . . . . . . . . . . . . . . . . . . . . . . . . . . . . . . . . . . . . . . . . . $73,557 $68,945 $64,046Services . . . . . . . . . . . . . . . . . . . . . . . . . . . . . . . . . . . . . . . . . . . 17,773 17,380 15,470Financing income . . . . . . . . . . . . . . . . . . . . . . . . . . . . . . . . . . . . 328 371 389
Total net revenue . . . . . . . . . . . . . . . . . . . . . . . . . . . . . . . . . . . 91,658 86,696 79,905
Costs and expenses:Cost of products . . . . . . . . . . . . . . . . . . . . . . . . . . . . . . . . . . . . . 55,248 52,550 48,659Cost of services . . . . . . . . . . . . . . . . . . . . . . . . . . . . . . . . . . . . . . 13,930 13,674 11,962Financing interest . . . . . . . . . . . . . . . . . . . . . . . . . . . . . . . . . . . . 249 216 190Research and development . . . . . . . . . . . . . . . . . . . . . . . . . . . . . . 3,591 3,490 3,563Selling, general and administrative . . . . . . . . . . . . . . . . . . . . . . . . 11,266 11,184 10,496Amortization of purchased intangible assets . . . . . . . . . . . . . . . . . 604 622 603Restructuring charges . . . . . . . . . . . . . . . . . . . . . . . . . . . . . . . . . 158 1,684 114In-process research and development charges . . . . . . . . . . . . . . . . 52 2 37Pension curtailment . . . . . . . . . . . . . . . . . . . . . . . . . . . . . . . . . . . — (199) —Acquisition-related charges . . . . . . . . . . . . . . . . . . . . . . . . . . . . . . — — 54
Total operating expenses . . . . . . . . . . . . . . . . . . . . . . . . . . . . . . 85,098 83,223 75,678
Earnings from operations . . . . . . . . . . . . . . . . . . . . . . . . . . . . . . . . 6,560 3,473 4,227
Interest and other, net . . . . . . . . . . . . . . . . . . . . . . . . . . . . . . . . . . 606 189 35Gains (losses) on investments . . . . . . . . . . . . . . . . . . . . . . . . . . . . . 25 (13) 4Dispute settlement . . . . . . . . . . . . . . . . . . . . . . . . . . . . . . . . . . . . . — (106) (70)
Earnings before taxes . . . . . . . . . . . . . . . . . . . . . . . . . . . . . . . . . . . 7,191 3,543 4,196Provision for taxes . . . . . . . . . . . . . . . . . . . . . . . . . . . . . . . . . . . . . 993 1,145 699
Net earnings . . . . . . . . . . . . . . . . . . . . . . . . . . . . . . . . . . . . . . . . . . $ 6,198 $ 2,398 $ 3,497
Net earnings per share:Basic . . . . . . . . . . . . . . . . . . . . . . . . . . . . . . . . . . . . . . . . . . . . . $ 2.23 $ 0.83 $ 1.16
Diluted . . . . . . . . . . . . . . . . . . . . . . . . . . . . . . . . . . . . . . . . . . . . $ 2.18 $ 0.82 $ 1.15
Weighted average shares used to compute net earnings per share:Basic . . . . . . . . . . . . . . . . . . . . . . . . . . . . . . . . . . . . . . . . . . . . . 2,782 2,879 3,024
Diluted . . . . . . . . . . . . . . . . . . . . . . . . . . . . . . . . . . . . . . . . . . . . 2,852 2,909 3,055
The accompanying notes are an integral part of these Consolidated Financial Statements.
74
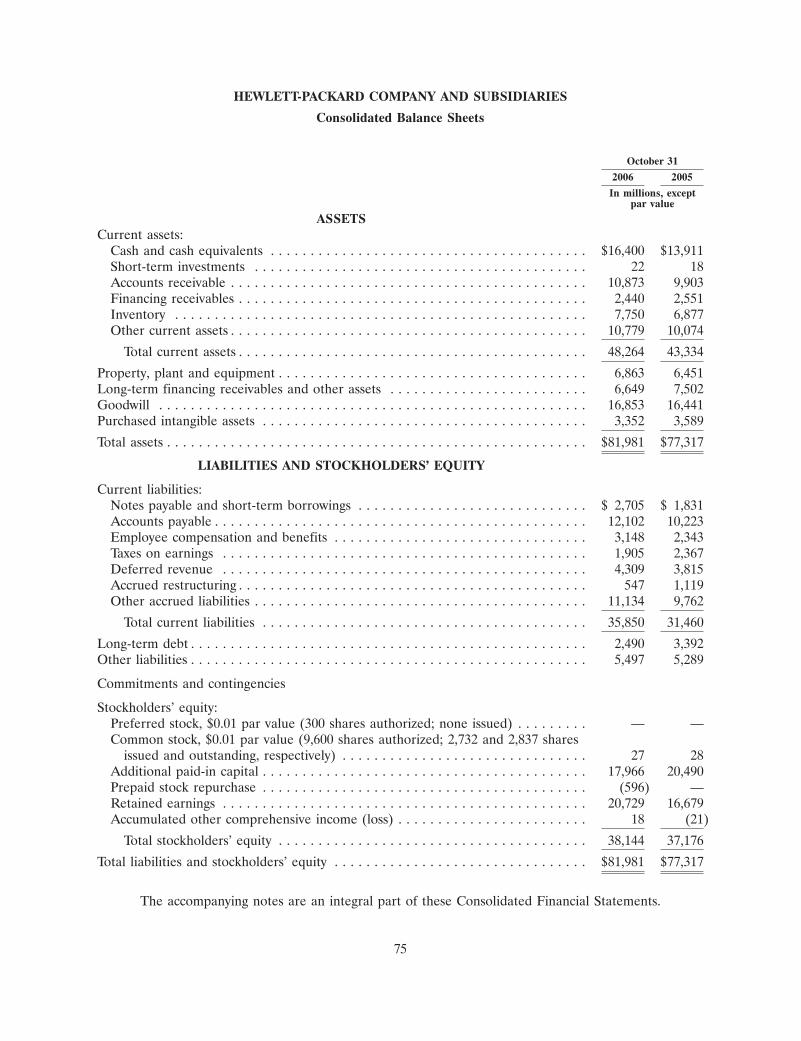
HEWLETT-PACKARD COMPANY AND SUBSIDIARIES
Consolidated Balance Sheets
October 31
2006 2005
In millions, exceptpar value
ASSETSCurrent assets:
Cash and cash equivalents . . . . . . . . . . . . . . . . . . . . . . . . . . . . . . . . . . . . . . . . $16,400 $13,911Short-term investments . . . . . . . . . . . . . . . . . . . . . . . . . . . . . . . . . . . . . . . . . . 22 18Accounts receivable . . . . . . . . . . . . . . . . . . . . . . . . . . . . . . . . . . . . . . . . . . . . . 10,873 9,903Financing receivables . . . . . . . . . . . . . . . . . . . . . . . . . . . . . . . . . . . . . . . . . . . . 2,440 2,551Inventory . . . . . . . . . . . . . . . . . . . . . . . . . . . . . . . . . . . . . . . . . . . . . . . . . . . . 7,750 6,877Other current assets . . . . . . . . . . . . . . . . . . . . . . . . . . . . . . . . . . . . . . . . . . . . . 10,779 10,074
Total current assets . . . . . . . . . . . . . . . . . . . . . . . . . . . . . . . . . . . . . . . . . . . . 48,264 43,334
Property, plant and equipment . . . . . . . . . . . . . . . . . . . . . . . . . . . . . . . . . . . . . . . 6,863 6,451Long-term financing receivables and other assets . . . . . . . . . . . . . . . . . . . . . . . . . 6,649 7,502Goodwill . . . . . . . . . . . . . . . . . . . . . . . . . . . . . . . . . . . . . . . . . . . . . . . . . . . . . . 16,853 16,441Purchased intangible assets . . . . . . . . . . . . . . . . . . . . . . . . . . . . . . . . . . . . . . . . . 3,352 3,589
Total assets . . . . . . . . . . . . . . . . . . . . . . . . . . . . . . . . . . . . . . . . . . . . . . . . . . . . . $81,981 $77,317
LIABILITIES AND STOCKHOLDERS’ EQUITY
Current liabilities:Notes payable and short-term borrowings . . . . . . . . . . . . . . . . . . . . . . . . . . . . . $ 2,705 $ 1,831Accounts payable . . . . . . . . . . . . . . . . . . . . . . . . . . . . . . . . . . . . . . . . . . . . . . . 12,102 10,223Employee compensation and benefits . . . . . . . . . . . . . . . . . . . . . . . . . . . . . . . . 3,148 2,343Taxes on earnings . . . . . . . . . . . . . . . . . . . . . . . . . . . . . . . . . . . . . . . . . . . . . . 1,905 2,367Deferred revenue . . . . . . . . . . . . . . . . . . . . . . . . . . . . . . . . . . . . . . . . . . . . . . 4,309 3,815Accrued restructuring . . . . . . . . . . . . . . . . . . . . . . . . . . . . . . . . . . . . . . . . . . . . 547 1,119Other accrued liabilities . . . . . . . . . . . . . . . . . . . . . . . . . . . . . . . . . . . . . . . . . . 11,134 9,762
Total current liabilities . . . . . . . . . . . . . . . . . . . . . . . . . . . . . . . . . . . . . . . . . 35,850 31,460
Long-term debt . . . . . . . . . . . . . . . . . . . . . . . . . . . . . . . . . . . . . . . . . . . . . . . . . . 2,490 3,392Other liabilities . . . . . . . . . . . . . . . . . . . . . . . . . . . . . . . . . . . . . . . . . . . . . . . . . . 5,497 5,289
Commitments and contingencies
Stockholders’ equity:Preferred stock, $0.01 par value (300 shares authorized; none issued) . . . . . . . . . — —Common stock, $0.01 par value (9,600 shares authorized; 2,732 and 2,837 shares
issued and outstanding, respectively) . . . . . . . . . . . . . . . . . . . . . . . . . . . . . . . 27 28Additional paid-in capital . . . . . . . . . . . . . . . . . . . . . . . . . . . . . . . . . . . . . . . . . 17,966 20,490Prepaid stock repurchase . . . . . . . . . . . . . . . . . . . . . . . . . . . . . . . . . . . . . . . . . (596) —Retained earnings . . . . . . . . . . . . . . . . . . . . . . . . . . . . . . . . . . . . . . . . . . . . . . 20,729 16,679Accumulated other comprehensive income (loss) . . . . . . . . . . . . . . . . . . . . . . . . 18 (21)
Total stockholders’ equity . . . . . . . . . . . . . . . . . . . . . . . . . . . . . . . . . . . . . . . 38,144 37,176
Total liabilities and stockholders’ equity . . . . . . . . . . . . . . . . . . . . . . . . . . . . . . . . $81,981 $77,317
The accompanying notes are an integral part of these Consolidated Financial Statements.
75
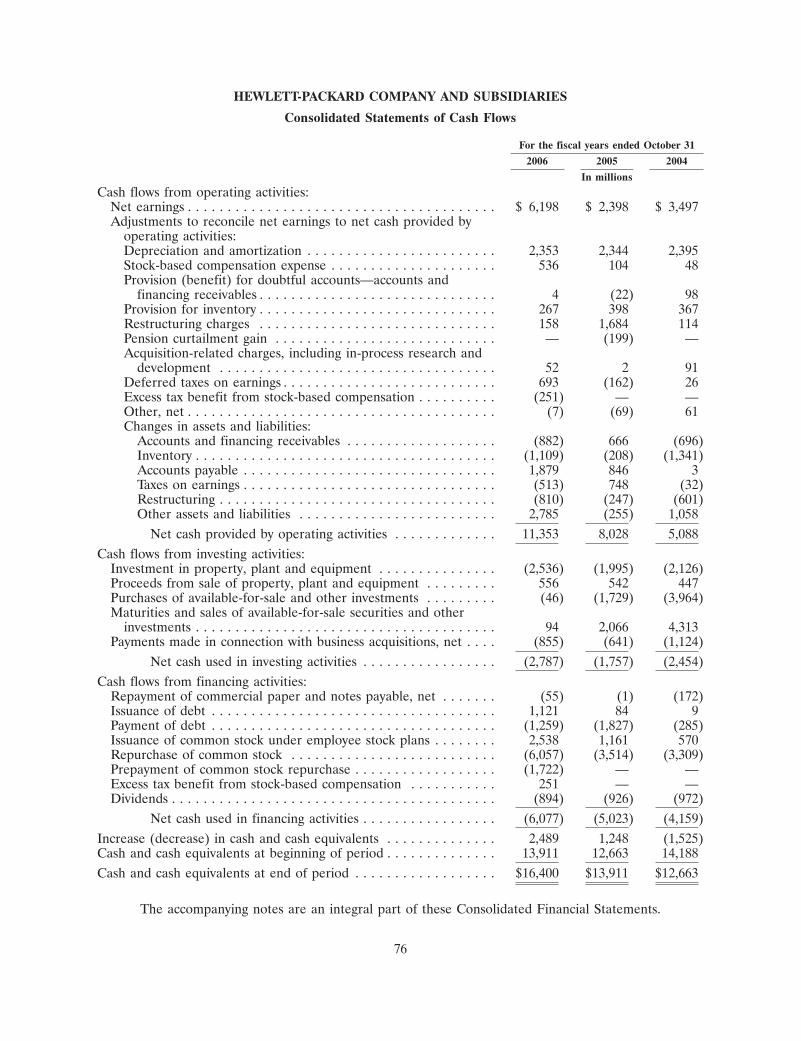
HEWLETT-PACKARD COMPANY AND SUBSIDIARIES
Consolidated Statements of Cash Flows
For the fiscal years ended October 31
2006 2005 2004
In millions
Cash flows from operating activities:Net earnings . . . . . . . . . . . . . . . . . . . . . . . . . . . . . . . . . . . . . . . $ 6,198 $ 2,398 $ 3,497Adjustments to reconcile net earnings to net cash provided by
operating activities:Depreciation and amortization . . . . . . . . . . . . . . . . . . . . . . . . 2,353 2,344 2,395Stock-based compensation expense . . . . . . . . . . . . . . . . . . . . . 536 104 48Provision (benefit) for doubtful accounts—accounts and
financing receivables . . . . . . . . . . . . . . . . . . . . . . . . . . . . . . 4 (22) 98Provision for inventory . . . . . . . . . . . . . . . . . . . . . . . . . . . . . . 267 398 367Restructuring charges . . . . . . . . . . . . . . . . . . . . . . . . . . . . . . 158 1,684 114Pension curtailment gain . . . . . . . . . . . . . . . . . . . . . . . . . . . . — (199) —Acquisition-related charges, including in-process research and
development . . . . . . . . . . . . . . . . . . . . . . . . . . . . . . . . . . . 52 2 91Deferred taxes on earnings . . . . . . . . . . . . . . . . . . . . . . . . . . . 693 (162) 26Excess tax benefit from stock-based compensation . . . . . . . . . . (251) — —Other, net . . . . . . . . . . . . . . . . . . . . . . . . . . . . . . . . . . . . . . . (7) (69) 61Changes in assets and liabilities:
Accounts and financing receivables . . . . . . . . . . . . . . . . . . . (882) 666 (696)Inventory . . . . . . . . . . . . . . . . . . . . . . . . . . . . . . . . . . . . . . (1,109) (208) (1,341)Accounts payable . . . . . . . . . . . . . . . . . . . . . . . . . . . . . . . . 1,879 846 3Taxes on earnings . . . . . . . . . . . . . . . . . . . . . . . . . . . . . . . . (513) 748 (32)Restructuring . . . . . . . . . . . . . . . . . . . . . . . . . . . . . . . . . . . (810) (247) (601)Other assets and liabilities . . . . . . . . . . . . . . . . . . . . . . . . . 2,785 (255) 1,058
Net cash provided by operating activities . . . . . . . . . . . . . 11,353 8,028 5,088Cash flows from investing activities:
Investment in property, plant and equipment . . . . . . . . . . . . . . . (2,536) (1,995) (2,126)Proceeds from sale of property, plant and equipment . . . . . . . . . 556 542 447Purchases of available-for-sale and other investments . . . . . . . . . (46) (1,729) (3,964)Maturities and sales of available-for-sale securities and other
investments . . . . . . . . . . . . . . . . . . . . . . . . . . . . . . . . . . . . . . 94 2,066 4,313Payments made in connection with business acquisitions, net . . . . (855) (641) (1,124)
Net cash used in investing activities . . . . . . . . . . . . . . . . . (2,787) (1,757) (2,454)Cash flows from financing activities:
Repayment of commercial paper and notes payable, net . . . . . . . (55) (1) (172)Issuance of debt . . . . . . . . . . . . . . . . . . . . . . . . . . . . . . . . . . . . 1,121 84 9Payment of debt . . . . . . . . . . . . . . . . . . . . . . . . . . . . . . . . . . . . (1,259) (1,827) (285)Issuance of common stock under employee stock plans . . . . . . . . 2,538 1,161 570Repurchase of common stock . . . . . . . . . . . . . . . . . . . . . . . . . . (6,057) (3,514) (3,309)Prepayment of common stock repurchase . . . . . . . . . . . . . . . . . . (1,722) — —Excess tax benefit from stock-based compensation . . . . . . . . . . . 251 — —Dividends . . . . . . . . . . . . . . . . . . . . . . . . . . . . . . . . . . . . . . . . . (894) (926) (972)
Net cash used in financing activities . . . . . . . . . . . . . . . . . (6,077) (5,023) (4,159)Increase (decrease) in cash and cash equivalents . . . . . . . . . . . . . . 2,489 1,248 (1,525)Cash and cash equivalents at beginning of period . . . . . . . . . . . . . . 13,911 12,663 14,188Cash and cash equivalents at end of period . . . . . . . . . . . . . . . . . . $16,400 $13,911 $12,663
The accompanying notes are an integral part of these Consolidated Financial Statements.
76
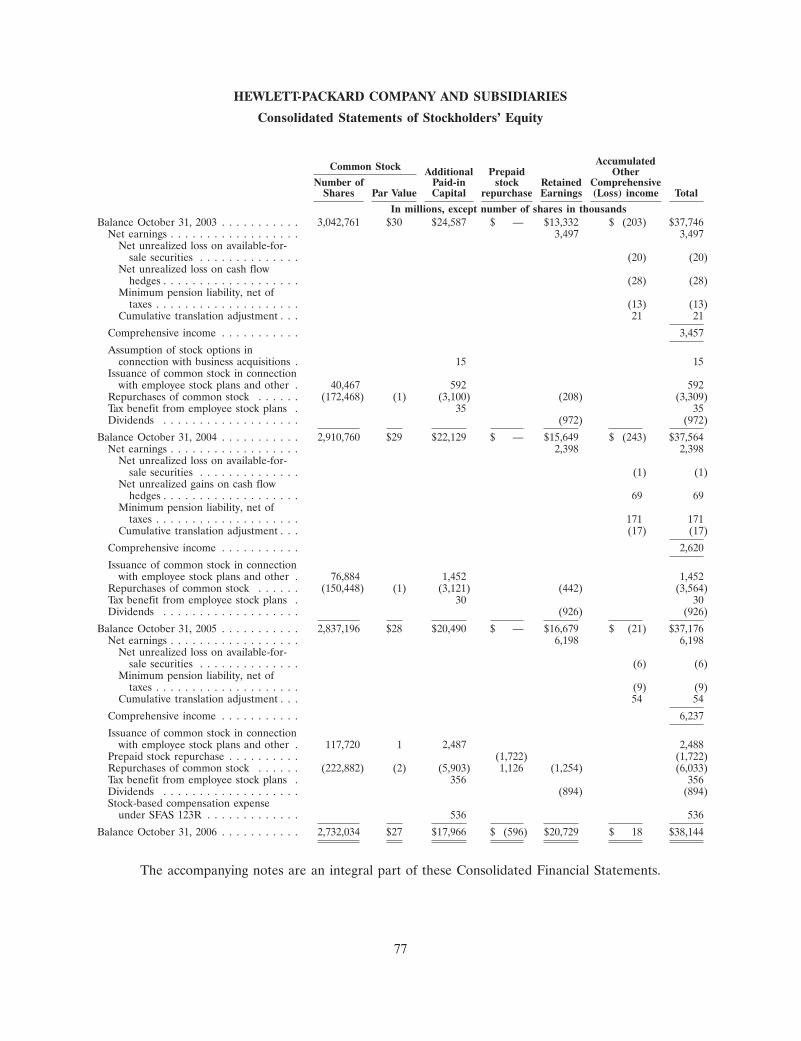
HEWLETT-PACKARD COMPANY AND SUBSIDIARIES
Consolidated Statements of Stockholders’ Equity
AccumulatedCommon Stock Additional Prepaid OtherNumber of Paid-in stock Retained Comprehensive
Shares Par Value Capital repurchase Earnings (Loss) income Total
In millions, except number of shares in thousandsBalance October 31, 2003 . . . . . . . . . . . 3,042,761 $30 $24,587 $ — $13,332 $ (203) $37,746
Net earnings . . . . . . . . . . . . . . . . . . 3,497 3,497Net unrealized loss on available-for-
sale securities . . . . . . . . . . . . . . (20) (20)Net unrealized loss on cash flow
hedges . . . . . . . . . . . . . . . . . . . (28) (28)Minimum pension liability, net of
taxes . . . . . . . . . . . . . . . . . . . . (13) (13)Cumulative translation adjustment . . . 21 21
Comprehensive income . . . . . . . . . . . 3,457
Assumption of stock options inconnection with business acquisitions . 15 15
Issuance of common stock in connectionwith employee stock plans and other . 40,467 592 592
Repurchases of common stock . . . . . . (172,468) (1) (3,100) (208) (3,309)Tax benefit from employee stock plans . 35 35Dividends . . . . . . . . . . . . . . . . . . . (972) (972)
Balance October 31, 2004 . . . . . . . . . . . 2,910,760 $29 $22,129 $ — $15,649 $ (243) $37,564Net earnings . . . . . . . . . . . . . . . . . . 2,398 2,398
Net unrealized loss on available-for-sale securities . . . . . . . . . . . . . . (1) (1)
Net unrealized gains on cash flowhedges . . . . . . . . . . . . . . . . . . . 69 69
Minimum pension liability, net oftaxes . . . . . . . . . . . . . . . . . . . . 171 171
Cumulative translation adjustment . . . (17) (17)
Comprehensive income . . . . . . . . . . . 2,620
Issuance of common stock in connectionwith employee stock plans and other . 76,884 1,452 1,452
Repurchases of common stock . . . . . . (150,448) (1) (3,121) (442) (3,564)Tax benefit from employee stock plans . 30 30Dividends . . . . . . . . . . . . . . . . . . . (926) (926)
Balance October 31, 2005 . . . . . . . . . . . 2,837,196 $28 $20,490 $ — $16,679 $ (21) $37,176Net earnings . . . . . . . . . . . . . . . . . . 6,198 6,198
Net unrealized loss on available-for-sale securities . . . . . . . . . . . . . . (6) (6)
Minimum pension liability, net oftaxes . . . . . . . . . . . . . . . . . . . . (9) (9)
Cumulative translation adjustment . . . 54 54
Comprehensive income . . . . . . . . . . . 6,237
Issuance of common stock in connectionwith employee stock plans and other . 117,720 1 2,487 2,488
Prepaid stock repurchase . . . . . . . . . . (1,722) (1,722)Repurchases of common stock . . . . . . (222,882) (2) (5,903) 1,126 (1,254) (6,033)Tax benefit from employee stock plans . 356 356Dividends . . . . . . . . . . . . . . . . . . . (894) (894)Stock-based compensation expense
under SFAS 123R . . . . . . . . . . . . . 536 536
Balance October 31, 2006 . . . . . . . . . . . 2,732,034 $27 $17,966 $ (596) $20,729 $ 18 $38,144
The accompanying notes are an integral part of these Consolidated Financial Statements.
77
HEWLETT-PACKARD COMPANY AND SUBSIDIARIES
Notes to Consolidated Financial Statements
Note 1: Summary of Significant Accounting Policies
Principles of Consolidation
The Consolidated Financial Statements include the accounts of Hewlett-Packard Company, itswholly-owned subsidiaries and its controlled majority-owned subsidiaries (collectively, ‘‘HP’’). HPaccounts for equity investments in companies over which HP has the ability to exercise significantinfluence, but does not hold a controlling interest, under the equity method, and HP records itsproportionate share of income or losses in interest and other, net in the Consolidated Statements ofEarnings. HP has eliminated all significant intercompany accounts and transactions.
Reclassifications and Segment Reorganization
HP has made certain organizational realignments in order to more closely align its financialreporting with its business structure. These realignments are immaterial in size and reflect primarilyrevenue shifts among business units within the same business segment. None of the changes impactsHP’s previously reported consolidated net revenue, earnings from operations, net earnings or netearnings per share.
HP has revised the presentation of its Consolidated Statements of Cash Flows for the fiscal yearsended October 31, 2005 and 2004 to provide improved visibility and comparability with the current yearpresentation. This change does not affect previously reported subtotals within the ConsolidatedStatements of Cash Flows, or previously reported results of operations for any period presented.
Use of Estimates
The preparation of financial statements in accordance with U.S. generally accepted accountingprinciples requires management to make estimates and assumptions that affect the amounts reported inHP’s Consolidated Financial Statements and accompanying notes. Actual results could differ materiallyfrom those estimates.
Revenue Recognition
HP recognizes revenue when persuasive evidence of a sales arrangement exists, delivery occurs orservices are rendered, the sales price or fee is fixed or determinable and collectibility is reasonablyassured. When a sales arrangement contains multiple elements, such as hardware and softwareproducts, licenses and/or services, HP allocates revenue to each element based on its relative fair value,or for software, based on vendor specific objective evidence (‘‘VSOE’’) of fair value. In the absence offair value for a delivered element, HP first allocates revenue to the fair value of the undeliveredelements and the residual revenue to the delivered elements. Where the fair value for an undeliveredelement cannot be determined, HP defers revenue for the delivered elements until the undeliveredelements are delivered. HP limits the amount of revenue recognition for delivered elements to theamount that is not contingent on the future delivery of products or services or subject to customer-specified return or refund privileges.
HP ceases revenue recognition on delinquent accounts based upon a number of factors, includingcustomer credit history, number of days past due and the terms of the customer agreement. HPresumes revenue recognition and recognizes any associated deferred revenue when appropriatecustomer actions are taken to remove accounts from delinquent status.
78
HEWLETT-PACKARD COMPANY AND SUBSIDIARIES
Notes to Consolidated Financial Statements (Continued)
Note 1: Summary of Significant Accounting Policies (Continued)
Products
Under HP’s standard terms and conditions of sale, HP transfers title and risk of loss to thecustomer at the time product is delivered to the customer and revenue is recognized accordingly, unlesscustomer acceptance is uncertain or significant obligations remain. HP reduces revenue for estimatedcustomer returns, price protection, rebates and other offerings that occur under sales programsestablished by HP directly or with HP’s distributors and resellers. HP uses the residual method toallocate revenue to software licenses at the inception of the license term when VSOE for allundelivered elements, such as Post Contract Support, exists and all other revenue recognition criteriahave been satisfied. HP records revenue from the sale of equipment under sales-type leases as productrevenue at the inception of the lease. HP accrues the estimated cost of post-sale obligations, includingbasic product warranties, based on historical experience at the time HP recognizes revenue.
Services
HP recognizes revenue from fixed-price support or maintenance contracts, including extendedwarranty contracts and software post-customer support contracts, ratably over the contract period andrecognizes the costs associated with these contracts as incurred. For time and material contracts, HPrecognizes revenue and costs as services are rendered. HP recognizes revenue from fixed-priceconsulting arrangements over the contract period on a proportional performance basis, as determinedby the relationship of actual labor costs incurred to date to the estimated total contract labor costs,with estimates regularly revised during the life of the contract. For outsourcing contracts, HPrecognizes revenue ratably over the contractual service period for fixed price contracts and on theoutput or consumption basis for all other outsourcing contracts. HP recognizes costs associated withoutsourcing contracts as incurred, unless such costs relate to the transition phase of the outsourcingcontract, in which case HP generally amortizes those costs over the contractual service period. Inaddition, under the provisions of Emerging Issues Task Force No. 00-21, ‘‘Revenue Arrangements withMultiple Deliverables,’’ if the revenue for a delivered item is not recognized because it is not separablefrom the outsourcing arrangement, then HP also defers the cost of the delivered item. HP recognizesboth the revenue and associated cost for the delivered item ratably over the remaining contractualservice period. HP recognizes losses on consulting and outsourcing arrangements in the period that thecontractual loss becomes probable and estimable. HP records amounts invoiced to customers in excessof revenue recognized as deferred revenue until the revenue recognition criteria are met. HP recordsrevenue that is earned and recognized in excess of amounts invoiced on fixed-price contracts as tradereceivables. HP recognizes revenue from operating leases on a straight-line basis as service revenueover the rental period.
Financing Income
Sales-type and direct-financing leases produce financing income, which HP recognizes at consistentrates of return over the lease term.
Shipping and Handling
HP includes costs related to shipping and handling in cost of sales for all periods presented.
Advertising
HP expenses advertising costs as incurred or when the advertising is first run. Such costs totaledapproximately $1.1 billion in fiscal 2006, $1.1 billion in fiscal 2005 and $1.2 billion in fiscal 2004.
79

HEWLETT-PACKARD COMPANY AND SUBSIDIARIES
Notes to Consolidated Financial Statements (Continued)
Note 1: Summary of Significant Accounting Policies (Continued)
Taxes on Earnings
HP recognizes deferred tax assets and liabilities for the expected tax consequences of temporarydifferences between the tax bases of assets and liabilities and their reported amounts using enacted taxrates in effect for the year the differences are expected to reverse. HP records a valuation allowance toreduce the deferred tax assets to the amount that is more likely than not to be realized.
Cash and Cash Equivalents
HP classifies investments as cash equivalents if the maturity of an investment is three months orless from the purchase date. Interest income was approximately $623 million in fiscal 2006, $424 millionin fiscal 2005 and $238 million in fiscal 2004.
Allowance for Doubtful Accounts
HP establishes an allowance for doubtful accounts to ensure trade and financing receivables arenot overstated due to uncollectibility. HP maintains bad debt reserves based on a variety of factors,including the length of time receivables are past due, trends in overall weighted average risk rating ofthe total portfolio, macroeconomic conditions, significant one-time events, historical experience and theuse of third-party credit risk models that generate quantitative measures of default probabilities basedon market factors and the financial condition of customers. HP records a specific reserve for individualaccounts when HP becomes aware of a customer’s inability to meet its financial obligations, such as inthe case of bankruptcy filings or deterioration in the customer’s operating results or financial position.If circumstances related to customers change, HP would further adjust estimates of the recoverability ofreceivables.
Inventory
HP values inventory at the lower of cost or market, with cost computed on a first-in, first-out basis.
Property, Plant and Equipment
HP states property, plant and equipment at cost less accumulated depreciation. HP capitalizesadditions, improvements and major renewals. HP expenses maintenance, repairs and minor renewals asincurred. HP provides depreciation using straight-line or accelerated methods over the estimated usefullives of the assets. Estimated useful lives are 5 to 40 years for buildings and improvements and 3 to15 years for machinery and equipment. HP depreciates leasehold improvements over the life of thelease or the asset, whichever is shorter. HP depreciates equipment held for lease over the initial termof the lease to the equipment’s estimated residual value.
Goodwill and Indefinite-Lived Purchased Intangible Assets
Statement of Financial Accounting Standards (‘‘SFAS’’) No. 142, ‘‘Goodwill and Other IntangibleAssets’’ (‘‘SFAS 142’’), prohibits the amortization of goodwill and purchased intangible assets withindefinite useful lives. HP reviews goodwill and purchased intangible assets with indefinite lives forimpairment annually at the beginning of its fourth fiscal quarter and whenever events or changes incircumstances indicate the carrying value of an asset may not be recoverable in accordance withSFAS 142. For goodwill, HP performs a two-step impairment test. In the first step, HP compares thefair value of each reporting unit to its carrying value. HP determines the fair value of its reportingunits based on a weighting of income and market approaches. Under the income approach, HPcalculates the fair value of a reporting unit based on the present value of estimated future cash flows.
80
HEWLETT-PACKARD COMPANY AND SUBSIDIARIES
Notes to Consolidated Financial Statements (Continued)
Note 1: Summary of Significant Accounting Policies (Continued)
Under the market approach, HP estimates the fair value based on market multiples of revenue orearnings for comparable companies. If the fair value of the reporting unit exceeds the carrying value ofthe net assets assigned to that unit, goodwill is not impaired and no further testing is performed. If thecarrying value of the net assets assigned to the reporting unit exceeds the fair value of the reportingunit, then HP must perform the second step of the impairment test in order to determine the impliedfair value of the reporting unit’s goodwill. If the carrying value of a reporting unit’s goodwill exceeds itsimplied fair value, HP records an impairment loss equal to the difference.
SFAS 142 also requires that the fair value of the indefinite-lived purchased intangible assets beestimated and compared to the carrying value. HP estimates the fair value of these intangible assetsusing an income approach. HP recognizes an impairment loss when the estimated fair value of theindefinite-lived purchased intangible assets is less than the carrying value.
Long-Lived Assets Including Finite-Lived Purchased Intangible Assets
HP amortizes purchased intangible assets with finite lives using the straight-line method over theestimated economic lives of the assets, ranging from one to ten years.
HP evaluates long-lived assets, such as property, plant and equipment and purchased intangibleassets with finite lives, for impairment whenever events or changes in circumstances indicate thecarrying value of an asset may not be recoverable in accordance with SFAS No. 144, ‘‘Accounting forthe Impairment or Disposal of Long-Lived Assets.’’ HP assesses the fair value of the assets based onthe undiscounted future cash flow the assets are expected to generate and recognizes an impairmentloss when estimated undiscounted future cash flow expected to result from the use of the asset plus netproceeds expected from disposition of the asset, if any, are less than the carrying value of the asset.When HP identifies an impairment, HP reduces the carrying amount of the asset to its estimated fairvalue based on a discounted cash flow approach or, when available and appropriate, to comparablemarket values.
Capitalized Software
HP capitalizes certain internal and external costs incurred to acquire or create internal usesoftware, principally related to software coding, designing system interfaces and installation and testingof the software. HP amortizes capitalized costs using the straight-line method over the estimated usefullives of the software, generally from one to three years.
Derivative Financial Instruments
HP uses derivative financial instruments, primarily forwards, swaps, and options, to hedge certainforeign currency and interest rate exposures. HP also may use other derivative instruments notdesignated as hedges such as forwards used to hedge foreign currency balance sheet exposures. HPdoes not use derivative financial instruments for speculative purposes. See Note 9 for a full descriptionof HP’s derivative financial instrument activities and related accounting policies, which is incorporatedherein by reference.
Investments
HP’s investments consist principally of time deposits, other debt securities, money market securitiesand equity securities of publicly-traded and privately-held companies. HP classifies investments withmaturities of less than one year as short-term investments.
81
HEWLETT-PACKARD COMPANY AND SUBSIDIARIES
Notes to Consolidated Financial Statements (Continued)
Note 1: Summary of Significant Accounting Policies (Continued)
HP classifies its investments in debt securities and its equity investments in public companies asavailable-for-sale securities and carries them at fair value. HP determines fair values for investments inpublic companies using quoted market prices. HP records the unrealized gains and losses onavailable-for-sale securities, net of taxes, in accumulated other comprehensive income (loss).
HP carries equity investments in privately-held companies at the lower of cost or fair value. HPmay estimate fair values for investments in privately-held companies based upon one or more of thefollowing: pricing models using historical and forecasted financial information and current market rates;liquidation values; the values of recent rounds of financing; and quoted market prices of comparablepublic companies.
Losses on Investments
HP monitors its investment portfolio for impairment on a periodic basis. In the event that thecarrying value of an investment exceeds its fair value and the decline in value is determined to beother-than-temporary, HP records an impairment charge and establishes a new cost basis for theinvestment at its current fair value. In order to determine whether a decline in value isother-than-temporary, HP evaluates, among other factors: the duration and extent to which the fairvalue has been less than the carrying value; the financial condition of and business outlook for thecompany, including key operational and cash flow metrics, current market conditions and future trendsin the company’s industry; the company’s relative competitive position within the industry; and HP’sintent and ability to retain the investment for a period of time sufficient to allow for any anticipatedrecovery in fair value.
HP determined the declines in value of certain investments to be other-than-temporary.Accordingly, HP recorded impairments of approximately $8 million in fiscal 2006, $43 million in fiscal2005 and $26 million in fiscal 2004. HP includes these impairments in gains/(losses) on investments inthe Consolidated Statements of Earnings. Depending on market conditions, HP may record additionalimpairments on its investment portfolio in the future.
Concentrations of Credit Risk
Financial instruments that potentially subject HP to significant concentrations of credit risk consistprincipally of cash and cash equivalents, investments, accounts receivable from trade customers andfrom contract manufacturers, financing receivables and derivatives.
HP maintains cash and cash equivalents, short and long-term investments, derivatives and certainother financial instruments with various financial institutions. These financial institutions are located inmany different geographical regions and HP’s policy is designed to limit exposure with any oneinstitution. As part of its cash and risk management processes, HP performs periodic evaluations of therelative credit standing of the financial institutions. HP has not sustained material credit losses frominstruments held at financial institutions. HP utilizes forward contracts and other derivative contracts toprotect against the effects of foreign currency fluctuations. Such contracts involve the risk ofnon-performance by the counterparty, which could result in a material loss.
HP sells a significant portion of its products through third-party distributors and resellers and, as aresult, maintains individually significant receivable balances with these parties. If the financial conditionor operations of these distributors and resellers deteriorate substantially, HP’s operating results couldbe adversely affected. The ten largest distributor and reseller receivable balances collectively, whichwere concentrated primarily in North America, represented approximately 21% of gross accounts
82
HEWLETT-PACKARD COMPANY AND SUBSIDIARIES
Notes to Consolidated Financial Statements (Continued)
Note 1: Summary of Significant Accounting Policies (Continued)
receivable at October 31, 2006 and 22% at October 31, 2005. No single customer accounts for morethan 10% of accounts receivable. Credit risk with respect to other accounts receivable and financingreceivables is generally diversified due to the large number of entities comprising HP’s customer baseand their dispersion across many different industries and geographical regions. HP performs ongoingcredit evaluations of the financial condition of its third-party distributors, resellers and other customersand requires collateral, such as letters of credit and bank guarantees, in certain circumstances. HPgenerally has experienced longer accounts receivable collection cycles in its emerging markets, inparticular Asia Pacific and Latin America, compared to its United States and European markets. In theevent that accounts receivable collection cycles in emerging markets significantly deteriorate or one ormore of HP’s larger resellers in these regions fail, HP’s operating results could be adversely affected.
Other Concentration
HP obtains a significant number of components from single source suppliers due to technology,availability, price, quality or other considerations. The loss of a single source supplier, the deteriorationof its relationship with a single source supplier, or any unilateral modification to the contractual termsunder which HP is supplied components by a single source supplier could adversely effect HP’s revenueand gross margins.
Stock-Based Compensation
Effective November 1, 2005, HP adopted the fair value recognition provisions of SFAS No. 123(revised 2004), ‘‘Share-Based Payment’’ (‘‘SFAS 123R’’), using the modified prospective transitionmethod and therefore has not restated results for prior periods. Under this transition method, stock-based compensation expense in fiscal 2006 included stock-based compensation expense for all share-based payment awards granted prior to, but not yet vested as of November 1, 2005, based on thegrant-date fair value estimated in accordance with the original provision of SFAS No. 123, ‘‘Accountingfor Stock-Based Compensation’’ (‘‘SFAS 123’’). Stock-based compensation expense for all share-basedpayment awards granted after November 1, 2005 is based on the grant-date fair value estimated inaccordance with the provisions of SFAS 123R. HP recognizes these compensation costs on astraight-line basis over the requisite service period of the award, which is generally the option vestingterm of four years. Prior to the adoption of SFAS 123R, HP recognized stock-based compensationexpense in accordance with Accounting Principles Board (‘‘APB’’) Opinion No. 25, ‘‘Accounting forStock Issued to Employees’’ (‘‘APB 25’’). In March 2005, the Securities and Exchange Commission (the‘‘SEC’’) issued Staff Accounting Bulletin No. 107 (‘‘SAB 107’’) regarding the SEC’s interpretation ofSFAS 123R and the valuation of share-based payments for public companies. HP has applied theprovisions of SAB 107 in its adoption of SFAS 123R.
In November 2005, the Financial Accounting Standards Board (‘‘FASB’’) issued FASB StaffPosition (‘‘FSP’’) No. FAS 123(R)-3, ‘‘Transition Election Related to Accounting for Tax Effects ofShare-Based Payment Awards’’ (‘‘FSP 123R-3’’). HP has elected to adopt the alternative transitionmethod provided in the FSP 123R-3 for calculating the tax effects of stock-based compensationpursuant to SFAS 123R. The alternative transition method includes simplified methods to establish thebeginning balance of the additional paid-in capital pool (‘‘APIC pool’’) related to the tax effects ofemployee stock-based compensation, and to determine the subsequent impact on the APIC pool andConsolidated Statements of Cash Flows of the tax effects of employee stock-based compensationawards that are outstanding upon adoption of SFAS 123R. See Note 2 to the Consolidated FinancialStatements for a further discussion on stock-based compensation.
83
HEWLETT-PACKARD COMPANY AND SUBSIDIARIES
Notes to Consolidated Financial Statements (Continued)
Note 1: Summary of Significant Accounting Policies (Continued)
Foreign Currency Transactions
HP uses the U.S. dollar predominately as its functional currency. Assets and liabilitiesdenominated in non-U.S. dollars are remeasured into U.S. dollars at current exchange rates formonetary assets and liabilities, and historical exchange rates for nonmonetary assets and liabilities. Netrevenue, cost of sales and expenses are remeasured at average exchange rates in effect during eachperiod, except for those net revenue, cost of sales and expenses related to the previously noted balancesheet amounts, which HP remeasures at historical exchange rates. HP includes gains or losses fromforeign currency remeasurement in net earnings. Certain foreign subsidiaries designate the localcurrency as their functional currency, and HP records the translation of their assets and liabilities intoU.S. dollars at the balance sheet dates as translation adjustments and includes them as a component ofaccumulated other comprehensive income (loss).
Retirement and Post-Retirement Plans
HP has various defined benefit, other contributory and noncontributory retirement andpost-retirement plans. HP generally amortizes unrecognized actuarial gains and losses on a straight-linebasis over the remaining estimated service life of participants. The measurement date for all plans isSeptember 30 for fiscal 2006 and fiscal 2005. See Note 15 for a full description of these plans and theaccounting and funding policies, which is incorporated herein by reference.
Recent Pronouncements
In May 2005, FASB issued SFAS No. 154, ‘‘Accounting Changes and Error Corrections’’(‘‘SFAS 154’’), which replaces APB Opinion No. 20 ‘‘Accounting Changes’’ and SFAS No. 3, ‘‘ReportingAccounting Changes in Interim Financial Statements—An Amendment of APB Opinion No. 28.’’SFAS 154 provides guidance on the accounting for and reporting of accounting changes and errorcorrections. It establishes retrospective application, or the latest practicable date, as the requiredmethod for reporting a change in accounting principle and the reporting of a correction of an error.SFAS 154 is effective for accounting changes and corrections of errors made in fiscal years beginningafter December 15, 2005 and is required to be adopted by HP in the first quarter of fiscal 2007. HP iscurrently evaluating the effect that the adoption of SFAS 154 will have on its consolidated results ofoperations and financial condition but does not expect it to have a material impact.
In July 2006, the FASB issued FASB Interpretation No. 48, ‘‘Accounting for Uncertainty in IncomeTaxes, an interpretation of FASB Statement No. 109’’ (‘‘FIN 48’’). FIN 48 clarifies the accounting foruncertainty in income taxes by prescribing the recognition threshold a tax position is required to meetbefore being recognized in the financial statements. It also provides guidance on derecognition,classification, interest and penalties, accounting in interim periods, disclosure, and transition. FIN 48 iseffective for fiscal years beginning after December 15, 2006 and is required to be adopted by HP in thefirst quarter of fiscal 2008. The cumulative effects, if any, of applying FIN 48 will be recorded as anadjustment to retained earnings as of the beginning of the period of adoption. HP is currentlyevaluating the effect that the adoption of FIN 48 will have on its consolidated results of operations andfinancial condition and is not yet in a position to determine such effects.
In September 2006, the FASB issued SFAS No. 157, ‘‘Fair Value Measurements’’ (‘‘SFAS 157’’).SFAS 157 provides guidance for using fair value to measure assets and liabilities. It also responds toinvestors’ requests for expanded information about the extent to which companies measure assets andliabilities at fair value, the information used to measure fair value, and the effect of fair valuemeasurements on earnings. SFAS 157 applies whenever other standards require (or permit) assets or
84
HEWLETT-PACKARD COMPANY AND SUBSIDIARIES
Notes to Consolidated Financial Statements (Continued)
Note 1: Summary of Significant Accounting Policies (Continued)
liabilities to be measured at fair value, and does not expand the use of fair value in any newcircumstances. SFAS 157 is effective for financial statements issued for fiscal years beginning afterNovember 15, 2007 and is required to be adopted by HP in the first quarter of fiscal 2009. HP iscurrently evaluating the effect that the adoption of SFAS 157 will have on its consolidated results ofoperations and financial condition and is not yet in a position to determine such effects.
In September 2006, the FASB issued SFAS No. 158, ‘‘Employers’ Accounting for Defined BenefitPension and Other Postretirement Plans—An Amendment of FASB No. 87, 88, 106 and 132(R)’’(‘‘SFAS 158’’). SFAS 158 requires that the funded status of defined benefit postretirement plans berecognized on the company’s balance sheet, and changes in the funded status be reflected incomprehensive income, effective fiscal years ending after December 15, 2006, which HP expects toadopt effective October 31, 2007. SFAS also requires companies to measure the funded status of theplan as of the date of its fiscal year-end, effective for fiscal years ending after December 15, 2008. HPexpects to adopt the measurement provisions of SFAS 158 effective October 31, 2009. Based upon theOctober 31, 2006 balance sheet and pension disclosures, the impact of adopting SFAS 158 is estimatedto be a decrease in assets of $821 million, a decrease in liabilities of $4 million and a pretax increase inthe accumulated other comprehensive loss of $817 million. The effect of adoption will differ from theestimate due to actual plan asset and liability experience in fiscal 2007.
In September 2006, the SEC issued SAB No. 108, ‘‘Considering the Effects of Prior YearMisstatements when Quantifying Misstatements in Current Year Financial Statements’’ (‘‘SAB 108’’).SAB 108 provides guidance on the consideration of the effects of prior year misstatements inquantifying current year misstatements for the purpose of a materiality assessment. SAB 108 establishesan approach that requires quantification of financial statement errors based on the effects of each ofthe company’s balance sheet and statement of operations and the related financial statementdisclosures. Early application of the guidance in SAB 108 is encouraged in any report for an interimperiod of the first fiscal year ending after November 15, 2006, and will be adopted by HP in the firstquarter of fiscal 2007. HP does not expect the adoption of SAB 108 to have a material impact on itsconsolidated results of operations and financial condition.
In addition, HP is reviewing the following Emerging Issues Task Force (‘‘EITF’’) consensuses anddoes not currently expect that the adoption of these will have a material impact on its consolidatedresults of operations and financial condition:
• EITF 05-5, ‘‘Accounting for Early Retirement or Postemployment Programs with SpecificFeatures (Such as Terms Specified in Altersteilzeit Early Retirement Arrangements.’’ Issued inJune 2005 and effective for HP in the first quarter of fiscal 2007, this EITF applies to earlyretirement programs which create incentives for employees, within a specific age group, totransition from full or part-time employment to retirement before legal retirement age.
• EITF 06-2, ‘‘Accounting for Sabbatical Leave and Other Similar Benefits.’’ Issued in June 2006and effective for HP in the first quarter of fiscal 2008, this EITF applies to compensatedabsences that require a minimum service period but have no increase in the benefit even withadditional years of service.
• EITF 06-9, ‘‘Reporting a Change in (or the Elimination of) a Previously Existing Differencebetween the Fiscal Year End of a Parent Company and That of a Consolidated Entity orbetween the Reporting Period of an Investor and That of an Equity Method Investee.’’ Issued inNovember 2006 and effective for HP in the second quarter of fiscal 2008, this EITF requirescertain disclosures whenever a change is made to modify or eliminate the time lag (usually three
85

HEWLETT-PACKARD COMPANY AND SUBSIDIARIES
Notes to Consolidated Financial Statements (Continued)
Note 1: Summary of Significant Accounting Policies (Continued)
months or less) used for recording results of consolidated entities or equity method investeesthat have a different fiscal year end than HP’s.
In fiscal 2006, HP adopted FSP No. FAS 115-1 and FAS 124-1, ‘‘The Meaning of Other-Than-Temporary Impairment and Its Application to Certain Investments’’ (‘‘FSP 115-1’’). This adoption didnot have a material impact on HP’s consolidated results of operations and financial condition.
Note 2: Stock-Based Compensation
At October 31, 2006, HP has the stock-based employee compensation plans described below. Thetotal compensation expense before taxes related to these plans was $536 million in fiscal 2006,excluding a $14 million credit adjustment in restructuring charges as disclosed below. Prior toNovember 1, 2005, HP accounted for those plans under the recognition and measurement provisions ofAPB 25. Accordingly, HP generally recognized compensation expense only when it granted options witha discounted exercise price. Any resulting compensation expense was recognized ratably over theassociated service period, which was generally the option vesting term.
Prior to November 1, 2005, HP provided pro forma disclosure amounts in accordance with SFASNo. 148, ‘‘Accounting for Stock-Based Compensation—Transition and Disclosure’’ (‘‘SFAS 148’’), as ifthe fair value method defined by SFAS 123 had been applied to its stock-based compensation.
Effective November 1, 2005, HP adopted the fair value recognition provisions of SFAS 123R, usingthe modified prospective transition method and therefore has not restated prior periods’ results. Underthis transition method, stock-based compensation expense in fiscal 2006 included compensation expensefor all share-based payment awards granted prior to, but not yet vested as of, November 1, 2005, basedon the grant-date fair value estimated in accordance with the original provisions of SFAS 123. Stock-based compensation expense for all share-based payment awards granted after November 1, 2005 isbased on the grant-date fair value estimated in accordance with the provisions of SFAS 123R. HPrecognizes these compensation costs net of an estimated forfeiture rate and recognizes thecompensation costs for only those shares expected to vest on a straight-line basis over the requisiteservice period of the award, which is generally the option vesting term of four years. HP estimated theforfeiture rate in fiscal 2006 based on its historical experience for fiscal grant years where the majorityof the vesting terms have been satisfied.
As a result of adopting SFAS 123R, earnings before income taxes in fiscal 2006 and net earnings infiscal 2006 were lower by $448 million and $318 million, respectively, than if we had continued toaccount for stock-based compensation under APB 25. The impact on both basic and diluted earningsper share in fiscal 2006 was $0.11 per share. In addition, prior to the adoption of SFAS 123R, HPpresented the tax benefit of stock option exercises as operating cash flows. Upon the adoption ofSFAS 123R, the tax benefit resulting from tax deductions in excess of the tax benefit related tocompensation cost recognized for those options are classified as financing cash flows.
86
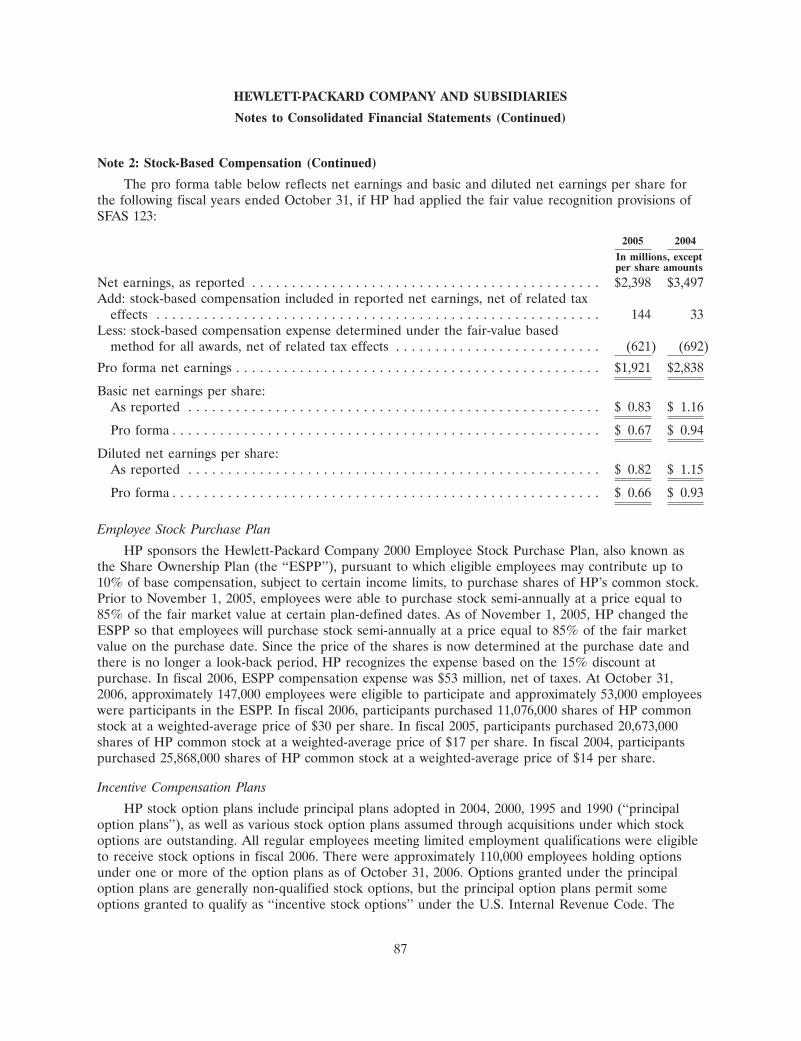
HEWLETT-PACKARD COMPANY AND SUBSIDIARIES
Notes to Consolidated Financial Statements (Continued)
Note 2: Stock-Based Compensation (Continued)
The pro forma table below reflects net earnings and basic and diluted net earnings per share forthe following fiscal years ended October 31, if HP had applied the fair value recognition provisions ofSFAS 123:
2005 2004
In millions, exceptper share amounts
Net earnings, as reported . . . . . . . . . . . . . . . . . . . . . . . . . . . . . . . . . . . . . . . . . . . . $2,398 $3,497Add: stock-based compensation included in reported net earnings, net of related tax
effects . . . . . . . . . . . . . . . . . . . . . . . . . . . . . . . . . . . . . . . . . . . . . . . . . . . . . . . . 144 33Less: stock-based compensation expense determined under the fair-value based
method for all awards, net of related tax effects . . . . . . . . . . . . . . . . . . . . . . . . . . (621) (692)
Pro forma net earnings . . . . . . . . . . . . . . . . . . . . . . . . . . . . . . . . . . . . . . . . . . . . . . $1,921 $2,838
Basic net earnings per share:As reported . . . . . . . . . . . . . . . . . . . . . . . . . . . . . . . . . . . . . . . . . . . . . . . . . . . . $ 0.83 $ 1.16
Pro forma . . . . . . . . . . . . . . . . . . . . . . . . . . . . . . . . . . . . . . . . . . . . . . . . . . . . . . $ 0.67 $ 0.94
Diluted net earnings per share:As reported . . . . . . . . . . . . . . . . . . . . . . . . . . . . . . . . . . . . . . . . . . . . . . . . . . . . $ 0.82 $ 1.15
Pro forma . . . . . . . . . . . . . . . . . . . . . . . . . . . . . . . . . . . . . . . . . . . . . . . . . . . . . . $ 0.66 $ 0.93
Employee Stock Purchase Plan
HP sponsors the Hewlett-Packard Company 2000 Employee Stock Purchase Plan, also known asthe Share Ownership Plan (the ‘‘ESPP’’), pursuant to which eligible employees may contribute up to10% of base compensation, subject to certain income limits, to purchase shares of HP’s common stock.Prior to November 1, 2005, employees were able to purchase stock semi-annually at a price equal to85% of the fair market value at certain plan-defined dates. As of November 1, 2005, HP changed theESPP so that employees will purchase stock semi-annually at a price equal to 85% of the fair marketvalue on the purchase date. Since the price of the shares is now determined at the purchase date andthere is no longer a look-back period, HP recognizes the expense based on the 15% discount atpurchase. In fiscal 2006, ESPP compensation expense was $53 million, net of taxes. At October 31,2006, approximately 147,000 employees were eligible to participate and approximately 53,000 employeeswere participants in the ESPP. In fiscal 2006, participants purchased 11,076,000 shares of HP commonstock at a weighted-average price of $30 per share. In fiscal 2005, participants purchased 20,673,000shares of HP common stock at a weighted-average price of $17 per share. In fiscal 2004, participantspurchased 25,868,000 shares of HP common stock at a weighted-average price of $14 per share.
Incentive Compensation Plans
HP stock option plans include principal plans adopted in 2004, 2000, 1995 and 1990 (‘‘principaloption plans’’), as well as various stock option plans assumed through acquisitions under which stockoptions are outstanding. All regular employees meeting limited employment qualifications were eligibleto receive stock options in fiscal 2006. There were approximately 110,000 employees holding optionsunder one or more of the option plans as of October 31, 2006. Options granted under the principaloption plans are generally non-qualified stock options, but the principal option plans permit someoptions granted to qualify as ‘‘incentive stock options’’ under the U.S. Internal Revenue Code. The
87

HEWLETT-PACKARD COMPANY AND SUBSIDIARIES
Notes to Consolidated Financial Statements (Continued)
Note 2: Stock-Based Compensation (Continued)
exercise price of a stock option is equal to the fair market value of HP’s common stock on the optiongrant date (as determined by the average of the highest and lowest reported sale prices of HP’scommon stock on that date). The contractual term of options granted since fiscal 2003 was generallyeight years, while the contractual term of options granted prior to fiscal 2003 was generally ten years.Under the principal option plans, HP may choose, in certain cases, to establish a discounted exerciseprice at no less than 75% of fair market value on the grant date. HP has not granted any discountedoptions since fiscal 2003.
Under the principal option plans, HP granted certain employees cash, restricted stock awards, orboth. Restricted stock awards are nonvested stock awards that may include grants of restricted stock orgrants of restricted stock units. Cash and restricted stock awards are independent of option grants andare generally subject to forfeiture if employment terminates prior to the release of the restrictions.Such awards generally vest one to three years from the date of grant. During that period, ownership ofthe shares cannot be transferred. Restricted stock has the same cash dividend and voting rights as othercommon stock and is considered to be currently issued and outstanding. Restricted stock units havedividend equivalent rights equal to the cash dividend paid on restricted stock. Restricted stock units donot have the voting rights of common stock, and the shares underlying the restricted stock units are notconsidered issued and outstanding. HP expenses the cost of the restricted stock awards, which HP hasdetermined to be the fair market value of the shares at the date of grant, ratably over the periodduring which the restrictions lapse. In fiscal 2006, HP granted 1,492,000 shares of restricted stock witha weighted-average grant date fair value of $32. In fiscal 2005, HP granted 6,773,000 shares ofrestricted stock with a weighted-average grant date fair value of $21. HP had 5,492,000 shares ofrestricted stock outstanding at October 31, 2006, 7,099,000 shares of restricted stock outstanding atOctober 31, 2005 and 1,533,000 shares of restricted stock outstanding at October 31, 2004. In fiscal2006, HP granted 33,000 shares of restricted stock units with a weighted-average grant date fair valueof $30. In fiscal 2005, HP granted 1,820,000 shares of restricted stock units with a weighted-averagegrant date fair value of $21. HP had restricted stock units covering 873,000 shares outstanding atOctober 31, 2006, 1,780,000 shares outstanding at October 31, 2005 and no shares outstanding atOctober 31, 2004.
In light of new accounting guidance under SFAS 123R, beginning in the second quarter of fiscal2005 HP reevaluated its assumptions used in estimating the fair value of employee options granted. Aspart of this assessment, management determined that implied volatility calculated based on activelytraded options on HP common stock is a better indicator of expected volatility and future stock pricetrends than historical volatility. Therefore, expected volatility in fiscal 2006 and 2005 was based on amarket-based implied volatility.
As part of its SFAS 123R adoption, HP also examined its historical pattern of option exercises inan effort to determine if there were any discernable activity patterns based on certain employeepopulations. From this analysis, HP identified three employee populations. HP used the Black-Scholesoption pricing model to value the options for each of the employee populations. The table belowpresents the weighted average expected life in months of the combined three identified employeepopulations. The expected life computation is based on historical exercise patterns and post-vestingtermination behavior within each of the three populations identified. The risk-free interest rate forperiods within the contractual life of the award is based on the U.S. Treasury yield curve in effect atthe time of grant.
88
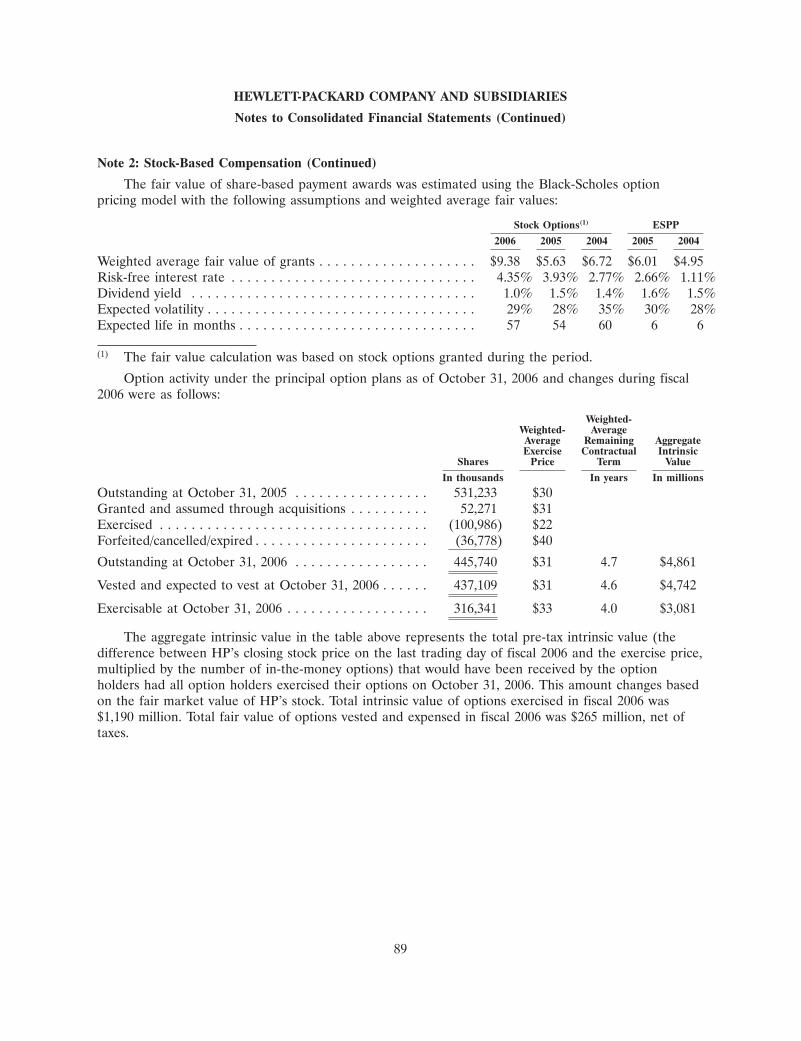
HEWLETT-PACKARD COMPANY AND SUBSIDIARIES
Notes to Consolidated Financial Statements (Continued)
Note 2: Stock-Based Compensation (Continued)
The fair value of share-based payment awards was estimated using the Black-Scholes optionpricing model with the following assumptions and weighted average fair values:
Stock Options(1) ESPP
2006 2005 2004 2005 2004
Weighted average fair value of grants . . . . . . . . . . . . . . . . . . . . $9.38 $5.63 $6.72 $6.01 $4.95Risk-free interest rate . . . . . . . . . . . . . . . . . . . . . . . . . . . . . . . 4.35% 3.93% 2.77% 2.66% 1.11%Dividend yield . . . . . . . . . . . . . . . . . . . . . . . . . . . . . . . . . . . . 1.0% 1.5% 1.4% 1.6% 1.5%Expected volatility . . . . . . . . . . . . . . . . . . . . . . . . . . . . . . . . . . 29% 28% 35% 30% 28%Expected life in months . . . . . . . . . . . . . . . . . . . . . . . . . . . . . . 57 54 60 6 6
(1) The fair value calculation was based on stock options granted during the period.
Option activity under the principal option plans as of October 31, 2006 and changes during fiscal2006 were as follows:
Weighted-Weighted- AverageAverage Remaining AggregateExercise Contractual Intrinsic
Shares Price Term Value
In thousands In years In millions
Outstanding at October 31, 2005 . . . . . . . . . . . . . . . . . 531,233 $30Granted and assumed through acquisitions . . . . . . . . . . 52,271 $31Exercised . . . . . . . . . . . . . . . . . . . . . . . . . . . . . . . . . . (100,986) $22Forfeited/cancelled/expired . . . . . . . . . . . . . . . . . . . . . . (36,778) $40
Outstanding at October 31, 2006 . . . . . . . . . . . . . . . . . 445,740 $31 4.7 $4,861
Vested and expected to vest at October 31, 2006 . . . . . . 437,109 $31 4.6 $4,742
Exercisable at October 31, 2006 . . . . . . . . . . . . . . . . . . 316,341 $33 4.0 $3,081
The aggregate intrinsic value in the table above represents the total pre-tax intrinsic value (thedifference between HP’s closing stock price on the last trading day of fiscal 2006 and the exercise price,multiplied by the number of in-the-money options) that would have been received by the optionholders had all option holders exercised their options on October 31, 2006. This amount changes basedon the fair market value of HP’s stock. Total intrinsic value of options exercised in fiscal 2006 was$1,190 million. Total fair value of options vested and expensed in fiscal 2006 was $265 million, net oftaxes.
89
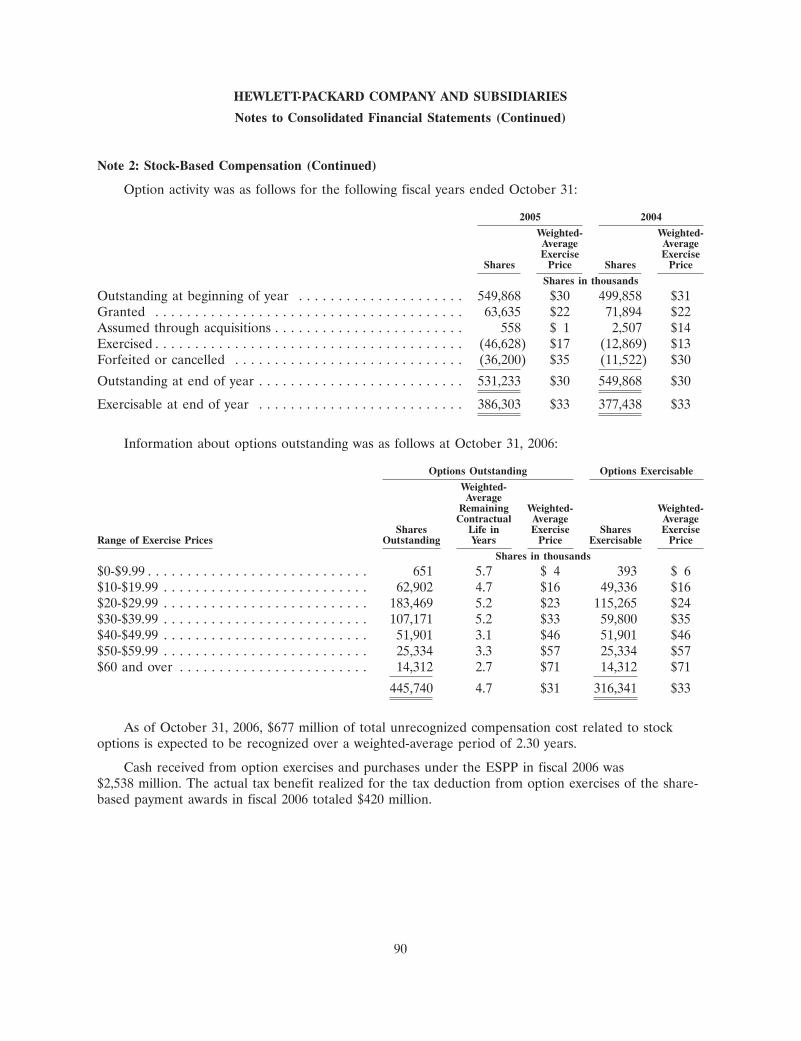
HEWLETT-PACKARD COMPANY AND SUBSIDIARIES
Notes to Consolidated Financial Statements (Continued)
Note 2: Stock-Based Compensation (Continued)
Option activity was as follows for the following fiscal years ended October 31:
2005 2004
Weighted- Weighted-Average AverageExercise Exercise
Shares Price Shares Price
Shares in thousands
Outstanding at beginning of year . . . . . . . . . . . . . . . . . . . . . 549,868 $30 499,858 $31Granted . . . . . . . . . . . . . . . . . . . . . . . . . . . . . . . . . . . . . . . 63,635 $22 71,894 $22Assumed through acquisitions . . . . . . . . . . . . . . . . . . . . . . . . 558 $ 1 2,507 $14Exercised . . . . . . . . . . . . . . . . . . . . . . . . . . . . . . . . . . . . . . . (46,628) $17 (12,869) $13Forfeited or cancelled . . . . . . . . . . . . . . . . . . . . . . . . . . . . . (36,200) $35 (11,522) $30
Outstanding at end of year . . . . . . . . . . . . . . . . . . . . . . . . . . 531,233 $30 549,868 $30
Exercisable at end of year . . . . . . . . . . . . . . . . . . . . . . . . . . 386,303 $33 377,438 $33
Information about options outstanding was as follows at October 31, 2006:
Options Outstanding Options Exercisable
Weighted-Average
Remaining Weighted- Weighted-Contractual Average Average
Shares Life in Exercise Shares ExerciseRange of Exercise Prices Outstanding Years Price Exercisable Price
Shares in thousands
$0-$9.99 . . . . . . . . . . . . . . . . . . . . . . . . . . . . 651 5.7 $ 4 393 $ 6$10-$19.99 . . . . . . . . . . . . . . . . . . . . . . . . . . 62,902 4.7 $16 49,336 $16$20-$29.99 . . . . . . . . . . . . . . . . . . . . . . . . . . 183,469 5.2 $23 115,265 $24$30-$39.99 . . . . . . . . . . . . . . . . . . . . . . . . . . 107,171 5.2 $33 59,800 $35$40-$49.99 . . . . . . . . . . . . . . . . . . . . . . . . . . 51,901 3.1 $46 51,901 $46$50-$59.99 . . . . . . . . . . . . . . . . . . . . . . . . . . 25,334 3.3 $57 25,334 $57$60 and over . . . . . . . . . . . . . . . . . . . . . . . . 14,312 2.7 $71 14,312 $71
445,740 4.7 $31 316,341 $33
As of October 31, 2006, $677 million of total unrecognized compensation cost related to stockoptions is expected to be recognized over a weighted-average period of 2.30 years.
Cash received from option exercises and purchases under the ESPP in fiscal 2006 was$2,538 million. The actual tax benefit realized for the tax deduction from option exercises of the share-based payment awards in fiscal 2006 totaled $420 million.
90

HEWLETT-PACKARD COMPANY AND SUBSIDIARIES
Notes to Consolidated Financial Statements (Continued)
Note 2: Stock-Based Compensation (Continued)
Nonvested restricted stock awards as of October 31, 2006 and changes during fiscal 2006 were asfollows:
Weighted-Average Grant
Shares Date Fair Value
In thousands
Nonvested at October 31, 2005 . . . . . . . . . . . . . . . . . . . . . . . . . . . . . . . 8,869 $21Granted . . . . . . . . . . . . . . . . . . . . . . . . . . . . . . . . . . . . . . . . . . . . . . . . 1,525 $32Vested . . . . . . . . . . . . . . . . . . . . . . . . . . . . . . . . . . . . . . . . . . . . . . . . . (2,521) $21Forfeited . . . . . . . . . . . . . . . . . . . . . . . . . . . . . . . . . . . . . . . . . . . . . . . (1,508) $21
Nonvested at October 31, 2006 . . . . . . . . . . . . . . . . . . . . . . . . . . . . . . . 6,365 $24
As of October 31, 2006, there was $90 million of unrecognized stock-based compensation expenserelated to nonvested restricted stock awards. That cost is expected to be recognized over a weighted-average period of 1.46 years.
In fiscal 2006, HP recorded $58 million of stock-based compensation expense, net of taxes, relatingto options assumed through acquisitions and restricted stock awards. HP recorded $144 million and$33 million of stock-based compensation expense, net of taxes, relating to options assumed throughacquisitions and restricted stock awards in fiscal years 2005 and 2004, respectively.
In fiscal 2006, HP allocated stock-based compensation expense related to the ESPP and theprincipal option plans under SFAS 123R as follows:
In millions
Cost of sales . . . . . . . . . . . . . . . . . . . . . . . . . . . . . . . . . . . . . . . . . . . . . . . . . . $ 144Research and development . . . . . . . . . . . . . . . . . . . . . . . . . . . . . . . . . . . . . . . . 70Selling, general and administrative . . . . . . . . . . . . . . . . . . . . . . . . . . . . . . . . . . 322
Stock-based compensation expense before income taxes . . . . . . . . . . . . . . . . . . . 536Income tax benefit . . . . . . . . . . . . . . . . . . . . . . . . . . . . . . . . . . . . . . . . . . . . . . (160)
Total stock-based compensation expense after income taxes . . . . . . . . . . . . . . . . $ 376
In addition, as part of its fiscal 2005 restructuring plans, HP accelerated the vesting on optionsheld by terminated employees and included a one-year post-termination exercise period on the options.This modification resulted in compensation expense of $107 million that HP included in therestructuring charges. In fiscal 2006, an adjustment of $14 million was recorded as a reduction to the$107 million restructuring charges to reflect actual stock-based compensation expense related toemployees who left the company.
Stock-based compensation expense recognized under incentive compensation plans wasapproximately $522 million in fiscal 2006 (including the $14 million credit in restructuring chargesreferred to above), $211 million in fiscal 2005 (including the $107 million in restructuring chargesreferred to above), and $48 million in fiscal 2004.
91
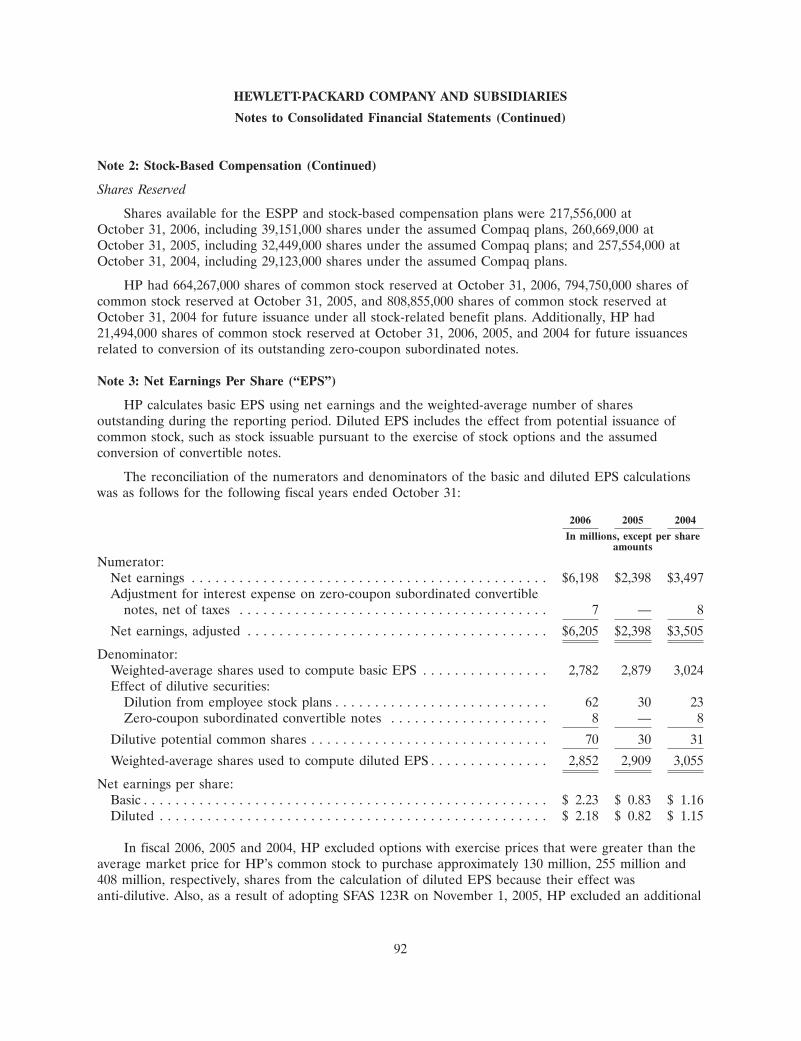
HEWLETT-PACKARD COMPANY AND SUBSIDIARIES
Notes to Consolidated Financial Statements (Continued)
Note 2: Stock-Based Compensation (Continued)
Shares Reserved
Shares available for the ESPP and stock-based compensation plans were 217,556,000 atOctober 31, 2006, including 39,151,000 shares under the assumed Compaq plans, 260,669,000 atOctober 31, 2005, including 32,449,000 shares under the assumed Compaq plans; and 257,554,000 atOctober 31, 2004, including 29,123,000 shares under the assumed Compaq plans.
HP had 664,267,000 shares of common stock reserved at October 31, 2006, 794,750,000 shares ofcommon stock reserved at October 31, 2005, and 808,855,000 shares of common stock reserved atOctober 31, 2004 for future issuance under all stock-related benefit plans. Additionally, HP had21,494,000 shares of common stock reserved at October 31, 2006, 2005, and 2004 for future issuancesrelated to conversion of its outstanding zero-coupon subordinated notes.
Note 3: Net Earnings Per Share (‘‘EPS’’)
HP calculates basic EPS using net earnings and the weighted-average number of sharesoutstanding during the reporting period. Diluted EPS includes the effect from potential issuance ofcommon stock, such as stock issuable pursuant to the exercise of stock options and the assumedconversion of convertible notes.
The reconciliation of the numerators and denominators of the basic and diluted EPS calculationswas as follows for the following fiscal years ended October 31:
2006 2005 2004
In millions, except per shareamounts
Numerator:Net earnings . . . . . . . . . . . . . . . . . . . . . . . . . . . . . . . . . . . . . . . . . . . . . $6,198 $2,398 $3,497Adjustment for interest expense on zero-coupon subordinated convertible
notes, net of taxes . . . . . . . . . . . . . . . . . . . . . . . . . . . . . . . . . . . . . . . 7 — 8
Net earnings, adjusted . . . . . . . . . . . . . . . . . . . . . . . . . . . . . . . . . . . . . . $6,205 $2,398 $3,505
Denominator:Weighted-average shares used to compute basic EPS . . . . . . . . . . . . . . . . 2,782 2,879 3,024Effect of dilutive securities:
Dilution from employee stock plans . . . . . . . . . . . . . . . . . . . . . . . . . . . 62 30 23Zero-coupon subordinated convertible notes . . . . . . . . . . . . . . . . . . . . 8 — 8
Dilutive potential common shares . . . . . . . . . . . . . . . . . . . . . . . . . . . . . . 70 30 31
Weighted-average shares used to compute diluted EPS . . . . . . . . . . . . . . . 2,852 2,909 3,055
Net earnings per share:Basic . . . . . . . . . . . . . . . . . . . . . . . . . . . . . . . . . . . . . . . . . . . . . . . . . . . $ 2.23 $ 0.83 $ 1.16Diluted . . . . . . . . . . . . . . . . . . . . . . . . . . . . . . . . . . . . . . . . . . . . . . . . . $ 2.18 $ 0.82 $ 1.15
In fiscal 2006, 2005 and 2004, HP excluded options with exercise prices that were greater than theaverage market price for HP’s common stock to purchase approximately 130 million, 255 million and408 million, respectively, shares from the calculation of diluted EPS because their effect wasanti-dilutive. Also, as a result of adopting SFAS 123R on November 1, 2005, HP excluded an additional
92
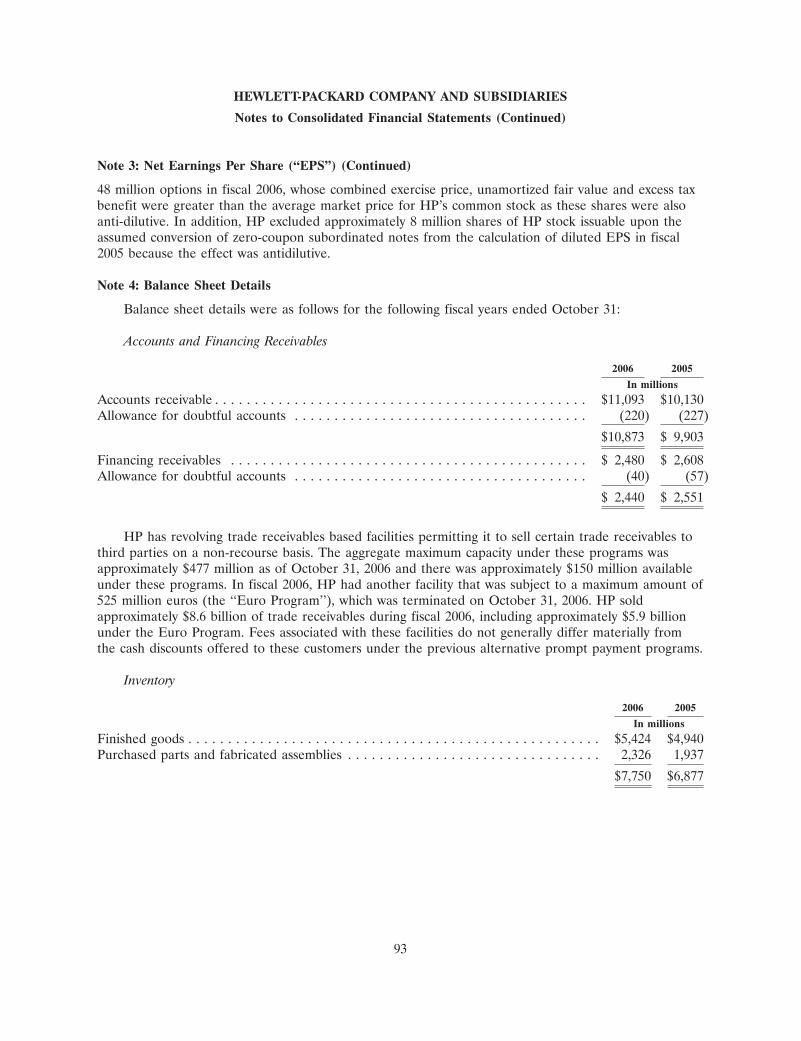
HEWLETT-PACKARD COMPANY AND SUBSIDIARIES
Notes to Consolidated Financial Statements (Continued)
Note 3: Net Earnings Per Share (‘‘EPS’’) (Continued)
48 million options in fiscal 2006, whose combined exercise price, unamortized fair value and excess taxbenefit were greater than the average market price for HP’s common stock as these shares were alsoanti-dilutive. In addition, HP excluded approximately 8 million shares of HP stock issuable upon theassumed conversion of zero-coupon subordinated notes from the calculation of diluted EPS in fiscal2005 because the effect was antidilutive.
Note 4: Balance Sheet Details
Balance sheet details were as follows for the following fiscal years ended October 31:
Accounts and Financing Receivables
2006 2005
In millions
Accounts receivable . . . . . . . . . . . . . . . . . . . . . . . . . . . . . . . . . . . . . . . . . . . . . . . $11,093 $10,130Allowance for doubtful accounts . . . . . . . . . . . . . . . . . . . . . . . . . . . . . . . . . . . . . (220) (227)
$10,873 $ 9,903
Financing receivables . . . . . . . . . . . . . . . . . . . . . . . . . . . . . . . . . . . . . . . . . . . . . $ 2,480 $ 2,608Allowance for doubtful accounts . . . . . . . . . . . . . . . . . . . . . . . . . . . . . . . . . . . . . (40) (57)
$ 2,440 $ 2,551
HP has revolving trade receivables based facilities permitting it to sell certain trade receivables tothird parties on a non-recourse basis. The aggregate maximum capacity under these programs wasapproximately $477 million as of October 31, 2006 and there was approximately $150 million availableunder these programs. In fiscal 2006, HP had another facility that was subject to a maximum amount of525 million euros (the ‘‘Euro Program’’), which was terminated on October 31, 2006. HP soldapproximately $8.6 billion of trade receivables during fiscal 2006, including approximately $5.9 billionunder the Euro Program. Fees associated with these facilities do not generally differ materially fromthe cash discounts offered to these customers under the previous alternative prompt payment programs.
Inventory
2006 2005
In millions
Finished goods . . . . . . . . . . . . . . . . . . . . . . . . . . . . . . . . . . . . . . . . . . . . . . . . . . . . $5,424 $4,940Purchased parts and fabricated assemblies . . . . . . . . . . . . . . . . . . . . . . . . . . . . . . . . 2,326 1,937
$7,750 $6,877
93

HEWLETT-PACKARD COMPANY AND SUBSIDIARIES
Notes to Consolidated Financial Statements (Continued)
Note 4: Balance Sheet Details (Continued)
Other Current Assets
2006 2005
In millions
Deferred tax assets—short-term . . . . . . . . . . . . . . . . . . . . . . . . . . . . . . . . . . . . . . $ 4,144 $ 3,612Tax, supplier and other receivables . . . . . . . . . . . . . . . . . . . . . . . . . . . . . . . . . . . . 5,242 4,910Prepaid and other current assets . . . . . . . . . . . . . . . . . . . . . . . . . . . . . . . . . . . . . 1,393 1,552
$10,779 $10,074
Property, Plant and Equipment
2006 2005
In millions
Land . . . . . . . . . . . . . . . . . . . . . . . . . . . . . . . . . . . . . . . . . . . . . . . . . . . . . . . . . $ 534 $ 629Buildings and leasehold improvements . . . . . . . . . . . . . . . . . . . . . . . . . . . . . . . . . 5,771 5,630Machinery and equipment . . . . . . . . . . . . . . . . . . . . . . . . . . . . . . . . . . . . . . . . . . 8,719 7,621
15,024 13,880Accumulated depreciation . . . . . . . . . . . . . . . . . . . . . . . . . . . . . . . . . . . . . . . . . . (8,161) (7,429)
$ 6,863 $ 6,451
Depreciation expense was approximately $1.7 billion in fiscal 2006, $1.7 billion in fiscal 2005 and$1.8 billion in fiscal 2004.
Long-Term Financing Receivables and Other Assets
2006 2005
In millions
Financing receivables . . . . . . . . . . . . . . . . . . . . . . . . . . . . . . . . . . . . . . . . . . . . . . . $2,340 $2,246Deferred tax assets—long-term . . . . . . . . . . . . . . . . . . . . . . . . . . . . . . . . . . . . . . . . 1,475 2,263Other . . . . . . . . . . . . . . . . . . . . . . . . . . . . . . . . . . . . . . . . . . . . . . . . . . . . . . . . . . 2,834 2,993
$6,649 $7,502
Other Accrued Liabilities
2006 2005
In millions
Other accrued taxes . . . . . . . . . . . . . . . . . . . . . . . . . . . . . . . . . . . . . . . . . . . . . . . $ 2,366 $2,018Warranty . . . . . . . . . . . . . . . . . . . . . . . . . . . . . . . . . . . . . . . . . . . . . . . . . . . . . . . 1,585 1,563Sales and marketing programs . . . . . . . . . . . . . . . . . . . . . . . . . . . . . . . . . . . . . . . . 2,394 2,036Other . . . . . . . . . . . . . . . . . . . . . . . . . . . . . . . . . . . . . . . . . . . . . . . . . . . . . . . . . . 4,789 4,145
$11,134 $9,762
94
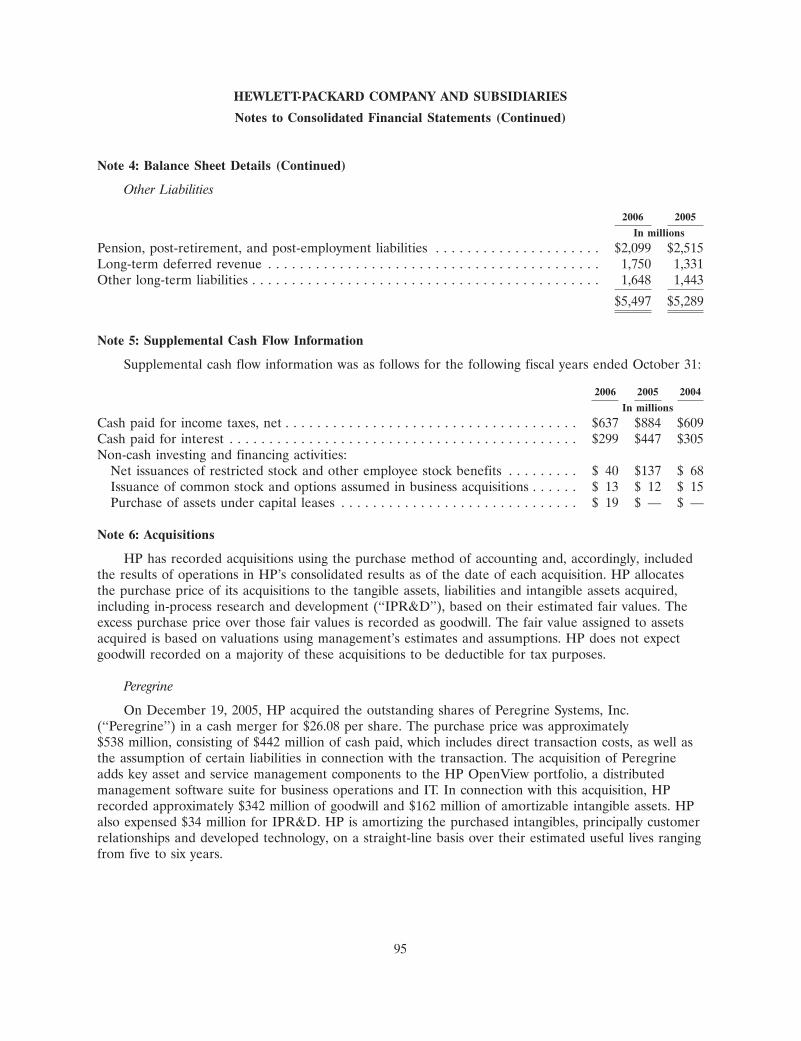
HEWLETT-PACKARD COMPANY AND SUBSIDIARIES
Notes to Consolidated Financial Statements (Continued)
Note 4: Balance Sheet Details (Continued)
Other Liabilities
2006 2005
In millions
Pension, post-retirement, and post-employment liabilities . . . . . . . . . . . . . . . . . . . . . $2,099 $2,515Long-term deferred revenue . . . . . . . . . . . . . . . . . . . . . . . . . . . . . . . . . . . . . . . . . . 1,750 1,331Other long-term liabilities . . . . . . . . . . . . . . . . . . . . . . . . . . . . . . . . . . . . . . . . . . . . 1,648 1,443
$5,497 $5,289
Note 5: Supplemental Cash Flow Information
Supplemental cash flow information was as follows for the following fiscal years ended October 31:
2006 2005 2004
In millions
Cash paid for income taxes, net . . . . . . . . . . . . . . . . . . . . . . . . . . . . . . . . . . . . . $637 $884 $609Cash paid for interest . . . . . . . . . . . . . . . . . . . . . . . . . . . . . . . . . . . . . . . . . . . . $299 $447 $305Non-cash investing and financing activities:
Net issuances of restricted stock and other employee stock benefits . . . . . . . . . $ 40 $137 $ 68Issuance of common stock and options assumed in business acquisitions . . . . . . $ 13 $ 12 $ 15Purchase of assets under capital leases . . . . . . . . . . . . . . . . . . . . . . . . . . . . . . $ 19 $ — $ —
Note 6: Acquisitions
HP has recorded acquisitions using the purchase method of accounting and, accordingly, includedthe results of operations in HP’s consolidated results as of the date of each acquisition. HP allocatesthe purchase price of its acquisitions to the tangible assets, liabilities and intangible assets acquired,including in-process research and development (‘‘IPR&D’’), based on their estimated fair values. Theexcess purchase price over those fair values is recorded as goodwill. The fair value assigned to assetsacquired is based on valuations using management’s estimates and assumptions. HP does not expectgoodwill recorded on a majority of these acquisitions to be deductible for tax purposes.
Peregrine
On December 19, 2005, HP acquired the outstanding shares of Peregrine Systems, Inc.(‘‘Peregrine’’) in a cash merger for $26.08 per share. The purchase price was approximately$538 million, consisting of $442 million of cash paid, which includes direct transaction costs, as well asthe assumption of certain liabilities in connection with the transaction. The acquisition of Peregrineadds key asset and service management components to the HP OpenView portfolio, a distributedmanagement software suite for business operations and IT. In connection with this acquisition, HPrecorded approximately $342 million of goodwill and $162 million of amortizable intangible assets. HPalso expensed $34 million for IPR&D. HP is amortizing the purchased intangibles, principally customerrelationships and developed technology, on a straight-line basis over their estimated useful lives rangingfrom five to six years.
95
HEWLETT-PACKARD COMPANY AND SUBSIDIARIES
Notes to Consolidated Financial Statements (Continued)
Note 6: Acquisitions (Continued)
Other Acquisitions in fiscal 2006
HP also completed seven other acquisitions during fiscal 2006. Total consideration for theseacquisitions and the buyout of a minority interest was approximately $473 million, which included directtransaction costs. The largest of these transactions was the acquisition of substantially all of the assetsof Scitex Vision Ltd (‘‘Scitex’’). The Scitex asset acquisition is expected to expand HP’s leadership inprinting into the industrial wide-format market.
HP recorded approximately $193 million of goodwill and $205 million of purchased intangibles inconnection with these other acquisitions. HP also recorded approximately $18 million of IPR&Drelated to these acquisitions in fiscal 2006.
In addition, HP paid approximately $17 million for the balance of the outstanding shares of DigitalGlobalsoft Limited, a consolidated subsidiary of HP (‘‘DGS’’), and as a result increased HP’s ownershipfrom 98.5% to 100%. This subsidiary has enhanced HP’s capability in IT services, including expertise inlife cycle services such as migration, technical and application services.
HP has included the results of operations of these transactions prospectively from the respectivedate of the transaction. HP has not presented the pro forma results of operations of the acquiredbusinesses because the results are not material to HP’s results of operations on either an individual oran aggregate basis.
Mercury Acquisition
On November 2, 2006, HP completed its tender offer for Mercury Interactive Corporation(‘‘Mercury’’), a leading IT management software and services company, and acquired approximately96% of Mercury shares for cash consideration of $52 per common share. On November 6, 2006, HPacquired the remaining outstanding shares, and Mercury became a wholly owned subsidiary of HP. Theaggregate purchase price was approximately $4.8 billion, consisting of cash paid for outstanding stock,the value of vested employee stock options and estimated direct transaction costs. The acquisition willcombine Mercury’s application management, application delivery and IT governance capabilities withHP’s broad portfolio of management solutions.
The acquisition will be recorded using the purchase method of accounting, and, accordingly, theresults of operations will be included in HP’s consolidated results as of the acquisition date. Thepurchase price will be allocated to the tangible assets, liabilities and intangible assets acquired based ontheir estimated fair values. These fair values will be determined based on independent third-partyvaluations and management estimates which have not yet been completed. The excess purchase priceover those fair values will be recorded as goodwill. The goodwill will not be deductible for taxpurposes. The intangible assets consist primarily of developed and core technologies, customerrelationships, maintenance agreements and IPR&D. The IPR&D will be expensed in the first quarterof fiscal year 2007. The remaining intangibles will be amortized over their estimated useful lives,currently estimated to range from three to seven years. Pro forma results of operations have not beenpresented as these results are not material to HP’s consolidated results of operations.
Management is currently assessing and formulating product roadmap decisions and integrationplans which may result in additional costs, including asset impairments and costs to terminate orrelocate employees. Exit costs related to Mercury activities and employees will be accrued by HP as aliability in conjunction with recording the purchase of Mercury, which will result in an increase to
96
HEWLETT-PACKARD COMPANY AND SUBSIDIARIES
Notes to Consolidated Financial Statements (Continued)
Note 6: Acquisitions (Continued)
goodwill. In addition, HP will incur charges related to payments to Mercury executive officers and keyemployees under a retention plan adopted in connection with the acquisition, as well as costs related tointegration efforts.
Pending Acquisitions
In December 2006, HP agreed to acquire Knightsbridge Solutions Holdings Corporation, aprivately held services company specializing in the information management areas of businessintelligence, data warehousing, data integration and information quality. The transaction is subject tocertain closing conditions and is expected to be completed during the first quarter of fiscal 2007. Uponcompletion, the business is expected to be fully integrated into HP Services.
Also in December 2006, HP agreed to acquire Bitfone Corporation, a privately held globalsoftware and services company that develops software solutions for mobile device management for thewireless industry. The transaction is subject to certain closing conditions and is expected to becompleted by February 2007. Following the close of the acquisition, the business is expected to be fullyintegrated into the Handheld Business Unit of HP’s Personal Systems Group.
Acquisitions in fiscal 2005
In fiscal 2005, HP acquired five companies for an aggregate purchase price of approximately$648 million, which includes direct transaction costs and certain liabilities recorded in connection withthese acquisitions. The largest of these transactions were the acquisitions of SAC, LLC, doing businessas ‘‘Snapfish,’’ and AppIQ, Inc. (‘‘AppIQ’’), which HP completed on April 15, 2005 and October 24,2005, respectively.
Snapfish is a leading online photo service. The acquisition of Snapfish enables HP to capitalize onthe growing market for online photo printing, with customers benefiting from a more affordable,simpler and more comprehensive digital photography experience.
AppIQ is a leading provider of open storage area network management and storage resourcemanagement solutions. The acquisition of AppIQ strengthens HP’s ability to give customers a singleintegrated console that controls and better manages their storage and server infrastructure.
HP recorded approximately $537 million of goodwill and $108 million of amortizable purchasedintangible assets in connection with these five acquisitions. HP also recorded approximately $2 millionof IPR&D charges related to these five acquisitions.
In fiscal 2005, HP paid approximately $8 million in cash for additional shares of DGS, aconsolidated subsidiary of HP, to increase HP’s ownership from approximately 97.2% to approximately98.5%. HP recorded approximately $7 million and $281 million of goodwill in connection with theshare purchases in fiscal 2005 and 2004, respectively.
97

HEWLETT-PACKARD COMPANY AND SUBSIDIARIES
Notes to Consolidated Financial Statements (Continued)
Note 7: Goodwill and Purchased Intangible Assets
Goodwill
Goodwill allocated to HP’s business segments as of October 31, 2006 and 2005 and changes in thecarrying amount of goodwill during the fiscal year ended October 31, 2006 are as follows:
Enterprise ImagingStorage Personal and HP
HP and Systems Printing FinancialServices Servers Software Group Group Services Total
In millions
Balance at October 31, 2005 . . . . . . . . . . . . $6,360 $5,077 $ 748 $2,335 $1,769 $152 $16,441Goodwill acquired during the period . . . . . . 16 65 354 7 93 — 535Goodwill adjustments . . . . . . . . . . . . . . . . . (37) (51) (4) (20) (9) (2) (123)
Balance at October 31, 2006 . . . . . . . . . . . . $6,339 $5,091 $1,098 $2,322 $1,853 $150 $16,853
The goodwill adjustments for acquisitions made prior to fiscal 2006, as shown above, relatedprimarily to revisions of acquisition-related tax and other estimates for all acquisitions and thereduction of a restructuring liability associated with restructuring plans of Compaq ComputerCorporation (‘‘Compaq’’) prior to its acquisition by HP. These reductions resulted from adjustingoriginal estimates to actual costs incurred at various locations throughout the world.
Based on the results of its annual impairment tests, HP determined that no impairment ofgoodwill existed as of August 1, 2006 or August 1, 2005. However, future goodwill impairment testscould result in a charge to earnings. HP will continue to evaluate goodwill on an annual basis as of thebeginning of its fourth fiscal quarter and whenever events and changes in circumstances indicate thatthere may be a potential impairment.
Purchased Intangible Assets
HP’s purchased intangible assets associated with completed acquisitions for each of the followingfiscal years ended October 31 are composed of:
2006 2005
Accumulated AccumulatedGross Amortization Net Gross Amortization Net
In millions
Customer contracts, customer lists anddistribution agreements . . . . . . . . . . . . . . . . . . $2,586 $(1,293) $1,293 $2,401 $ (972) $1,429
Developed and core technology and patents . . . . 1,923 (1,307) 616 1,750 (1,040) 710Product trademarks . . . . . . . . . . . . . . . . . . . . . . 103 (82) 21 94 (66) 28
Total amortizable purchased intangible assets . . . 4,612 (2,682) 1,930 4,245 (2,078) 2,167Compaq trade name . . . . . . . . . . . . . . . . . . . . . 1,422 — 1,422 1,422 — 1,422
Total purchased intangible assets . . . . . . . . . . . . $6,034 $(2,682) $3,352 $5,667 $(2,078) $3,589
Amortization expense related to finite-lived purchased intangible assets was approximately$604 million in fiscal 2006, $622 million in fiscal 2005 and $603 million in fiscal 2004.
98
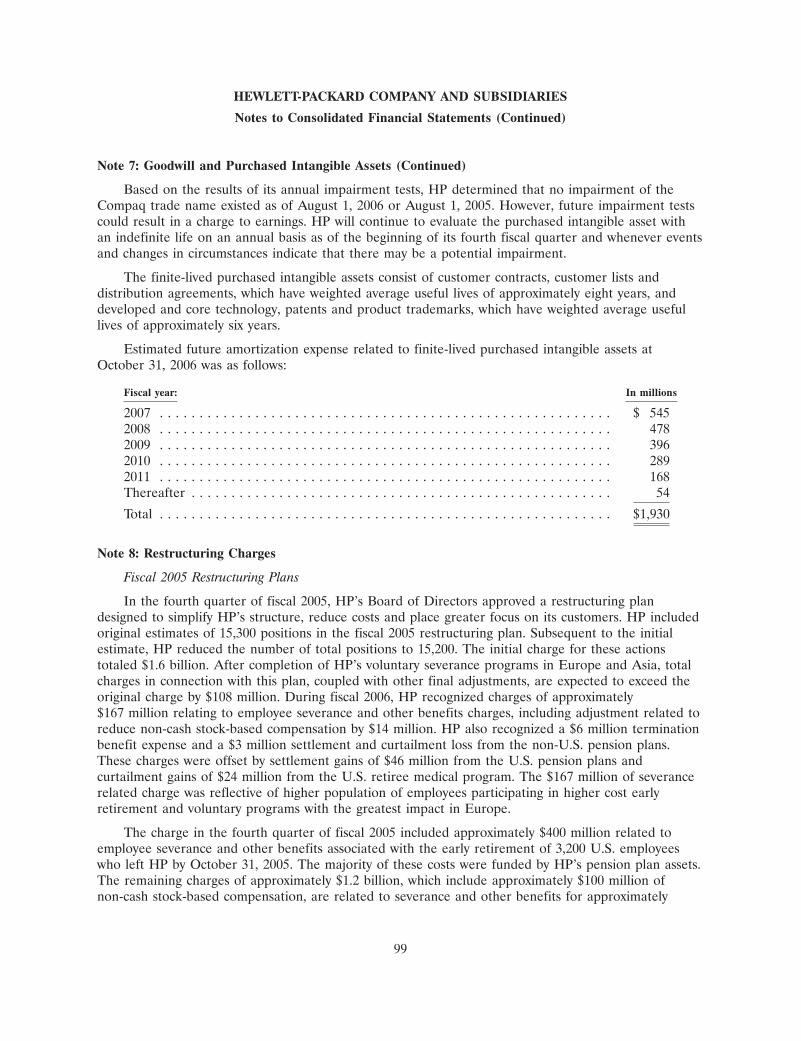
HEWLETT-PACKARD COMPANY AND SUBSIDIARIES
Notes to Consolidated Financial Statements (Continued)
Note 7: Goodwill and Purchased Intangible Assets (Continued)
Based on the results of its annual impairment tests, HP determined that no impairment of theCompaq trade name existed as of August 1, 2006 or August 1, 2005. However, future impairment testscould result in a charge to earnings. HP will continue to evaluate the purchased intangible asset withan indefinite life on an annual basis as of the beginning of its fourth fiscal quarter and whenever eventsand changes in circumstances indicate that there may be a potential impairment.
The finite-lived purchased intangible assets consist of customer contracts, customer lists anddistribution agreements, which have weighted average useful lives of approximately eight years, anddeveloped and core technology, patents and product trademarks, which have weighted average usefullives of approximately six years.
Estimated future amortization expense related to finite-lived purchased intangible assets atOctober 31, 2006 was as follows:
Fiscal year: In millions
2007 . . . . . . . . . . . . . . . . . . . . . . . . . . . . . . . . . . . . . . . . . . . . . . . . . . . . . . . . . $ 5452008 . . . . . . . . . . . . . . . . . . . . . . . . . . . . . . . . . . . . . . . . . . . . . . . . . . . . . . . . . 4782009 . . . . . . . . . . . . . . . . . . . . . . . . . . . . . . . . . . . . . . . . . . . . . . . . . . . . . . . . . 3962010 . . . . . . . . . . . . . . . . . . . . . . . . . . . . . . . . . . . . . . . . . . . . . . . . . . . . . . . . . 2892011 . . . . . . . . . . . . . . . . . . . . . . . . . . . . . . . . . . . . . . . . . . . . . . . . . . . . . . . . . 168Thereafter . . . . . . . . . . . . . . . . . . . . . . . . . . . . . . . . . . . . . . . . . . . . . . . . . . . . . 54
Total . . . . . . . . . . . . . . . . . . . . . . . . . . . . . . . . . . . . . . . . . . . . . . . . . . . . . . . . . $1,930
Note 8: Restructuring Charges
Fiscal 2005 Restructuring Plans
In the fourth quarter of fiscal 2005, HP’s Board of Directors approved a restructuring plandesigned to simplify HP’s structure, reduce costs and place greater focus on its customers. HP includedoriginal estimates of 15,300 positions in the fiscal 2005 restructuring plan. Subsequent to the initialestimate, HP reduced the number of total positions to 15,200. The initial charge for these actionstotaled $1.6 billion. After completion of HP’s voluntary severance programs in Europe and Asia, totalcharges in connection with this plan, coupled with other final adjustments, are expected to exceed theoriginal charge by $108 million. During fiscal 2006, HP recognized charges of approximately$167 million relating to employee severance and other benefits charges, including adjustment related toreduce non-cash stock-based compensation by $14 million. HP also recognized a $6 million terminationbenefit expense and a $3 million settlement and curtailment loss from the non-U.S. pension plans.These charges were offset by settlement gains of $46 million from the U.S. pension plans andcurtailment gains of $24 million from the U.S. retiree medical program. The $167 million of severancerelated charge was reflective of higher population of employees participating in higher cost earlyretirement and voluntary programs with the greatest impact in Europe.
The charge in the fourth quarter of fiscal 2005 included approximately $400 million related toemployee severance and other benefits associated with the early retirement of 3,200 U.S. employeeswho left HP by October 31, 2005. The majority of these costs were funded by HP’s pension plan assets.The remaining charges of approximately $1.2 billion, which include approximately $100 million ofnon-cash stock-based compensation, are related to severance and other benefits for approximately
99

HEWLETT-PACKARD COMPANY AND SUBSIDIARIES
Notes to Consolidated Financial Statements (Continued)
Note 8: Restructuring Charges (Continued)
12,000 employees. Pursuant to the plan, approximately 9,500 positions were eliminated during fiscal2006, bringing the total to 14,200 as of October 31, 2006. The majority of the remaining 1,000 positionsare expected to be eliminated during fiscal 2007. HP expects to pay out the majority of the remainingcosts relating to severance and other employee benefits before the end of fiscal 2007.
In the third quarter of fiscal 2005, HP’s management approved a restructuring plan and HPrecorded restructuring charges of $109 million related to severance and related costs associated withthe termination of approximately 1,450 employees, all of whom left HP as of October 31, 2005. Of theinitial restructuring amount, HP has paid substantially all of it as of October 31, 2006.
Fiscal 2005 Workforce Rebalancing
In addition to the restructuring activities described above, HP incurred approximately $236 millionfor the six months ended April 30, 2005 in workforce rebalancing charges within certain businesssegments, primarily for severance and related costs. As a result of these workforce rebalancing actions,approximately 3,000 employees left HP as of October 31, 2005. Of the initial restructuring amount, HPhas paid substantially all of it as of October 31, 2006.
Fiscal 2003 Restructuring Plans
During fiscal 2006, HP recorded adjustments of $4 million in additional restructuring charges. Ofthe initial restructuring amount of $752 million, HP has paid substantially all of it as of October 31,2006.
Fiscal 2002 and 2001 Restructuring Plans
The 2002 and 2001 restructuring plans are substantially complete, although HP records minorrevisions to previous estimates as necessary. During fiscal 2006, HP recorded additional adjustments of$48 million. These charges pertained to facility lease obligations and severance. In addition, anadjustment during fiscal 2006 includes a $25 million reduction of goodwill pertaining to severance andother related restructuring true-ups. The aggregate $103 million restructuring liability with respect tothese plans as of October 31, 2006 relates primarily to facility lease obligations and severance. HPexpects to pay out these obligations over the life of the related obligations, which extend to the end offiscal 2010.
100
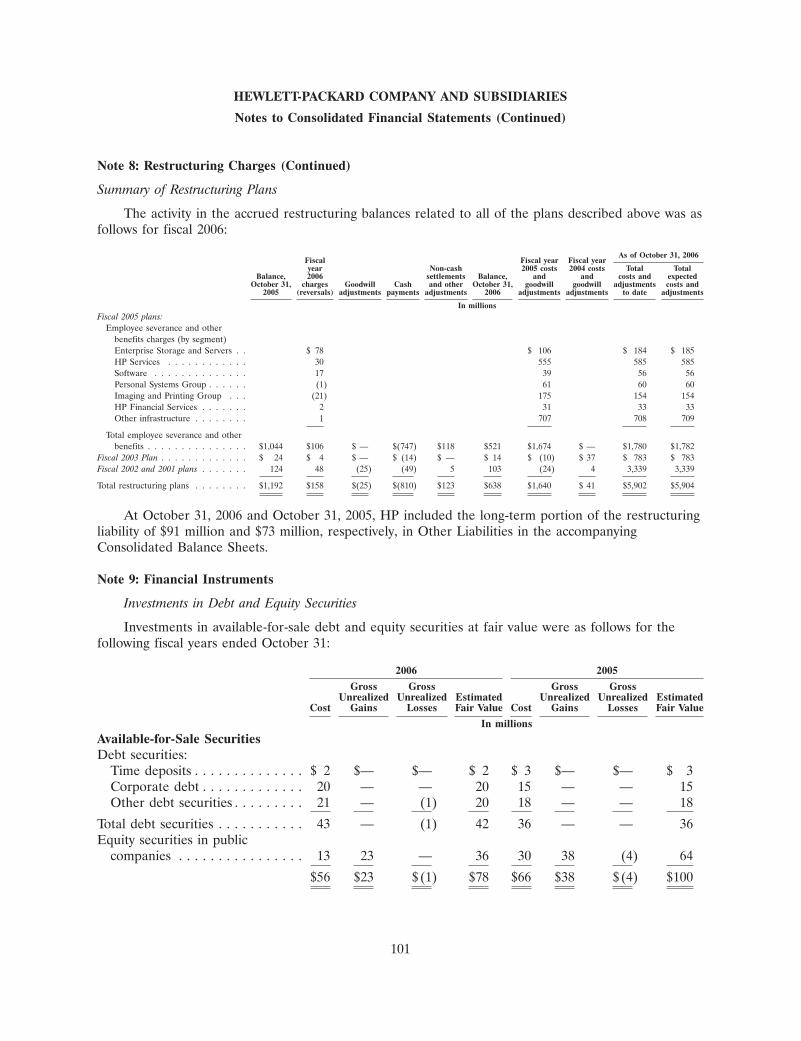
HEWLETT-PACKARD COMPANY AND SUBSIDIARIES
Notes to Consolidated Financial Statements (Continued)
Note 8: Restructuring Charges (Continued)
Summary of Restructuring Plans
The activity in the accrued restructuring balances related to all of the plans described above was asfollows for fiscal 2006:
As of October 31, 2006Fiscal Fiscal year Fiscal yearyear Non-cash 2005 costs 2004 costs Total Total
Balance, 2006 settlements Balance, and and costs and expectedOctober 31, charges Goodwill Cash and other October 31, goodwill goodwill adjustments costs and
2005 (reversals) adjustments payments adjustments 2006 adjustments adjustments to date adjustments
In millionsFiscal 2005 plans:
Employee severance and otherbenefits charges (by segment)Enterprise Storage and Servers . . $ 78 $ 106 $ 184 $ 185HP Services . . . . . . . . . . . . 30 555 585 585Software . . . . . . . . . . . . . . 17 39 56 56Personal Systems Group . . . . . . (1) 61 60 60Imaging and Printing Group . . . (21) 175 154 154HP Financial Services . . . . . . . 2 31 33 33Other infrastructure . . . . . . . . 1 707 708 709
Total employee severance and otherbenefits . . . . . . . . . . . . . . . $1,044 $106 $ — $(747) $118 $521 $1,674 $ — $1,780 $1,782
Fiscal 2003 Plan . . . . . . . . . . . . . $ 24 $ 4 $ — $ (14) $ — $ 14 $ (10) $ 37 $ 783 $ 783Fiscal 2002 and 2001 plans . . . . . . . 124 48 (25) (49) 5 103 (24) 4 3,339 3,339
Total restructuring plans . . . . . . . . $1,192 $158 $(25) $(810) $123 $638 $1,640 $ 41 $5,902 $5,904
At October 31, 2006 and October 31, 2005, HP included the long-term portion of the restructuringliability of $91 million and $73 million, respectively, in Other Liabilities in the accompanyingConsolidated Balance Sheets.
Note 9: Financial Instruments
Investments in Debt and Equity Securities
Investments in available-for-sale debt and equity securities at fair value were as follows for thefollowing fiscal years ended October 31:
2006 2005
Gross Gross Gross GrossUnrealized Unrealized Estimated Unrealized Unrealized Estimated
Cost Gains Losses Fair Value Cost Gains Losses Fair Value
In millions
Available-for-Sale SecuritiesDebt securities:
Time deposits . . . . . . . . . . . . . . $ 2 $— $— $ 2 $ 3 $— $— $ 3Corporate debt . . . . . . . . . . . . . 20 — — 20 15 — — 15Other debt securities . . . . . . . . . 21 — (1) 20 18 — — 18
Total debt securities . . . . . . . . . . . 43 — (1) 42 36 — — 36Equity securities in public
companies . . . . . . . . . . . . . . . . 13 23 — 36 30 38 (4) 64
$56 $23 $(1) $78 $66 $38 $(4) $100
101

HEWLETT-PACKARD COMPANY AND SUBSIDIARIES
Notes to Consolidated Financial Statements (Continued)
Note 9: Financial Instruments (Continued)
Corporate debt consists primarily of loans to the other companies that are guaranteed by standbyletters of credit issued by third party banks. Other debt securities consist primarily of fixed-interestsecurities invested for early retirement purposes as required by German laws. Equity securities in publiccompanies are primarily common stock.
HP estimated the fair values based on quoted market prices or pricing models using currentmarket rates. These estimated fair values may not be representative of actual values that could havebeen realized as of year-end or that will be realized in the future.
The gross unrealized losses as of October 31, 2006 were associated with other debt securities witha fair value of $18 million and had been in a continuous loss position for fewer than 12 months. Thegross unrealized losses as of October 31, 2005 were associated with investments in public equitysecurities with a fair value of $10 million and had been in a continuous loss position for fewer than12 months.
Contractual maturities of available-for-sale debt securities were as follows at October 31, 2006:
Available-for-SaleSecurities
EstimatedCost Fair Value
In millions
Due in less than one year . . . . . . . . . . . . . . . . . . . . . . . . . . . . . . . . . . . . . . . . . . . . $22 $22Due in 1-5 years . . . . . . . . . . . . . . . . . . . . . . . . . . . . . . . . . . . . . . . . . . . . . . . . . . . 21 20
$43 $42
Proceeds from sales or maturities of available-for-sale and other securities were $91 million infiscal 2006, $2.1 billion in fiscal 2005 and $4.3 billion in fiscal 2004. The gross realized gains and lossestotaled $35 million and $2 million, respectively, in fiscal 2006. Gross realized gains and losses totaled$31 million and $1 million, respectively, in fiscal 2005. Gross realized gains and losses totaled$27 million and $4 million, respectively, in fiscal 2004. The specific identification method is used toaccount for gains and losses on available-for-sale securities.
A summary of the carrying values and balance sheet classification of all investments in debt andequity securities was as follows for the following fiscal years ended October 31:
2006 2005
In millions
Available-for-sale debt securities . . . . . . . . . . . . . . . . . . . . . . . . . . . . . . . . . . . . . . . . . $ 22 $ 18
Short-term investments . . . . . . . . . . . . . . . . . . . . . . . . . . . . . . . . . . . . . . . . . . . . . . . 22 18
Available-for-sale debt securities . . . . . . . . . . . . . . . . . . . . . . . . . . . . . . . . . . . . . . . . . 20 18Available-for-sale equity securities . . . . . . . . . . . . . . . . . . . . . . . . . . . . . . . . . . . . . . . . 36 64Equity securities in privately-held companies and other investments . . . . . . . . . . . . . . . . 362 353
Included in long-term financing receivables and other assets . . . . . . . . . . . . . . . . . . . . . 418 435
Total investments . . . . . . . . . . . . . . . . . . . . . . . . . . . . . . . . . . . . . . . . . . . . . . . . . . . . . $440 $453
102

HEWLETT-PACKARD COMPANY AND SUBSIDIARIES
Notes to Consolidated Financial Statements (Continued)
Note 9: Financial Instruments (Continued)
Other investments consist primarily of marketable securities held to generate returns that HPexpects to offset changes in certain liabilities related to deferred compensation arrangements. HPincludes gains or losses from changes in fair value of these securities, offset by losses or gains on therelated liabilities, in interest and other, net, in HP’s Consolidated Statements of Earnings. The balanceconsists of cost basis and equity method investments.
Derivative Financial Instruments
HP is a global company that is exposed to foreign currency exchange rate fluctuations and interestrate changes in the normal course of its business. As part of its risk management strategy, HP usesderivative instruments, primarily forward contracts, swaps and options, to hedge certain foreigncurrency and interest rate exposures. HP’s objective is to offset gains and losses resulting from theseexposures with losses and gains on the derivative contracts used to hedge them, thereby reducingvolatility of earnings or protecting fair values of assets and liabilities. HP does not use derivativecontracts for speculative purposes. HP applies hedge accounting based upon the criteria established bySFAS No. 133, ‘‘Accounting for Derivative Instruments and Hedging Activities’’ (‘‘SFAS 133’’), wherebyHP designates its derivatives as fair value hedges, cash flow hedges or hedges of the foreign currencyexposure of a net investment in a foreign operation (‘‘net investment hedges’’). HP recognizes allderivatives in the Consolidated Balance Sheets at fair value and reports them in other current assets,long-term financing receivables and other assets, other accrued liabilities, and other liabilities. HPclassifies cash flows from the derivative programs as cash flows from operating activities in theConsolidated Statement of Cash Flows.
Fair Value Hedges
HP may enter into fair value hedges to reduce the exposure of its debt portfolio to both interestrate risk and foreign currency exchange rate risk. HP issues long-term debt in either U.S. dollars orforeign currencies based on market conditions at the time of financing. HP may then use interest rateor cross currency swaps to modify the market risk exposures in connection with the debt to achieveprimarily U.S. dollar LIBOR-based floating interest expense and to manage exposure to changes inforeign currency exchange rates. The swap transactions generally involve the exchange of fixed forfloating interest payments, and, when the underlying debt is denominated in a foreign currency,exchange of the foreign currency principal and interest obligations for U.S. dollar-denominatedamounts. Alternatively, HP may choose not to swap fixed for floating interest payments or mayterminate a previously executed swap if it believes a larger proportion of fixed-rate debt would bebeneficial. HP may choose not to hedge the foreign currency risk associated with its foreign currencydenominated debt if this debt acts as a natural hedge for foreign currency assets denominated in thesame currency. When investing in fixed rate instruments, HP may enter into interest rate swaps thatconvert the fixed interest returns into variable interest returns and would classify these swaps as fairvalue hedges. For derivative instruments that are designated and qualify as fair value hedges, HPrecognizes the gain or loss on the derivative instrument, as well as the offsetting loss or gain on thehedged item in interest and other, net, in the Consolidated Statements of Earnings in the currentperiod. When HP terminates an interest rate swap before maturity, the resulting gain or loss from thetermination is amortized over the remaining life of the underlying hedged item.
103
HEWLETT-PACKARD COMPANY AND SUBSIDIARIES
Notes to Consolidated Financial Statements (Continued)
Note 9: Financial Instruments (Continued)
Cash Flow Hedges
HP may use cash flow hedges to hedge the variability of LIBOR-based interest income HP receiveson certain variable-rate investments. HP may enter into interest rate swaps that convert variable rateinterest returns into fixed-rate interest returns. For interest rate swaps that HP designates and thatqualify as cash flow hedges, HP records changes in the fair values in accumulated other comprehensiveincome as a separate component of stockholders’ equity and subsequently reclassifies such changes intoearnings in the period during which the hedged transaction is recognized in earnings.
HP uses a combination of forward contracts and options designated as cash flow hedges to protectagainst the foreign currency exchange rate risks inherent in its forecasted net revenue and, to a lesserextent, cost of sales denominated in currencies other than the U.S. dollar. HP’s foreign currency cashflow hedges mature generally within six months. However, certain leasing revenue-related forwardcontracts extend for the duration of the lease term, which can be up to five years. For derivativeinstruments that are designated and qualify as cash flow hedges, HP initially records the effectiveportions of the gain or loss on the derivative instrument in accumulated other comprehensive loss as aseparate component of stockholders’ equity and subsequently reclassifies these amounts into earnings inthe period during which the hedged transaction is recognized in earnings. HP reports the effectiveportion of cash flow hedges in the same financial statement line item as the changes in value of thehedged item. As of October 31, 2006, amounts related to derivatives qualifying as cash flow hedgesamounted to an accumulated other comprehensive loss of $46 million, net of taxes, of which$45 million is expected to be reclassified to earnings in the next 12 months along with the earningseffects of the related forecasted transactions. In addition, during fiscal 2006 and 2005 HP did notdiscontinue any cash flow hedges for which it was probable that a forecasted transaction would notoccur.
Net Investment Hedges
HP uses forward contracts designated as net investment hedges to hedge net investments in certainforeign subsidiaries whose functional currency is the local currency. For derivative instruments that aredesignated as net investment hedges, HP records the effective portion of the gain or loss on thederivative instrument together with changes in the hedged items in cumulative translation adjustment asa separate component of stockholders’ equity. Cumulative translation adjustment decreased as result ofan unrecognized net loss on net investment hedges of $31 million and $56 million for the fiscal yearsended October 31, 2006 and 2005, respectively.
Other Derivatives
Other derivatives not designated as hedging instruments under SFAS 133 consist primarily offorward contracts HP uses to hedge foreign currency balance sheet exposures. For derivativeinstruments not designated as hedging instruments under SFAS 133, HP recognizes changes in the fairvalues in earnings in the period of change. HP recognizes the gains or losses on foreign currencyforward contracts used to hedge balance sheet exposures in interest and other, net in the same periodas the remeasurement gain and loss of the related foreign currency denominated assets and liabilities.Interest and other, net, included net foreign currency exchange gains of approximately $54 million infiscal 2006, and gains of approximately $70 million in fiscal 2005 and losses of approximately$142 million in fiscal 2004.
104

HEWLETT-PACKARD COMPANY AND SUBSIDIARIES
Notes to Consolidated Financial Statements (Continued)
Note 9: Financial Instruments (Continued)
Hedge Effectiveness
For interest rate swaps designated as fair value hedges, HP measures effectiveness by offsetting thechange in fair value of the hedged debt and investments with the change in fair value of the derivative.For interest rate swaps designated as cash flow hedges, HP measures effectiveness by offsetting thechange in the variable portion of the interest rate swaps with the changes in expected interest incomereceived due to the fluctuations in the LIBOR based interest rate. For foreign currency option andforward contracts designated as cash flow or net investment hedges, HP measures effectiveness bycomparing the cumulative change in the hedge contract with the cumulative change in the hedged item,both of which are based on forward rates. HP recognizes any ineffective portion of the hedge, as wellas amounts not included in the assessment of effectiveness, in the Consolidated Statements of Earnings.As of October 31, 2006, the portion of hedging instruments’ gains or losses excluded from theassessment of effectiveness was not material for fair value, cash flow or net investment hedges. Hedgeineffectiveness for fair value, cash flow and net investment hedges was not material in the fiscal yearsended October 31, 2006, 2005 and 2004.
HP estimates the fair values of derivatives based on quoted market prices or pricing models usingcurrent market rates and records all derivatives on the balance sheet at fair value. The gross notionaland fair market value of derivative financial instruments and the respective SFAS 133 classification onthe Consolidated Balance Sheets were as follows for the following fiscal years ended October 31:
2006
Long-termFinancing
Other Receivables OtherGross Current and Accrued Other
Notional Assets Other Assets Liabilities Liabilities Total
In millions
Fair value hedges . . . . . . . . . . . . . . . . . . $ 2,550 $ 1 $ 2 $ (1) $ (3) $ (1)Cash flow hedges . . . . . . . . . . . . . . . . . . 8,768 33 — (97) — (64)Net investment hedges . . . . . . . . . . . . . . 844 1 1 (8) (7) (13)Other derivatives . . . . . . . . . . . . . . . . . . 10,482 25 13 (135) (28) (125)
Total . . . . . . . . . . . . . . . . . . . . . . . . . . . $22,644 $60 $16 $(241) $(38) $(203)
2005
Long-termFinancing
Other Receivables OtherGross Current and Accrued Other
Notional Assets Other Assets Liabilities Liabilities Total
In millions
Fair value hedges . . . . . . . . . . . . . . . . . . . $ 2,725 $ 10 $— $ — $(37) $(27)Cash flow hedges . . . . . . . . . . . . . . . . . . . 7,813 52 1 (76) (3) (26)Net investment hedges . . . . . . . . . . . . . . . 827 4 — (13) — (9)Other derivatives . . . . . . . . . . . . . . . . . . . 12,580 88 24 (91) (8) 13
Total . . . . . . . . . . . . . . . . . . . . . . . . . . . . $23,945 $154 $25 $(180) $(48) $(49)
105
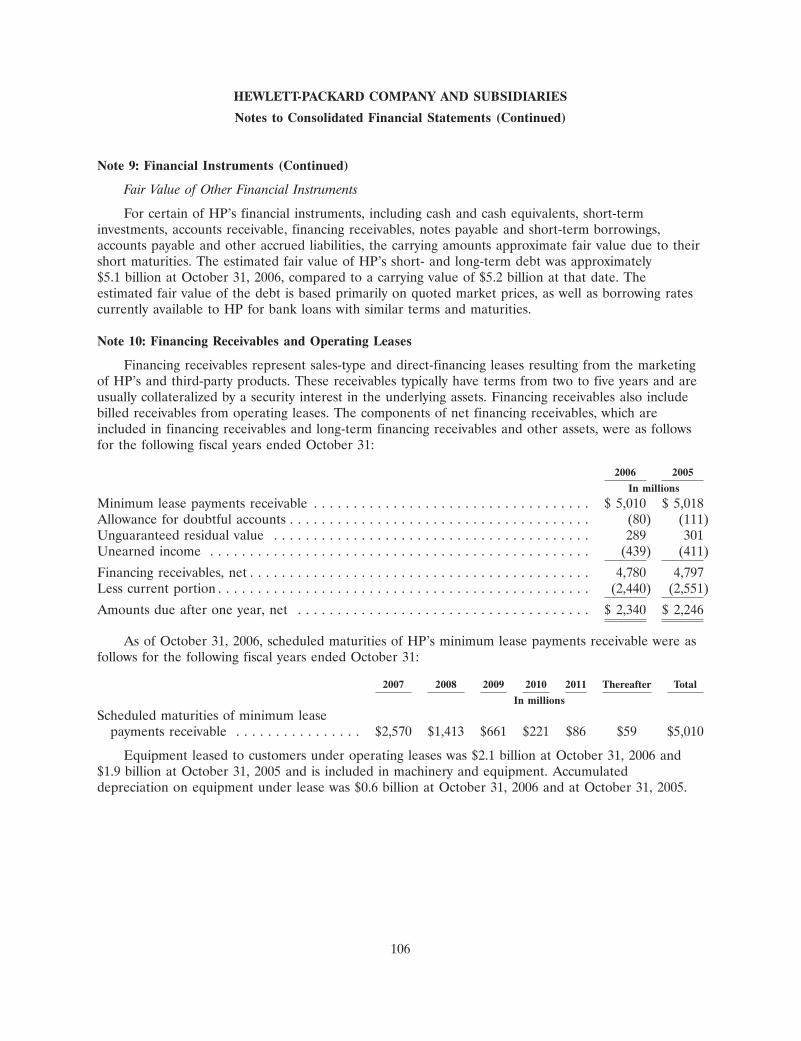
HEWLETT-PACKARD COMPANY AND SUBSIDIARIES
Notes to Consolidated Financial Statements (Continued)
Note 9: Financial Instruments (Continued)
Fair Value of Other Financial Instruments
For certain of HP’s financial instruments, including cash and cash equivalents, short-terminvestments, accounts receivable, financing receivables, notes payable and short-term borrowings,accounts payable and other accrued liabilities, the carrying amounts approximate fair value due to theirshort maturities. The estimated fair value of HP’s short- and long-term debt was approximately$5.1 billion at October 31, 2006, compared to a carrying value of $5.2 billion at that date. Theestimated fair value of the debt is based primarily on quoted market prices, as well as borrowing ratescurrently available to HP for bank loans with similar terms and maturities.
Note 10: Financing Receivables and Operating Leases
Financing receivables represent sales-type and direct-financing leases resulting from the marketingof HP’s and third-party products. These receivables typically have terms from two to five years and areusually collateralized by a security interest in the underlying assets. Financing receivables also includebilled receivables from operating leases. The components of net financing receivables, which areincluded in financing receivables and long-term financing receivables and other assets, were as followsfor the following fiscal years ended October 31:
2006 2005
In millions
Minimum lease payments receivable . . . . . . . . . . . . . . . . . . . . . . . . . . . . . . . . . . . $ 5,010 $ 5,018Allowance for doubtful accounts . . . . . . . . . . . . . . . . . . . . . . . . . . . . . . . . . . . . . . (80) (111)Unguaranteed residual value . . . . . . . . . . . . . . . . . . . . . . . . . . . . . . . . . . . . . . . . 289 301Unearned income . . . . . . . . . . . . . . . . . . . . . . . . . . . . . . . . . . . . . . . . . . . . . . . . (439) (411)
Financing receivables, net . . . . . . . . . . . . . . . . . . . . . . . . . . . . . . . . . . . . . . . . . . . 4,780 4,797Less current portion . . . . . . . . . . . . . . . . . . . . . . . . . . . . . . . . . . . . . . . . . . . . . . . (2,440) (2,551)
Amounts due after one year, net . . . . . . . . . . . . . . . . . . . . . . . . . . . . . . . . . . . . . $ 2,340 $ 2,246
As of October 31, 2006, scheduled maturities of HP’s minimum lease payments receivable were asfollows for the following fiscal years ended October 31:
2007 2008 2009 2010 2011 Thereafter Total
In millions
Scheduled maturities of minimum leasepayments receivable . . . . . . . . . . . . . . . . $2,570 $1,413 $661 $221 $86 $59 $5,010
Equipment leased to customers under operating leases was $2.1 billion at October 31, 2006 and$1.9 billion at October 31, 2005 and is included in machinery and equipment. Accumulateddepreciation on equipment under lease was $0.6 billion at October 31, 2006 and at October 31, 2005.
106
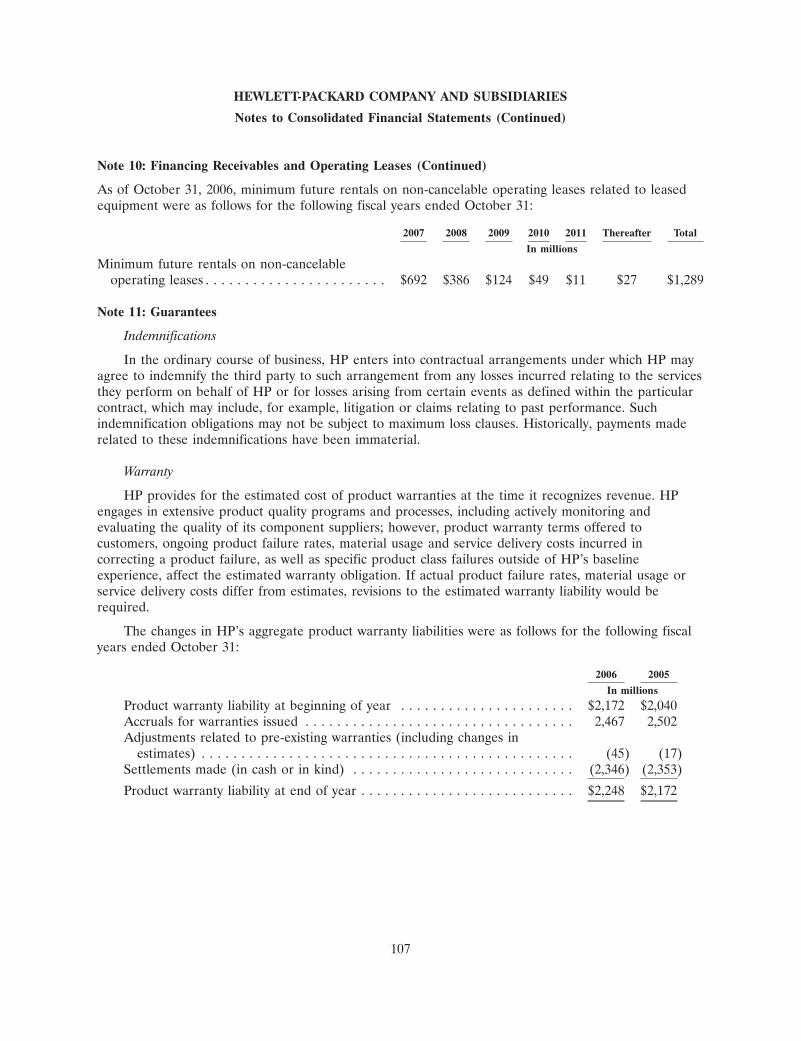
HEWLETT-PACKARD COMPANY AND SUBSIDIARIES
Notes to Consolidated Financial Statements (Continued)
Note 10: Financing Receivables and Operating Leases (Continued)
As of October 31, 2006, minimum future rentals on non-cancelable operating leases related to leasedequipment were as follows for the following fiscal years ended October 31:
2007 2008 2009 2010 2011 Thereafter Total
In millions
Minimum future rentals on non-cancelableoperating leases . . . . . . . . . . . . . . . . . . . . . . . $692 $386 $124 $49 $11 $27 $1,289
Note 11: Guarantees
Indemnifications
In the ordinary course of business, HP enters into contractual arrangements under which HP mayagree to indemnify the third party to such arrangement from any losses incurred relating to the servicesthey perform on behalf of HP or for losses arising from certain events as defined within the particularcontract, which may include, for example, litigation or claims relating to past performance. Suchindemnification obligations may not be subject to maximum loss clauses. Historically, payments maderelated to these indemnifications have been immaterial.
Warranty
HP provides for the estimated cost of product warranties at the time it recognizes revenue. HPengages in extensive product quality programs and processes, including actively monitoring andevaluating the quality of its component suppliers; however, product warranty terms offered tocustomers, ongoing product failure rates, material usage and service delivery costs incurred incorrecting a product failure, as well as specific product class failures outside of HP’s baselineexperience, affect the estimated warranty obligation. If actual product failure rates, material usage orservice delivery costs differ from estimates, revisions to the estimated warranty liability would berequired.
The changes in HP’s aggregate product warranty liabilities were as follows for the following fiscalyears ended October 31:
2006 2005
In millions
Product warranty liability at beginning of year . . . . . . . . . . . . . . . . . . . . . . $2,172 $2,040Accruals for warranties issued . . . . . . . . . . . . . . . . . . . . . . . . . . . . . . . . . . 2,467 2,502Adjustments related to pre-existing warranties (including changes in
estimates) . . . . . . . . . . . . . . . . . . . . . . . . . . . . . . . . . . . . . . . . . . . . . . . (45) (17)Settlements made (in cash or in kind) . . . . . . . . . . . . . . . . . . . . . . . . . . . . (2,346) (2,353)
Product warranty liability at end of year . . . . . . . . . . . . . . . . . . . . . . . . . . . $2,248 $2,172
107

HEWLETT-PACKARD COMPANY AND SUBSIDIARIES
Notes to Consolidated Financial Statements (Continued)
Note 11: Guarantees (Continued)
Deferred Revenue
The components of deferred revenue were as follows for the following fiscal years endedOctober 31:
2006 2005
In millions
Deferred support contract services revenue . . . . . . . . . . . . . . . . . . . . . . . . . $3,598 $3,188Other deferred revenue . . . . . . . . . . . . . . . . . . . . . . . . . . . . . . . . . . . . . . . 2,461 1,958
Total deferred revenue . . . . . . . . . . . . . . . . . . . . . . . . . . . . . . . . . . . . . . 6,059 5,146Less current portion . . . . . . . . . . . . . . . . . . . . . . . . . . . . . . . . . . . . . . . . . 4,309 3,815
Long-term deferred revenue . . . . . . . . . . . . . . . . . . . . . . . . . . . . . . . . . . . $1,750 $1,331
Deferred support contract services revenue represents amounts received or billed in advanceprimarily for fixed-price support or maintenance contracts. These services include stand-alone productsupport packages, routine maintenance service contracts, upgrades or extensions to standard productwarranty, as well as high availability services for complex, global, networked, multi-vendorenvironments. These service amounts are deferred at the time the customer is billed and thenrecognized ratably over the contract life or as the services are rendered.
Other deferred revenue represents amounts received or billed in advance for contracts relatedprimarily to consulting and integration projects, managed services start-up or transition work, productsales and minor amounts for training.
Note 12: Borrowings
Notes Payable and Short-Term Borrowings
Notes payable and short-term borrowings, including the current portion of long-term debt, were asfollows for the following fiscal years ended October 31:
2006 2005
Weighted WeightedAmount Average Amount Average
Outstanding Interest Rate Outstanding Interest Rate
In millions
Current portion of long-term debt . . . . . . . . . . . . . $2,081 5.7% $1,182 4.8%Commercial paper . . . . . . . . . . . . . . . . . . . . . . . . . 190 3.3% 208 2.6%Notes payable to banks, lines of credit and other . . 434 4.6% 441 3.9%
$2,705 $1,831
Notes payable to banks, lines of credit and other includes deposits associated with banking-relatedactivities of approximately $393 million and $385 million at October 31, 2006 and 2005, respectively.
108
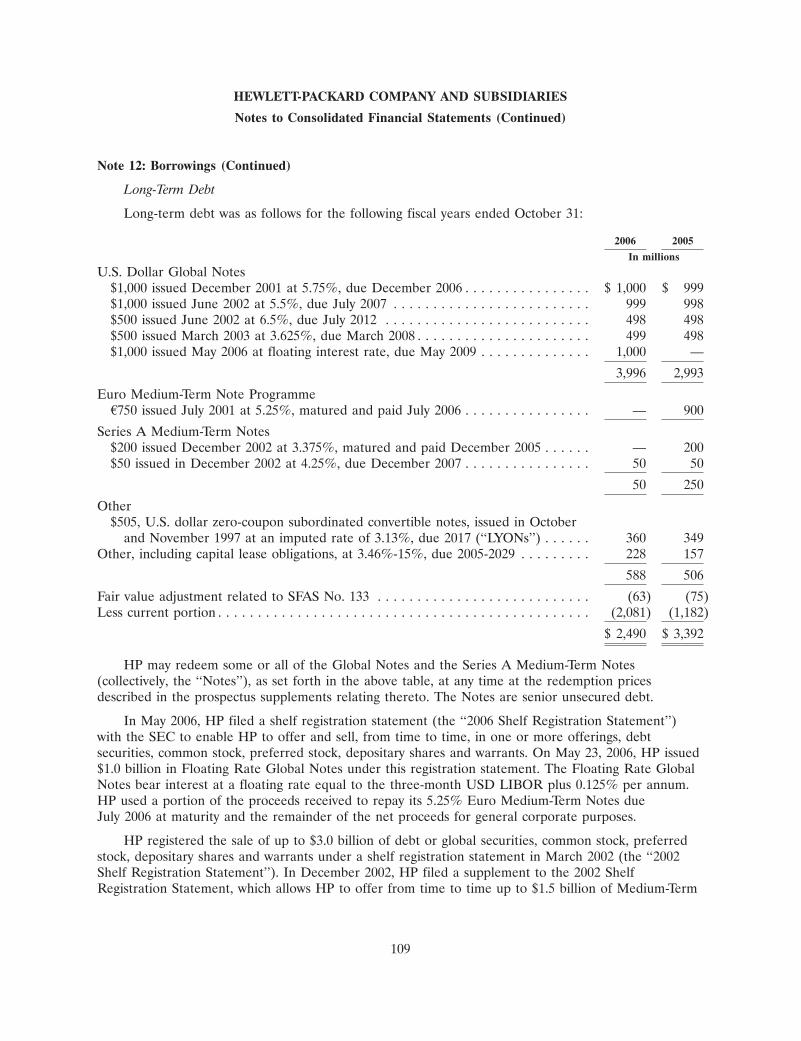
HEWLETT-PACKARD COMPANY AND SUBSIDIARIES
Notes to Consolidated Financial Statements (Continued)
Note 12: Borrowings (Continued)
Long-Term Debt
Long-term debt was as follows for the following fiscal years ended October 31:
2006 2005
In millions
U.S. Dollar Global Notes$1,000 issued December 2001 at 5.75%, due December 2006 . . . . . . . . . . . . . . . . $ 1,000 $ 999$1,000 issued June 2002 at 5.5%, due July 2007 . . . . . . . . . . . . . . . . . . . . . . . . . 999 998$500 issued June 2002 at 6.5%, due July 2012 . . . . . . . . . . . . . . . . . . . . . . . . . . 498 498$500 issued March 2003 at 3.625%, due March 2008 . . . . . . . . . . . . . . . . . . . . . . 499 498$1,000 issued May 2006 at floating interest rate, due May 2009 . . . . . . . . . . . . . . 1,000 —
3,996 2,993
Euro Medium-Term Note ProgrammeA750 issued July 2001 at 5.25%, matured and paid July 2006 . . . . . . . . . . . . . . . . — 900
Series A Medium-Term Notes$200 issued December 2002 at 3.375%, matured and paid December 2005 . . . . . . — 200$50 issued in December 2002 at 4.25%, due December 2007 . . . . . . . . . . . . . . . . 50 50
50 250
Other$505, U.S. dollar zero-coupon subordinated convertible notes, issued in October
and November 1997 at an imputed rate of 3.13%, due 2017 (‘‘LYONs’’) . . . . . . 360 349Other, including capital lease obligations, at 3.46%-15%, due 2005-2029 . . . . . . . . . 228 157
588 506
Fair value adjustment related to SFAS No. 133 . . . . . . . . . . . . . . . . . . . . . . . . . . . (63) (75)Less current portion . . . . . . . . . . . . . . . . . . . . . . . . . . . . . . . . . . . . . . . . . . . . . . . (2,081) (1,182)
$ 2,490 $ 3,392
HP may redeem some or all of the Global Notes and the Series A Medium-Term Notes(collectively, the ‘‘Notes’’), as set forth in the above table, at any time at the redemption pricesdescribed in the prospectus supplements relating thereto. The Notes are senior unsecured debt.
In May 2006, HP filed a shelf registration statement (the ‘‘2006 Shelf Registration Statement’’)with the SEC to enable HP to offer and sell, from time to time, in one or more offerings, debtsecurities, common stock, preferred stock, depositary shares and warrants. On May 23, 2006, HP issued$1.0 billion in Floating Rate Global Notes under this registration statement. The Floating Rate GlobalNotes bear interest at a floating rate equal to the three-month USD LIBOR plus 0.125% per annum.HP used a portion of the proceeds received to repay its 5.25% Euro Medium-Term Notes dueJuly 2006 at maturity and the remainder of the net proceeds for general corporate purposes.
HP registered the sale of up to $3.0 billion of debt or global securities, common stock, preferredstock, depositary shares and warrants under a shelf registration statement in March 2002 (the ‘‘2002Shelf Registration Statement’’). In December 2002, HP filed a supplement to the 2002 ShelfRegistration Statement, which allows HP to offer from time to time up to $1.5 billion of Medium-Term
109
HEWLETT-PACKARD COMPANY AND SUBSIDIARIES
Notes to Consolidated Financial Statements (Continued)
Note 12: Borrowings (Continued)
Notes, Series B, due nine months or more from the date of issuance (the ‘‘Series B Medium-Term NoteProgram’’). As of October 31, 2006, HP has not issued Medium-Term Notes pursuant to the Series BMedium-Term Note Program.
HP registered the sale of up to $3.0 billion of Medium-Term Notes under its Euro Medium-TermNote Programme filed with the Luxembourg Stock Exchange. HP can denominate these notes in anycurrency, including the euro. These notes have not been and will not be registered in the United States.In July 2006, HP repaid the previously issued 750 million euro notes at maturity under this programme.
The LYONs are convertible by the holders at an adjusted rate of 15.09 shares of HP commonstock for each $1,000 face value of the LYONs, payable in either cash or common stock at HP’selection. At any time, HP may redeem the LYONs at book value, payable in cash only. InDecember 2000, the Board of Directors authorized a repurchase program for the LYONs that allowedHP to repurchase the LYONs from time to time at varying prices. The last repurchase under thisprogram occurred in fiscal 2002.
On December 15, 2006, HP repaid $1.0 billion Global Notes due December 2006 at maturity.
HP has a U.S. commercial paper program with a $6.0 billion capacity. Its subsidiaries areauthorized to issue up to an additional $1.0 billion of commercial paper, of which $500 million ofcapacity is currently available to be used by Hewlett-Packard International Bank PLC, a wholly-ownedsubsidiary of HP for its Euro Commercial Paper/Certificate of Deposit Programme.
Until December 15, 2005, HP had two U.S. credit facilities consisting of a $1.5 billion 364-daycredit facility expiring in March 2006 and a $1.5 billion 5-year credit facility expiring in March 2009.The credit facilities were subject to a weighted average commitment fee of 7.25 basis points per annum.On December 15, 2005, HP replaced the two credit facilities with a $3.0 billion 5-year credit facilitythat is subject to a commitment fee of 6.5 basis points per annum. Interest rates and other terms ofborrowing under the credit facility vary, based on HP’s external credit ratings. The credit facility is asenior unsecured committed borrowing arrangement primarily to support the issuance of U.S.commercial paper. No amounts are outstanding under the credit facility.
HP also maintains lines of credit of approximately $2.1 billion from a number of financialinstitutions that are uncommitted and available through various foreign subsidiaries.
Included in Other, including capital lease obligations, are borrowings that are collateralized bycertain financing receivable assets. As of October 31, 2006, the carrying value of the assetsapproximated the carrying value of the borrowings of $16.4 million.
At October 31, 2006, HP had up to $12.5 billion of available borrowing resources under the 2002Shelf Registration Statement and other programs described above. HP also may issue additional debtsecurities, common stock, preferred stock, depositary shares and warrants under the 2006 ShelfRegistration Statement.
110
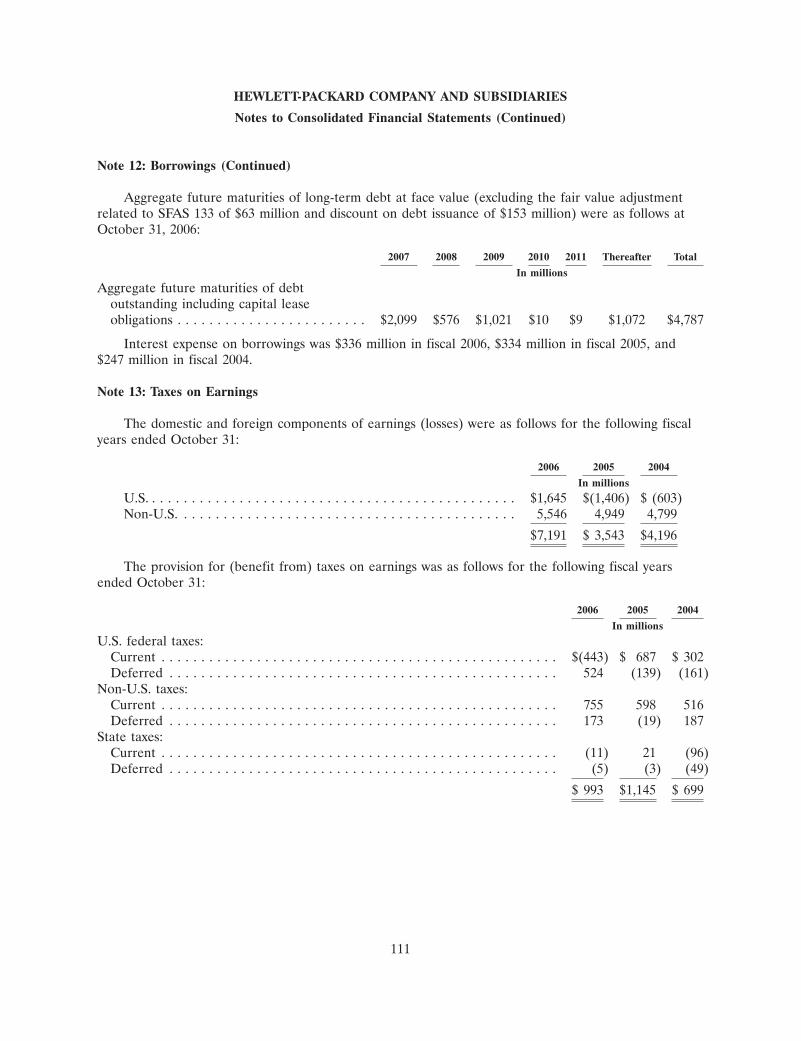
HEWLETT-PACKARD COMPANY AND SUBSIDIARIES
Notes to Consolidated Financial Statements (Continued)
Note 12: Borrowings (Continued)
Aggregate future maturities of long-term debt at face value (excluding the fair value adjustmentrelated to SFAS 133 of $63 million and discount on debt issuance of $153 million) were as follows atOctober 31, 2006:
2007 2008 2009 2010 2011 Thereafter Total
In millions
Aggregate future maturities of debtoutstanding including capital leaseobligations . . . . . . . . . . . . . . . . . . . . . . . . $2,099 $576 $1,021 $10 $9 $1,072 $4,787
Interest expense on borrowings was $336 million in fiscal 2006, $334 million in fiscal 2005, and$247 million in fiscal 2004.
Note 13: Taxes on Earnings
The domestic and foreign components of earnings (losses) were as follows for the following fiscalyears ended October 31:
2006 2005 2004
In millions
U.S. . . . . . . . . . . . . . . . . . . . . . . . . . . . . . . . . . . . . . . . . . . . . . . $1,645 $(1,406) $ (603)Non-U.S. . . . . . . . . . . . . . . . . . . . . . . . . . . . . . . . . . . . . . . . . . . 5,546 4,949 4,799
$7,191 $ 3,543 $4,196
The provision for (benefit from) taxes on earnings was as follows for the following fiscal yearsended October 31:
2006 2005 2004
In millions
U.S. federal taxes:Current . . . . . . . . . . . . . . . . . . . . . . . . . . . . . . . . . . . . . . . . . . . . . . . . . . $(443) $ 687 $ 302Deferred . . . . . . . . . . . . . . . . . . . . . . . . . . . . . . . . . . . . . . . . . . . . . . . . . 524 (139) (161)
Non-U.S. taxes:Current . . . . . . . . . . . . . . . . . . . . . . . . . . . . . . . . . . . . . . . . . . . . . . . . . . 755 598 516Deferred . . . . . . . . . . . . . . . . . . . . . . . . . . . . . . . . . . . . . . . . . . . . . . . . . 173 (19) 187
State taxes:Current . . . . . . . . . . . . . . . . . . . . . . . . . . . . . . . . . . . . . . . . . . . . . . . . . . (11) 21 (96)Deferred . . . . . . . . . . . . . . . . . . . . . . . . . . . . . . . . . . . . . . . . . . . . . . . . . (5) (3) (49)
$ 993 $1,145 $ 699
111
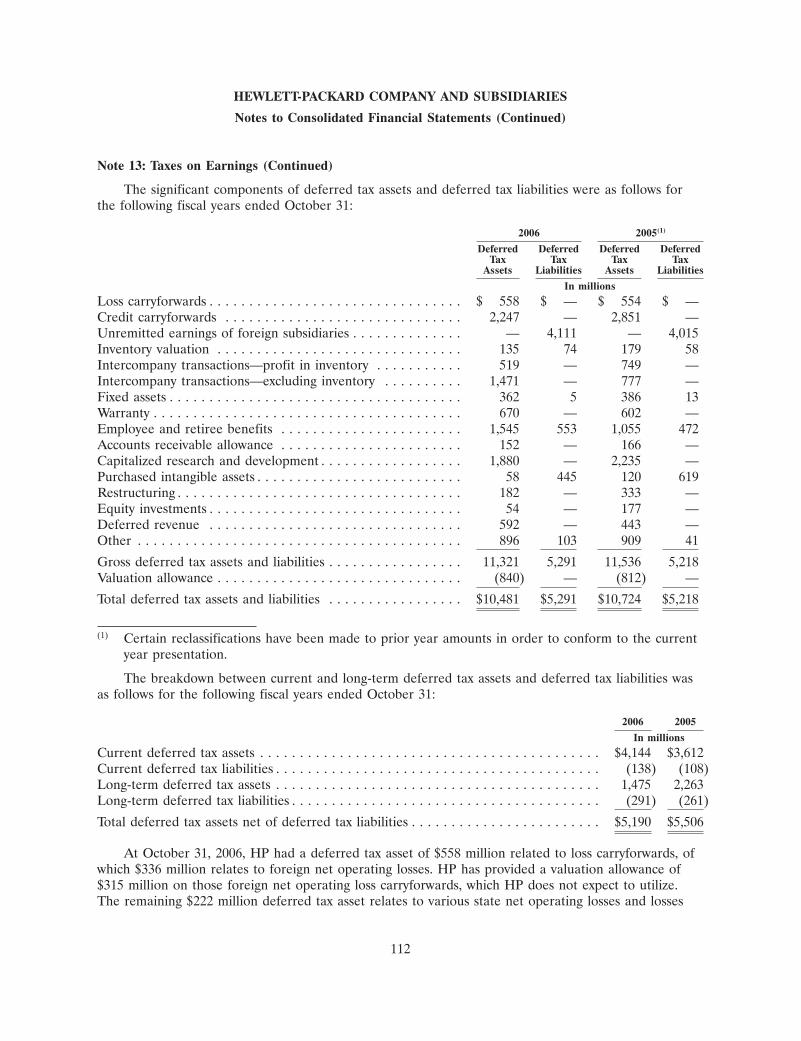
HEWLETT-PACKARD COMPANY AND SUBSIDIARIES
Notes to Consolidated Financial Statements (Continued)
Note 13: Taxes on Earnings (Continued)
The significant components of deferred tax assets and deferred tax liabilities were as follows forthe following fiscal years ended October 31:
2006 2005(1)
Deferred Deferred Deferred DeferredTax Tax Tax Tax
Assets Liabilities Assets Liabilities
In millions
Loss carryforwards . . . . . . . . . . . . . . . . . . . . . . . . . . . . . . . . $ 558 $ — $ 554 $ —Credit carryforwards . . . . . . . . . . . . . . . . . . . . . . . . . . . . . . 2,247 — 2,851 —Unremitted earnings of foreign subsidiaries . . . . . . . . . . . . . . — 4,111 — 4,015Inventory valuation . . . . . . . . . . . . . . . . . . . . . . . . . . . . . . . 135 74 179 58Intercompany transactions—profit in inventory . . . . . . . . . . . 519 — 749 —Intercompany transactions—excluding inventory . . . . . . . . . . 1,471 — 777 —Fixed assets . . . . . . . . . . . . . . . . . . . . . . . . . . . . . . . . . . . . . 362 5 386 13Warranty . . . . . . . . . . . . . . . . . . . . . . . . . . . . . . . . . . . . . . . 670 — 602 —Employee and retiree benefits . . . . . . . . . . . . . . . . . . . . . . . 1,545 553 1,055 472Accounts receivable allowance . . . . . . . . . . . . . . . . . . . . . . . 152 — 166 —Capitalized research and development . . . . . . . . . . . . . . . . . . 1,880 — 2,235 —Purchased intangible assets . . . . . . . . . . . . . . . . . . . . . . . . . . 58 445 120 619Restructuring . . . . . . . . . . . . . . . . . . . . . . . . . . . . . . . . . . . . 182 — 333 —Equity investments . . . . . . . . . . . . . . . . . . . . . . . . . . . . . . . . 54 — 177 —Deferred revenue . . . . . . . . . . . . . . . . . . . . . . . . . . . . . . . . 592 — 443 —Other . . . . . . . . . . . . . . . . . . . . . . . . . . . . . . . . . . . . . . . . . 896 103 909 41
Gross deferred tax assets and liabilities . . . . . . . . . . . . . . . . . 11,321 5,291 11,536 5,218Valuation allowance . . . . . . . . . . . . . . . . . . . . . . . . . . . . . . . (840) — (812) —
Total deferred tax assets and liabilities . . . . . . . . . . . . . . . . . $10,481 $5,291 $10,724 $5,218
(1) Certain reclassifications have been made to prior year amounts in order to conform to the currentyear presentation.
The breakdown between current and long-term deferred tax assets and deferred tax liabilities wasas follows for the following fiscal years ended October 31:
2006 2005
In millions
Current deferred tax assets . . . . . . . . . . . . . . . . . . . . . . . . . . . . . . . . . . . . . . . . . . . $4,144 $3,612Current deferred tax liabilities . . . . . . . . . . . . . . . . . . . . . . . . . . . . . . . . . . . . . . . . . (138) (108)Long-term deferred tax assets . . . . . . . . . . . . . . . . . . . . . . . . . . . . . . . . . . . . . . . . . 1,475 2,263Long-term deferred tax liabilities . . . . . . . . . . . . . . . . . . . . . . . . . . . . . . . . . . . . . . . (291) (261)
Total deferred tax assets net of deferred tax liabilities . . . . . . . . . . . . . . . . . . . . . . . . $5,190 $5,506
At October 31, 2006, HP had a deferred tax asset of $558 million related to loss carryforwards, ofwhich $336 million relates to foreign net operating losses. HP has provided a valuation allowance of$315 million on those foreign net operating loss carryforwards, which HP does not expect to utilize.The remaining $222 million deferred tax asset relates to various state net operating losses and losses
112

HEWLETT-PACKARD COMPANY AND SUBSIDIARIES
Notes to Consolidated Financial Statements (Continued)
Note 13: Taxes on Earnings (Continued)
from acquired companies. HP has provided $158 million in valuation allowance for such losses. Inaddition, HP has provided $86 million in valuation allowance on unrealized domestic capital losses.
Of the total tax credit carryforwards of $2.2 billion, HP had foreign tax credit carryforwards of$1.5 billion, which will begin to expire in fiscal 2012. HP had alternative minimum tax creditcarryforwards of $92 million, which do not expire, and research and development credit carryforwardsof $330 million, of which $24 million will expire in fiscal 2013 and the remainder will expire after fiscal2018. HP also had tax credit carryforwards of $363 million in various states and foreign countries, onwhich HP has provided a valuation allowance of $281 million.
Gross deferred tax assets at October 31, 2006 and 2005 were reduced by valuation allowances of$840 million and $812 million, respectively. The total valuation allowance increased by $28 million. Thisvaluation allowance increase was comprised of a $95 million increase to acquired net operating lossesand tax credits, which was partially offset by a decrease in the valuation allowances of state netoperating losses and tax credits of $25 million, foreign net operating losses and tax credits of $35million, and other miscellaneous items of $7 million. Of the $840 million in valuation allowances atOctober 31, 2006, $236 million was related to deferred tax assets for Compaq and other acquiredcompanies that existed at the time of acquisition. In the future, if HP determines that the realization ofthese deferred tax assets is more likely than not, the reversal of the related valuation allowance willreduce goodwill instead of the provision for taxes.
Of the total tax benefits resulting from the exercise of employee stock options and other employeestock programs, the amounts booked to stockholders’ equity were approximately $356 million in fiscal2006, $30 million in fiscal 2005 and $35 million in fiscal 2004.
The differences between the U.S. federal statutory income tax rate and HP’s effective tax ratewere as follows for the following fiscal years ended October 31:
2006 2005 2004
U.S. federal statutory income tax rate . . . . . . . . . . . . . . . . . . . . . . . . . 35.0% 35.0% 35.0%State income taxes, net of federal tax benefit . . . . . . . . . . . . . . . . . . . . (0.1) (3.0) (2.3)Lower rates in other jurisdictions, net . . . . . . . . . . . . . . . . . . . . . . . . . (11.9) (23.6) (15.3)Jobs Act Repatriation, including state taxes . . . . . . . . . . . . . . . . . . . . . — 22.4 —Research and development credit . . . . . . . . . . . . . . . . . . . . . . . . . . . . (0.2) (0.2) (0.6)Valuation allowance . . . . . . . . . . . . . . . . . . . . . . . . . . . . . . . . . . . . . . (1.0) 3.4 1.1U.S. federal tax audit settlement . . . . . . . . . . . . . . . . . . . . . . . . . . . . . (7.9) — —Other, net . . . . . . . . . . . . . . . . . . . . . . . . . . . . . . . . . . . . . . . . . . . . . (0.1) (1.7) (1.2)
13.8% 32.3% 16.7%
In fiscal 2006, HP recorded $599 million of net income tax benefit related to items unique to theyear. This included net favorable tax adjustments of $565 million to income tax accruals as a result ofthe settlement of the Internal Revenue Service (‘‘IRS’’) examinations of HP’s U.S. income tax returnsfor fiscal years 1993 to 1998. The reductions to the net income tax accruals for these years relatedprimarily to the resolution of issues with respect to Puerto Rico manufacturing tax incentives andexport tax incentives, and other issues involving our non-U.S. operations.
In December 2006, The Tax Relief and Health Care Act of 2006 was signed into law, whichincludes a retroactive reinstatement of the research and development credit. The retroactive amount
113

HEWLETT-PACKARD COMPANY AND SUBSIDIARIES
Notes to Consolidated Financial Statements (Continued)
Note 13: Taxes on Earnings (Continued)
will be recorded in HP’s financial statements in the first quarter of fiscal 2007, the quarter in which theAct was signed into law. While HP is still evaluating the Tax Relief and Health Care Act, theretroactive research credit is not expected to have a material impact on HP’s consolidated results ofoperations and financial condition.
In fiscal 2005, HP recorded $697 million of net income tax expense related to items unique to theyear. The tax expense was the result primarily of $792 million associated with the repatriation of$14.5 billion under the Jobs Act and $76 million related to additional distributions received fromforeign subsidiaries. These tax expenses were offset in part by tax benefits of $177 million resultingfrom agreements with the IRS and other governmental authorities, which were reflected in ‘‘Lowerrates in other jurisdictions, net’’ and ‘‘Other, net.’’
In fiscal 2004, the tax rate benefited from net favorable adjustments to previously estimated taxliabilities of $207 million, which decreased the provision for taxes. The most significant favorableadjustments related to the resolution of a California state income tax audit, a net favorable revision toestimated tax accruals upon filing the 2003 U.S. income tax return and a reduction in taxes on foreignearnings due to a change in regulatory policy. These favorable adjustments were offset in part by thenet effect of smaller adjustments to income tax liabilities in various jurisdictions.
As a result of certain employment actions and capital investments HP has undertaken, incomefrom manufacturing activities of subsidiaries in certain countries is subject to reduced tax rates, and insome cases is wholly exempt from taxes through fiscal 2019. The gross income tax benefits attributableto the tax status of these subsidiaries were estimated to be approximately $876 million ($0.31 perdiluted share) in fiscal 2006, $1,051 million ($0.36 per diluted share) in fiscal 2005 and $947 million($0.31 per diluted share) in fiscal 2004. The gross income tax benefits were offset partially by accrualsof U.S. income taxes on undistributed earnings.
The IRS has completed its examination of the income tax returns of HP for all years through1998. These years have been settled with the IRS’s Appeals Division and the settlements have beenapproved by the Joint Committee on Taxation. These tax years remain open for net operating loss andforeign tax credit carrybacks from subsequent years if the IRS’s audits of those years approve suchcarrybacks. As of October 31, 2006, the IRS was in the process of examining HP’s income tax returnsfor years 1999 through 2003. HP expects that the IRS will begin an audit of its 2004 and 2005 incometax returns in 2007. In addition, HP is subject to numerous ongoing audits by state and foreign taxauthorities. HP believes that adequate accruals have been provided for all HP open tax years.
All Compaq tax years through the merger date with HP, May 3, 2002, have been audited andagreed with the IRS. HP expects that substantially all of the remaining tax accruals for Compaq will bereclassified as a reduction of goodwill during fiscal 2007 upon closing of the statute of limitations.
HP has not provided for U.S. federal income and foreign withholding taxes on $3.1 billion ofundistributed earnings from non-U.S. operations as of October 31, 2006 because HP intends to reinvestsuch earnings indefinitely outside of the United States. If HP were to distribute these earnings, foreigntax credits may become available under current law to reduce the resulting U.S. income tax liability.Determination of the amount of unrecognized deferred tax liability related to these earnings is notpracticable. HP will remit non-indefinitely reinvested earnings of its non-US subsidiaries where excesscash has accumulated and it determines that it is advantageous for business operations, tax or cashreasons.
114

HEWLETT-PACKARD COMPANY AND SUBSIDIARIES
Notes to Consolidated Financial Statements (Continued)
Note 13: Taxes on Earnings (Continued)
American Jobs Creation Act of 2004—Repatriation of Foreign Earnings
The American Jobs Creation Act of 2004 (‘‘the Jobs Act’’), enacted on October 22, 2004, providedfor a temporary 85% dividends received deduction on certain foreign earnings repatriated during aone-year period. The deduction resulted in an approximate 5.25% federal tax rate on the repatriatedearnings. During the third quarter of fiscal 2005, HP’s CEO and Board of Directors approved adomestic reinvestment plan as required by the Jobs Act to repatriate $14.5 billion in foreign earnings infiscal 2005.
HP recorded tax expense in fiscal 2005 of $792 million related to this $14.5 billion dividend underthe Jobs Act. The additional tax expense consists of federal taxes of $744 million, state taxes, net offederal benefits, of $73 million, and a net tax benefit of $25 million related to an adjustment ofdeferred tax liabilities on both repatriated and unrepatriated foreign earnings.
Note 14: Stockholders’ Equity
Dividends
The stockholders of HP common stock are entitled to receive dividends when and as declared byHP’s Board of Directors. Dividends are paid quarterly. Dividends were $0.32 per common share ineach of fiscal 2006, 2005 and 2004.
Stock Repurchase Program
HP’s share repurchase program authorizes both open market and private repurchase transactions.In fiscal 2006, HP completed share repurchases of approximately 188 million shares. Approximately190 million shares were settled for $6.1 billion, which included 2 million shares repurchased intransactions that were executed in fiscal 2005 but settled in fiscal 2006. In fiscal 2005, HP completedshare repurchases of approximately 150 million shares, of which approximately 148 million shares weresettled for $3.5 billion. In fiscal 2004, HP completed share repurchases of approximately 172 millionshares for $3.3 billion. Shares repurchased and settled in fiscal 2006 were all open market repurchases.Shares repurchased and settled in fiscal 2005 included open market repurchases of 37 million shares for$1.0 billion and 111 million shares for $2.5 billion from the David and Lucile Packard Foundation (the‘‘Packard Foundation’’). Shares repurchased and settled in fiscal 2004 included open marketrepurchases of 66 million shares for $1.3 billion, 72 million shares for $1.3 billion under an acceleratedshare repurchase program with an investment bank (the ‘‘Accelerated Purchase’’) and 34 million sharesfor $679 million from the Packard Foundation.
In addition to the above transactions, HP entered into a prepaid variable share purchase program(‘‘PVSPP’’) with a third-party investment bank during the first quarter of 2006 and prepaid $1.7 billionin exchange for the right to receive a variable number of shares of its common stock weekly over a oneyear period beginning in the second quarter of fiscal 2006 and ending during the second quarter offiscal 2007. HP recorded the payment as a prepaid stock repurchase in the stockholders’ equity sectionof its Consolidated Balance Sheet, and the payment was included in the cash flows from financingactivities in the Consolidated Statement of Cash Flows. In connection with this program, the investmentbank has purchased and will continue to trade shares of HP’s common stock in the open market overtime. The prepaid funds will be expended ratably over the term of the program.
115
HEWLETT-PACKARD COMPANY AND SUBSIDIARIES
Notes to Consolidated Financial Statements (Continued)
Note 14: Stockholders’ Equity (Continued)
Under the PVSPP, the prices at which HP purchases the shares are subject to a minimum andmaximum price that was determined in advance of any repurchases being completed under theprogram, thereby effectively hedging HP’s repurchase price. The minimum and maximum number ofshares HP could receive under the program are 52 million shares and 70 million shares, respectively.The exact number of shares to be repurchased is based upon the volume weighted average marketprice of HP’s shares during each weekly settlement period, subject to the minimum and maximum priceas well as regulatory limitations on the number of shares HP is permitted to repurchase. HP decreasesits shares outstanding each settlement period as shares are physically received. HP will retire all sharesrepurchased under the PVSPP, and HP will no longer deem those shares outstanding. In fiscal 2006,HP had received approximately 34 million shares for an aggregate price of $1.1 billion under thePVSPP.
The Accelerated Purchase began on September 2004 and was completed in November 2004. Uponcompletion of the Accelerated Purchase HP paid a $51 million price adjustment based on thedifference between the $18.82 weighted average price of the open market stock purchases by theinvestment bank and the initial purchase price of $18.11 per share. The price adjustment also includedcertain amounts reflecting the investment bank’s carrying costs or benefits from purchasing shares atprices other than the initial price and its benefits from receiving the $1.3 billion payment in advance ofits purchases. HP accounted for the Accelerated Purchase as an equity transaction on the cashsettlement dates.
HP repurchased shares from the Packard Foundation under a memorandum of understandingdated September 9, 2002 and amended and restated September 17, 2004 that, among other things,priced the repurchases by reference to the volume weighted-average price for composite New YorkStock Exchange transactions on trading days in which a repurchase occurred. Either HP or the PackardFoundation may suspend or terminate sales under the amended and restated memorandum ofunderstanding at any time.
HP’s Board of Directors authorized an additional $10.0 billion, $4.0 billion and $5.0 billion forfuture repurchases of outstanding common stock in fiscal 2006, 2005 and 2004, respectively. As ofOctober 31, 2006, HP had remaining authorization of $5.6 billion for future share repurchases.Previously authorized share repurchases also will be made under the PVSPP until the remainingavailable balance is exhausted in the second quarter of fiscal 2007.
116
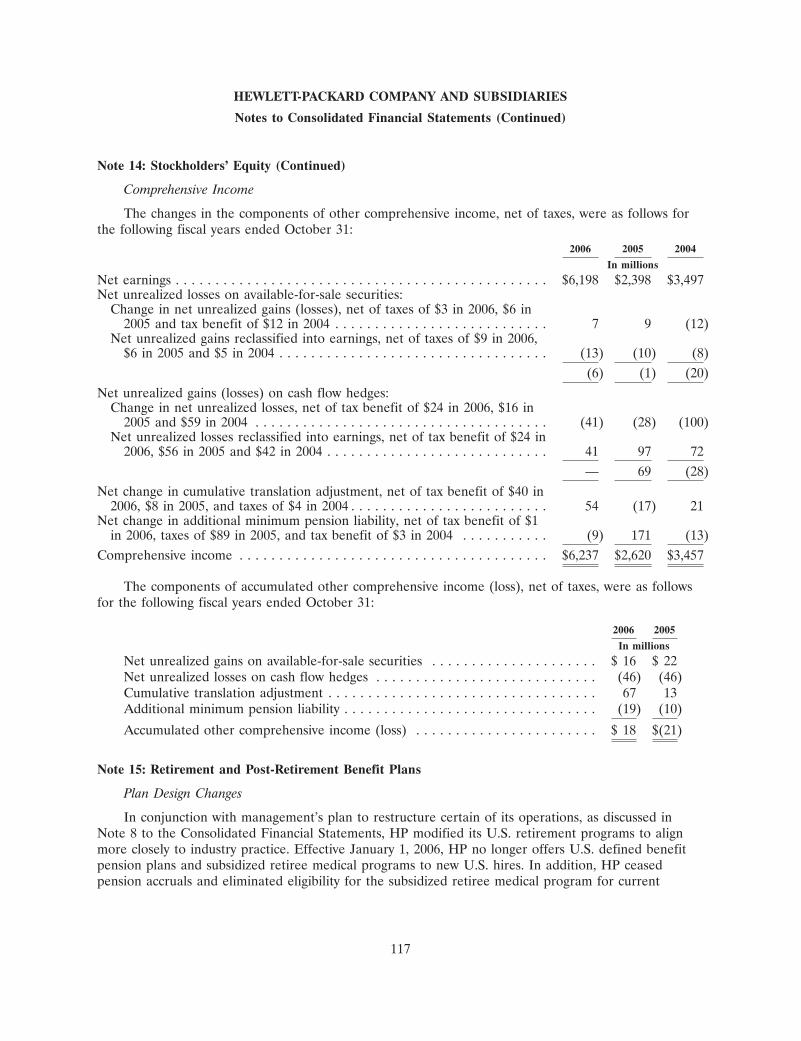
HEWLETT-PACKARD COMPANY AND SUBSIDIARIES
Notes to Consolidated Financial Statements (Continued)
Note 14: Stockholders’ Equity (Continued)
Comprehensive Income
The changes in the components of other comprehensive income, net of taxes, were as follows forthe following fiscal years ended October 31:
2006 2005 2004
In millions
Net earnings . . . . . . . . . . . . . . . . . . . . . . . . . . . . . . . . . . . . . . . . . . . . . . . $6,198 $2,398 $3,497Net unrealized losses on available-for-sale securities:
Change in net unrealized gains (losses), net of taxes of $3 in 2006, $6 in2005 and tax benefit of $12 in 2004 . . . . . . . . . . . . . . . . . . . . . . . . . . . 7 9 (12)
Net unrealized gains reclassified into earnings, net of taxes of $9 in 2006,$6 in 2005 and $5 in 2004 . . . . . . . . . . . . . . . . . . . . . . . . . . . . . . . . . . (13) (10) (8)
(6) (1) (20)Net unrealized gains (losses) on cash flow hedges:
Change in net unrealized losses, net of tax benefit of $24 in 2006, $16 in2005 and $59 in 2004 . . . . . . . . . . . . . . . . . . . . . . . . . . . . . . . . . . . . . (41) (28) (100)
Net unrealized losses reclassified into earnings, net of tax benefit of $24 in2006, $56 in 2005 and $42 in 2004 . . . . . . . . . . . . . . . . . . . . . . . . . . . . 41 97 72
— 69 (28)Net change in cumulative translation adjustment, net of tax benefit of $40 in
2006, $8 in 2005, and taxes of $4 in 2004 . . . . . . . . . . . . . . . . . . . . . . . . . 54 (17) 21Net change in additional minimum pension liability, net of tax benefit of $1
in 2006, taxes of $89 in 2005, and tax benefit of $3 in 2004 . . . . . . . . . . . (9) 171 (13)Comprehensive income . . . . . . . . . . . . . . . . . . . . . . . . . . . . . . . . . . . . . . . $6,237 $2,620 $3,457
The components of accumulated other comprehensive income (loss), net of taxes, were as followsfor the following fiscal years ended October 31:
2006 2005
In millions
Net unrealized gains on available-for-sale securities . . . . . . . . . . . . . . . . . . . . . $ 16 $ 22Net unrealized losses on cash flow hedges . . . . . . . . . . . . . . . . . . . . . . . . . . . . (46) (46)Cumulative translation adjustment . . . . . . . . . . . . . . . . . . . . . . . . . . . . . . . . . . 67 13Additional minimum pension liability . . . . . . . . . . . . . . . . . . . . . . . . . . . . . . . . (19) (10)
Accumulated other comprehensive income (loss) . . . . . . . . . . . . . . . . . . . . . . . $ 18 $(21)
Note 15: Retirement and Post-Retirement Benefit Plans
Plan Design Changes
In conjunction with management’s plan to restructure certain of its operations, as discussed inNote 8 to the Consolidated Financial Statements, HP modified its U.S. retirement programs to alignmore closely to industry practice. Effective January 1, 2006, HP no longer offers U.S. defined benefitpension plans and subsidized retiree medical programs to new U.S. hires. In addition, HP ceasedpension accruals and eliminated eligibility for the subsidized retiree medical program for current
117
HEWLETT-PACKARD COMPANY AND SUBSIDIARIES
Notes to Consolidated Financial Statements (Continued)
Note 15: Retirement and Post-Retirement Benefit Plans (Continued)
employees who did not meet defined criteria based on age and years of service (calculated as ofDecember 31, 2005).
Additionally, the HP subsidy for the retiree medical program will be capped upon reaching twotimes the 2003 subsidy levels.
During fiscal 2006, HP recognized curtailment gains of $24 million for the HP subsidized U.S.retiree medical program. The gains reflected the reduction in the eligible plan population stemmingfrom the U.S. Enhanced Early Retirement program and the restructuring plans implemented in fiscal2005. HP recorded such gains as reductions of restructuring charges. As subsequent headcountreductions take place under the restructuring program, HP expects additional curtailment accounting tooccur for U.S. pension and post-retirement plans during the first quarter of fiscal 2007.
During fiscal 2006, HP also recognized settlement gains of $46 million for the U.S. pension plans.During the measurement period between October 1, 2005 and September 30, 2006, lump-sum benefitpayments were made primarily to pension plan participants who left HP under the U.S. EnhancedEarly Retirement program and the restructuring plans. These lump sum benefit payments represent areduction in the projected benefit obligation. As a result, a portion of the unrecognized gain wasrecognized in fiscal 2006. The gain was recorded in accordance with SFAS No. 88, ‘‘Employers’Accounting for Settlements and Curtailments of Defined Benefit Pension Plans and for TerminationBenefits,’’ which requires that a settlement event be recorded once prescribed payment thresholds havebeen reached. HP recorded the gain as a reduction of restructuring charges in fiscal 2006.
Effective January 1, 2006, HP increased its matching 401(k) contribution to 6% from 4% ofeligible salary for those employees who had their pension and retiree medical-program benefits frozenand for all new employees.
Defined Benefit Plans
HP sponsors a number of defined benefit pension plans worldwide, of which the most significantare in the United States. The HP Retirement Plan (the ‘‘Retirement Plan’’) is a defined benefit pensionplan for U.S. employees hired on or before December 31, 2002. Benefits under the Retirement Plangenerally are based on pay and years of service, except for eligible pre-acquisition Compaq employees,who do not receive credit for years of service prior to January 1, 2003. Effective December 31, 2005,participants whose combination of age plus years of service was less than 62 ceased accruing benefitsunder the Retirement Plan. For U.S employees hired or rehired on or after January 1, 2003, HPsponsors the Hewlett-Packard Company Cash Account Pension Plan (the ‘‘Cash Account PensionPlan’’), under which benefits accrue pursuant to a cash accumulation account formula based upon apercentage of pay plus interest. Effective December 31, 2005, the Cash Account Pension Plan wasclosed to new participants, and participants whose combination of age plus years of service is less than62 ceased accruing benefits.
Effective November 30, 2005, HP merged the Cash Account Pension Plan into the RetirementPlan; the merged plan is treated as one plan for certain legal and financial purposes, including fundingrequirements. The merger has no impact on the separate benefit structures of the plans.
HP reduces the benefit payable to a U.S. employee under the Retirement Plan for service before1993, if any, by any amounts due to the employee under HP’s frozen defined contribution DeferredProfit-Sharing Plan (‘‘the DPSP’’). HP closed the DPSP to new participants in 1993. The DPSP plan
118
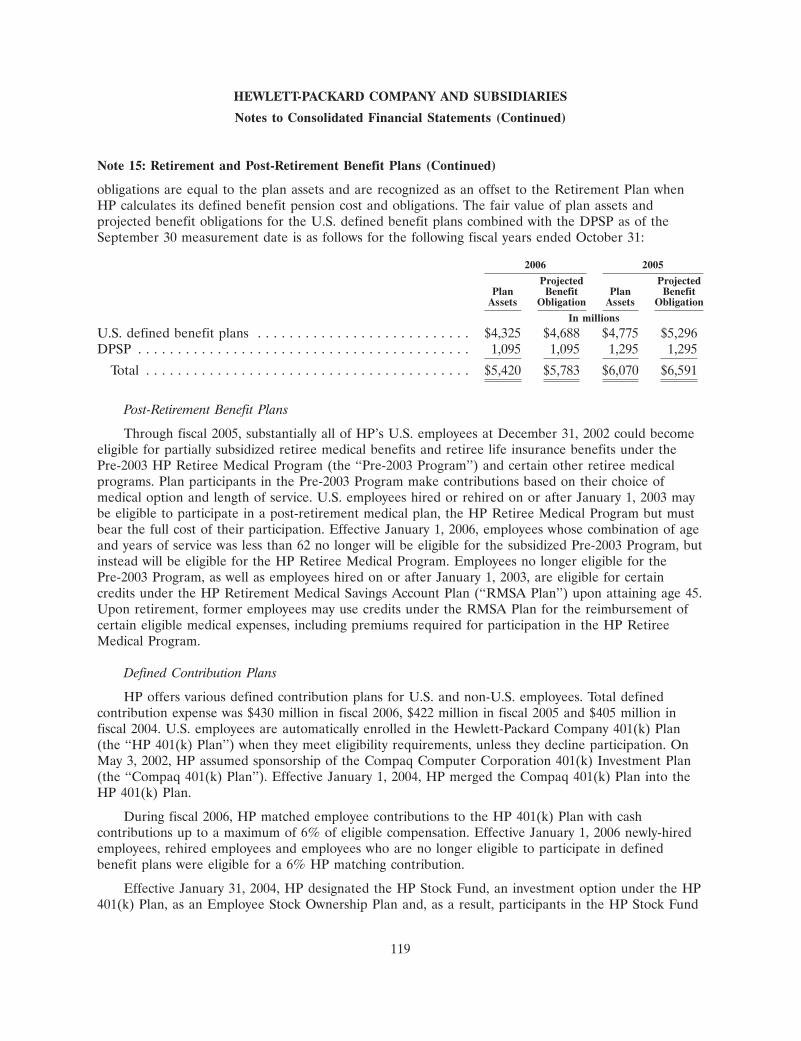
HEWLETT-PACKARD COMPANY AND SUBSIDIARIES
Notes to Consolidated Financial Statements (Continued)
Note 15: Retirement and Post-Retirement Benefit Plans (Continued)
obligations are equal to the plan assets and are recognized as an offset to the Retirement Plan whenHP calculates its defined benefit pension cost and obligations. The fair value of plan assets andprojected benefit obligations for the U.S. defined benefit plans combined with the DPSP as of theSeptember 30 measurement date is as follows for the following fiscal years ended October 31:
2006 2005
Projected ProjectedPlan Benefit Plan Benefit
Assets Obligation Assets Obligation
In millions
U.S. defined benefit plans . . . . . . . . . . . . . . . . . . . . . . . . . . . $4,325 $4,688 $4,775 $5,296DPSP . . . . . . . . . . . . . . . . . . . . . . . . . . . . . . . . . . . . . . . . . . 1,095 1,095 1,295 1,295
Total . . . . . . . . . . . . . . . . . . . . . . . . . . . . . . . . . . . . . . . . . $5,420 $5,783 $6,070 $6,591
Post-Retirement Benefit Plans
Through fiscal 2005, substantially all of HP’s U.S. employees at December 31, 2002 could becomeeligible for partially subsidized retiree medical benefits and retiree life insurance benefits under thePre-2003 HP Retiree Medical Program (the ‘‘Pre-2003 Program’’) and certain other retiree medicalprograms. Plan participants in the Pre-2003 Program make contributions based on their choice ofmedical option and length of service. U.S. employees hired or rehired on or after January 1, 2003 maybe eligible to participate in a post-retirement medical plan, the HP Retiree Medical Program but mustbear the full cost of their participation. Effective January 1, 2006, employees whose combination of ageand years of service was less than 62 no longer will be eligible for the subsidized Pre-2003 Program, butinstead will be eligible for the HP Retiree Medical Program. Employees no longer eligible for thePre-2003 Program, as well as employees hired on or after January 1, 2003, are eligible for certaincredits under the HP Retirement Medical Savings Account Plan (‘‘RMSA Plan’’) upon attaining age 45.Upon retirement, former employees may use credits under the RMSA Plan for the reimbursement ofcertain eligible medical expenses, including premiums required for participation in the HP RetireeMedical Program.
Defined Contribution Plans
HP offers various defined contribution plans for U.S. and non-U.S. employees. Total definedcontribution expense was $430 million in fiscal 2006, $422 million in fiscal 2005 and $405 million infiscal 2004. U.S. employees are automatically enrolled in the Hewlett-Packard Company 401(k) Plan(the ‘‘HP 401(k) Plan’’) when they meet eligibility requirements, unless they decline participation. OnMay 3, 2002, HP assumed sponsorship of the Compaq Computer Corporation 401(k) Investment Plan(the ‘‘Compaq 401(k) Plan’’). Effective January 1, 2004, HP merged the Compaq 401(k) Plan into theHP 401(k) Plan.
During fiscal 2006, HP matched employee contributions to the HP 401(k) Plan with cashcontributions up to a maximum of 6% of eligible compensation. Effective January 1, 2006 newly-hiredemployees, rehired employees and employees who are no longer eligible to participate in definedbenefit plans were eligible for a 6% HP matching contribution.
Effective January 31, 2004, HP designated the HP Stock Fund, an investment option under the HP401(k) Plan, as an Employee Stock Ownership Plan and, as a result, participants in the HP Stock Fund
119
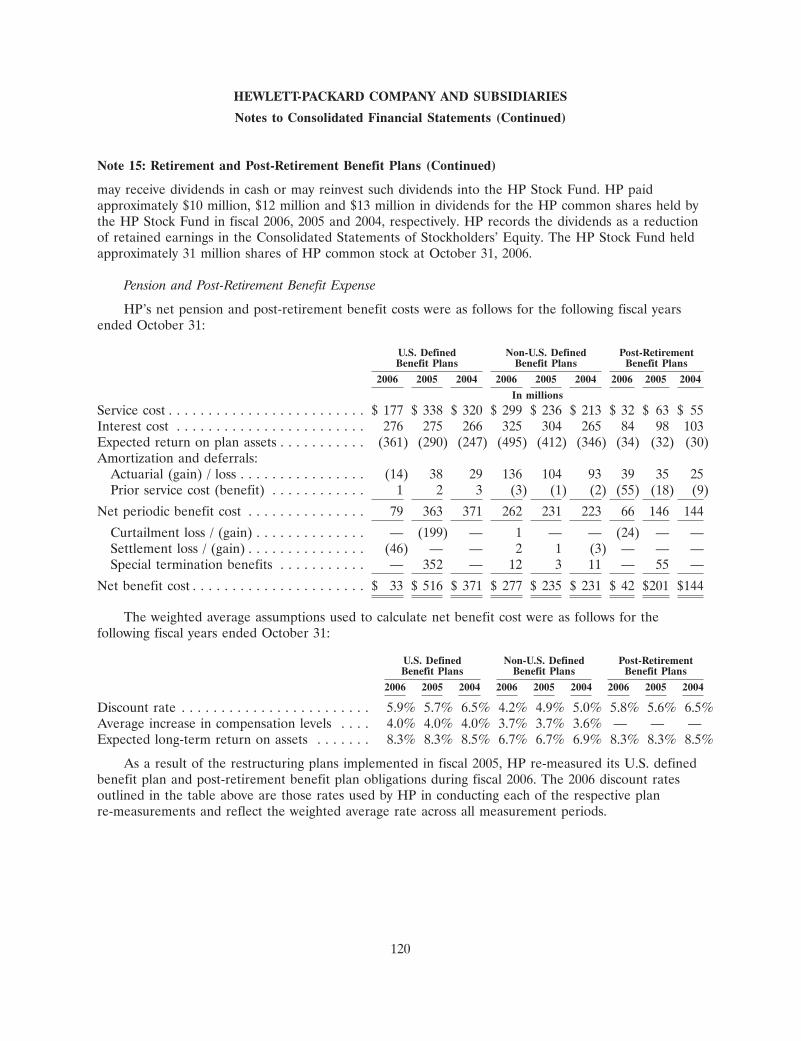
HEWLETT-PACKARD COMPANY AND SUBSIDIARIES
Notes to Consolidated Financial Statements (Continued)
Note 15: Retirement and Post-Retirement Benefit Plans (Continued)
may receive dividends in cash or may reinvest such dividends into the HP Stock Fund. HP paidapproximately $10 million, $12 million and $13 million in dividends for the HP common shares held bythe HP Stock Fund in fiscal 2006, 2005 and 2004, respectively. HP records the dividends as a reductionof retained earnings in the Consolidated Statements of Stockholders’ Equity. The HP Stock Fund heldapproximately 31 million shares of HP common stock at October 31, 2006.
Pension and Post-Retirement Benefit Expense
HP’s net pension and post-retirement benefit costs were as follows for the following fiscal yearsended October 31:
U.S. Defined Non-U.S. Defined Post-RetirementBenefit Plans Benefit Plans Benefit Plans
2006 2005 2004 2006 2005 2004 2006 2005 2004
In millions
Service cost . . . . . . . . . . . . . . . . . . . . . . . . . $ 177 $ 338 $ 320 $ 299 $ 236 $ 213 $ 32 $ 63 $ 55Interest cost . . . . . . . . . . . . . . . . . . . . . . . . 276 275 266 325 304 265 84 98 103Expected return on plan assets . . . . . . . . . . . (361) (290) (247) (495) (412) (346) (34) (32) (30)Amortization and deferrals:
Actuarial (gain) / loss . . . . . . . . . . . . . . . . (14) 38 29 136 104 93 39 35 25Prior service cost (benefit) . . . . . . . . . . . . 1 2 3 (3) (1) (2) (55) (18) (9)
Net periodic benefit cost . . . . . . . . . . . . . . . 79 363 371 262 231 223 66 146 144
Curtailment loss / (gain) . . . . . . . . . . . . . . — (199) — 1 — — (24) — —Settlement loss / (gain) . . . . . . . . . . . . . . . (46) — — 2 1 (3) — — —Special termination benefits . . . . . . . . . . . — 352 — 12 3 11 — 55 —
Net benefit cost . . . . . . . . . . . . . . . . . . . . . . $ 33 $ 516 $ 371 $ 277 $ 235 $ 231 $ 42 $201 $144
The weighted average assumptions used to calculate net benefit cost were as follows for thefollowing fiscal years ended October 31:
U.S. Defined Non-U.S. Defined Post-RetirementBenefit Plans Benefit Plans Benefit Plans
2006 2005 2004 2006 2005 2004 2006 2005 2004
Discount rate . . . . . . . . . . . . . . . . . . . . . . . . 5.9% 5.7% 6.5% 4.2% 4.9% 5.0% 5.8% 5.6% 6.5%Average increase in compensation levels . . . . 4.0% 4.0% 4.0% 3.7% 3.7% 3.6% — — —Expected long-term return on assets . . . . . . . 8.3% 8.3% 8.5% 6.7% 6.7% 6.9% 8.3% 8.3% 8.5%
As a result of the restructuring plans implemented in fiscal 2005, HP re-measured its U.S. definedbenefit plan and post-retirement benefit plan obligations during fiscal 2006. The 2006 discount ratesoutlined in the table above are those rates used by HP in conducting each of the respective planre-measurements and reflect the weighted average rate across all measurement periods.
120

HEWLETT-PACKARD COMPANY AND SUBSIDIARIES
Notes to Consolidated Financial Statements (Continued)
Note 15: Retirement and Post-Retirement Benefit Plans (Continued)
The medical cost and related assumptions used to calculate the net post-retirement benefit cost forthe following fiscal years ended October 31 were as follows:
2006 2005 2004
Current medical cost trend rate . . . . . . . . . . . . . . . . . . . . . . . . . . . . . . . . . . . . . 9.5% 10.5% 11.5%Ultimate medical cost trend rate . . . . . . . . . . . . . . . . . . . . . . . . . . . . . . . . . . . . 5.5% 5.5% 5.5%Year the medical cost rate reaches ultimate trend rate . . . . . . . . . . . . . . . . . . . . 2010 2010 2010
A 1.0 percentage point increase in the medical cost trend rate would have increased the fiscal 2006service and interest components of the post-retirement benefit costs by $1.7 million, while a1.0 percentage point decrease would have resulted in a decrease of $2.1 million in the same period.
121
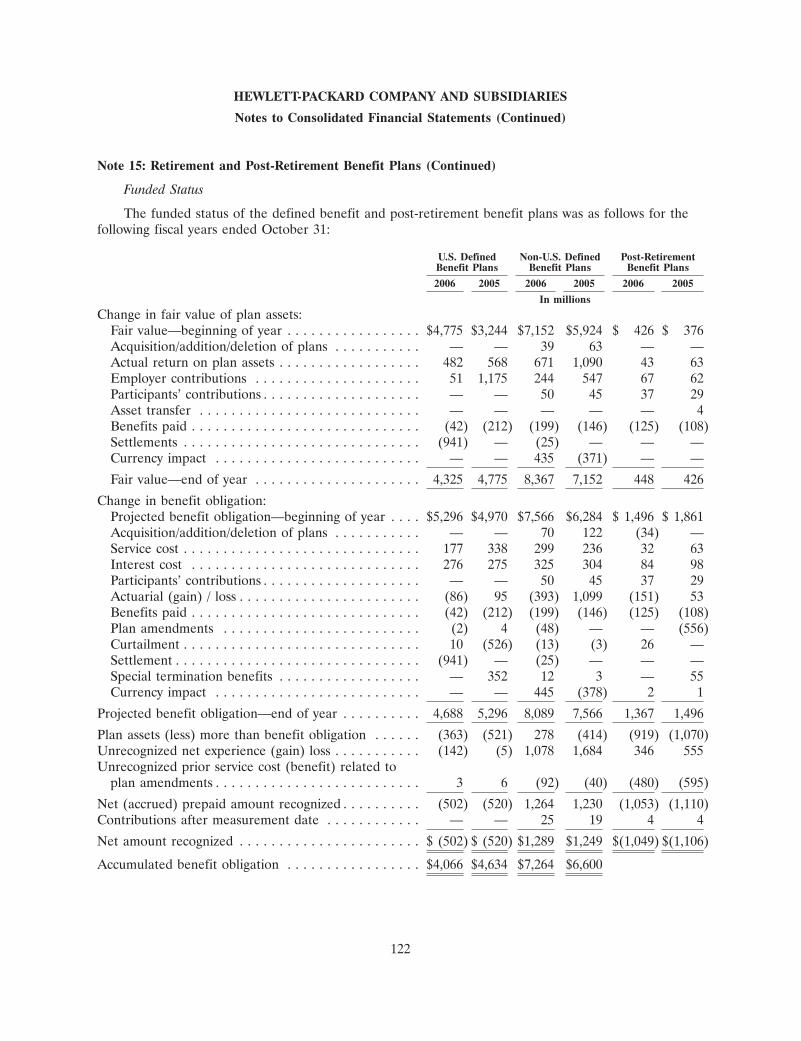
HEWLETT-PACKARD COMPANY AND SUBSIDIARIES
Notes to Consolidated Financial Statements (Continued)
Note 15: Retirement and Post-Retirement Benefit Plans (Continued)
Funded Status
The funded status of the defined benefit and post-retirement benefit plans was as follows for thefollowing fiscal years ended October 31:
U.S. Defined Non-U.S. Defined Post-RetirementBenefit Plans Benefit Plans Benefit Plans
2006 2005 2006 2005 2006 2005
In millions
Change in fair value of plan assets:Fair value—beginning of year . . . . . . . . . . . . . . . . . $4,775 $3,244 $7,152 $5,924 $ 426 $ 376Acquisition/addition/deletion of plans . . . . . . . . . . . — — 39 63 — —Actual return on plan assets . . . . . . . . . . . . . . . . . . 482 568 671 1,090 43 63Employer contributions . . . . . . . . . . . . . . . . . . . . . 51 1,175 244 547 67 62Participants’ contributions . . . . . . . . . . . . . . . . . . . . — — 50 45 37 29Asset transfer . . . . . . . . . . . . . . . . . . . . . . . . . . . . — — — — — 4Benefits paid . . . . . . . . . . . . . . . . . . . . . . . . . . . . . (42) (212) (199) (146) (125) (108)Settlements . . . . . . . . . . . . . . . . . . . . . . . . . . . . . . (941) — (25) — — —Currency impact . . . . . . . . . . . . . . . . . . . . . . . . . . — — 435 (371) — —
Fair value—end of year . . . . . . . . . . . . . . . . . . . . . 4,325 4,775 8,367 7,152 448 426
Change in benefit obligation:Projected benefit obligation—beginning of year . . . . $5,296 $4,970 $7,566 $6,284 $ 1,496 $ 1,861Acquisition/addition/deletion of plans . . . . . . . . . . . — — 70 122 (34) —Service cost . . . . . . . . . . . . . . . . . . . . . . . . . . . . . . 177 338 299 236 32 63Interest cost . . . . . . . . . . . . . . . . . . . . . . . . . . . . . 276 275 325 304 84 98Participants’ contributions . . . . . . . . . . . . . . . . . . . . — — 50 45 37 29Actuarial (gain) / loss . . . . . . . . . . . . . . . . . . . . . . . (86) 95 (393) 1,099 (151) 53Benefits paid . . . . . . . . . . . . . . . . . . . . . . . . . . . . . (42) (212) (199) (146) (125) (108)Plan amendments . . . . . . . . . . . . . . . . . . . . . . . . . (2) 4 (48) — — (556)Curtailment . . . . . . . . . . . . . . . . . . . . . . . . . . . . . . 10 (526) (13) (3) 26 —Settlement . . . . . . . . . . . . . . . . . . . . . . . . . . . . . . . (941) — (25) — — —Special termination benefits . . . . . . . . . . . . . . . . . . — 352 12 3 — 55Currency impact . . . . . . . . . . . . . . . . . . . . . . . . . . — — 445 (378) 2 1
Projected benefit obligation—end of year . . . . . . . . . . 4,688 5,296 8,089 7,566 1,367 1,496
Plan assets (less) more than benefit obligation . . . . . . (363) (521) 278 (414) (919) (1,070)Unrecognized net experience (gain) loss . . . . . . . . . . . (142) (5) 1,078 1,684 346 555Unrecognized prior service cost (benefit) related to
plan amendments . . . . . . . . . . . . . . . . . . . . . . . . . . 3 6 (92) (40) (480) (595)
Net (accrued) prepaid amount recognized . . . . . . . . . . (502) (520) 1,264 1,230 (1,053) (1,110)Contributions after measurement date . . . . . . . . . . . . — — 25 19 4 4
Net amount recognized . . . . . . . . . . . . . . . . . . . . . . . $ (502) $ (520) $1,289 $1,249 $(1,049) $(1,106)
Accumulated benefit obligation . . . . . . . . . . . . . . . . . $4,066 $4,634 $7,264 $6,600
122
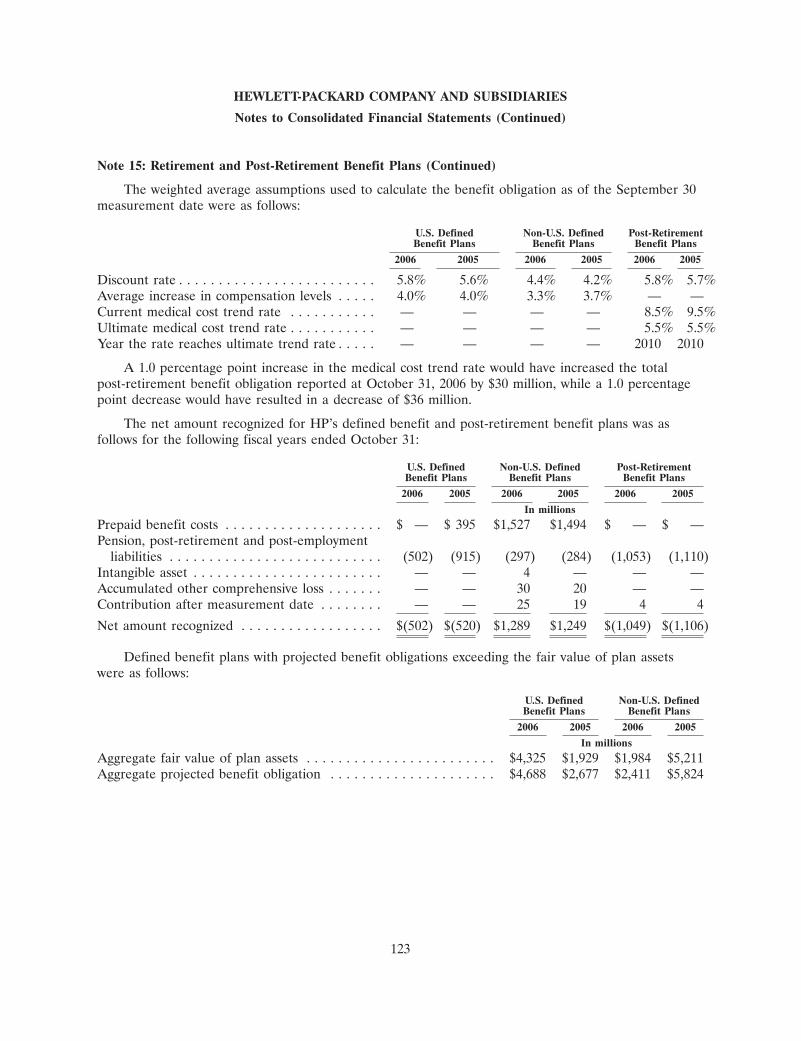
HEWLETT-PACKARD COMPANY AND SUBSIDIARIES
Notes to Consolidated Financial Statements (Continued)
Note 15: Retirement and Post-Retirement Benefit Plans (Continued)
The weighted average assumptions used to calculate the benefit obligation as of the September 30measurement date were as follows:
U.S. Defined Non-U.S. Defined Post-RetirementBenefit Plans Benefit Plans Benefit Plans
2006 2005 2006 2005 2006 2005
Discount rate . . . . . . . . . . . . . . . . . . . . . . . . . 5.8% 5.6% 4.4% 4.2% 5.8% 5.7%Average increase in compensation levels . . . . . 4.0% 4.0% 3.3% 3.7% — —Current medical cost trend rate . . . . . . . . . . . — — — — 8.5% 9.5%Ultimate medical cost trend rate . . . . . . . . . . . — — — — 5.5% 5.5%Year the rate reaches ultimate trend rate . . . . . — — — — 2010 2010
A 1.0 percentage point increase in the medical cost trend rate would have increased the totalpost-retirement benefit obligation reported at October 31, 2006 by $30 million, while a 1.0 percentagepoint decrease would have resulted in a decrease of $36 million.
The net amount recognized for HP’s defined benefit and post-retirement benefit plans was asfollows for the following fiscal years ended October 31:
U.S. Defined Non-U.S. Defined Post-RetirementBenefit Plans Benefit Plans Benefit Plans
2006 2005 2006 2005 2006 2005
In millions
Prepaid benefit costs . . . . . . . . . . . . . . . . . . . . $ — $ 395 $1,527 $1,494 $ — $ —Pension, post-retirement and post-employment
liabilities . . . . . . . . . . . . . . . . . . . . . . . . . . . (502) (915) (297) (284) (1,053) (1,110)Intangible asset . . . . . . . . . . . . . . . . . . . . . . . . — — 4 — — —Accumulated other comprehensive loss . . . . . . . — — 30 20 — —Contribution after measurement date . . . . . . . . — — 25 19 4 4
Net amount recognized . . . . . . . . . . . . . . . . . . $(502) $(520) $1,289 $1,249 $(1,049) $(1,106)
Defined benefit plans with projected benefit obligations exceeding the fair value of plan assetswere as follows:
U.S. Defined Non-U.S. DefinedBenefit Plans Benefit Plans
2006 2005 2006 2005
In millions
Aggregate fair value of plan assets . . . . . . . . . . . . . . . . . . . . . . . . $4,325 $1,929 $1,984 $5,211Aggregate projected benefit obligation . . . . . . . . . . . . . . . . . . . . . $4,688 $2,677 $2,411 $5,824
123
HEWLETT-PACKARD COMPANY AND SUBSIDIARIES
Notes to Consolidated Financial Statements (Continued)
Note 15: Retirement and Post-Retirement Benefit Plans (Continued)
Defined benefit plans with accumulated benefit obligations exceeding the fair value of plan assetswere as follows:
U.S. Defined Non-U.S. DefinedBenefit Plans Benefit Plans
2006 2005 2006 2005
In millions
Aggregate fair value of plan assets . . . . . . . . . . . . . . . . . . . . . . . . . . $ — $ — $350 $311Aggregate accumulated benefit obligation . . . . . . . . . . . . . . . . . . . . . $146 $159 $586 $535
Plan Asset Allocations
HP’s weighted-average target and asset allocations at the September 30 measurement date were asfollows:
U.S. Defined Non-U.S. Defined Post-RetirementBenefit Plans Benefit Plans Benefit Plans
2006 2006 2006Plan Assets Plan Assets Plan AssetsTarget Target TargetAsset Category Allocation 2006 2005 Allocation 2006 2005 Allocation 2006 2005
Public equity securities . . 70.5% 61.3% 63.5% 63.5% 66.8% 68.4%Private equity securities . 3.4% 2.1% — — 8.6% 7.0%Real estate and other . . . 0.3% 0.2% 2.6% 2.5% 0.7% 0.7%
Equity-relatedinvestments . . . . . . . . 73% 74.2% 63.6% 64% 66.1% 66.0% 75% 76.1% 76.1%
Public debt securities . . . 27% 25.8% 22.6% 36% 33.4% 31.9% 25% 23.9% 23.6%Cash . . . . . . . . . . . . . . . — — 13.8% — 0.5% 2.1% — — 0.3%
Total . . . . . . . . . . . . . 100% 100% 100.0% 100% 100.0% 100.0% 100% 100.0% 100.0%
Investment Policy
HP’s investment strategy for worldwide plan assets is to seek a competitive rate of return relativeto an appropriate level of risk. The majority of the plans’ investment managers employ activeinvestment management strategies with the goal of outperforming the broad markets in which theyinvest. Risk management practices include diversification across asset classes and investment styles andperiodic rebalancing toward asset allocation targets. A number of the plans’ investment managers areauthorized to utilize derivatives for investment purposes, and HP occasionally utilizes derivatives toeffect asset allocation changes or to hedge certain investment exposures.
The target asset allocation selected for each plan reflects a risk/return profile HP feels isappropriate relative to each plan’s liability structure and return goals. HP regularly conducts periodicasset-liability studies for U.S. plan assets in order to model various potential asset allocations incomparison to each plan’s forecasted liabilities and liquidity needs. HP invests a portion of the U.S.defined benefit plan assets and post-retirement benefit plan assets in private market securities such asventure capital funds, private debt and private equity to provide diversification and higher expectedreturns.
124
HEWLETT-PACKARD COMPANY AND SUBSIDIARIES
Notes to Consolidated Financial Statements (Continued)
Note 15: Retirement and Post-Retirement Benefit Plans (Continued)
Outside the United States, local regulations require different approaches to target asset allocations,resulting in a higher percentage allocation in fixed income securities. For each country outside the U.S.,the local pension board decides on the target allocation after consideration of local regulations andresults from periodic asset-liability studies. HP’s corporate office acts in a governance role inperiodically reviewing investment strategy and providing a recommended list of investment managersfor each country plan.
Basis for Expected Long-Term Rate of Return on Plan Assets
The expected long-term rate of return on assets for each U.S. plan reflects the expected returnsfor each major asset class in which the plan invests, the weight of each asset class in the target mix, thecorrelations among asset classes and their expected volatilities. Expected asset class returns reflect thecurrent yield on U.S. government bonds and risk premiums for each asset class. In evaluating theexpected long-term rate of return on the plan assets in the United States, HP considers factors such ashistorical risk premiums and current valuations, dividend yields, inflation and expected earnings growthrates. Because HP’s investment policy is to employ primarily active investment managers who seek tooutperform the broader market, the asset class expected returns were adjusted to reflect the expectedadditional returns net of fees.
The approach used to arrive at the expected rate of return on assets for the non-U.S. plans reflectsthe asset allocation policy of each plan to the expected country real returns for equity and fixed incomeinvestments. On an annual basis, HP gathers empirical data from the local country subsidiaries todetermine expected long-term rates of return for equity and fixed income securities. HP then weightsthese expected real rates of return based on country specific allocation mixes adjusted for inflation.
Future Contributions and Funding Policy
In fiscal 2007, HP expects to contribute approximately $120 million to its pension plans andapproximately $15 million to cover benefit payments to U.S. non-qualified plan participants. HP expectsto pay approximately $80 million to cover benefit claims for HP’s post-retirement benefit plans. HP’sfunding policy is to contribute cash to its pension plans so that it meets at least the minimumcontribution requirements, as established by local government and funding and taxing authorities.
In August 2006, the Pension Protection Act of 2006 (the ‘‘Act’’) was enacted into law. While HP isstill evaluating the Act and more IRS guidance is required before HP can fully evaluate its impact, atthis time HP does not expect it to have any significant effect on its current funding strategy for its U.S.pension plans.
125
HEWLETT-PACKARD COMPANY AND SUBSIDIARIES
Notes to Consolidated Financial Statements (Continued)
Note 15: Retirement and Post-Retirement Benefit Plans (Continued)
Estimated Future Benefits Payable
HP estimates that the future benefits payable for the retirement and post-retirement plans in placewere as follows at October 31, 2006:
U.S. Defined Non-U.S. Defined Post-RetirementBenefit Plans Benefit Plans Benefit Plans(1)
In millions
Fiscal year ending October 312007 . . . . . . . . . . . . . . . . . . . . . . . . . . . . . . . $ 337 $ 198 $1092008 . . . . . . . . . . . . . . . . . . . . . . . . . . . . . . . $ 335 $ 176 $1042009 . . . . . . . . . . . . . . . . . . . . . . . . . . . . . . . $ 346 $ 191 $1002010 . . . . . . . . . . . . . . . . . . . . . . . . . . . . . . . $ 362 $ 205 $1032011 . . . . . . . . . . . . . . . . . . . . . . . . . . . . . . . $ 314 $ 229 $106
Next five fiscal years to October 31, 2016 . . . . . . $1,664 $1,601 $555
(1) The estimated future benefits payable for the post-retirement plans are reflected net of theexpected Medicare Part D subsidy.
Note 16: Commitments
HP leases certain real and personal property under non-cancelable operating leases. Certain leasesrequire HP to pay property taxes, insurance and routine maintenance and include escalation clauses.Rent expense was approximately $744 million in fiscal 2006, $770 million in fiscal 2005 and$766 million in fiscal 2004. Sublease rental income was approximately $47 million in fiscal 2006, and$43 million in fiscal 2005 and fiscal 2004, respectively.
Future annual minimum lease payments and sublease rental income commitments, excluding futureobligations included in the restructuring liabilities on the Consolidated Balance Sheets, at October 31,2006 were as follows:
2007 2008 2009 2010 2011 Thereafter
In millions
Minimum lease payments . . . . . . . . . . . . . . . . . . . . . . $506 $410 $308 $226 $169 $446Less: Sublease rental income . . . . . . . . . . . . . . . . . . . . (43) (34) (30) (31) (23) (71)
$463 $376 $278 $195 $146 $375
At October 31, 2006, HP had unconditional purchase obligations of approximately $2.8 billion.These unconditional purchase obligations include agreements to purchase goods or services that areenforceable and legally binding on HP and that specify all significant terms, including fixed orminimum quantities to be purchased, fixed, minimum or variable price provisions and the approximatetiming of the transaction. Purchase obligations exclude agreements that are cancelable without penalty.These unconditional purchase obligations are related principally to cost of sales, inventory and otheritems. Future unconditional purchase obligations at October 31, 2006 were as follows:
2007 2008 2009 2010 2011 Thereafter
In millions
Unconditional purchase obligations . . . . . . . . . . . . . . . $2,052 $277 $227 $187 $11 $23
126
HEWLETT-PACKARD COMPANY AND SUBSIDIARIES
Consolidated Statements of Earnings (Continued)
Note 17: Litigation and Contingencies
HP is involved in lawsuits, claims, investigations and proceedings, including those identified below,consisting of intellectual property, commercial, securities, employment, employee benefits andenvironmental matters, which arise in the ordinary course of business. In accordance with SFAS No. 5,‘‘Accounting for Contingencies,’’ HP records a provision for a liability when management believes thatit is both probable that a liability has been incurred and HP can reasonably estimate the amount of theloss. HP believes it has adequate provisions for any such matters. HP reviews these provisions at leastquarterly and adjusts these provisions to reflect the impact of negotiations, settlements, rulings, adviceof legal counsel and other information and events pertaining to a particular case. Based on itsexperience, HP believes that any damage amounts claimed in the specific matters discussed below arenot a meaningful indicator of HP’s potential liability. Litigation is inherently unpredictable. However,HP believes that it has valid defenses with respect to legal matters pending against it. Nevertheless, it ispossible that cash flows or results of operations could be materially affected in any particular period bythe unfavorable resolution of one or more of these contingencies or because of the diversion ofmanagement’s attention and the creation of significant expenses.
Pending Litigation, Proceedings and Investigations
Copyright levies. As described below, proceedings are ongoing against HP in certain EuropeanUnion (‘‘EU’’) member countries, including litigation in Germany, seeking to impose levies uponequipment (such as multifunction devices (‘‘MFDs’’) and printers) and alleging that these devicesenable producing private copies of copyrighted materials. The total levies due, if imposed, would bebased upon the number of products sold and the per-product amounts of the levies, which vary. SomeEU member countries that do not yet have levies on digital devices are expected to implement similarlegislation to enable them to extend existing levy schemes, while some other EU member countries areexpected to limit the scope of levy schemes and applicability in the digital hardware environment. HP,other companies and various industry associations are opposing the extension of levies to the digitalenvironment and advocating compensation to rights holders through digital rights management systems.
VerwertungsGesellschaft Wort (‘‘VG Wort’’), a collection agency representing certain copyrightholders, instituted non-binding arbitration proceedings against HP in June 2001 in Germany before thearbitration board of the Patent and Trademark Office. The proceedings relate to whether and to whatextent copyright levies for photocopiers should be imposed in accordance with copyright lawsimplemented in Germany on MFDs that allegedly enable the production of copies by private persons.Following unsuccessful arbitration, VG Wort filed a lawsuit against HP in May 2004 in the StuttgartCivil Court in Stuttgart, Germany seeking levies on MFDs sold from 1997 to 2001. On December 22,2004, the court held that HP is liable for payments regarding MFDs sold in Germany and ordered HPto pay VG Wort an amount equal to 5% of the outstanding levies claimed plus interest on MFDs soldin Germany up to December 2001. VG Wort appealed this decision. On July 6, 2005, the StuttgartCourt of Appeals ordered HP to pay VG Wort levies based on the published tariffs for photocopiers inGermany (which range from EUR 38.35 to EUR 613.56 per unit) plus interest on MFDs sold inGermany up to December 2001. HP has appealed the Stuttgart Court of Appeals’ decision to theBundesgerichtshof (the German Federal Supreme Court). On September 26, 2005, VG Wort filed anadditional lawsuit against HP in the Stuttgart Civil Court in Stuttgart, Germany seeking levies onMFDs sold in Germany between 1997 and 2001, as well as for products sold from 2002 onwards. HPfiled a response rejecting the claim in January 2006.
127
HEWLETT-PACKARD COMPANY AND SUBSIDIARIES
Consolidated Statements of Earnings (Continued)
Note 17: Litigation and Contingencies (Continued)
In July 2004, VG Wort filed a separate lawsuit against HP in the Stuttgart Civil Court seekinglevies on printers. On December 22, 2004, the court held that HP is liable for payments regarding allprinters using ASCII code sold in Germany but did not determine the amount payable per unit. HPappealed this decision in January 2005 to the Higher Regional Court of Baden Wuerttemberg. OnMay 11, 2005, the Higher Regional Court issued a decision confirming that levies are due. On June 6,2005, HP filed an appeal to the German Supreme Court in Karlsruhe.
In September 2003, VG Wort filed a lawsuit against Fujitsu Siemens Computer GmbH (‘‘FSC’’) inMunich State Court seeking levies on PCs. This is an industry test case in Germany, and HP hasundertaken to be bound by a final decision. On December 23, 2004, the Munich State Court held thatPCs are subject to a levy and that FSC must pay 12 euros plus compound interest for each PC sold inGermany since March 2001. FSC appealed this decision in January 2005 to the Higher Regional Courtof Bavaria. On December 15, 2005, the Higher Regional Court affirmed the Munich State Courtdecision. FSC filed a notice of appeal with the German Supreme Court in February 2006.
On December 29, 2005, ZPU, a joint association of various German collection societies, institutednon-binding arbitration proceedings against HP before the arbitration board of the Patent andTrademark Office demanding reporting of every PC sold by HP in Germany from January 2002 throughDecember 2005 and seeking a levy of 18.42 euros plus tax for each PC sold during that period. HPfiled a notice of defense in connection with these proceedings in February 2006 and the grounds for itsdefense in May 2006.
Based on industry opposition to the extension of levies to digital products, HP’s assessments of themerits of various proceedings and HP’s estimates of the units impacted and levies, HP has accruedamounts that it believes are adequate to address the matters described above. However, the ultimateresolution of these matters, including the number of units impacted, the amount of levies imposed andthe ability of HP to recover such amounts through increased prices, remains uncertain.
Alvis v. HP is a defective product consumer class action filed in the District Court of JeffersonCounty, Texas in April 2001. In February 2000, a similar suit captioned LaPray v. Compaq was filed inthe District Court of Jefferson County, Texas. The basic allegation is that HP and Compaq soldcomputers containing floppy disk controllers that fail to alert the user to certain floppy disk controllererrors. That failure is alleged to result in data loss or data corruption. The complaints in Alvis andLaPray seek injunctive relief, declaratory relief, unspecified damages and attorneys’ fees. In July 2001, anationwide class was certified in the LaPray case, which the Beaumont Court of Appeals affirmed inJune 2002. The Texas Supreme Court reversed the certification and remanded to the trial court inMay 2004. On March 29, 2005, the Alvis trial court certified a Texas-wide class action for injunctiverelief only, which HP appealed on April 15, 2005. HP’s appeal in the Alvis case is still pending. OnJune 4, 2003, each of Barrett v. HP and Grider v. Compaq was filed in the District Court of ClevelandCounty, Oklahoma, with factual allegations similar to those in Alvis and LaPray. The complaints inBarrett and Grider seek, among other things, specific performance, declaratory relief, unspecifieddamages and attorneys’ fees. On December 22, 2003, the District Court entered an order staying theBarrett case until the conclusion of Alvis. On September 23, 2005, the District Court granted the Griderplaintiffs’ motion to certify a nationwide class action which the Oklahoma Court of Civil Appealsaffirmed on October 13, 2006. On November 5, 2006, HP filed a Petition for Writ of Certiorari with theOklahoma Supreme Court seeking reversal of the lower courts’ decisions. On November 5, 2004,Batiste v. HP (formerly Scott v. HP), and on January 27, 2005, Schultz v. HP (formerly Jurado v. HP),
128
HEWLETT-PACKARD COMPANY AND SUBSIDIARIES
Consolidated Statements of Earnings (Continued)
Note 17: Litigation and Contingencies (Continued)
were filed in state court in San Joaquin County, California, with factual allegations similar to those inLaPray and Alvis, seeking certification of a California-only class, injunctive relief, unspecified damages(including punitive damages), restitution, costs, and attorneys’ fees. On November 27, 2006, the trialcourt granted plaintiff’s motion for class certification and certified the Schultz case as a California-onlyclass. HP intends to file a Petition for Writ of Mandate with the California Court of Appeal seekingreversal of the trial court’s class certification decision. In addition, the Civil Division of the Departmentof Justice, the General Services Administration Office of Inspector General and other Federal agenciesare conducting an investigation of allegations that HP and Compaq made, or caused to be made, falseclaims for payment to the United States for computers known by HP and Compaq to contain defectiveparts or otherwise to perform in a defective manner relating to the same alleged floppy disk controllererrors. HP agreed with the Department of Justice to extend the statute of limitations on itsinvestigation until December 6, 2006. HP is cooperating fully with this investigation.
Barbara’s Sales, et al. v. Intel Corporation, Hewlett-Packard Company, et al. and Neubauer, et al. v.Compaq Computer Corporation are separate lawsuits filed on June 3, 2002 in the Circuit Court, ThirdJudicial District, Madison County, Illinois, alleging that HP and Compaq (along with Intel) misled thepublic by suppressing and concealing the alleged material fact that systems that use the Intel Pentium 4processor are less powerful and slower than systems using the Intel Pentium III processor andprocessors made by a competitor of Intel. The plaintiffs seek unspecified damages, restitution,attorneys’ fees and costs, and certification of a nationwide class. The trial court in the HP actioncertified an Illinois class as to Intel but denied a nationwide class. Both parties appealed the trialcourt’s decision. On July 25, 2006, the Fifth District Appellate Court ruled that the trial court erred inapplying Illinois law in deciding to certify the Illinois class and to deny certification of the nationwideclass and directed the trial court to reconsider those decisions applying California law instead. OnAugust 28, 2006, Intel appealed the Fifth District’s decision to the Illinois Supreme Court, and theIllinois Supreme Court granted Intel’s petition for appeal on November 29, 2006. Proceedings againstHP have been stayed pending resolution of the parties’ appeal of this decision. The class actioncertification against Compaq has been stayed pending resolution of the parties’ appeal in the HPaction. Skold, et al. v. Intel Corporation and Hewlett-Packard Company is a lawsuit to which HP wasjoined on June 14, 2004 that was initially filed in state court in Alameda County, California, basedupon factual allegations similar to those in the Illinois cases. The plaintiffs in the Skold matter alsoseek unspecified damages, restitution, attorneys’ fees and costs, and certification of a nationwide class.The Skold case has since been transferred to state court in Santa Clara County, California.
Feder v. HP (formerly Tyler v. HP) is a lawsuit filed in the United States District Court for theNorthern District of California on June 16, 2005 asserting breach of express and implied warranty,unjust enrichment, violation of the Consumers Legal Remedies Act and deceptive advertising andunfair business practices in violation of California’s Unfair Competition Law. Among other things,plaintiffs alleged that HP employed a ‘‘smart chip’’ in certain inkjet printing products in order toregister ink depletion prematurely and to render the cartridge unusable through a built-in expirationdate that is hidden, not documented in marketing materials to consumers, or both. Plaintiffs alsocontend that consumers received false ink depletion warnings and that the smart chip limits the abilityof consumers to use the cartridge to its full capacity or to choose competitive products. OnSeptember 6, 2005, a lawsuit captioned Ciolino v. HP was filed in the United States District Court forthe Northern District of California. The allegations in the Ciolino case are substantively identical tothose in Feder, and the two cases have been formally consolidated in a single proceeding in the District
129

HEWLETT-PACKARD COMPANY AND SUBSIDIARIES
Consolidated Statements of Earnings (Continued)
Note 17: Litigation and Contingencies (Continued)
Court for the Northern District of California under the caption In Re: HP Inkjet Printer Litigation. Theplaintiffs seek class certification, restitution, damages (including enhanced damages), injunctive relief,interest, costs, and attorneys’ fees. Three related lawsuits filed in California state court, Tyler v. HP(filed in Santa Clara County on February 17, 2005), Obi v. HP (filed in Los Angeles County onFebruary 17, 2005), and Weingart v. HP (filed in Los Angeles County on March 18, 2005), have beendismissed without prejudice by the plaintiffs. In addition, two related lawsuits filed in federal court,namely Grabell v. HP (filed in the District of New Jersey on March 18, 2005) and Just v. HP (filed inthe Eastern District of New York on April 20, 2005), have been dismissed without prejudice by theplaintiffs. Substantially similar allegations have been made against HP and its subsidiary, Hewlett-Packard (Canada) Co., in four Canadian class actions, one commenced in British Columbia inFebruary 2006, two commenced in Quebec in April 2006 and May 2006, respectively, and onecommenced in Ontario in June 2006, all seeking class certification, restitution, declaratory relief,injunctive relief and unspecified statutory, compensatory and punitive damages.
On December 27, 2001, Cornell University and the Cornell Research Foundation, Inc. filed acomplaint, amended on September 6, 2002, against HP in United States District Court for theNorthern District of New York alleging that HP’s PA-RISC 8000 family of microprocessors, and serversand workstations incorporating those processors, infringe a patent assigned to Cornell ResearchFoundation, Inc. that describes a way of executing microprocessor instructions. The complaint seeksdeclaratory and injunctive relief and unspecified damages. On March 26, 2004, the court issued a rulinginterpreting the disputed claim terms in the patent at issue. Trial is expected to commence in mid- tolate 2007. The patent at issue in this litigation, United States Patent No. 4,807,115, expired onFebruary 21, 2006. Therefore, the plaintiffs are no longer entitled to seek injunctive relief against HP.
Miller, et al. v. Hewlett-Packard Company is a lawsuit filed on March 21, 2005 in the United StatesDistrict Court for the District of Idaho on behalf of a putative class of persons who were employed bythird-party temporary service agencies and who performed work at HP facilities in the United States.Plaintiffs claim that they were incorrectly classified as contractors or contingent workers and, as aresult, were wrongfully denied employee benefits covered by the Employment Retirement IncomeSecurity Act of 1974 (‘‘ERISA’’) and benefits not covered by ERISA. Plaintiffs claim they were deniedparticipation in HP’s Share Ownership Plan, service award program, adoption assistance program,credit union, dependent care reimbursement program, educational assistance program, time offprograms, flexible work arrangements, and the 401(k) plan. On May 22, 2005, plaintiffs filed their firstamended complaint, which added a Worker Adjustment and Retraining Notification Act (‘‘WARN’’)claim and defined the class to include those persons who have been, or now are, hired by HP throughagencies to work at HP facilities in the United States from March 21, 2000 through the present whohave been deprived of the full benefit of employee status by being misclassified as contractors,contingent workers or temporary workers or were otherwise misclassed. Plaintiffs seek declaratoryrelief, an injunction, retroactive and prospective benefits and compensation, unspecified damages andenhanced damages, interest, costs and attorneys’ fees. HP successfully moved to dismiss the ERISA andWARN claims. The sole remaining claim being advanced by the remaining plaintiffs in this case is abreach of contract claim.
Digwamaje et al. v. Bank of America et al. is a purported class action lawsuit that names HP andnumerous other multinational corporations as defendants. It was filed on September 27, 2002 in UnitedStates District Court for the Southern District of New York on behalf of current and former SouthAfrican citizens and their survivors who suffered violence and oppression under the apartheid regime.
130

HEWLETT-PACKARD COMPANY AND SUBSIDIARIES
Consolidated Statements of Earnings (Continued)
Note 17: Litigation and Contingencies (Continued)
The lawsuit alleges that HP and other companies helped perpetuate, profited from, and otherwiseaided and abetted the apartheid regime during the period from 1948-1994 by selling products andservices to agencies of the South African government. Claims are based on the Alien Tort Claims Act,the Torture Victims Protection Act, the Racketeer Influenced and Corrupt Organizations Act and statelaw. The complaint seeks, among other things, an accounting, the creation of a historic commission,compensatory damages in excess of $200 billion, punitive damages in excess of $200 billion, costs andattorneys’ fees. On November 29, 2004, the court dismissed with prejudice the plaintiffs’ complaint. InMay 2005, the plaintiffs filed an amended notice of appeal in the United States Court of Appeals forthe Second Circuit. On January 24, 2006, the Second Circuit Court of Appeals heard oral argument onthe plaintiffs’ appeal but has not yet issued a decision.
CSIRO Patent Litigation. Microsoft Corporation, Hewlett-Packard Company, et al. v. CommonwealthScientific and Industrial Research Organisation of Australia is an action filed by HP and two otherplaintiffs on May 9, 2005 in the District Court for the Northern District of California seeking adeclaratory judgment against Commonwealth Scientific and Industrial Research Organisation ofAustralia (‘‘CSIRO’’) that HP’s products employing the IEEE 802.11a and 8.02.11g wireless protocolstandards do not infringe CSIRO’s US patent no. 5,487,069 relating to wireless transmission of data atfrequencies in excess of 10GHz. On September 22, 2005, CSIRO filed an answer and counterclaimsalleging that all HP products which employ those wireless protocol standards infringe the CSIROpatent and seeking damages, including enhanced damages and attorneys fees and costs, and aninjunction against sales of infringing products. On December 12, 2006, CSIRO successfully moved tohave the case transferred to the District Court of the Eastern District of Texas, a court that has grantedCSIRO’s motions for summary judgment on the issues of validity and patent infringement in a patentinfringement action brought by CSIRO against a third party vendor of wireless networking productsbased on the same patent.
Leak Investigation Proceedings. As described below, HP is the subject of various governmentalinquiries concerning the processes employed in an investigation into leaks of HP confidentialinformation to members of the media:
• In August 2006, HP was informally contacted by the Attorney General of the State of Californiarequesting information concerning the processes employed in the leak investigation.
• Beginning in September 2006, HP has received requests from the Committee on Energy andCommerce of the U.S. House of Representatives (the ‘‘Committee’’) for records and informationconcerning the leak investigation, securities transactions by HP officers and directors, includingan August 25, 2006 securities transaction by Mark Hurd, HP’s Chairman and Chief ExecutiveOfficer, and related matters. HP has responded and is continuing to respond to those requests.In addition, Mr. Hurd voluntarily gave testimony before the Committee regarding the leakinvestigation on September 28, 2006.
• In September 2006, HP was informally contacted by the United States Attorney’s Office for theNorthern District of California requesting similar information concerning the processesemployed in the leak investigation. HP is responding to that request.
• Beginning in September 2006, HP has received requests from the Division of Enforcement ofthe Securities and Exchange Commission for records and information and interviews withcurrent and former HP directors and officers relating to the leak investigation, the resignation of
131
HEWLETT-PACKARD COMPANY AND SUBSIDIARIES
Consolidated Statements of Earnings (Continued)
Note 17: Litigation and Contingencies (Continued)
Thomas J. Perkins from HP’s Board of Directors, HP’s May 22, 2006 and September 6, 2006filings with the Commission on Form 8-K, stock repurchases by HP and securities transactionsby its officers and directors that occurred between May 1 and October 1, 2006, and HP’spolicies, practices and approval of securities transactions. The Commission has issued a formalorder of investigation in connection with its inquiry. HP has responded and is continuing torespond to those requests.
• In September 2006, HP received a request from the Federal Communications Commission forrecords and information relating to the processes employed in the leak investigation. HP isresponding to that request.
HP is continuing to cooperate fully with all ongoing inquiries and investigations.
On December 7, 2006, HP announced that it has entered into an agreement with the CaliforniaAttorney General to resolve civil claims arising from the leak investigation, including a claim made bythe California Attorney General in a Santa Clara County Superior Court action filed on December 7,2006 that HP committed unfair business practices under California law in connection with the leakinvestigation. As a result of this agreement, which includes an injunction, the California AttorneyGeneral will not pursue civil claims against HP or its current and former directors, officers andemployees. Under the terms of the agreement, HP will pay a total of $14.5 million and implement andmaintain for five years a series of measures designed to ensure that HP’s corporate investigations areconducted in accordance with California law and the company’s high ethical standards. Of the$14.5 million, $13.5 million will be used to create a Privacy and Piracy Fund to assist Californiaprosecutors in investigating and prosecuting consumer privacy and information piracy violations,$650,000 will be used to pay statutory damages and $350,000 will reimburse the California AttorneyGeneral’s office for its investigation costs. There was no finding of liability against HP as part of thesettlement.
In addition, four stockholder derivative lawsuits have been filed in California purportedly on behalfof HP stockholders seeking to recover damages for alleged breach of fiduciary duty and to require HPto improve its corporate governance and internal control procedures as a result of the activities of theleak investigation: Staehr v. Dunn, et al. was filed in Santa Clara County Superior Court onSeptember 18, 2006; Worsham v. Dunn, et al. was filed in Santa Clara County Superior Court onSeptember 14, 2006; Tansey v. Dunn, et al. was filed in Santa Clara County Superior Court onSeptember 20, 2006; and Hall v. Dunn, et al. was filed in Santa Clara County Superior Court onSeptember 25, 2006. On October 19, 2006, the Santa Clara County Superior Court consolidated thefour California cases under the caption In re Hewlett-Packard Company Derivative Litigation. Theconsolidated complaint filed on November 19, 2006 also seeks to recover damages in connection withsales of HP stock alleged to have been made by certain current and former HP officers and directorswhile in possession of material non-public information. An additional stockholder derivative lawsuit,Pifko v. Babbio, et al., was filed in Chancery Court, County of New Castle, Delaware, on September 19,2006 seeking to recover damages for alleged breaches of fiduciary duty and to obtain an orderinstructing the defendants to refrain from further breaches of fiduciary duty and to implementcorrective measures that will prevent future occurrences of the alleged breaches of fiduciary duty. TheHP Board of Directors has appointed a Special Litigation Committee consisting of independent Boardmembers authorized to investigate, review, and evaluate the facts and circumstances asserted in thesederivative matters and to determine how HP should proceed in these matters.
132
HEWLETT-PACKARD COMPANY AND SUBSIDIARIES
Consolidated Statements of Earnings (Continued)
Note 17: Litigation and Contingencies (Continued)
European Commission OEM Investigation. In May 2002, the European Commission of the EUpublicly stated that it was considering conducting an investigation into original equipment manufactureractivities concerning the sales of printers and supplies to consumers within the EU. The EuropeanCommission contacted HP requesting information on the printing systems businesses. HP hascooperated fully with this inquiry.
Settled and Concluded Litigation, Proceedings and Investigations
Compression Labs Patent Litigation. On October 25, 2006, HP and 22 other companies enteredinto a Patent License and Settlement Agreement with Compression Labs, Inc., a subsidiary of ForgentNetworks (‘‘CLI’’), to resolve all outstanding patent infringement litigation with CLI related to U.S.Patent No. 4,698,672 (the ‘‘‘672 Patent’’). The settlement agreement results in the dismissal withprejudice of Compression Labs, Inc. v. HP et al., a lawsuit filed by CLI on April 22, 2004 in the UnitedStates District Court for the Eastern District of Texas and subsequently consolidated for pre-trialproceedings in the Northern District of California with nine other similar lawsuits between CLI andone or more of the defendants. CLI sought unspecified damages, interest, costs and attorneys’ fees foralleged infringement of the ‘672 Patent, which CLI asserted was infringed by the JPEG still-imagecompression standard. Under the terms of the settlement agreement, the defendants agreed to pay CLIan aggregate of $8 million (a portion of which was paid by HP), and CLI granted HP and the otherdefendants a worldwide, nonexclusive, fully paid-up and irrevocable license in exchange.
Environmental
HP is party to, or otherwise involved in, proceedings brought by United States or stateenvironmental agencies under the Comprehensive Environmental Response, Compensation andLiability Act (‘‘CERCLA’’), known as ‘‘Superfund,’’ or state laws similar to CERCLA. HP is alsoconducting environmental investigations or remediations at several current or former operating sitespursuant to administrative orders or consent agreements with state environmental agencies. It is ourpolicy to apply strict standards for environmental protection to sites inside and outside the UnitedStates, even if not subject to regulations imposed by local governments.
The European Union (‘‘EU’’) has enacted the Waste Electrical and Electronic EquipmentDirective, which makes producers of electrical goods, including computers and printers, financiallyresponsible for specified collection, recycling, treatment and disposal of past and future coveredproducts. The deadline for the individual member states of the EU to enact the directive in theirrespective countries was August 13, 2004 (such legislation, together with the directive, the ‘‘WEEELegislation’’). Producers participating in the market were financially responsible for implementing theseresponsibilities under the WEEE Legislation beginning in August 2005. Implementation in certain ofthe member states has been delayed into 2006 and 2007. Similar legislation has been or may be enactedin other jurisdictions, including in the United States, Canada, Mexico, China and Japan. HP iscontinuing to evaluate the impact of the WEEE Legislation and similar legislation in other jurisdictionsas individual countries issue their implementation guidance.
The liability for environmental remediation and other environmental costs is accrued when it isconsidered probable and the costs can be reasonably estimated. We have accrued amounts inconjunction with the foregoing environmental issues that we believe was adequate as of October 31,2006. These accruals were not material to our operations or financial position, and we do not currentlyanticipate material capital expenditures for environmental control facilities.
133

HEWLETT-PACKARD COMPANY AND SUBSIDIARIES
Notes to Consolidated Financial Statements (Continued)
Note 18: Segment Information
Description of Segments
HP is a leading global provider of products, technologies, software, solutions and services toindividual consumers, small and medium sized businesses (‘‘SMBs’’), and large enterprises including thepublic and education sectors. HP’s offerings span personal computing and other access devices, imagingand printing-related products and services, enterprise information technology infrastructure, includingenterprise storage and server technology, enterprise system and network management software, andmulti-vendor customer services including technology support and maintenance, consulting andintegration and managed services.
During fiscal 2006, HP and its operations are organized into seven business segments: EnterpriseStorage and Servers (‘‘ESS’’), HP Services (‘‘HPS’’), Software, the Personal Systems Group (‘‘PSG’’),the Imaging and Printing Group (‘‘IPG’’), HP Financial Services (‘‘HPFS’’), and Corporate Investments.HP’s organizational structure is based on a number of factors that management uses to evaluate, viewand run its business operations, which include, but are not limited to, customer base, homogeneity ofproducts and technology. The business segments disclosed in the Consolidated Financial Statements arebased on this organizational structure and information reviewed by HP’s management to evaluate thebusiness segment results. ESS, HPS and Software are structured beneath a broader TechnologySolutions Group (‘‘TSG’’). In order to provide a supplementary view of HP’s business, aggregatedfinancial data for TSG is presented herein.
HP has reclassified segment operating results for fiscal 2005 and 2004 to conform to certain minorfiscal 2006 organizational realignments. Future changes to this organizational structure may result inchanges to the business segments disclosed. A description of the types of products and servicesprovided by each business segment follows.
Technology Solutions Group. Each of the business segments within TSG is described in detail below.
• Enterprise Storage and Servers provides storage and server products. The various server offeringsrange from low-end servers to high-end scalable servers, including the Superdome line. Industrystandard servers include primarily entry-level and mid-range ProLiant servers, which runprimarily on the Windows�(1), Linux and Novell operating systems and leverage IntelCorporation (‘‘Intel’’) and Advanced Micro Devices (‘‘AMD’’) processors. The business spans arange of product lines, including pedestal-tower servers, density-optimized rack servers and HP’sBladeSystem family of blade servers. Business Critical Systems include Itanium�(2)-basedIntegrity servers running on HP-UX, Windows�, Linux and OpenVMS operating systems,including the high-end Superdome servers and fault-tolerant Integrity NonStop servers. BusinessCritical Systems also include the Reduced Instruction Set Computing (‘‘RISC’’)-based serverswith the HP 9000 line running on the HP-UX operating system, HP AlphaServers running onboth Tru64 UNIX�(3)and OpenVMS, and MIPs-based NonStop servers. HP’s StorageWorksofferings include entry-level, mid-range and high-end arrays, storage area networks (‘‘SANs’’),network attached storage (‘‘NAS’’), storage management software, and virtualizationtechnologies, as well as tape drives, tape libraries and optical archival storage.
(1) Windows� is a registered trademark of Microsoft Corporation.(2) Itanium� is a registered trademark of Intel Corporation.(3) UNIX� is a registered trademark of The Open Group.
134
HEWLETT-PACKARD COMPANY AND SUBSIDIARIES
Notes to Consolidated Financial Statements (Continued)
Note 18: Segment Information (Continued)
• HP Services provides a portfolio of multi-vendor IT services including technology services,consulting and integration and managed services, also known as outsourcing. HPS also offers avariety of services tailored to particular industries such as communications, media andentertainment, manufacturing and distribution, financial services, and the public sector, includinggovernment and education services. HPS collaborates with the Enterprise Storage and Servers,and Software groups, as well as with third-party system integrators and software and networkingcompanies to bring solutions to HP customers. HPS also works with HP’s Imaging and PrintingGroup and Personal Systems Group to provide managed print services, end user workplaceservices, and mobile workforce productivity solutions to enterprise customers. TechnologyServices provides a range of services, including standalone product support, high availabilityservices for complex, global, networked, multi-vendor environments and business continuity andrecovery services. Technology Services also manages the delivery of product warranty supportthrough its own service organization, as well as through authorized partners. Consulting andIntegration provides services to architect, design and implement technology and industry-specificsolutions for customers. Consulting and Integration also provides cross-industry solutions in theareas of architecture and governance, infrastructure, applications and packaged applications,security, IT service management, information management and enterprise Microsoft solutions.Managed Services offers IT management services, including comprehensive outsourcing,transformational infrastructure services, client computing managed services, managed webservices, application services, and business process outsourcing.
• Software provides management software solutions, including support, that allow enterprisecustomers to manage their IT infrastructure, operations, applications, IT services and businessprocesses under the HP OpenView brand. In addition, Software delivers a suite ofcomprehensive, carrier-grade software platforms for developing and deploying next-generationvoice, data and converged services to network and service providers under the HP OpenCallbrand. In November 2006, HP completed its acquisition of Mercury. The acquisition willcombine Mercury’s application management, application delivery and IT governance capabilitieswith HP’s broad portfolio of management solutions.
HP’s other business segments are described below.
• Personal Systems Group provides commercial PCs, consumer PCs, workstations, handheldcomputing devices, digital entertainment systems, calculators and other related accessories,software and services for the commercial and consumer markets. Commercial PCs are optimizedfor commercial uses, including enterprise and SMB customers, and for connectivity andmanageability in networked environments. Commercial PCs include the HP Compaq businessdesktops and business notebooks as well as the HP Compaq Tablet PCs. Consumer PCs aretargeted at the home user and include the HP Pavilion and Compaq Presario series of multi-media consumer desktop PCs and notebook PCs, as well as HP Media Center PCs. Workstationsare individual computing products designed for users demanding enhanced performance, such ascomputer animation, engineering design and other programs requiring high-resolution graphics.Workstations run on UNIX�, Windows� and Linux-based operating systems. Handheldcomputing devices include a series of HP iPAQ Pocket PC handheld computing devices, rangingfrom value devices such as music or Global Positioning System receivers to advanced deviceswith voice and data capability, that run on Windows� Mobile software. Digital entertainment
135
HEWLETT-PACKARD COMPANY AND SUBSIDIARIES
Notes to Consolidated Financial Statements (Continued)
Note 18: Segment Information (Continued)
products include plasma and LCD flat-panel televisions, the HP Digital Entertainment Center,HD DVD and RW drives, and DVD writers.
• Imaging and Printing Group provides consumer and commercial printer hardware, printingsupplies, printing media and scanning devices. IPG is also focused on imaging solutions in thecommercial markets, from managed print services solutions to addressing new growthopportunities in commercial printing in areas such as industrial applications, outdoor signage,and the graphic arts business. Inkjet systems include desktop single function and inkjet all-in-oneprinters, including photo, productivity and business inkjet printers and scanners. Digital imagingproducts and services include photo specialty printers, photo kiosks, digital cameras, accessoriesand online photo services through Snapfish in North America. LaserJet systems includemonochrome and color laser printers, printer-based MFDs and Total Print ManagementSolutions for enterprise customers. Graphics and Imaging products include large format(DesignJet) printers, Indigo and Scitex digital presses, digital publishing solutions and graphicsprinting solutions. Printer supplies include LaserJet toner and inkjet printer cartridges and otherrelated printing media such as HP-branded Vivera and ColorSphere ink and HP Premium andPremium Plus photo papers.
• HP Financial Services supports and enhances HP’s global product and services solutions,providing a broad range of value-added financial life cycle management services. HPFS enablesHP’s worldwide customers to acquire complete IT solutions, including hardware, software andservices. HPFS offers leasing, financing, utility programs, and asset recovery services, as well asfinancial asset management services, for large global and enterprise customers. HPFS alsoprovides an array of specialized financial services to SMBs and educational and governmentalentities. HPFS offers innovative, customized and flexible alternatives to balance unique customercash flow, technology obsolescence and capacity needs.
• Corporate Investments is managed by the Office of Strategy and Technology and includes HPLabs and certain business incubation projects. Revenue in this segment is attributable to the saleof certain network infrastructure products, including Ethernet switch products that enhancecomputing and enterprise solutions under the brand ‘‘ProCurve Networking’’, as well as thelicensing of specific HP technology to third parties.
Segment Data
HP derives the results of the business segments directly from its internal management reportingsystem. The accounting policies HP uses to derive business segment results are substantially the sameas those the consolidated company uses. Management measures the performance of each businesssegment based on several metrics, including earnings from operations. Management uses these results,in part, to evaluate the performance of, and to assign resources to, each of the business segments. HPdoes not allocate to its business segments certain operating expenses, which it manages separately atthe corporate level. These unallocated costs include primarily amortization of purchased intangibleassets, stock-based compensation expense related to HP-granted employee stock options and theemployee stock purchase plan, certain acquisition-related charges and charges for purchased IPR&D, aswell as certain corporate governance costs.
HP does not allocate to its business segments restructuring charges and any associated adjustmentsrelated to restructuring actions. Workforce rebalancing charges, which include involuntary workforce
136
HEWLETT-PACKARD COMPANY AND SUBSIDIARIES
Notes to Consolidated Financial Statements (Continued)
Note 18: Segment Information (Continued)
reductions and voluntary severance incentives, recorded in the six months ended April 30, 2005 havebeen included in business segment results.
Selected operating results information for each business segment was as follows for the followingfiscal years ended October 31:
Earnings (Loss) fromTotal Net Revenue Operations
2006 2005 2004 2006 2005 2004
In millions
Enterprise Storage and Servers . . . . . . . . . . . . . . . . . $17,308 $16,717 $15,084 $1,446 $ 800 $ 157HP Services . . . . . . . . . . . . . . . . . . . . . . . . . . . . . . . 15,617 15,536 13,848 1,507 1,151 1,282Software . . . . . . . . . . . . . . . . . . . . . . . . . . . . . . . . . 1,301 1,061 923 85 (49) (152)
Technology Solutions Group . . . . . . . . . . . . . . . . . . 34,226 33,314 29,855 3,038 1,902 1,287
Personal Systems Group . . . . . . . . . . . . . . . . . . . . . . 29,166 26,741 24,622 1,152 657 205Imaging and Printing Group . . . . . . . . . . . . . . . . . . . 26,786 25,155 24,199 3,978 3,413 3,843HP Financial Services . . . . . . . . . . . . . . . . . . . . . . . . 2,078 2,102 1,895 147 213 125Corporate Investments . . . . . . . . . . . . . . . . . . . . . . . 566 523 449 (151) (174) (179)
Segment total . . . . . . . . . . . . . . . . . . . . . . . . . . . . . . $92,822 $87,835 $81,020 $8,164 $6,011 $5,281
The reconciliation of segment operating results information to HP consolidated totals was asfollows for the following fiscal years ended October 31:
2006 2005 2004
In millions
Net revenue:Segment total . . . . . . . . . . . . . . . . . . . . . . . . . . . . . . . . . . . . . . . . . . . $92,822 $87,835 $81,020Elimination of intersegment net revenue and other . . . . . . . . . . . . . . . . (1,164) (1,139) (1,115)
Total HP consolidated net revenue . . . . . . . . . . . . . . . . . . . . . . . . . . . . $91,658 $86,696 $79,905
Earnings before taxes:Total segment earnings from operations . . . . . . . . . . . . . . . . . . . . . . . . . $ 8,164 $ 6,011 $ 5,281Corporate and unallocated costs and eliminations . . . . . . . . . . . . . . . . . (331) (429) (246)Unallocated costs related to certain stock-based compensation expense . . (459) — —Pension curtailment gain . . . . . . . . . . . . . . . . . . . . . . . . . . . . . . . . . . . . — 199 —Restructuring charges . . . . . . . . . . . . . . . . . . . . . . . . . . . . . . . . . . . . . . (158) (1,684) (114)In-process research and development charges . . . . . . . . . . . . . . . . . . . . . (52) (2) (37)Acquisition-related charges . . . . . . . . . . . . . . . . . . . . . . . . . . . . . . . . . . — — (54)Amortization of purchased intangible assets . . . . . . . . . . . . . . . . . . . . . . (604) (622) (603)Interest and other, net . . . . . . . . . . . . . . . . . . . . . . . . . . . . . . . . . . . . . 606 189 35Gains (losses) on investments . . . . . . . . . . . . . . . . . . . . . . . . . . . . . . . . 25 (13) 4Dispute settlement . . . . . . . . . . . . . . . . . . . . . . . . . . . . . . . . . . . . . . . . — (106) (70)
Total HP consolidated earnings before taxes . . . . . . . . . . . . . . . . . . . . . $ 7,191 $ 3,543 $ 4,196
137

HEWLETT-PACKARD COMPANY AND SUBSIDIARIES
Notes to Consolidated Financial Statements (Continued)
Note 18: Segment Information (Continued)
HP allocates its assets to its business segments based on the primary segments benefiting from theassets. Corporate and unallocated assets are composed primarily of cash and cash equivalents. Asdescribed above, fiscal 2006 segment asset information is stated based on the fiscal 2006 organizationalstructure. Total assets by segment as well as for TSG and the reconciliation of segment assets to HPconsolidated total assets were as follows at October 31:
2006 2005 2004
In millions
Enterprise Storage and Servers . . . . . . . . . . . . . . . . . . . . . . . . . . . . . . . $13,647 $13,591 $13,856HP Services . . . . . . . . . . . . . . . . . . . . . . . . . . . . . . . . . . . . . . . . . . . . . 15,712 15,381 14,619Software . . . . . . . . . . . . . . . . . . . . . . . . . . . . . . . . . . . . . . . . . . . . . . . 1,909 1,408 1,422
Technology Solutions Group . . . . . . . . . . . . . . . . . . . . . . . . . . . . . . . $31,268 $30,380 $29,897
Personal Systems Group . . . . . . . . . . . . . . . . . . . . . . . . . . . . . . . . . . . . 12,237 11,277 10,622Imaging and Printing Group . . . . . . . . . . . . . . . . . . . . . . . . . . . . . . . . . 13,889 13,523 14,169HP Financial Services . . . . . . . . . . . . . . . . . . . . . . . . . . . . . . . . . . . . . . 7,927 7,856 7,992Corporate Investments . . . . . . . . . . . . . . . . . . . . . . . . . . . . . . . . . . . . . 305 297 375Corporate and unallocated assets . . . . . . . . . . . . . . . . . . . . . . . . . . . . . 16,355 13,984 13,083
Total HP consolidated assets . . . . . . . . . . . . . . . . . . . . . . . . . . . . . . . . . $81,981 $77,317 $76,138
Major Customers
No single customer represented 10% or more of HP’s total net revenue in any fiscal yearpresented.
Geographic Information
Net revenue, classified by the major geographic areas in which HP operates, was as follows for thefollowing fiscal years ended October 31:
2006 2005 2004
In millions
Net revenue:U.S. . . . . . . . . . . . . . . . . . . . . . . . . . . . . . . . . . . . . . $32,244 $30,548 $29,362Non-U.S. . . . . . . . . . . . . . . . . . . . . . . . . . . . . . . . . . 59,414 56,148 50,543
Total HP consolidated net revenue . . . . . . . . . . . . . . . $91,658 $86,696 $79,905
Net revenue by geographic area is based upon the sales location that predominately represents thecustomer location. No single country outside of the United States represented more than 10% of HP’stotal consolidated net revenue in any period presented. At October 31, 2006, Belgium and theNetherlands each represented 10% or more of HP’s total consolidated net assets. At October 31, 2005,no single country outside of the United States represented 10% or more of HP’s total consolidated netassets. At October 31, 2004, the Netherlands represented 10% or more of HP’s total consolidated netassets. No single country outside of the United States represented more than 10% of HP’s totalconsolidated net property, plant and equipment in any period presented. HP’s long-lived assets otherthan goodwill and purchased intangible assets, which HP does not allocate to specific geographic
138
HEWLETT-PACKARD COMPANY AND SUBSIDIARIES
Notes to Consolidated Financial Statements (Continued)
Note 18: Segment Information (Continued)
locations as it is impracticable for HP to do so, are composed principally of net property, plant andequipment.
Net property, plant and equipment, classified by major geographic areas in which HP operates, wasas follows for the following fiscal years ended October 31:
2006 2005 2004
In millions
Net property, plant and equipment:U.S. . . . . . . . . . . . . . . . . . . . . . . . . . . . . . . . . . . . . . . . . $3,710 $3,427 $3,418Non-U.S. . . . . . . . . . . . . . . . . . . . . . . . . . . . . . . . . . . . . 3,153 3,024 3,231
Total HP consolidated net property, plant and equipment . $6,863 $6,451 $6,649
139
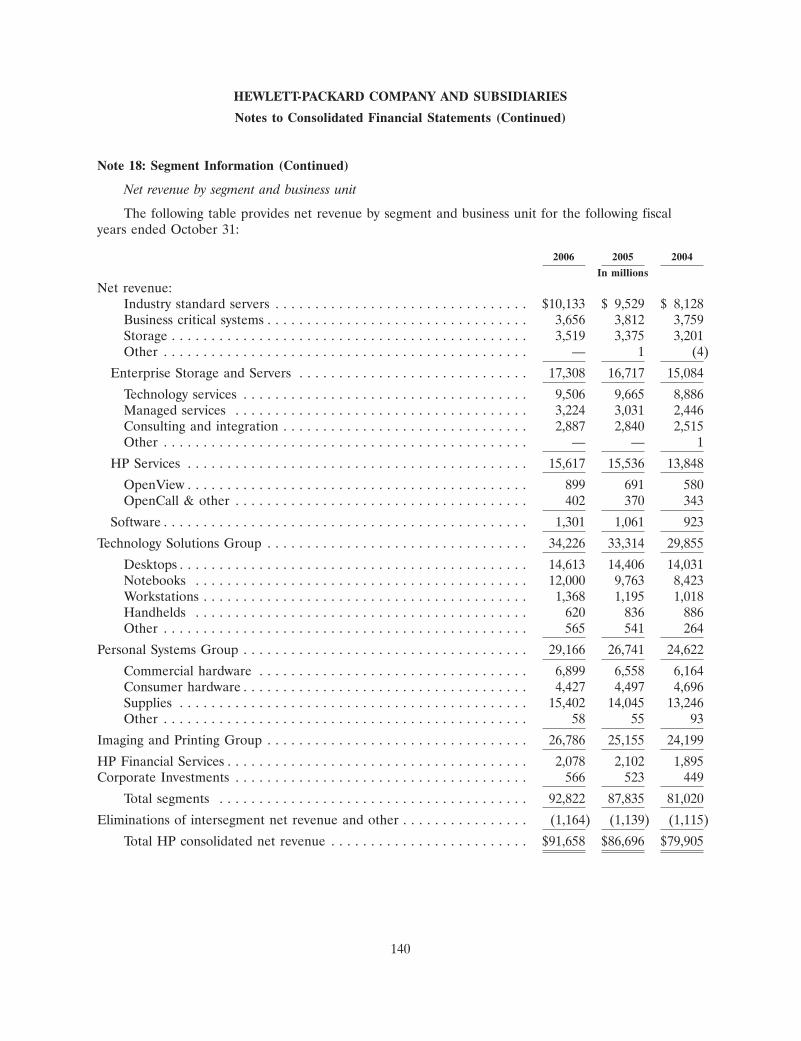
HEWLETT-PACKARD COMPANY AND SUBSIDIARIES
Notes to Consolidated Financial Statements (Continued)
Note 18: Segment Information (Continued)
Net revenue by segment and business unit
The following table provides net revenue by segment and business unit for the following fiscalyears ended October 31:
2006 2005 2004
In millions
Net revenue:Industry standard servers . . . . . . . . . . . . . . . . . . . . . . . . . . . . . . . . $10,133 $ 9,529 $ 8,128Business critical systems . . . . . . . . . . . . . . . . . . . . . . . . . . . . . . . . . 3,656 3,812 3,759Storage . . . . . . . . . . . . . . . . . . . . . . . . . . . . . . . . . . . . . . . . . . . . . 3,519 3,375 3,201Other . . . . . . . . . . . . . . . . . . . . . . . . . . . . . . . . . . . . . . . . . . . . . . — 1 (4)
Enterprise Storage and Servers . . . . . . . . . . . . . . . . . . . . . . . . . . . . . 17,308 16,717 15,084
Technology services . . . . . . . . . . . . . . . . . . . . . . . . . . . . . . . . . . . . 9,506 9,665 8,886Managed services . . . . . . . . . . . . . . . . . . . . . . . . . . . . . . . . . . . . . 3,224 3,031 2,446Consulting and integration . . . . . . . . . . . . . . . . . . . . . . . . . . . . . . . 2,887 2,840 2,515Other . . . . . . . . . . . . . . . . . . . . . . . . . . . . . . . . . . . . . . . . . . . . . . — — 1
HP Services . . . . . . . . . . . . . . . . . . . . . . . . . . . . . . . . . . . . . . . . . . . 15,617 15,536 13,848
OpenView . . . . . . . . . . . . . . . . . . . . . . . . . . . . . . . . . . . . . . . . . . . 899 691 580OpenCall & other . . . . . . . . . . . . . . . . . . . . . . . . . . . . . . . . . . . . . 402 370 343
Software . . . . . . . . . . . . . . . . . . . . . . . . . . . . . . . . . . . . . . . . . . . . . . 1,301 1,061 923
Technology Solutions Group . . . . . . . . . . . . . . . . . . . . . . . . . . . . . . . . . 34,226 33,314 29,855
Desktops . . . . . . . . . . . . . . . . . . . . . . . . . . . . . . . . . . . . . . . . . . . . 14,613 14,406 14,031Notebooks . . . . . . . . . . . . . . . . . . . . . . . . . . . . . . . . . . . . . . . . . . 12,000 9,763 8,423Workstations . . . . . . . . . . . . . . . . . . . . . . . . . . . . . . . . . . . . . . . . . 1,368 1,195 1,018Handhelds . . . . . . . . . . . . . . . . . . . . . . . . . . . . . . . . . . . . . . . . . . 620 836 886Other . . . . . . . . . . . . . . . . . . . . . . . . . . . . . . . . . . . . . . . . . . . . . . 565 541 264
Personal Systems Group . . . . . . . . . . . . . . . . . . . . . . . . . . . . . . . . . . . . 29,166 26,741 24,622
Commercial hardware . . . . . . . . . . . . . . . . . . . . . . . . . . . . . . . . . . 6,899 6,558 6,164Consumer hardware . . . . . . . . . . . . . . . . . . . . . . . . . . . . . . . . . . . . 4,427 4,497 4,696Supplies . . . . . . . . . . . . . . . . . . . . . . . . . . . . . . . . . . . . . . . . . . . . 15,402 14,045 13,246Other . . . . . . . . . . . . . . . . . . . . . . . . . . . . . . . . . . . . . . . . . . . . . . 58 55 93
Imaging and Printing Group . . . . . . . . . . . . . . . . . . . . . . . . . . . . . . . . . 26,786 25,155 24,199
HP Financial Services . . . . . . . . . . . . . . . . . . . . . . . . . . . . . . . . . . . . . . 2,078 2,102 1,895Corporate Investments . . . . . . . . . . . . . . . . . . . . . . . . . . . . . . . . . . . . . 566 523 449
Total segments . . . . . . . . . . . . . . . . . . . . . . . . . . . . . . . . . . . . . . . 92,822 87,835 81,020
Eliminations of intersegment net revenue and other . . . . . . . . . . . . . . . . (1,164) (1,139) (1,115)
Total HP consolidated net revenue . . . . . . . . . . . . . . . . . . . . . . . . . $91,658 $86,696 $79,905
140

HEWLETT-PACKARD COMPANY AND SUBSIDIARIESQuarterly Summary
(Unaudited)
Three-month periods ended
January 31 April 30 July 31 October 31
In millions, except per share amounts2006Net revenue . . . . . . . . . . . . . . . . . . . . . . . . . . . . . . . . . . . . . . . . . . $22,659 $22,554 $21,890 $24,555Cost of sales(1) . . . . . . . . . . . . . . . . . . . . . . . . . . . . . . . . . . . . . . . . . 17,392 16,970 16,472 18,593Research and development . . . . . . . . . . . . . . . . . . . . . . . . . . . . . . . . . 871 930 920 870Selling, general and administrative . . . . . . . . . . . . . . . . . . . . . . . . . . . . 2,692 2,858 2,830 2,886Amortization of purchased intangible assets . . . . . . . . . . . . . . . . . . . . . . 147 151 153 153Restructuring . . . . . . . . . . . . . . . . . . . . . . . . . . . . . . . . . . . . . . . . . 15 (14) 5 152In-process research and development charges . . . . . . . . . . . . . . . . . . . . . 50 2 — —Total costs and expenses . . . . . . . . . . . . . . . . . . . . . . . . . . . . . . . . . . . 21,167 20,897 20,380 22,654Earnings from operations . . . . . . . . . . . . . . . . . . . . . . . . . . . . . . . . . . 1,492 1,657 1,510 1,901Interest and other, net . . . . . . . . . . . . . . . . . . . . . . . . . . . . . . . . . . . . 38 157 221 190(Losses) gains on investments . . . . . . . . . . . . . . . . . . . . . . . . . . . . . . . (2) 6 7 14Earnings before taxes . . . . . . . . . . . . . . . . . . . . . . . . . . . . . . . . . . . . 1,528 1,820 1,738 2,105Provision for (benefit from) taxes . . . . . . . . . . . . . . . . . . . . . . . . . . . . . 301 (79) 363 408Net earnings . . . . . . . . . . . . . . . . . . . . . . . . . . . . . . . . . . . . . . . . . . $ 1,227 $ 1,899 $ 1,375 $ 1,697Net earnings per share:(2)
Basic . . . . . . . . . . . . . . . . . . . . . . . . . . . . . . . . . . . . . . . . . . . . . . . $ 0.43 $ 0.68 $ 0.50 $ 0.62Diluted . . . . . . . . . . . . . . . . . . . . . . . . . . . . . . . . . . . . . . . . . . . . . $ 0.42 $ 0.66 $ 0.48 $ 0.60Cash dividends paid per share . . . . . . . . . . . . . . . . . . . . . . . . . . . . . . . $ 0.08 $ 0.08 $ 0.08 $ 0.08Range of per share closing stock prices on the New York Stock Exchange and
Nasdaq Stock Market:Low . . . . . . . . . . . . . . . . . . . . . . . . . . . . . . . . . . . . . . . . . . . . . . $ 28.12 $ 30.27 $ 29.79 $ 31.67High . . . . . . . . . . . . . . . . . . . . . . . . . . . . . . . . . . . . . . . . . . . . . $ 32.24 $ 34.36 $ 33.87 $ 39.87
2005Net revenue . . . . . . . . . . . . . . . . . . . . . . . . . . . . . . . . . . . . . . . . . . $21,454 $21,570 $20,759 $22,913Cost of sales(1) . . . . . . . . . . . . . . . . . . . . . . . . . . . . . . . . . . . . . . . . . 16,537 16,429 15,942 17,532Research and development . . . . . . . . . . . . . . . . . . . . . . . . . . . . . . . . . 878 890 863 859Selling, general and administrative . . . . . . . . . . . . . . . . . . . . . . . . . . . . 2,704 2,933 2,761 2,786Amortization of purchased intangible assets . . . . . . . . . . . . . . . . . . . . . . 167 151 168 136Pension curtailment gains . . . . . . . . . . . . . . . . . . . . . . . . . . . . . . . . . . — — — (199)Restructuring charges . . . . . . . . . . . . . . . . . . . . . . . . . . . . . . . . . . . . 3 4 112 1,565In-process research and development charges . . . . . . . . . . . . . . . . . . . . . — — — 2Total costs and expenses . . . . . . . . . . . . . . . . . . . . . . . . . . . . . . . . . . . 20,289 20,407 19,846 22,681Earnings from operations . . . . . . . . . . . . . . . . . . . . . . . . . . . . . . . . . . 1,165 1,163 913 232Interest and other, net . . . . . . . . . . . . . . . . . . . . . . . . . . . . . . . . . . . . 25 (87) 119 132(Losses) gains on investments . . . . . . . . . . . . . . . . . . . . . . . . . . . . . . . (24) 3 (6) 14Dispute settlement . . . . . . . . . . . . . . . . . . . . . . . . . . . . . . . . . . . . . . (116) — 7 3Earnings before taxes . . . . . . . . . . . . . . . . . . . . . . . . . . . . . . . . . . . . 1,050 1,079 1,033 381Provision for (benefit from) taxes . . . . . . . . . . . . . . . . . . . . . . . . . . . . . 107 113 960 (35)Net earnings . . . . . . . . . . . . . . . . . . . . . . . . . . . . . . . . . . . . . . . . . . $ 943 $ 966 $ 73 $ 416Net earnings per share:(2)
Basic . . . . . . . . . . . . . . . . . . . . . . . . . . . . . . . . . . . . . . . . . . . . . $ 0.32 $ 0.33 $ 0.03 $ 0.15Diluted . . . . . . . . . . . . . . . . . . . . . . . . . . . . . . . . . . . . . . . . . . . . $ 0.32 $ 0.33 $ 0.03 $ 0.14
Cash dividends paid per share . . . . . . . . . . . . . . . . . . . . . . . . . . . . . . . $ 0.08 $ 0.08 $ 0.08 $ 0.08Range of per share closing stock prices on the New York Stock Exchange and
Nasdaq Stock Market:Low . . . . . . . . . . . . . . . . . . . . . . . . . . . . . . . . . . . . . . . . . . . . . . $ 18.76 $ 19.57 $ 20.15 $ 23.70High . . . . . . . . . . . . . . . . . . . . . . . . . . . . . . . . . . . . . . . . . . . . . $ 21.33 $ 22.00 $ 24.94 $ 29.20
(1) Cost of products, cost of services and financing interest.
(2) EPS for each quarter is computed using the weighted-average number of shares outstanding during that quarter, while EPSfor the fiscal year is computed using the weighted-average number of shares outstanding during the year. Thus, the sum ofthe EPS for each of the four quarters may not equal the EPS for the fiscal year.
141

ITEM 9. Changes in and Disagreements with Accountants on Accounting and Financial Disclosure.
None.
ITEM 9A. Controls and Procedures.
Controls and Procedures
Under the supervision and with the participation of our management, including our principalexecutive officer and principal financial officer, we conducted an evaluation of the effectiveness of thedesign and operation of our disclosure controls and procedures, as defined in Rules 13a-15(e) and15d-15(e) under the Securities Exchange Act of 1934, as amended, as of the end of the period coveredby this report (the ‘‘Evaluation Date’’). Based on this evaluation, our principal executive officer andprincipal financial officer concluded as of the Evaluation Date that our disclosure controls andprocedures were effective such that the information relating to HP, including our consolidatedsubsidiaries, required to be disclosed in our Securities and Exchange Commission (‘‘SEC’’) reports (i) isrecorded, processed, summarized and reported within the time periods specified in SEC rules andforms, and (ii) is accumulated and communicated to HP’s management, including our principalexecutive officer and principal financial officer, as appropriate to allow timely decisions regardingrequired disclosure.
See Management’s Report on Internal Control over Financial Reporting in Item 8, which isincorporated herein by reference.
ITEM 9B. Other Information.
Not applicable.
142

PART III
ITEM 10. Directors and Executive Officers of the Registrant.
The names of the executive officers of HP and their ages, titles and biographies as of the datehereof are incorporated by reference from Part I, Item 1, above.
The following information is included in HP’s Notice of Annual Meeting of Stockholders andProxy Statement to be filed within 120 days after HP’s fiscal year end of October 31, 2006 (the ‘‘ProxyStatement’’) and is incorporated herein by reference:
• Information regarding directors of HP who are standing for reelection and any personsnominated to become directors of HP is set forth under ‘‘Election of Directors.’’
• Information regarding HP’s Audit Committee and designated ‘‘audit committee financialexperts’’ is set forth under ‘‘Corporate Governance Principles and Board Matters, BoardStructure and Committee Composition—Audit Committee.’’
• Information on HP’s code of business conduct and ethics for directors, officers and employees,also known as the ‘‘Standards of Business Conduct,’’ and on HP’s Corporate GovernanceGuidelines is set forth under ‘‘Corporate Governance Principles and Board Matters.’’
• Information regarding Section 16(a) beneficial ownership reporting compliance is set forth under‘‘Common Stock Ownership of Certain Beneficial Owners and Management—Section 16(a)Beneficial Ownership Reporting Compliance.’’
ITEM 11. Executive Compensation.
The following information is included in the Proxy Statement and is incorporated herein byreference:
• Information regarding HP’s compensation of its named executive officers is set forth under‘‘Executive Compensation.’’
• Information regarding HP’s compensation of its directors is set forth under ‘‘DirectorCompensation and Stock Ownership Guidelines.’’
ITEM 12. Security Ownership of Certain Beneficial Owners and Management and Related StockholderMatters.
The following information is included in the Proxy Statement and is incorporated herein byreference:
• Information regarding security ownership of certain beneficial owners, directors and executiveofficers is set forth under ‘‘Common Stock Ownership of Certain Beneficial Owners andManagement.’’
• Information regarding HP’s equity compensation plans, including both stockholder approvedplans and non-stockholder approved plans, is set forth in the section entitled ‘‘ExecutiveCompensation—Equity Compensation Plan Information.’’
ITEM 13. Certain Relationships and Related Transactions.
Not applicable.
ITEM 14. Principal Accountant Fees and Services.
Information regarding principal auditor fees and services is set forth under ‘‘Principal AccountantFees and Services’’ in the Proxy Statement, which information is incorporated herein by reference.
143

PART IV
ITEM 15. Exhibits and Financial Statement Schedules.
(a) The following documents are filed as part of this report:
1. All Financial Statements:
The following financial statements are filed as part of this report under Item 8—‘‘FinancialStatements and Supplementary Data.’’
Report of Independent Registered Public Accounting Firm . . . . . . . . . . . . . . . . . . . . . . . . . 71Management’s Report on Internal Control Over Financial Reporting . . . . . . . . . . . . . . . . . . 73Consolidated Statements of Earnings . . . . . . . . . . . . . . . . . . . . . . . . . . . . . . . . . . . . . . . . . 74Consolidated Balance Sheets . . . . . . . . . . . . . . . . . . . . . . . . . . . . . . . . . . . . . . . . . . . . . . . 75Consolidated Statements of Cash Flows . . . . . . . . . . . . . . . . . . . . . . . . . . . . . . . . . . . . . . . 76Consolidated Statements of Stockholders’ Equity . . . . . . . . . . . . . . . . . . . . . . . . . . . . . . . . 77Notes to Consolidated Financial Statements . . . . . . . . . . . . . . . . . . . . . . . . . . . . . . . . . . . . 78Quarterly Summary . . . . . . . . . . . . . . . . . . . . . . . . . . . . . . . . . . . . . . . . . . . . . . . . . . . . . . 141
2. Financial Statement Schedules:
Schedule II—Valuation and Qualifying Accounts for the three fiscal years ended October 31, 2006.
All other schedules are omitted as the required information is inapplicable or the information ispresented in the Consolidated Financial Statements and notes thereto in Item 8 above.
3. Exhibits:
A list of exhibits filed or furnished with this report on Form 10-K (or incorporated by reference toexhibits previously filed or furnished by HP) is provided in the Exhibit Index on page 148 of thisreport. HP will furnish copies of exhibits for a reasonable fee (covering the expense of furnishingcopies) upon request. Stockholders may request exhibits copies by contacting:
Hewlett-Packard CompanyAttn: Investor Relations3000 Hanover StreetPalo Alto, CA 94304(866) GET-HPQ1 or (866) 438-4771
144

Schedule II
HEWLETT-PACKARD COMPANY AND SUBSIDIARIESValuation and Qualifying Accounts
For the fiscal years ended October 31
2006 2005 2004
In millions
Allowance for doubtful accounts—accounts receivable:Balance, beginning of period . . . . . . . . . . . . . . . . . . . . . . . . . . . . . $227 $286 $ 347Amount acquired through acquisition . . . . . . . . . . . . . . . . . . . . . . 4 — 9Addition (reversal) of bad debt provision . . . . . . . . . . . . . . . . . . . . 37 17 (6)Deductions, net of recoveries . . . . . . . . . . . . . . . . . . . . . . . . . . . . (48) (76) (64)
Balance, end of period . . . . . . . . . . . . . . . . . . . . . . . . . . . . . . . . . $220 $227 $ 286
Allowance for doubtful accounts—financing receivables:Balance, beginning of period . . . . . . . . . . . . . . . . . . . . . . . . . . . . . $111 $213 $ 210(Reversal) additions to allowance . . . . . . . . . . . . . . . . . . . . . . . . . (33) (39) 104Deductions, net of recoveries . . . . . . . . . . . . . . . . . . . . . . . . . . . . 2 (63) (101)
Balance, end of period . . . . . . . . . . . . . . . . . . . . . . . . . . . . . . . . . $ 80 $111 $ 213
145

SIGNATURES
Pursuant to the requirements of Section 13 or 15(d) of the Securities Exchange Act of 1934, theregistrant has duly caused this report to be signed on its behalf by the undersigned, thereunto dulyauthorized.
Date: December 22, 2006 HEWLETT-PACKARD COMPANY
By: /s/ CHARLES N. CHARNAS
Charles N. CharnasActing General Counsel, Vice President and
Assistant Secretary
POWER OF ATTORNEY
KNOW ALL PERSONS BY THESE PRESENTS, that each person whose signature appearsbelow constitutes and appoints Charles N. Charnas and Jon E. Flaxman, or either of them, his or herattorneys-in-fact, for such person in any and all capacities, to sign any amendments to this report andto file the same, with exhibits thereto, and other documents in connection therewith, with the Securitiesand Exchange Commission, hereby ratifying and confirming all that either of said attorneys-in-fact, orsubstitute or substitutes, may do or cause to be done by virtue hereof.
Pursuant to the requirements of the Securities Exchange Act of 1934, this report has been signedbelow by the following persons on behalf of the registrant and in the capacities and on the datesindicated.
Signature Title(s) Date
Chairman, Chief Executive Officer/s/ MARK V. HURDand President December 22, 2006
Mark V. Hurd (Principal Executive Officer)
Executive Vice President and Chief/s/ ROBERT P. WAYMANFinancial Officer December 22, 2006
Robert P. Wayman (Principal Financial Officer)
/s/ JON E. FLAXMAN Senior Vice President and Controller December 22, 2006(Principal Accounting Officer)Jon E. Flaxman
/s/ LAWRENCE T. BABBIO, JR.Director December 22, 2006
Lawrence T. Babbio, Jr.
/s/ SARI M. BALDAUFDirector December 22, 2006
Sari M. Baldauf
/s/ RICHARD A. HACKBORNDirector December 22, 2006
Richard A. Hackborn
/s/ JOHN H. HAMMERGRENDirector December 22, 2006
John H. Hammergren
146

Signature Title(s) Date
/s/ ROBERT L. RYANDirector December 22, 2006
Robert L. Ryan
/s/ LUCILLE S. SALHANYDirector December 22, 2006
Lucille S. Salhany
/s/ G. KENNEDY THOMPSONDirector December 22, 2006
G. Kennedy Thompson
147
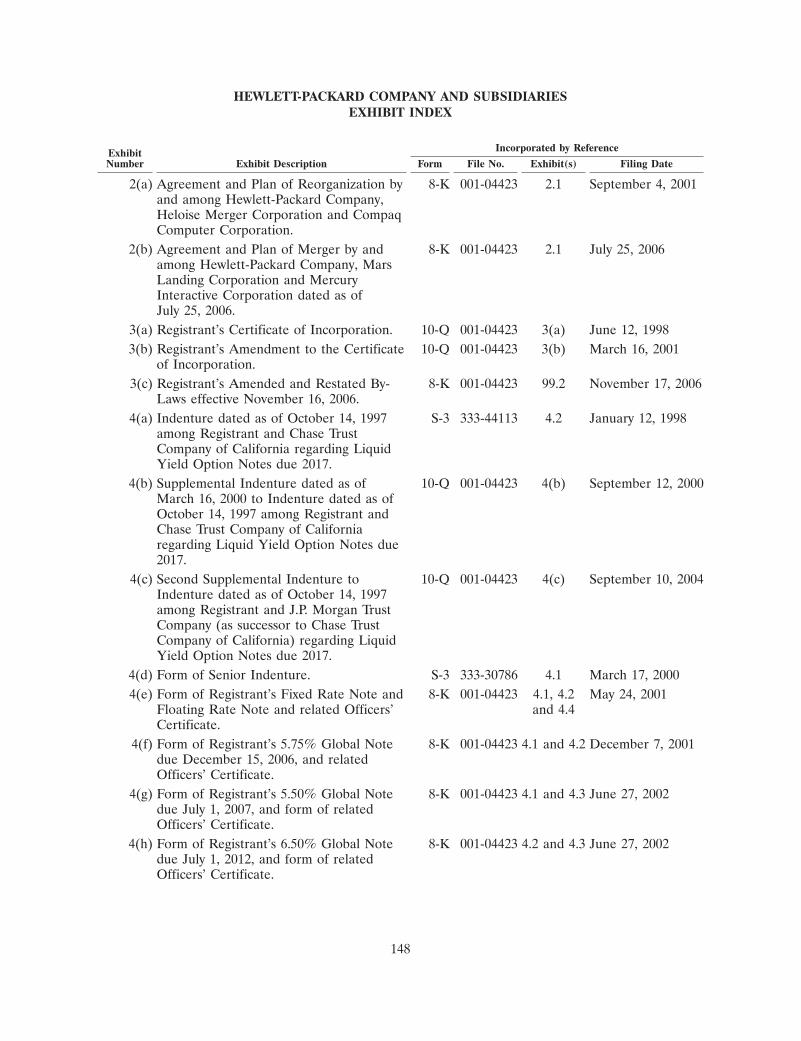
HEWLETT-PACKARD COMPANY AND SUBSIDIARIESEXHIBIT INDEX
Incorporated by ReferenceExhibitNumber Exhibit Description Form File No. Exhibit(s) Filing Date
2(a) Agreement and Plan of Reorganization by 8-K 001-04423 2.1 September 4, 2001and among Hewlett-Packard Company,Heloise Merger Corporation and CompaqComputer Corporation.
2(b) Agreement and Plan of Merger by and 8-K 001-04423 2.1 July 25, 2006among Hewlett-Packard Company, MarsLanding Corporation and MercuryInteractive Corporation dated as ofJuly 25, 2006.
3(a) Registrant’s Certificate of Incorporation. 10-Q 001-04423 3(a) June 12, 19983(b) Registrant’s Amendment to the Certificate 10-Q 001-04423 3(b) March 16, 2001
of Incorporation.3(c) Registrant’s Amended and Restated By- 8-K 001-04423 99.2 November 17, 2006
Laws effective November 16, 2006.4(a) Indenture dated as of October 14, 1997 S-3 333-44113 4.2 January 12, 1998
among Registrant and Chase TrustCompany of California regarding LiquidYield Option Notes due 2017.
4(b) Supplemental Indenture dated as of 10-Q 001-04423 4(b) September 12, 2000March 16, 2000 to Indenture dated as ofOctober 14, 1997 among Registrant andChase Trust Company of Californiaregarding Liquid Yield Option Notes due2017.
4(c) Second Supplemental Indenture to 10-Q 001-04423 4(c) September 10, 2004Indenture dated as of October 14, 1997among Registrant and J.P. Morgan TrustCompany (as successor to Chase TrustCompany of California) regarding LiquidYield Option Notes due 2017.
4(d) Form of Senior Indenture. S-3 333-30786 4.1 March 17, 20004(e) Form of Registrant’s Fixed Rate Note and 8-K 001-04423 4.1, 4.2 May 24, 2001
Floating Rate Note and related Officers’ and 4.4Certificate.
4(f) Form of Registrant’s 5.75% Global Note 8-K 001-04423 4.1 and 4.2 December 7, 2001due December 15, 2006, and relatedOfficers’ Certificate.
4(g) Form of Registrant’s 5.50% Global Note 8-K 001-04423 4.1 and 4.3 June 27, 2002due July 1, 2007, and form of relatedOfficers’ Certificate.
4(h) Form of Registrant’s 6.50% Global Note 8-K 001-04423 4.2 and 4.3 June 27, 2002due July 1, 2012, and form of relatedOfficers’ Certificate.
148
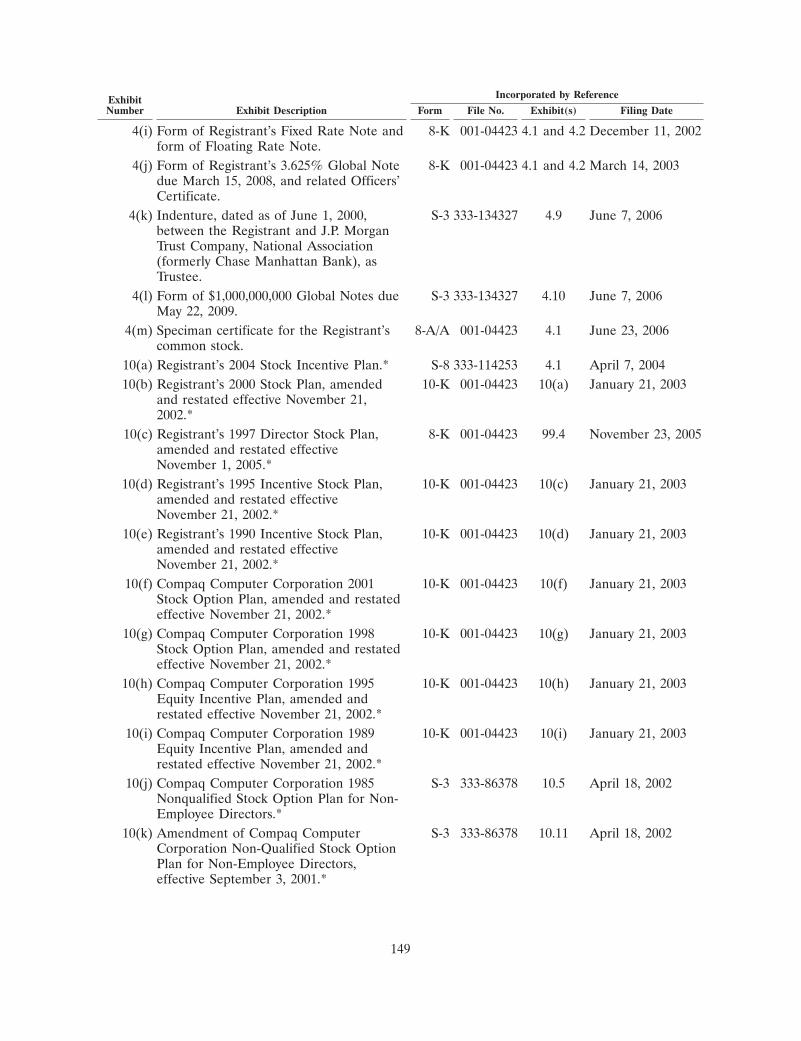
Incorporated by ReferenceExhibitNumber Exhibit Description Form File No. Exhibit(s) Filing Date
4(i) Form of Registrant’s Fixed Rate Note and 8-K 001-04423 4.1 and 4.2 December 11, 2002form of Floating Rate Note.
4(j) Form of Registrant’s 3.625% Global Note 8-K 001-04423 4.1 and 4.2 March 14, 2003due March 15, 2008, and related Officers’Certificate.
4(k) Indenture, dated as of June 1, 2000, S-3 333-134327 4.9 June 7, 2006between the Registrant and J.P. MorganTrust Company, National Association(formerly Chase Manhattan Bank), asTrustee.
4(l) Form of $1,000,000,000 Global Notes due S-3 333-134327 4.10 June 7, 2006May 22, 2009.
4(m) Speciman certificate for the Registrant’s 8-A/A 001-04423 4.1 June 23, 2006common stock.
10(a) Registrant’s 2004 Stock Incentive Plan.* S-8 333-114253 4.1 April 7, 200410(b) Registrant’s 2000 Stock Plan, amended 10-K 001-04423 10(a) January 21, 2003
and restated effective November 21,2002.*
10(c) Registrant’s 1997 Director Stock Plan, 8-K 001-04423 99.4 November 23, 2005amended and restated effectiveNovember 1, 2005.*
10(d) Registrant’s 1995 Incentive Stock Plan, 10-K 001-04423 10(c) January 21, 2003amended and restated effectiveNovember 21, 2002.*
10(e) Registrant’s 1990 Incentive Stock Plan, 10-K 001-04423 10(d) January 21, 2003amended and restated effectiveNovember 21, 2002.*
10(f) Compaq Computer Corporation 2001 10-K 001-04423 10(f) January 21, 2003Stock Option Plan, amended and restatedeffective November 21, 2002.*
10(g) Compaq Computer Corporation 1998 10-K 001-04423 10(g) January 21, 2003Stock Option Plan, amended and restatedeffective November 21, 2002.*
10(h) Compaq Computer Corporation 1995 10-K 001-04423 10(h) January 21, 2003Equity Incentive Plan, amended andrestated effective November 21, 2002.*
10(i) Compaq Computer Corporation 1989 10-K 001-04423 10(i) January 21, 2003Equity Incentive Plan, amended andrestated effective November 21, 2002.*
10(j) Compaq Computer Corporation 1985 S-3 333-86378 10.5 April 18, 2002Nonqualified Stock Option Plan for Non-Employee Directors.*
10(k) Amendment of Compaq Computer S-3 333-86378 10.11 April 18, 2002Corporation Non-Qualified Stock OptionPlan for Non-Employee Directors,effective September 3, 2001.*
149

Incorporated by ReferenceExhibitNumber Exhibit Description Form File No. Exhibit(s) Filing Date
10(l) Compaq Computer Corporation 1998 S-3 333-86378 10.9 April 18, 2002Former Nonemployee ReplacementOption Plan.*
10(m) Mercury Interactive Corporation S-8 333-138783 4.1 November 20, 2006Amended and Restated 2000Supplemental Stock Option Plan*
10(n) Mercury Interactive Corporation S-8 333-138783 4.2 November 20, 2006Amended and Restated 1999 StockOption Plan*
10(o) Appilog, Inc. 2003 Stock Option Plan* S-8 333-138783 4.3 November 17, 200610(p) Freshwater Software, Inc. 1997 Stock S-8 333-138783 4.4 November 17, 2006
Plan*10(q) Kintana, Inc. 1997 Equity Incentive Plan* S-8 333-138783 4.5 November 17, 200610(r) Performant, Inc. 2000 Stock Option/ S-8 333-138783 4.6 November 17, 2006
Restricted Stock Plan*10(s) Systinet Corporation 2001 Stock Option S-8 333-138783 4.7 November 17, 2006
and Incentive Plan*10(t) Registrant’s Excess Benefit Retirement 8-K 001-04423 10.2 September 21, 2006
Plan, amended and restated as ofJanuary 1, 2006.*
10(u) Hewlett-Packard Company Cash Account 8-K 001-04423 99.3 November 23, 2005Restoration Plan, amended and restatedas of January 1, 2005.*
10(v) Registrant’s 2005 Pay-for-Results Plan.* 8-K 001-04423 99.5 November 23, 200510(w) Registrant’s 2005 Executive Deferred 8-K 001-04423 10.1 September 21, 2006
Compensation Plan, as amended andrestated effective October 1, 2006.*
10(x) Registrant’s Service Anniversary Stock 10-Q 001-04423 10(p)(p) September 11, 2003Plan, as amended and restated effectiveJuly 17, 2003.*
10(y) Employment Agreement, dated March 29, 8-K 001-04423 99.1 March 30, 20052005, between Registrant and Mark V.Hurd.*
10(z) Employment Agreement, dated June 9, 10-Q 001-04423 10(x) September 8, 20052005, between Registrant and R. ToddBradley.*
10(a)(a) Employment Agreement, dated July 11, 10-Q 001-04423 10(y) September 8, 20052005, between Registrant and Randall D.Mott.*
10(b)(b) Registrant’s Amended and Restated 8-K 001-04423 99.1 July 27, 2005Severance Plan for Executive Officers.*
10(c)(c) Form letter to participants in the 10-Q 001-04423 10(w) March 10, 2006Registrant’s Pay-for-Results Plan for fiscalyear 2006.*
10(d)(d) Registrant’s Executive Severance 10-Q 001-04423 10(u)(u) June 13, 2002Agreement.*
150

Incorporated by ReferenceExhibitNumber Exhibit Description Form File No. Exhibit(s) Filing Date
10(e)(e) Registrant’s Executive Officers Severance 10-Q 001-04423 10(v)(v) June 13, 2002Agreement.*
10(f)(f) Form letter regarding severance offset for 8-K 001-04423 10.2 March 22, 2005restricted stock and restricted units.*
10(g)(g) Form of Indemnity Agreement between 10-Q 001-04423 10(x)(x) June 13, 2002Compaq Computer Corporation and itsexecutive officers.*
10(h)(h) Form of Stock Option Agreement forRegistrant’s 2004 Stock Incentive Plan,Registrant’s 2000 Stock Plan, as amended,Registrant’s 1995 Incentive Stock Plan, asamended, the Compaq ComputerCorporation 2001 Stock Option Plan, asamended, the Compaq ComputerCorporation 1998 Stock Option Plan, asamended, the Compaq ComputerCorporation 1995 Equity Incentive Plan,as amended and the Compaq ComputerCorporation 1989 Equity Incentive Plan,as amended.*‡
10(i)(i) Form of Restricted Stock Agreement forRegistrant’s 2004 Stock Incentive Plan,Registrant’s 2000 Stock Plan, as amended,and Registrant’s 1995 Incentive StockPlan, as amended.*‡
10(j)(j) Form of Restricted Stock Unit Agreementfor Registrant’s 2004 Stock IncentivePlan.*‡
10(k)(k) Form of Stock Option Agreement for 10-K 001-04423 10(e) January 27, 2000Registrant’s 1990 Incentive Stock Plan, asamended.*
10(l)(l) Form of Common Stock Payment 10-Q 001-04423 10(j)(j) March 11, 2005Agreement and Option Agreement forRegistrant’s 1997 Director Stock Plan, asamended.*
10(m)(m) Form of Restricted Stock Grant Notice for 10-Q 001-04423 10(w)(w) June 13, 2002the Compaq Computer Corporation 1989Equity Incentive Plan.*
10(n)(n) Forms of Stock Option Notice for the 10-K 001-04423 10(r)(r) January 14, 2005Compaq Computer Corporation Non-Qualified Stock Option Plan for Non-Employee Directors, as amended.*
10(o)(o) Form of Long-Term Performance Cash 10-K 001-04423 10(t)(t) January 14, 2005Award Agreement for Registrant’s 2004Stock Incentive Plan and Registrant’s 2000Stock Plan, as amended.*
151
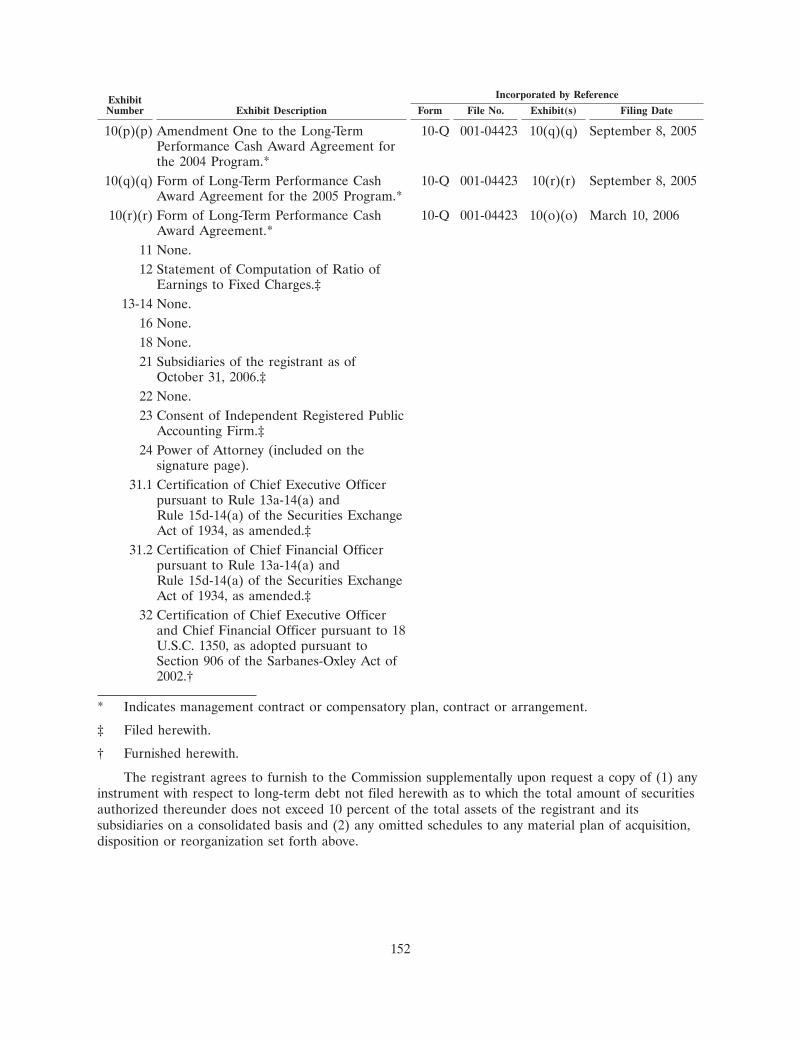
Incorporated by ReferenceExhibitNumber Exhibit Description Form File No. Exhibit(s) Filing Date
10(p)(p) Amendment One to the Long-Term 10-Q 001-04423 10(q)(q) September 8, 2005Performance Cash Award Agreement forthe 2004 Program.*
10(q)(q) Form of Long-Term Performance Cash 10-Q 001-04423 10(r)(r) September 8, 2005Award Agreement for the 2005 Program.*
10(r)(r) Form of Long-Term Performance Cash 10-Q 001-04423 10(o)(o) March 10, 2006Award Agreement.*
11 None.12 Statement of Computation of Ratio of
Earnings to Fixed Charges.‡13-14 None.
16 None.18 None.21 Subsidiaries of the registrant as of
October 31, 2006.‡22 None.23 Consent of Independent Registered Public
Accounting Firm.‡24 Power of Attorney (included on the
signature page).31.1 Certification of Chief Executive Officer
pursuant to Rule 13a-14(a) andRule 15d-14(a) of the Securities ExchangeAct of 1934, as amended.‡
31.2 Certification of Chief Financial Officerpursuant to Rule 13a-14(a) andRule 15d-14(a) of the Securities ExchangeAct of 1934, as amended.‡
32 Certification of Chief Executive Officerand Chief Financial Officer pursuant to 18U.S.C. 1350, as adopted pursuant toSection 906 of the Sarbanes-Oxley Act of2002.†
* Indicates management contract or compensatory plan, contract or arrangement.
‡ Filed herewith.
† Furnished herewith.
The registrant agrees to furnish to the Commission supplementally upon request a copy of (1) anyinstrument with respect to long-term debt not filed herewith as to which the total amount of securitiesauthorized thereunder does not exceed 10 percent of the total assets of the registrant and itssubsidiaries on a consolidated basis and (2) any omitted schedules to any material plan of acquisition,disposition or reorganization set forth above.
152
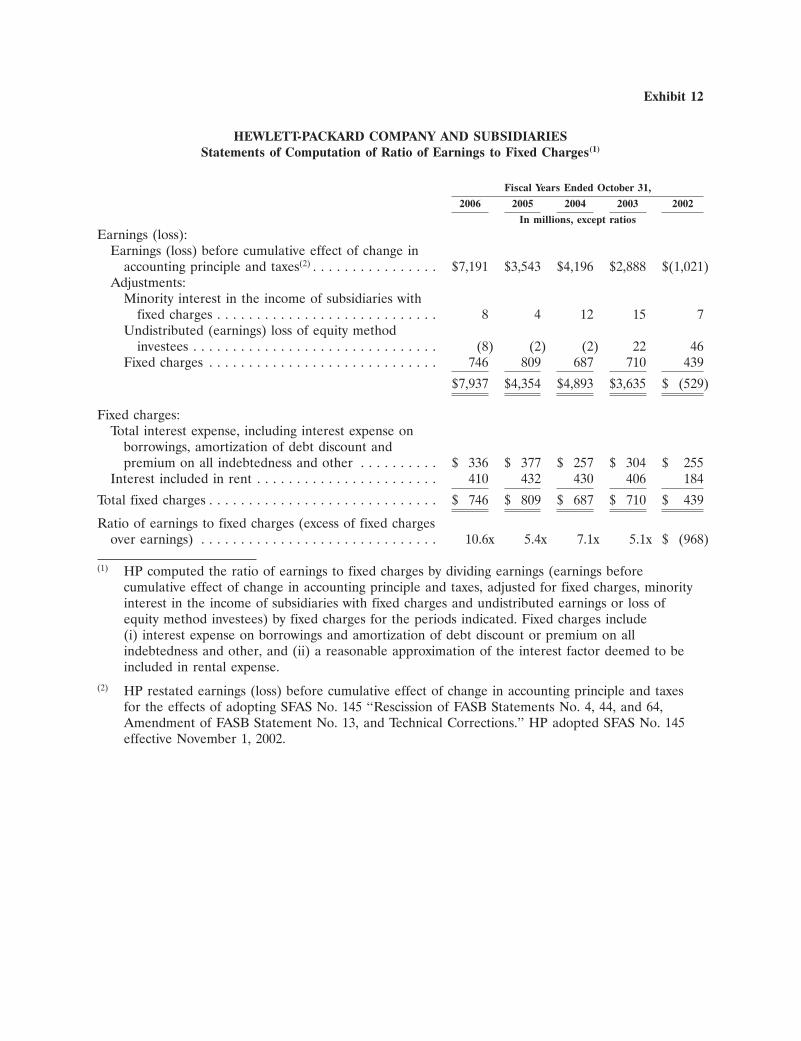
Exhibit 12
HEWLETT-PACKARD COMPANY AND SUBSIDIARIESStatements of Computation of Ratio of Earnings to Fixed Charges(1)
Fiscal Years Ended October 31,
2006 2005 2004 2003 2002
In millions, except ratios
Earnings (loss):Earnings (loss) before cumulative effect of change in
accounting principle and taxes(2) . . . . . . . . . . . . . . . . $7,191 $3,543 $4,196 $2,888 $(1,021)Adjustments:
Minority interest in the income of subsidiaries withfixed charges . . . . . . . . . . . . . . . . . . . . . . . . . . . . 8 4 12 15 7
Undistributed (earnings) loss of equity methodinvestees . . . . . . . . . . . . . . . . . . . . . . . . . . . . . . . (8) (2) (2) 22 46
Fixed charges . . . . . . . . . . . . . . . . . . . . . . . . . . . . . 746 809 687 710 439
$7,937 $4,354 $4,893 $3,635 $ (529)
Fixed charges:Total interest expense, including interest expense on
borrowings, amortization of debt discount andpremium on all indebtedness and other . . . . . . . . . . $ 336 $ 377 $ 257 $ 304 $ 255
Interest included in rent . . . . . . . . . . . . . . . . . . . . . . . 410 432 430 406 184
Total fixed charges . . . . . . . . . . . . . . . . . . . . . . . . . . . . . $ 746 $ 809 $ 687 $ 710 $ 439
Ratio of earnings to fixed charges (excess of fixed chargesover earnings) . . . . . . . . . . . . . . . . . . . . . . . . . . . . . . 10.6x 5.4x 7.1x 5.1x $ (968)
(1) HP computed the ratio of earnings to fixed charges by dividing earnings (earnings beforecumulative effect of change in accounting principle and taxes, adjusted for fixed charges, minorityinterest in the income of subsidiaries with fixed charges and undistributed earnings or loss ofequity method investees) by fixed charges for the periods indicated. Fixed charges include(i) interest expense on borrowings and amortization of debt discount or premium on allindebtedness and other, and (ii) a reasonable approximation of the interest factor deemed to beincluded in rental expense.
(2) HP restated earnings (loss) before cumulative effect of change in accounting principle and taxesfor the effects of adopting SFAS No. 145 ‘‘Rescission of FASB Statements No. 4, 44, and 64,Amendment of FASB Statement No. 13, and Technical Corrections.’’ HP adopted SFAS No. 145effective November 1, 2002.

Exhibit 21
Subsidiaries of Hewlett-Packard Company
The registrant’s principal subsidiaries and affiliates as of October 31, 2006, are listed below.
ARGENTINA—Hewlett-Packard Argentina S.R.L.—HP Financial Services Argentina S.R.L.AUSTRALIA—Hewlett-Packard Australia Pty. LimitedAUSTRIA—Hewlett-Packard Ges.m.b.H.BELGIUM—Hewlett-Packard Belgium S.P.R.L./B.V.B.A.—Hewlett-Packard Coordination Center S.C.R.L./C.V.B.A.BRAZIL—Hewlett-Packard Brasil Ltda.BULGARIA—Hewlett-Packard Bulgaria EooDCANADA—Hewlett-Packard (Canada) Co.CAYMAN ISLANDS—Hewlett-Packard Equity Investments LimitedCHILE—Hewlett-Packard Chile Comercial Limitada—HP Financial Services (Chile) LimitadaCHINA—Hewlett-Packard Trading (Shanghai) Co. Ltd.—China Hewlett-Packard Company Limited—Shanghai Hewlett-Packard Co. Ltd.COLOMBIA—Hewlett-Packard Colombia LimitadaCOSTA RICA—Hewlett-Packard Costa Rica Ltda.CROATIA—Hewlett-Packard d.o.o.CZECH REPUBLIC—Hewlett-Packard s.r.o.DENMARK—Hewlett-Packard ApSECUADOR—Hewlett-Packard Ecuador CIA Ltda.EGYPT—Hewlett-Packard Egypt Ltd.

FINLAND—Hewlett-Packard OYFRANCE—Hewlett-Packard Centre de Competences, France—Hewlett-Packard France SASGERMANY—Hewlett-Packard GmbH—Hewlett-Packard Immobilien GmbHGREECE—Hewlett-Packard Hellas EPEGUATEMALA—Hewlett-Packard Guatemala, LimitadaHONG KONG—Hewlett-Packard HK SAR Ltd.HUNGARY—Hewlett-Packard Magyarorszag KftINDIA—Hewlett-Packard India Sales Private Limited—Hewlett-Packard Globalsoft LimitedINDONESIA—PT Hewlett-Packard Berca ServisindoIRELAND—Hewlett-Packard International Bank Public Limited Company—Hewlett-Packard Ireland Limited—Hewlett-Packard (Manufacturing) Ltd.ISRAEL—Hewlett-Packard Indigo Ltd.ITALY—Hewlett-Packard Italiana S.r.l.JAPAN—Hewlett-Packard Japan Ltd.KENYA—Hewlett-Packard East Africa LimitedKOREA—Hewlett-Packard Korea Ltd.LATVIA—Hewlett-Packard SIALITHUANIA—UAB Hewlett-PackardMALAYSIA—Hewlett-Packard (M) Sdn. Bhd.MEXICO—Hewlett-Packard Mexico S. de R.L. de C.V.

MOROCCO—Hewlett-Packard SARLNETHERLANDS—Hewlett-Packard Caribe B.V.—Hewlett-Packard Europe B.V.—Hewlett-Packard Indigo B.V.—Hewlett-Packard Nederland B.V.—Compaq Trademark B.V.NETHERLANDS ANTILLES—Hewlett-Packard Finance N.V.NEW ZEALAND—Hewlett-Packard New ZealandNIGERIA—Hewlett-Packard (Nigeria) LimitedNORWAY—Hewlett-Packard Norge A/SPERU—Hewlett-Packard Peru S.R.L.PHILIPPINES—Hewlett-Packard Philippines CorporationPOLAND—Hewlett-Packard Polska Sp. Z.o.o.PORTUGAL—Hewlett-Packard Portugal Lda.ROMANIA—Hewlett-Packard (Romania) SRLRUSSIA—ZAO Hewlett-Packard AOSERBIA-MONTENEGRO—Hewlett-Packard d.o.o. (Beograd)SINGAPORE—Hewlett-Packard Asia Pacific Pte. Ltd.—Hewlett-Packard International Pte. Ltd.—Hewlett-Packard Singapore (Private) Limited—Hewlett-Packard Singapore (Sales) Pte. Ltd.SLOVAKIA—Hewlett-Packard Slovakia s.r.o.SLOVENIA—Hewlett-Packard d.o.o., druzba za tehnoloske resitveSOUTH AFRICA—Hewlett-Packard South Africa (Proprietary) LimitedSPAIN—Hewlett-Packard Espanola S.L.

SWEDEN—Hewlett-Packard Sverige ABSWITZERLAND—Hewlett-Packard International Sarl—Hewlett-Packard (Schweiz) GmbHTAIWAN—Hewlett-Packard Taiwan Ltd.THAILAND—Hewlett-Packard (Thailand) LimitedTURKEY—Hewlett-Packard Teknoloji Cozumleri Limited SirketiUNITED ARAB EMIRATES—Hewlett-Packard Middle East FZ-LLCUNITED KINGDOM—Hewlett-Packard Limited—Hewlett-Packard Manufacturing Ltd.UNITED STATES—Hewlett-Packard Bermuda Enterprises, LLC—Hewlett-Packard Development Company, L.P.—Hewlett-Packard Financial Services Company—Hewlett-Packard Luxembourg Enterprises LLC—Hewlett-Packard Products CV 1, LLC—Hewlett-Packard Products CV 2, LLC—Hewlett-Packard World Trade, Inc.—HP Financial Services International Holdings Company—HPFS Global Holdings I, LLC—HPQ Holdings, LLC—Compaq Latin America Corporation—Computer Insurance Company—Indigo America, Inc.—Outerbay Technologies Inc.—Tall Tree Insurance CompanyVENEZUELA—Hewlett-Packard de Venezuela, S.R.L.VIETNAM—Hewlett-Packard Vietnam Ltd.

Exhibit 23
Consent of Independent Registered Public Accounting Firm
We consent to the incorporation by reference in the following Registration Statements:
(1) Registration Statement (Form S-3 No. 333-30786) of Hewlett-Packard Company pertaining to$3 billion debt securities, common stock & warrant,
(2) Registration Statement (Form S-3 No. 333-83346) of Hewlett-Packard Company pertaining to$3 billion debt securities, common stock & warrant,
(3) Registration Statement (Form S-3 No. 333-86378) of Hewlett-Packard Company pertaining toassumption of outstanding options under various Compaq stock plans,
(4) Registration Statement (Form S-3ASR No. 333-134327) of Hewlett-Packard Companypertaining to $1 billion debt securities, common stock and warrants,
(5) Registration Statement (Form S-8 No. 333-124281) pertaining to the Executive DeferredCompensation Plan,
(6) Registration Statement (Form S-8 No. 333-114253) pertaining to the 2004 Stock IncentivePlan,
(7) Registration Statement (Form S-8 No. 333-124280) pertaining to the 2000 Employee StockPurchase Plan,
(8) Registration Statement (Form S-8 No. 333-35836) pertaining to the 2000 Stock Plan and 2000Employee Stock Purchase Plan,
(9) Registration Statement (Form S-8 No. 333-22947) pertaining to the 1997 Director Stock Plan,
(10) Registration Statement (Form S-8 No. 033-58447) pertaining to the 1995 Incentive Stock Plan,
(11) Registration Statement (Form S-8 No. 033-38579) pertaining to the 1990 Incentive Stock Plan
(12) Registration Statement (Form S-8 No. 333-124282) pertaining to the 2005 Executive DeferredCompensation Plan,
(13) Registration Statement (Form S-8 No. 002-92331) pertaining to the Hewlett-Packard Company401(k) Plan,
(14) Registration Statement (Form S-8 No. 033-31496) pertaining to the Employee Stock PurchasePlan and Service Anniversary Stock Plan,
(15) Registration Statement (Form S-8 No. 333-138783) pertaining to the Mercury InteractiveCorporation Amended and Restated 2000 Supplemental Stock Option Plan, MercuryInteractive Corporation Amended and Restated 1999 Stock Option Plan, Appilog, Inc. 2003Stock Option Plan, Freshwater Software, Inc. 1997 Stock Plan, Kintana, Inc. 1997 EquityIncentive Plan, Performant, Inc. 2000 Stock Option/Restricted Stock Plan, and SystinetCorporation 2001 Stock Option and Incentive Plan,
(16) Registration Statement (Form S-8 No. 333-131406) pertaining to the 2003 Equity IncentivePlan of Peregrine Systems, Inc.,
(17) Registration Statement (Form S-8 No. 333-129863) pertaining to the AppIQ, Inc. 2001 StockOption and Incentive Plan,
(18) Registration Statement (Form S-8 No. 333-114254) pertaining to the TruLogica, Inc. 2003Stock Plan,
(19) Registration Statement (Form S-8 No. 333-113148) pertaining to the Consera SoftwareCorporation 2002 Stock Plan,
(20) Registration Statement (Form S-8 No. 333-45231) pertaining to the VeriFone, Inc. 1997Non-Qualified Employee Stock Purchase Plan,
(21) Registration Statement (Form S-8 No. 333-30459) pertaining to the VeriFone, Inc. Amendedand Restated 1992 Non-Employee Directors’ Stock Option Plan, VeriFone, Inc. Amended andRestated Incentive Stock Option Plan, VeriFone, Inc. Amended and Restated 1987Supplemental Stock Option Plan and VeriFone, Inc. Amended and Restated Employee StockPurchase Plan,
(22) Registration Statement (Form S-8 No. 033-65179) pertaining to the 1995 Convex Stock OptionConversion Plan,
(23) Registration Statement (Form S-8 No. 333-114346) pertaining to the Novadigm, Inc. 1992Stock Option Plan, Novadigm, Inc. 1999 Nonstatutory Stock Option Plan (as amended onApril 30, 2003) and Novadigm, Inc. 2000 Stock Option Plan,
(24) Registration Statement (Form S-8 No. 333-114255) pertaining to the Digital Equipment(India) Limited 1999 Stock Option Plan and Digital GlobalSoft Limited 2001 Stock OptionPlan,
(25) Registration Statement (Form S-8 No. 333-87788) pertaining to the Compaq ComputerCorporation 1985 Nonqualified Stock Option Plan, Compaq Computer Corporation 1985Executive and Key Employee Stock Option Plan, Compaq Computer Corporation 1985 StockOption Plan, Compaq Computer Corporation 1989 Equity Incentive Plan, Compaq ComputerCorporation 1995 Equity Incentive Plan, Compaq Computer Corporation Nonqualified StockOption Plan for Non-Employee Directors, Compaq Computer Corporation 1998 Stock OptionPlan and Compaq Computer Corporation 2001 Stock Option Plan,
(26) Registration Statement (Form S-8 No. 333-85136) pertaining to the Indigo N.V. Flexible StockIncentive Plan and Indigo N.V. 1996 International Flexible Stock Incentive Plan, and
(27) Registration Statement (Form S-8 No. 333-70232) pertaining to the StorageApps Inc. 2000Stock Incentive Plan;
of Hewlett-Packard Company of our reports dated December 15, 2006, with respect to the consolidatedfinancial statements and schedule of Hewlett-Packard Company, Hewlett-Packard Companymanagement’s assessment of the effectiveness of internal control over financial reporting, and theeffectiveness of internal control over financial reporting of Hewlett-Packard Company, included in thisAnnual Report (Form 10-K) for the year ended October 31, 2006.
/s/ ERNST & YOUNG LLP
San Jose, CaliforniaDecember 15, 2006
Exhibit 31.1
CERTIFICATION
I, Mark V. Hurd, certify that:
1. I have reviewed this Annual Report on Form 10-K of Hewlett-Packard Company;
2. Based on my knowledge, this report does not contain any untrue statement of a material fact oromit to state a material fact necessary to make the statements made, in light of the circumstancesunder which such statements were made, not misleading with respect to the period covered by thisreport;
3. Based on my knowledge, the financial statements, and other financial information included in thisreport, fairly present in all material respects the financial condition, results of operations and cashflows of the registrant as of, and for, the periods presented in this report;
4. The registrant’s other certifying officer(s) and I are responsible for establishing and maintainingdisclosure controls and procedures (as defined in Exchange Act Rules 13a-15(e) and 15d-15(e))and internal control over financial reporting (as defined in Exchange Act Rules 13a-15(f) and15d-15(f)) for the registrant and have:
a) Designed such disclosure controls and procedures, or caused such disclosure controls andprocedures to be designed under our supervision, to ensure that material information relatingto the registrant, including its consolidated subsidiaries, is made known to us by others withinthose entities, particularly during the period in which this report is being prepared;
b) Designed such internal control over financial reporting, or caused such internal control overfinancial reporting to be designed under our supervision, to provide reasonable assuranceregarding the reliability of financial reporting and the preparation of financial statements forexternal purposes in accordance with generally accepted accounting principles;
c) Evaluated the effectiveness of the registrant’s disclosure controls and procedures andpresented in this report our conclusions about the effectiveness of the disclosure controls andprocedures, as of the end of the period covered by this report based on such evaluation; and
d) Disclosed in this report any change in the registrant’s internal control over financial reportingthat occurred during the registrant’s most recent fiscal quarter (the registrant’s fourth fiscalquarter in the case of an annual report) that has materially affected, or is reasonably likely tomaterially affect, the registrant’s internal control over financial reporting; and
5. The registrant’s other certifying officer(s) and I have disclosed, based on our most recentevaluation of internal control over financial reporting, to the registrant’s auditors and the auditcommittee of the registrant’s board of directors (or persons performing the equivalent functions):
a) All significant deficiencies and material weaknesses in the design or operation of internalcontrol over financial reporting which are reasonably likely to adversely affect the registrant’sability to record, process, summarize and report financial information; and
b) Any fraud, whether or not material, that involves management or other employees who have asignificant role in the registrant’s internal control over financial reporting.
Date: December 15, 2006/s/ MARK V. HURD
Mark V. HurdChairman, Chief Executive Officer and President
(Principal Executive Officer)

Exhibit 31.2
CERTIFICATION
I, Robert P. Wayman, certify that:
1. I have reviewed this Annual Report on Form 10-K of Hewlett-Packard Company;
2. Based on my knowledge, this report does not contain any untrue statement of a material fact oromit to state a material fact necessary to make the statements made, in light of the circumstancesunder which such statements were made, not misleading with respect to the period covered by thisreport;
3. Based on my knowledge, the financial statements, and other financial information included in thisreport, fairly present in all material respects the financial condition, results of operations and cashflows of the registrant as of, and for, the periods presented in this report;
4. The registrant’s other certifying officer(s) and I are responsible for establishing and maintainingdisclosure controls and procedures (as defined in Exchange Act Rules 13a-15(e) and 15d-15(e))and internal control over financial reporting (as defined in Exchange Act Rules 13a-15(f) and15d-15(f)) for the registrant and have:
a) Designed such disclosure controls and procedures, or caused such disclosure controls andprocedures to be designed under our supervision, to ensure that material information relatingto the registrant, including its consolidated subsidiaries, is made known to us by others withinthose entities, particularly during the period in which this report is being prepared;
b) Designed such internal control over financial reporting, or caused such internal control overfinancial reporting to be designed under our supervision, to provide reasonable assuranceregarding the reliability of financial reporting and the preparation of financial statements forexternal purposes in accordance with generally accepted accounting principles;
c) Evaluated the effectiveness of the registrant’s disclosure controls and procedures, andpresented in this report our conclusions about the effectiveness of the disclosure controls andprocedures, as of the end of the period covered by this report based on such evaluation; and
d) Disclosed in this report any change in the registrant’s internal control over financial reportingthat occurred during the registrant’s most recent fiscal quarter (the registrant’s fourth fiscalquarter in the case of an annual report) that has materially affected, or is reasonably likely tomaterially affect, the registrant’s internal control over financial reporting; and
5. The registrant’s other certifying officer(s) and I have disclosed, based on our most recentevaluation of internal control over financial reporting, to the registrant’s auditors and the auditcommittee of the registrant’s board of directors (or persons performing the equivalent functions):
a) All significant deficiencies and material weaknesses in the design or operation of internalcontrol over financial reporting which are reasonably likely to adversely affect the registrant’sability to record, process, summarize and report financial information; and
b) Any fraud, whether or not material, that involves management or other employees who have asignificant role in the registrant’s internal control over financial reporting.
Date: December 15, 2006/s/ ROBERT P. WAYMAN
Robert P. Wayman,Executive Vice President and
Chief Financial Officer(Principal Financial Officer)
Exhibit 32
CERTIFICATIONOF
CHIEF EXECUTIVE OFFICERAND
CHIEF FINANCIAL OFFICERPURSUANT TO 18 U.S.C. 1350,AS ADOPTED PURSUANT TO
SECTION 906 OF THE SARBANES-OXLEY ACT OF 2002
I, Mark V. Hurd, certify, pursuant to 18 U.S.C. 1350, as adopted pursuant to Section 906 of theSarbanes-Oxley Act of 2002, that the Annual Report on Form 10-K of Hewlett-Packard Company forthe fiscal year ended October 31, 2006 fully complies with the requirements of Section 13(a) or 15(d)of the Securities Exchange Act of 1934 and that information contained in such Annual Report onForm 10-K fairly presents, in all material respects, the financial condition and results of operations ofHewlett-Packard Company.
December 15, 2006 By: /s/ MARK V. HURD
Mark V. HurdChairman, Chief Executive Officer and President
I, Robert P. Wayman, certify, pursuant to 18 U.S.C. 1350, as adopted pursuant to Section 906 ofthe Sarbanes-Oxley Act of 2002, that the Annual Report on Form 10-K of Hewlett-Packard Companyfor the fiscal year ended October 31, 2006 fully complies with the requirements of Section 13(a) or15(d) of the Securities Exchange Act of 1934 and that information contained in such Annual Report onForm 10-K fairly presents, in all material respects, the financial condition and results of operations ofHewlett-Packard Company.
December 15, 2006 By: /s/ ROBERT P. WAYMAN
Robert P. WaymanExecutive Vice President andChief Financial Officer
A signed original of this written statement required by Section 906 has been provided to Hewlett-Packard Company and will be retained by Hewlett-Packard Company and furnished to the Securitiesand Exchange Commission or its staff upon request.

www.hp.com/investor/home More information on HP’s non-financial performance is available in our Global Citizenship Report at www.hp.com/go/report. Cover printed on 100-percent recycled paper. © 2007 Hewlett-Packard Development Company, L.P. The information contained herein is subject to change without notice. The only warranties for HP products and services are set forth in the express warranty statements accompanying such products and services. Nothing herein should be construed as constituting an additional warranty. HP shall not be liable for technical or editorial errors or omissions contained herein. 4AA0-8557ENW 01/22/07
Related Documents