Sell Buy How You Can Recognize Market Tops and Market Bottoms

Welcome message from author
This document is posted to help you gain knowledge. Please leave a comment to let me know what you think about it! Share it to your friends and learn new things together.
Transcript

Sell
Buy
How You Can RecognizeMarket Tops andMarket Bottoms

2
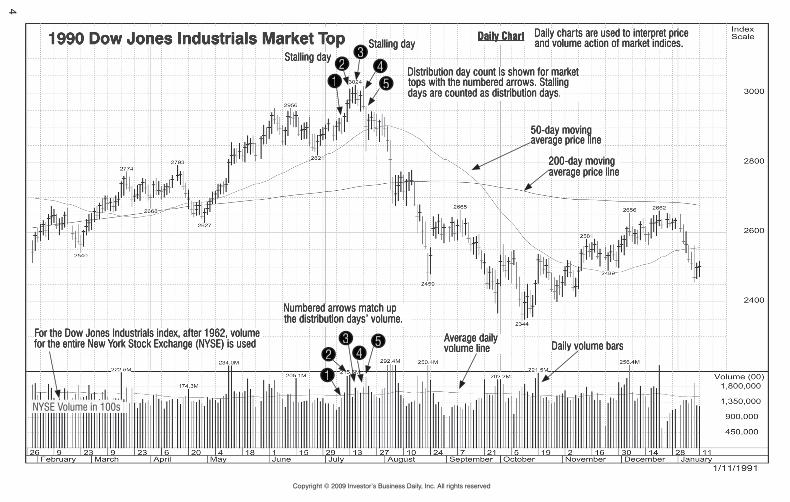
Market TopsAfter a sustained market uptrend, there will always be signs when the advancing phase is over. These signs will come as the market is still advancing. The key signal the market may be in a topping process is an increase in the number of distribution days in at least one major market index. A typical distribution day is one that closes down from the previous day (at least -0.2%) on higher volume than the prior day. This is your first clue institutional investors are selling stocks.
Up to five distribution days over a period of four or five weeks usually signals that the market is beginning to top. In addition to days down, you should also look for stalling days. When you suspect a stalling day, be sure to observe the price action for the previous day. The day before a stalling day will show a significant price increase when compared to its previous day. The stalling day will show only a tiny amount of price progress compared to its previous day and volume either increases or remains heavy. This I call heavy volume without further price progress up.
Another thing to watch is the action of the leaders. As the market is topping many of your market leaders may also show topping signs themselves. In addition, you may find you need to sell a stock because it drops 7-8% below your purchase price. Pay attention when the market starts forcing you out; it can help you protect your capital.

3
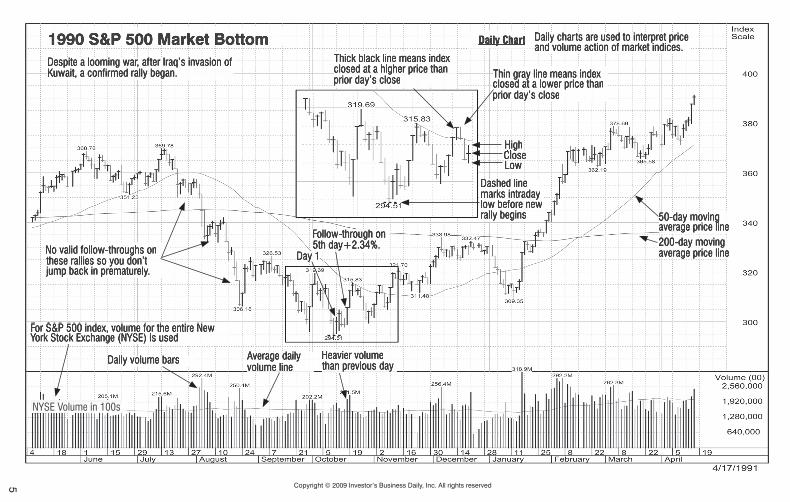
Market BottomsMarket bottoms are deciphered by your observing the daily price and volume action on the four major indices: the S&P 500, Nasdaq Composite, New York Stock Exchange (NYSE) Composite and Dow Jones Industrials. After the market makes a low, look for the first day the market closes up from the previous day. This is normally day one of a rally attempt. As long as the index is able to remain above the previous low, the attempted rally is in place.
The next step is to wait and watch for one or more of the four market indices to show a “follow-through day.” This is a day where the index closes up significantly on volume heavier than the previous day. The S&P 500 or NYSE Composite typically need to close up 1.7% or either the Nasdaq Composite or Dow Industrials need to close up 2.2% or more. The first three days of an attempted rally are too soon to judge if the market confirms its new uptrend by having a follow-through day. Follow-through days can happen on the fourth day or later of the rally attempt.
It is important to note that not all follow-through days lead to sustained new market uptrends. About 20-30% of the time they may fail fairly quickly. However, no bull market has ever started without a follow-through day…and it will occur when most people are unsure and afraid because the news during the decline was so negative that people become doubtful and hesitate to act on the confirmed new uptrend.
The Big Picture column, found on the front page of Investor’s Business Daily® everyday, can give you strong insight and help in determining the market direction. Also, watch the daily Market Wrap video found at www.investors.com.
The charts on the next two pages provide definitions of key features included in IBD® chart examples and can be used as an additional reference as you go through this booklet.
We look forward to helping you become a more skillful, successful investor with the knowledge to know how to always spot major market tops and bottoms that in turn create all new bull markets. You can do this.
William J. O’Neil
4
Copyright © 2009 Investor’s Business Daily, Inc. All rights reserved
1990 Dow Jones Industrials Market Top1990 Dow Jones Industrials Market Top
14455
233
1
4455
2233
Daily ChartDaily Chart
Average daily volume line Daily volume barsDaily volume bars
For the Dow Jones Industrials index, after 1962, volume for the entire New York Stock Exchange (NYSE) is used for the entire New York Stock Exchange (NYSE) is used
Distribution day count is shown for market tops with the numbered arrows. Stalling tops with the numbered arrows. Stalling days are counted as distribution days.
Daily charts are used to interpret price Daily charts are used to interpret price and volume action of market indices.and volume action of market indices.Stalling dayStalling day
Stalling dayStalling day
Numbered arrows match up the distribution days’ volume.the distribution days’ volume.
NYSE Volume in 100sNYSE Volume in 100s
200-day moving average price lineaverage price line
50-day moving average price line
5 Copyright © 2009 Investor’s Business Daily, Inc. All rights reserved
1990 S&P 500 Market Bottom1990 S&P 500 Market BottomDespite a looming war, after Iraq’s invasion of Kuwait, a confirmed rally began.
High
Low
Dashed line marks intraday low before new rally begins
CloseCloseHighCloseHighCloseCloseHighCloseHigh
Thick black line means index closed at a higher price than prior day’s close
No valid follow-throughs on these rallies so you don’t these rallies so you don’t jump back in prematurely.
Thin gray line means index closed at a lower price than prior day’s close
Average daily volume line
Daily volume bars
200-day moving average price lineaverage price line
50-day moving average price line
NYSE Volume in 100sNYSE Volume in 100s
For S&P 500 index, volume for the entire New For S&P 500 index, volume for the entire New York Stock Exchange (NYSE) is used York Stock Exchange (NYSE) is used York Stock Exchange (NYSE) is used
Daily ChartDaily Chart Daily charts are used to interpret price Daily charts are used to interpret price and volume action of market indices.and volume action of market indices.
Day 1Day 1
Heavier volume than previous daythan previous day
Day 1
Follow-through on 5th day+2.34%.
6
Copyright © 2009 Investor’s Business Daily, Inc. All rights reserved
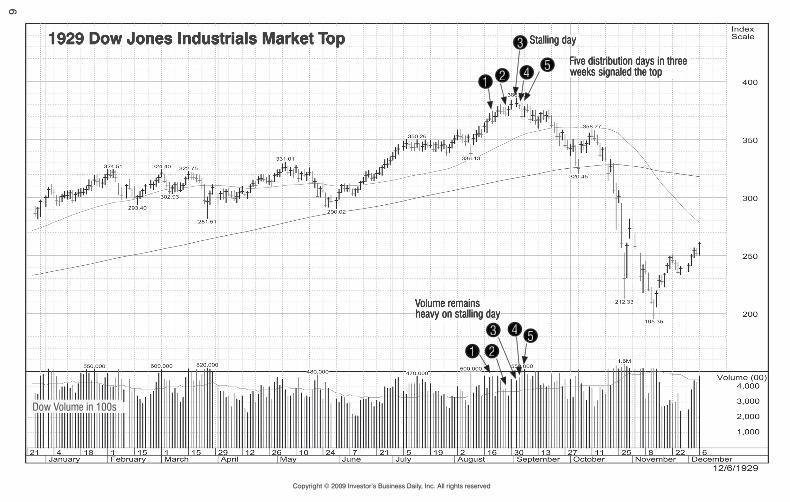
1929 Dow Jones Industrials Market Top1929 Dow Jones Industrials Market Top
1 225533 44
1 2255
33
44
Stalling dayStalling day
Volume remains heavy on stalling day
Dow Volume in 100s
Five distribution days in three weeks signaled the topweeks signaled the top
7 Copyright © 2009 Investor’s Business Daily, Inc. All rights reserved
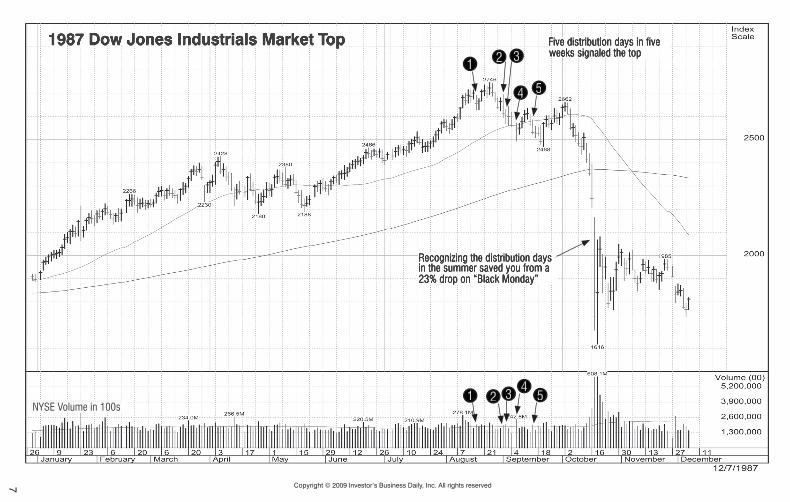
1987 Dow Jones Industrials Market Top1987 Dow Jones Industrials Market Top
1 22 5533 44
1 22
55
33
44
NYSE Volume in 100sNYSE Volume in 100s
Five distribution days in five weeks signaled the topweeks signaled the top
Recognizing the distribution days in the summer saved you from a 23% drop on “Black Monday”

8
Copyright © 2009 Investor’s Business Daily, Inc. All rights reserved
2000 Nasdaq Composite Market Top2000 Nasdaq Composite Market TopStalling day - reverses Stalling day - reverses from new high territory and closes near the lows up only 0.03% from previous day
Another stalling day
Volume remains heavy on stalling daysheavy on stalling days
1
1
5544
55
442
3322
33
Leading stocks were showing climax top signals at the same time
Nasdaq Volume in 100sNasdaq Volume in 100sNasdaq Volume in 100s
Five distribution days in four weeks signaled the topweeks signaled the top
9 Copyright © 2009 Investor’s Business Daily, Inc. All rights reserved
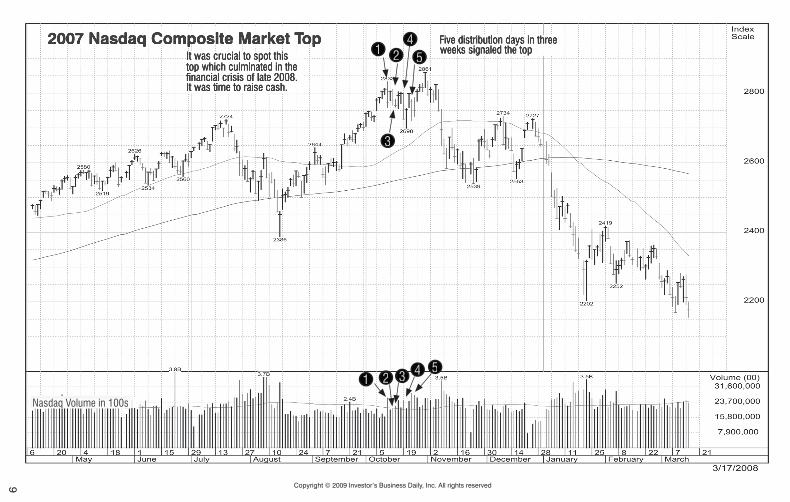
2007 Nasdaq Composite Market Top2007 Nasdaq Composite Market Top
1 2255
33 44
1 22 55
33
44
Nasdaq Volume in 100sNasdaq Volume in 100sNasdaq Volume in 100s
Five distribution days in three weeks signaled the topweeks signaled the topIt was crucial to spot this
top which culminated in the top which culminated in the financial crisis of late 2008. It was time to raise cash.

10
Copyright © 2009 Investor’s Business Daily, Inc. All rights reserved
1974 Dow Jones Industrials Market Bottom1974 Dow Jones Industrials Market Bottom
Day 1Day 1
Day 1
Heavier volume than previous daythan previous day
Heavier volume than previous daythan previous day
Follow-through on 7th day+1.82%. A lower threshold for follow-through days was used back in 1974. Up 1% or more was sufficient.or more was sufficient.
Follow-through on 4th day +2.70%, eventually fails
NYSE Volume in 100sNYSE Volume in 100s
11 Copyright © 2009 Investor’s Business Daily, Inc. All rights reserved
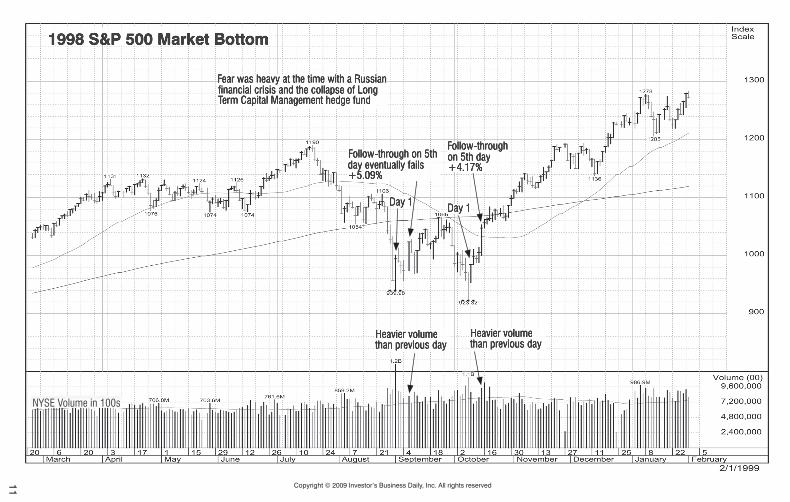
1998 S&P 500 Market Bottom1998 S&P 500 Market Bottom
Day 1Day 1
Heavier volume than previous daythan previous day
Heavier volume than previous daythan previous day
Fear was heavy at the time with a Russian financial crisis and the collapse of Long Term Capital Management hedge fund
Follow-through on 5th day+4.17%
Follow-through on 5th day eventually fails+5.09%
NYSE Volume in 100sNYSE Volume in 100s

12
Copyright © 2009 Investor’s Business Daily, Inc. All rights reserved
1999 Nasdaq Composite Market Bottom1999 Nasdaq Composite Market Bottom
Day 1Day 1
Heavier volume than previous daythan previous day
Strength continues next day Strength continues next day on even heavier volume
Not much was expected out of the market at this time due to Y2K fears
Follow-through on 7th day+2.59% with a gap up
Next day has another gap up and closes +3.17%; gives extra confirmationgives extra confirmationgives extra confirmationgives extra confirmation
Nasdaq Volume in 100sNasdaq Volume in 100sNasdaq Volume in 100s
13 Copyright © 2009 Investor’s Business Daily, Inc. All rights reserved
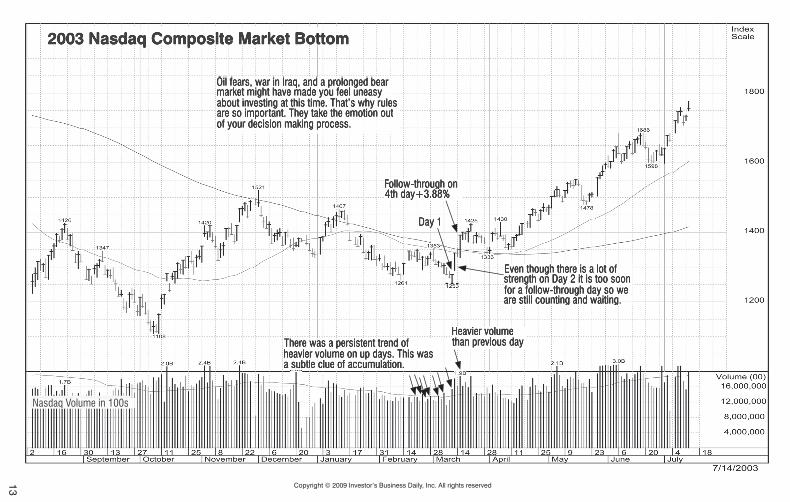
2003 Nasdaq Composite Market Bottom2003 Nasdaq Composite Market Bottom
Day 1Day 1
Heavier volume than previous daythan previous dayThere was a persistent trend of
heavier volume on up days. This was a subtle clue of accumulation.
Oil fears, war in Iraq, and a prolonged bear Oil fears, war in Iraq, and a prolonged bear market might have made you feel uneasy about investing at this time. That’s why rules are so important. They take the emotion out of your decision making process.
Follow-through on 4th day+3.88%
Even though there is a lot of strength on Day 2 it is too soon for a follow-through day so we are still counting and waiting.are still counting and waiting.
Nasdaq Volume in 100sNasdaq Volume in 100sNasdaq Volume in 100s

14
Copyright © 2009 Investor’s Business Daily, Inc. All rights reserved
2007 Nasdaq Composite Market Bottom2007 Nasdaq Composite Market Bottom
Day 1Day 1
It doesn’t matter that volume is below average, as long as it is higher than the previous day.than the previous day.
Although it was a short rally, many of the leaders notched significant gains.
Strong day on Strong day on heavier volume but only +1.25% only +1.25%
Powerful 2nd day, but too early
Follow-through on 10th day+2.50%
Nasdaq Volume in 100sNasdaq Volume in 100sNasdaq Volume in 100s

Financial Freedom Taught Here!Attend an IBD® Workshop in your area.
Subscriber Services
Educational HotlineCall 310-448-6150 to get instant answers to your questions about usingIBD, Investors.com and the CAN SLIM® Investment System. Available M-F 5:30am-4:30pm and Sat 7:00am-3:30pm (PT)
Investors.comDon’t forget to take advantage of all the powerful investing tools, stock lists, and exclusive market analysis at our website, www.investors.com
Level I: Beginning Strategies for Successful Investing
Level II: Intermediate Strategies for Successful Investing
Level III: Chart School
Level IV: CAN SLIM® Masters Program
Enroll today at www.IBDevents.com or call 800-827-8278 to � nd the right workshop for you!

1265
5 B
eatr
ice
Str
eet
Los
Ang
eles
, CA
900
66
Inve
stor
s.co
m
© 2
009
Inve
stor
’s B
usin
ess
Dai
ly, I
nc.
Inve
stor
’s B
usin
ess
Dai
ly,
IBD
, CA
N S
LIM
and
co
rres
pond
ing
logo
s ar
e re
gist
ered
trad
emar
ks o
wne
d by
Dat
a A
naly
sis,
Inc.
, an
affil
iate
of
Inve
stor
’s B
usin
ess
Dai
ly.
BLK
T-M
TMB
-01
How
You
Can
Rec
ogni
ze
Mar
ket T
ops
and
M
arke
t Bot
tom
s
Related Documents