How Useful are Current US Broadband Data? Kenneth Flamm Technology, Innovation, and Global Security Program The Robert S. Strauss Center for International Security and Law University of Texas at Austin "Broadband Data: What Do They Tell Us and Do We Have Enough?" Washington, D.C. June 28, 2007

How Useful are Current US Broadband Data? Kenneth Flamm Technology, Innovation, and Global Security Program The Robert S. Strauss Center for International.
Dec 16, 2015
Welcome message from author
This document is posted to help you gain knowledge. Please leave a comment to let me know what you think about it! Share it to your friends and learn new things together.
Transcript

How Useful are Current US Broadband Data?
Kenneth Flamm
Technology, Innovation, and Global Security ProgramThe Robert S. Strauss Center for International Security and Law
University of Texas at Austin
"Broadband Data: What Do They Tell Us and Do We Have Enough?"
Washington, D.C.June 28, 2007

Are FCC zip code data misleading?
Break in statistics in 2005 # reported providers doubles from 12/04-6/05 Previous numbers not comparable “Zero provider” zip codes not previously provided
Erroneous assumptions used by researchers to estimate “zero provider” areas Now known, no obvious fix to public released data
Zip code areas used by FCC constantly changing Do not correspond to Census ZCTA standard High turnover, changing areas complicate intertemporal comparisons Mix of “point” and “geographic” zips, mappings change frequently
Changing subset of both point and geo zips 41 1999 postal zips used in 6/05 dropped in 12/05 20 1999 postal zips not used in 6/05 show up in 12/05
Undocumented, proprietary mapping Zip codes often big areas
Service in one corner does not mean available in other corner Typically about 3700 households per zip code
Vs. zip + 4’s– about 10 households
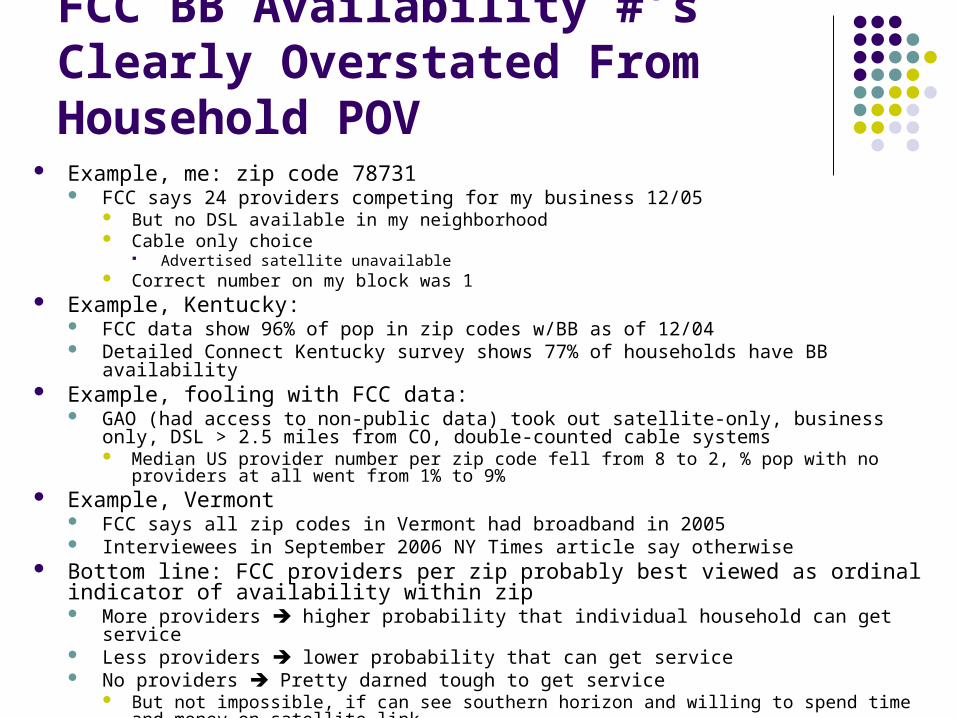
FCC BB Availability #’s Clearly Overstated From Household POV
Example, me: zip code 78731 FCC says 24 providers competing for my business 12/05
But no DSL available in my neighborhood Cable only choice
Advertised satellite unavailable Correct number on my block was 1
Example, Kentucky: FCC data show 96% of pop in zip codes w/BB as of 12/04 Detailed Connect Kentucky survey shows 77% of households have BB availability
Example, fooling with FCC data: GAO (had access to non-public data) took out satellite-only, business only, DSL > 2.5 miles
from CO, double-counted cable systems Median US provider number per zip code fell from 8 to 2, % pop with no providers at all went from
1% to 9% Example, Vermont
FCC says all zip codes in Vermont had broadband in 2005 Interviewees in September 2006 NY Times article say otherwise
Bottom line: FCC providers per zip probably best viewed as ordinal indicator of availability within zip More providers higher probability that individual household can get service Less providers lower probability that can get service No providers Pretty darned tough to get service
But not impossible, if can see southern horizon and willing to spend time and money on satellite link
Other USG agencies also not particularly helpful
BLS uses obfuscating categories in price data collected for Internet services PPI Dialup and DSL access (!) lumped into one category Leased lines and DSL in a second category Cable and all other forms of Internet access lumped into third category Not very useful if interested in understanding what is going on in
broadband Fixed weight price indexes also not very useful in rapidly changing
industry Census/Commerce discontinued the one real scientific survey that
measured Internet access modes and prices years ago The Internet is growing less important?
Private consulting surveys have undocumented methodologies And are, well…private!
Public Pew national survey extremely valuable, but very small sample size, can’t answer geographic/regional questions Also a series of one-off surveys, not an instrument designed to
maintain regular and consistent data over time

FCC “Level 0 Disconnectedness” Hard core disconnectedness by state Absolutely no providers of BB service in FCC stats
183,000 people, .065% of US pop in 6/05 .033% US pop in 12/05
Most Level 0 disconnected states: Kentucky (>1% in 6/05) Followed by West Virginia, Dakotas, Montana
Puerto Rico and Vermont among least Level 0 disconnected states Should give us pause! % pop disconnected generally declines from 6/05 to 12/05, but some
exceptions: Minnesota, Illinois, Virginia, Washington, Indiana
Very small problem Less than .1% pop for US overall No state > 1% pop in 12/05

FCC “Level 1 Disconnectedness”
< 4 bb providers in FCC stats Significant probability that substantial # households do not have access to bb
Very different picture Puerto Rico now leads for June 2005, almost 2/3 of pop (falls to 22% in Dec 2005) Right behind, Dakotas, West Virginia, Montana Vermont now well above national average in disconnectedness
Share of pop in “Level 1” generally declines over 6-12/2005 Some exceptions:
Georgia, Illinois, Washington, New York, Michigan, Maryland, Massachusetts, Delaware, Arizona, California, Connecticut, New Jersey….but increases generally very small
In Illinois, Delaware, Arizona, >1% pop now more disconnected Level 1 Disconnected pop coincidentally quite close to estimates of pop w/o
broadband Nationally, GAO says 9% 12/04 vs. 7% Level 1 for 6/05 ConnectKentucky says 23% lack access to bb spring 05, vs 19% in Level1 disconnected zips in
6/05 Conservative rule of thumb?
Not such a tiny problem: In 28 US states (including PR), Level 1 > 5% in 12/05 12 states > 10% 4 states (PR, Dakotas, WV) > 20%
Questions Why not add zip + 4 to existing system?
Records already maintained in this format by all major service providers
If using zips - 4, why not use ZCTA standard used by all other USG statistical agencies, enable use of other standard data collected by USG agencies?
Why not break into wired (cable, DSL, fiber, T-1, ISDN, etc.) vs. wireless (wi-fi, satellite, etc.) classification? Hard to understand how truly proprietary info revealed
Why not break into speed bins? E.g., .2-1, 1-11, 12-54, 55-110, 111-300, 301-1K,1K-10K, 10K-
100K, 100K+ mbps At least collect on this basis, present in aggregate form
Nominal (peak speed) OK as long as consistent Up vs. down

Backup

No. zip codes, Jun05 2000 population No. zip codes, Dec05 2000 population % of 2000 pop disconnected % of zips disconnected
State FIPS code State dummy # w/bb w/o bb w/bb w/o bb w/bb w/o bb w/bb w/o bb Jun 05 Dec 05 Jun 05 Dec 05
KY Kentucky 21 18 648 41 3,982,510 41,529 660 29 3,993,650 30,389 1.032% 0.755% 5.951% 4.209%
WV West Virginia 54 49 506 50 1,697,799 17,604 532 24 1,708,620 6,783 1.026% 0.395% 8.993% 4.317%
ND North Dakota 38 35 338 27 628,997 6,384 365 0 635,381 0 1.005% 0.000% 7.397% 0.000%
SD South Dakota 46 42 321 27 737,953 7,182 343 5 744,376 759 0.964% 0.102% 7.759% 1.437%
MT Montana 30 27 281 24 881,649 4,852 302 3 885,758 743 0.547% 0.084% 7.869% 0.984%
KS Kansas 20 17 642 28 2,674,262 9,824 670 0 2,684,086 0 0.366% 0.000% 4.179% 0.000%
OK Oklahoma 40 37 561 19 3,408,895 10,581 575 5 3,418,346 1,130 0.309% 0.033% 3.276% 0.862%
NE Nebraska 31 28 538 17 1,703,292 4,212 555 0 1,707,504 0 0.247% 0.000% 3.063% 0.000%
MO Missouri 29 26 916 49 5,572,317 11,836 952 13 5,582,026 2,127 0.212% 0.038% 5.078% 1.347%
ME Maine 23 20 380 7 1,266,748 2,103 380 7 1,267,067 1,784 0.166% 0.141% 1.809% 1.809%
UT Utah 49 45 207 8 2,195,819 3,607 212 3 2,198,262 1,164 0.164% 0.053% 3.721% 1.395%
IA Iowa 19 16 878 17 2,910,824 4,119 886 9 2,912,669 2,274 0.141% 0.078% 1.899% 1.006%
HI Hawaii 15 12 80 3 1,202,304 1,611 80 3 1,202,304 1,611 0.134% 0.134% 3.614% 3.614%
ID Idaho 16 13 237 6 1,282,180 1,514 240 3 1,283,385 309 0.118% 0.024% 2.469% 1.235%
TN Tennessee 47 43 586 4 5,669,596 6,430 588 2 5,673,171 2,855 0.113% 0.050% 0.678% 0.339%
MN Minnesota 27 24 818 14 4,903,364 4,914 816 16 4,899,719 8,559 0.100% 0.174% 1.683% 1.923%
PA Pennsylvania 42 39 1397 31 12,171,023 11,064 1411 17 12,177,450 4,637 0.091% 0.038% 2.171% 1.190%
WI Wisconsin 55 50 705 11 5,350,407 4,172 714 2 5,353,134 1,445 0.078% 0.027% 1.536% 0.279%
MS Mississippi 28 25 366 5 2,817,158 2,187 370 1 2,817,756 1,589 0.078% 0.056% 1.348% 0.270%
Total 28662 488 283,490,720 183,268 28932 218 283,579,735 94,253 0.065% 0.033% 1.674% 0.748%
AL Alabama 1 1 582 5 4,430,361 2,548 586 1 4,432,233 676 0.057% 0.015% 0.852% 0.170%
NM New Mexico 35 32 257 7 1,749,467 902 262 2 1,750,279 90 0.052% 0.005% 2.652% 0.758%
IL Illinois 17 14 1215 17 12,336,519 5,799 1212 20 12,331,194 11,124 0.047% 0.090% 1.380% 1.623%
OR Oregon 41 38 374 10 3,412,106 1,580 379 5 3,412,352 1,334 0.046% 0.039% 2.604% 1.302%
WY Wyoming 56 51 134 1 482,767 190 135 0 482,957 0 0.039% 0.000% 0.741% 0.000%
CT Connecticut 9 7 257 2 3,346,051 1,198 258 1 3,346,980 269 0.036% 0.008% 0.772% 0.386%
LA Louisiana 22 19 458 2 4,444,383 1,356 459 1 4,445,448 291 0.031% 0.007% 0.435% 0.217%
RI Rhode Island 44 40 68 1 1,047,781 275 69 0 1,048,056 0 0.026% 0.000% 1.449% 0.000%
VA Virginia 51 47 810 8 7,061,550 1,825 808 10 7,060,500 2,875 0.026% 0.041% 0.978% 1.222%
NV Nevada 32 29 120 1 1,967,435 495 120 1 1,967,435 495 0.025% 0.025% 0.826% 0.826%
TX Texas 48 44 1660 18 20,713,825 4,945 1668 10 20,715,270 3,500 0.024% 0.017% 1.073% 0.596%
NY New York 36 33 1539 10 18,946,602 3,101 1539 10 18,947,400 2,303 0.016% 0.012% 0.646% 0.646%
WA Washington 53 48 499 2 5,874,353 909 498 3 5,873,728 1,534 0.015% 0.026% 0.399% 0.599%
MD Maryland 24 21 418 4 5,286,913 579 420 2 5,287,220 272 0.011% 0.005% 0.948% 0.474%
OH Ohio 39 36 1004 1 11,296,055 481 1004 1 11,296,055 481 0.004% 0.004% 0.100% 0.100%
IN Indiana 18 15 675 3 6,061,584 236 672 6 6,061,389 431 0.004% 0.007% 0.442% 0.885%
CA California 6 5 1564 7 33,803,364 1,034 1569 2 33,804,068 330 0.003% 0.001% 0.446% 0.127%
CO Colorado 8 6 418 1 4,255,509 90 418 1 4,255,509 90 0.002% 0.002% 0.239% 0.239%
AK Alaska 2 2 200 0 609,846 0 200 0 609,846 0 0 0 0 0
AZ Arizona 4 3 293 0 5,034,398 0 293 0 5,034,398 0 0 0 0 0
AR Arkansas 5 4 551 0 2,663,766 0 551 0 2,663,766 0 0 0 0 0
DE Delaware 10 8 56 0 781,046 0 56 0 781,046 0 0 0 0 0
DC District of Columbia 11 9 22 0 566,755 0 22 0 566,755 0 0 0 0 0
FL Florida 12 10 869 0 15,957,398 0 869 0 15,957,398 0 0 0 0 0
GA Georgia 13 11 641 0 8,055,173 0 641 0 8,055,173 0 0 0 0 0
MA Massachusetts 25 22 483 0 6,341,333 0 483 0 6,341,333 0 0 0 0 0
MI Michigan 26 23 892 0 9,919,297 0 892 0 9,919,297 0 0 0 0 0
NH New Hampshire 33 30 217 0 1,232,189 0 217 0 1,232,189 0 0 0 0 0
NJ New Jersey 34 31 543 0 8,398,463 0 543 0 8,398,463 0 0 0 0 0
NC North Carolina 37 34 710 0 8,013,160 0 710 0 8,013,160 0 0 0 0 0
SC South Carolina 45 41 370 0 3,999,309 0 370 0 3,999,309 0 0 0 0 0
VT Vermont 50 46 240 0 604,993 0 240 0 604,993 0 0 0 0 0
PR Puerto Rico 72 52 118 0 3,739,872 0 118 0 3,739,872 0 0 0 0 0
“Level 0” D
isconnectedness
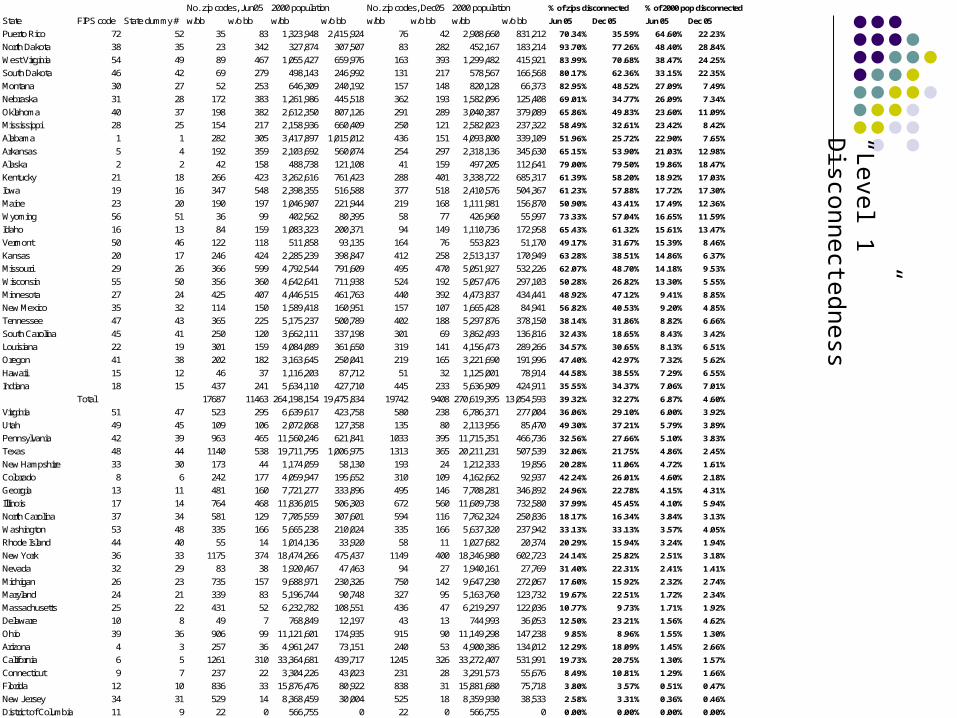
No. zip codes, Jun05 2000 population No. zip codes, Dec05 2000 population % of zips disconnected % of 2000 pop disconnected
State FIPS code State dummy # w/bb w/o bb w/bb w/o bb w/bb w/o bb w/bb w/o bb Jun 05 Dec 05 Jun 05 Dec 05
Puerto Rico 72 52 35 83 1,323,948 2,415,924 76 42 2,908,660 831,212 70.34% 35.59% 64.60% 22.23%
North Dakota 38 35 23 342 327,874 307,507 83 282 452,167 183,214 93.70% 77.26% 48.40% 28.84%
West Virginia 54 49 89 467 1,055,427 659,976 163 393 1,299,482 415,921 83.99% 70.68% 38.47% 24.25%
South Dakota 46 42 69 279 498,143 246,992 131 217 578,567 166,568 80.17% 62.36% 33.15% 22.35%
Montana 30 27 52 253 646,309 240,192 157 148 820,128 66,373 82.95% 48.52% 27.09% 7.49%
Nebraska 31 28 172 383 1,261,986 445,518 362 193 1,582,096 125,408 69.01% 34.77% 26.09% 7.34%
Oklahoma 40 37 198 382 2,612,350 807,126 291 289 3,040,387 379,089 65.86% 49.83% 23.60% 11.09%
Mississippi 28 25 154 217 2,158,936 660,409 250 121 2,582,023 237,322 58.49% 32.61% 23.42% 8.42%
Alabama 1 1 282 305 3,417,897 1,015,012 436 151 4,093,800 339,109 51.96% 25.72% 22.90% 7.65%
Arkansas 5 4 192 359 2,103,692 560,074 254 297 2,318,136 345,630 65.15% 53.90% 21.03% 12.98%
Alaska 2 2 42 158 488,738 121,108 41 159 497,205 112,641 79.00% 79.50% 19.86% 18.47%
Kentucky 21 18 266 423 3,262,616 761,423 288 401 3,338,722 685,317 61.39% 58.20% 18.92% 17.03%
Iowa 19 16 347 548 2,398,355 516,588 377 518 2,410,576 504,367 61.23% 57.88% 17.72% 17.30%
Maine 23 20 190 197 1,046,907 221,944 219 168 1,111,981 156,870 50.90% 43.41% 17.49% 12.36%
Wyoming 56 51 36 99 402,562 80,395 58 77 426,960 55,997 73.33% 57.04% 16.65% 11.59%
Idaho 16 13 84 159 1,083,323 200,371 94 149 1,110,736 172,958 65.43% 61.32% 15.61% 13.47%
Vermont 50 46 122 118 511,858 93,135 164 76 553,823 51,170 49.17% 31.67% 15.39% 8.46%
Kansas 20 17 246 424 2,285,239 398,847 412 258 2,513,137 170,949 63.28% 38.51% 14.86% 6.37%
Missouri 29 26 366 599 4,792,544 791,609 495 470 5,051,927 532,226 62.07% 48.70% 14.18% 9.53%
Wisconsin 55 50 356 360 4,642,641 711,938 524 192 5,057,476 297,103 50.28% 26.82% 13.30% 5.55%
Minnesota 27 24 425 407 4,446,515 461,763 440 392 4,473,837 434,441 48.92% 47.12% 9.41% 8.85%
New Mexico 35 32 114 150 1,589,418 160,951 157 107 1,665,428 84,941 56.82% 40.53% 9.20% 4.85%
Tennessee 47 43 365 225 5,175,237 500,789 402 188 5,297,876 378,150 38.14% 31.86% 8.82% 6.66%
South Carolina 45 41 250 120 3,662,111 337,198 301 69 3,862,493 136,816 32.43% 18.65% 8.43% 3.42%
Louisiana 22 19 301 159 4,084,089 361,650 319 141 4,156,473 289,266 34.57% 30.65% 8.13% 6.51%
Oregon 41 38 202 182 3,163,645 250,041 219 165 3,221,690 191,996 47.40% 42.97% 7.32% 5.62%
Hawaii 15 12 46 37 1,116,203 87,712 51 32 1,125,001 78,914 44.58% 38.55% 7.29% 6.55%
Indiana 18 15 437 241 5,634,110 427,710 445 233 5,636,909 424,911 35.55% 34.37% 7.06% 7.01%
Total 17687 11463 264,198,154 19,475,834 19742 9408 270,619,395 13,054,593 39.32% 32.27% 6.87% 4.60%
Virginia 51 47 523 295 6,639,617 423,758 580 238 6,786,371 277,004 36.06% 29.10% 6.00% 3.92%
Utah 49 45 109 106 2,072,068 127,358 135 80 2,113,956 85,470 49.30% 37.21% 5.79% 3.89%
Pennsylvania 42 39 963 465 11,560,246 621,841 1033 395 11,715,351 466,736 32.56% 27.66% 5.10% 3.83%
Texas 48 44 1140 538 19,711,795 1,006,975 1313 365 20,211,231 507,539 32.06% 21.75% 4.86% 2.45%
New Hampshire 33 30 173 44 1,174,059 58,130 193 24 1,212,333 19,856 20.28% 11.06% 4.72% 1.61%
Colorado 8 6 242 177 4,059,947 195,652 310 109 4,162,662 92,937 42.24% 26.01% 4.60% 2.18%
Georgia 13 11 481 160 7,721,277 333,896 495 146 7,708,281 346,892 24.96% 22.78% 4.15% 4.31%
Illinois 17 14 764 468 11,836,015 506,303 672 560 11,609,738 732,580 37.99% 45.45% 4.10% 5.94%
North Carolina 37 34 581 129 7,705,559 307,601 594 116 7,762,324 250,836 18.17% 16.34% 3.84% 3.13%
Washington 53 48 335 166 5,665,238 210,024 335 166 5,637,320 237,942 33.13% 33.13% 3.57% 4.05%
Rhode Island 44 40 55 14 1,014,136 33,920 58 11 1,027,682 20,374 20.29% 15.94% 3.24% 1.94%
New York 36 33 1175 374 18,474,266 475,437 1149 400 18,346,980 602,723 24.14% 25.82% 2.51% 3.18%
Nevada 32 29 83 38 1,920,467 47,463 94 27 1,940,161 27,769 31.40% 22.31% 2.41% 1.41%
Michigan 26 23 735 157 9,688,971 230,326 750 142 9,647,230 272,067 17.60% 15.92% 2.32% 2.74%
Maryland 24 21 339 83 5,196,744 90,748 327 95 5,163,760 123,732 19.67% 22.51% 1.72% 2.34%
Massachusetts 25 22 431 52 6,232,782 108,551 436 47 6,219,297 122,036 10.77% 9.73% 1.71% 1.92%
Delaware 10 8 49 7 768,849 12,197 43 13 744,993 36,053 12.50% 23.21% 1.56% 4.62%
Ohio 39 36 906 99 11,121,601 174,935 915 90 11,149,298 147,238 9.85% 8.96% 1.55% 1.30%
Arizona 4 3 257 36 4,961,247 73,151 240 53 4,900,386 134,012 12.29% 18.09% 1.45% 2.66%
California 6 5 1261 310 33,364,681 439,717 1245 326 33,272,407 531,991 19.73% 20.75% 1.30% 1.57%
Connecticut 9 7 237 22 3,304,226 43,023 231 28 3,291,573 55,676 8.49% 10.81% 1.29% 1.66%
Florida 12 10 836 33 15,876,476 80,922 838 31 15,881,680 75,718 3.80% 3.57% 0.51% 0.47%
New Jersey 34 31 529 14 8,368,459 30,004 525 18 8,359,930 38,533 2.58% 3.31% 0.36% 0.46%
District of Columbia 11 9 22 0 566,755 0 22 0 566,755 0 0.00% 0.00% 0.00% 0.00%
“Level 1” D
isconnectedness

Related Documents