1 How to Tell Ancient Signs Apart? Recognizing and Visualizing Maya Glyphs with CNNs GÜLCAN CAN, Idiap Research Institute and École Polytechnique Fédérale de Lausanne (EPFL), Switzerland JEAN-MARC ODOBEZ, Idiap Research Institute and École Polytechnique Fédérale de Lausanne (EPFL), Switzerland DANIEL GATICA-PEREZ, Idiap Research Institute and École Polytechnique Fédérale de Lausanne (EPFL), Switzerland Thanks to the digital preservation of cultural heritage material, multimedia tools, e.g. based on automatic visual processing, enable to considerably ease the work of scholars in the humanities and help them to perform quantitative analysis of their data. In this context, this paper assesses three different Convolutional Neural Network (CNN) architectures along with three learning approaches to train them for hieroglyph classification, which is a very challenging task due to the limited availability of segmented ancient Maya glyphs. More precisely, the first approach, the baseline, relies on pretrained networks as feature extractor. The second one investigates a transfer learning method by fine-tuning a pretrained network for our glyph classification task. The third approach considers directly training networks from scratch with our glyph data. The merits of three different network architectures are compared: a generic sequential model (i.e. LeNet), a sketch-specific sequential network (i.e. Sketch-a-Net), and the recent Residual Networks. The sketch-specific model trained from scratch outperforms other models and training strategies. Even for a challenging 150-class classification task, this model achieves 70.3% average accuracy and proves itself promising in case of small amount of cultural heritage shape data. Furthermore, we visualize the discriminative parts of glyphs with the recent Grad-CAM method, and demonstrate that the discriminative parts learned by the model agrees in general with the expert annotation of the glyph specificity (diagnostic features). Finally, as a step towards systematic evaluation of these visualizations, we conduct a perceptual crowdsourcing study. Specifically, we analyze the interpretability of the representations from Sketch-a-Net and ResNet-50. Overall, our paper takes two important steps towards providing tools to scholars in the digital humanities: increased performance for automation, and improved interpretability of algorithms. CCS Concepts: • Computing methodologies → Shape representations; Neural networks; Object identification; • Ap- plied computing → Arts and humanities; Additional Key Words and Phrases: Maya glyphs, shape recognition, convolutional neural networks, transfer learning, crowdsourcing ACM Reference Format: Gülcan Can, Jean-Marc Odobez, and Daniel Gatica-Perez. 2018. How to Tell Ancient Signs Apart? Recognizing and Visualizing Maya Glyphs with CNNs. ACM J. Comput. Cult. Herit. 1, 1, Article 1 (July 2018), 25 pages. https://doi.org/10.1145/3230670 This work was funded by the Swiss National Science Foundation through the MAAYA project and by the Hasler Foundation through the DCrowdLens project. Authors’ addresses: G. Can, J.M. Odobez, and D. Gatica-Perez are with Idiap Research Institute, and the School of Electrical Engineering of the Swiss Federal Institute of Technology in Lausanne (EPFL), Switzerland. e-mail: [email protected], [email protected], and [email protected]. Permission to make digital or hard copies of all or part of this work for personal or classroom use is granted without fee provided that copies are not made or distributed for profit or commercial advantage and that copies bear this notice and the full citation on the first page. Copyrights for components of this work owned by others than the author(s) must be honored. Abstracting with credit is permitted. To copy otherwise, or republish, to post on servers or to redistribute to lists, requires prior specific permission and/or a fee. Request permissions from [email protected]. © 2018 Copyright held by the owner/author(s). Publication rights licensed to Association for Computing Machinery. XXXX-XXXX/2018/7-ART1 $15.00 https://doi.org/10.1145/3230670 ACM J. Comput. Cult. Herit., Vol. 1, No. 1, Article 1. Publication date: July 2018.

Welcome message from author
This document is posted to help you gain knowledge. Please leave a comment to let me know what you think about it! Share it to your friends and learn new things together.
Transcript
1
How to Tell Ancient Signs Apart?Recognizing and Visualizing Maya Glyphs with CNNs
GÜLCAN CAN, Idiap Research Institute and École Polytechnique Fédérale de Lausanne (EPFL), SwitzerlandJEAN-MARC ODOBEZ, Idiap Research Institute and École Polytechnique Fédérale de Lausanne (EPFL),SwitzerlandDANIEL GATICA-PEREZ, Idiap Research Institute and École Polytechnique Fédérale de Lausanne (EPFL),Switzerland
Thanks to the digital preservation of cultural heritage material, multimedia tools, e.g. based on automatic visual processing,enable to considerably ease the work of scholars in the humanities and help them to perform quantitative analysis of theirdata. In this context, this paper assesses three different Convolutional Neural Network (CNN) architectures along withthree learning approaches to train them for hieroglyph classification, which is a very challenging task due to the limitedavailability of segmented ancient Maya glyphs. More precisely, the first approach, the baseline, relies on pretrained networksas feature extractor. The second one investigates a transfer learning method by fine-tuning a pretrained network for our glyphclassification task. The third approach considers directly training networks from scratch with our glyph data. The meritsof three different network architectures are compared: a generic sequential model (i.e. LeNet), a sketch-specific sequentialnetwork (i.e. Sketch-a-Net), and the recent Residual Networks. The sketch-specific model trained from scratch outperformsother models and training strategies. Even for a challenging 150-class classification task, this model achieves 70.3% averageaccuracy and proves itself promising in case of small amount of cultural heritage shape data. Furthermore, we visualize thediscriminative parts of glyphs with the recent Grad-CAM method, and demonstrate that the discriminative parts learned bythe model agrees in general with the expert annotation of the glyph specificity (diagnostic features). Finally, as a step towardssystematic evaluation of these visualizations, we conduct a perceptual crowdsourcing study. Specifically, we analyze theinterpretability of the representations from Sketch-a-Net and ResNet-50. Overall, our paper takes two important steps towardsproviding tools to scholars in the digital humanities: increased performance for automation, and improved interpretability ofalgorithms.
CCS Concepts: • Computing methodologies → Shape representations; Neural networks; Object identification; • Ap-plied computing → Arts and humanities;
Additional Key Words and Phrases: Maya glyphs, shape recognition, convolutional neural networks, transfer learning,crowdsourcing
ACM Reference Format:Gülcan Can, Jean-Marc Odobez, and Daniel Gatica-Perez. 2018. How to Tell Ancient Signs Apart? Recognizing and VisualizingMaya Glyphs with CNNs. ACM J. Comput. Cult. Herit. 1, 1, Article 1 (July 2018), 25 pages.https://doi.org/10.1145/3230670
This work was funded by the Swiss National Science Foundation through the MAAYA project and by the Hasler Foundation through theDCrowdLens project. Authors’ addresses: G. Can, J.M. Odobez, and D. Gatica-Perez are with Idiap Research Institute, and the School ofElectrical Engineering of the Swiss Federal Institute of Technology in Lausanne (EPFL), Switzerland. e-mail: [email protected], [email protected],and [email protected] to make digital or hard copies of all or part of this work for personal or classroom use is granted without fee provided thatcopies are not made or distributed for profit or commercial advantage and that copies bear this notice and the full citation on the first page.Copyrights for components of this work owned by others than the author(s) must be honored. Abstracting with credit is permitted. To copyotherwise, or republish, to post on servers or to redistribute to lists, requires prior specific permission and/or a fee. Request permissions [email protected].© 2018 Copyright held by the owner/author(s). Publication rights licensed to Association for Computing Machinery.XXXX-XXXX/2018/7-ART1 $15.00https://doi.org/10.1145/3230670
ACM J. Comput. Cult. Herit., Vol. 1, No. 1, Article 1. Publication date: July 2018.
1:2 • G. Can et al.
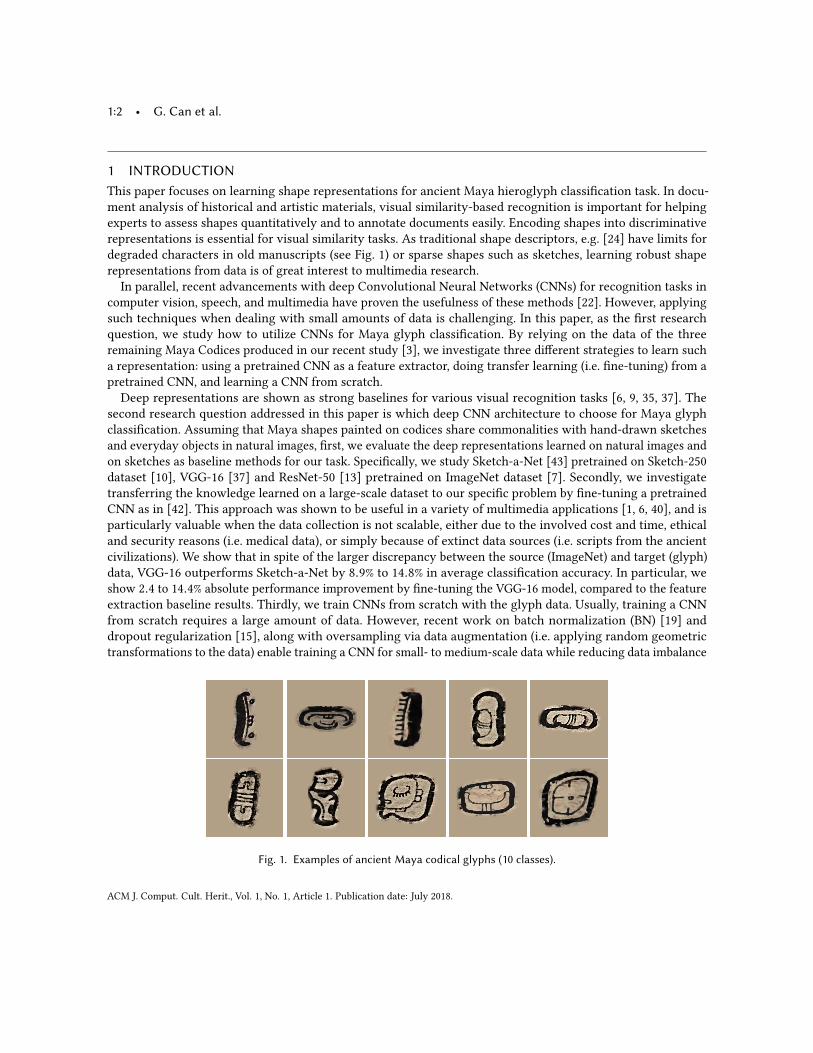
1 INTRODUCTIONThis paper focuses on learning shape representations for ancient Maya hieroglyph classification task. In docu-ment analysis of historical and artistic materials, visual similarity-based recognition is important for helpingexperts to assess shapes quantitatively and to annotate documents easily. Encoding shapes into discriminativerepresentations is essential for visual similarity tasks. As traditional shape descriptors, e.g. [24] have limits fordegraded characters in old manuscripts (see Fig. 1) or sparse shapes such as sketches, learning robust shaperepresentations from data is of great interest to multimedia research.In parallel, recent advancements with deep Convolutional Neural Networks (CNNs) for recognition tasks in
computer vision, speech, and multimedia have proven the usefulness of these methods [22]. However, applyingsuch techniques when dealing with small amounts of data is challenging. In this paper, as the first researchquestion, we study how to utilize CNNs for Maya glyph classification. By relying on the data of the threeremaining Maya Codices produced in our recent study [3], we investigate three different strategies to learn sucha representation: using a pretrained CNN as a feature extractor, doing transfer learning (i.e. fine-tuning) from apretrained CNN, and learning a CNN from scratch.Deep representations are shown as strong baselines for various visual recognition tasks [6, 9, 35, 37]. The
second research question addressed in this paper is which deep CNN architecture to choose for Maya glyphclassification. Assuming that Maya shapes painted on codices share commonalities with hand-drawn sketchesand everyday objects in natural images, first, we evaluate the deep representations learned on natural images andon sketches as baseline methods for our task. Specifically, we study Sketch-a-Net [43] pretrained on Sketch-250dataset [10], VGG-16 [37] and ResNet-50 [13] pretrained on ImageNet dataset [7]. Secondly, we investigatetransferring the knowledge learned on a large-scale dataset to our specific problem by fine-tuning a pretrainedCNN as in [42]. This approach was shown to be useful in a variety of multimedia applications [1, 6, 40], and isparticularly valuable when the data collection is not scalable, either due to the involved cost and time, ethicaland security reasons (i.e. medical data), or simply because of extinct data sources (i.e. scripts from the ancientcivilizations). We show that in spite of the larger discrepancy between the source (ImageNet) and target (glyph)data, VGG-16 outperforms Sketch-a-Net by 8.9% to 14.8% in average classification accuracy. In particular, weshow 2.4 to 14.4% absolute performance improvement by fine-tuning the VGG-16 model, compared to the featureextraction baseline results. Thirdly, we train CNNs from scratch with the glyph data. Usually, training a CNNfrom scratch requires a large amount of data. However, recent work on batch normalization (BN) [19] anddropout regularization [15], along with oversampling via data augmentation (i.e. applying random geometrictransformations to the data) enable training a CNN for small- to medium-scale data while reducing data imbalance
Fig. 1. Examples of ancient Maya codical glyphs (10 classes).
ACM J. Comput. Cult. Herit., Vol. 1, No. 1, Article 1. Publication date: July 2018.
How to Tell Ancient Signs Apart?Recognizing and Visualizing Maya Glyphs with CNNs • 1:3
[14] and overfitting issues. This way, we achieve improved results with Sketch-a-Net compared to the fine-tuningapproach, demonstrating that nowadays network training may not necessarily require large amount of data to beeffective.The third research question is posed as whether the CNNs are able to catch the diagnostic parts of Maya
glyphs. To analyze the interpretability of the learned deep visual representations, we visualize the discriminativeparts of glyphs according to the trained CNNs via gradient backpropagation [36] and Grad-CAM [34] methods.We show that the trained models have a great interpretability potential, as the discriminative parts of glyphsoverlap with the expert descriptions in a 5-glyph case study. Additionally, we discuss the potential of Grad-CAMmethod in glyph localization in a cluttered setting, i.e. glyph-blocks. Finally, to assess the GradCAM visualizationsthoroughly, we conduct a perceptual crowdsourcing study. The fourth research question assessed in this study iswhich CNN spots diagnostic parts of glyphs better according to non-experts. In this study, non-experts rate thevisualizations from two models, namely Sketch-a-Net and ResNet-50, both individually and relatively for 100glyphs. From these ratings, we observe that non-experts generally favor the better-focused visualizations fromSketch-a-Net.We summarize our research questions below.
RQ1. How to utilize deep CNNs on Maya glyph classification?RQ2. Which deep CNN architecture to choose for Maya glyph classification?RQ3. Can CNNs catch diagnostic parts of Maya glyphs?RQ4. If so, which CNN spots diagnostic parts of glyphs better according to the crowdworkers’ perception?
Our contributions are as follows:(1) We study different ways to train a CNN for small-scale data, namely feature extraction from pretrained
networks, fine-tuning pretrained networks, and training from scratch for the recognition of ancient Mayaglyphs, a data source between history and art;
(2) We systematically assess a variety of CNN models from old to recent ones, i.e. LeNet [23], Sketch-a-Net[43], VGG [37], ResNet [13], and designed for different purposes (natural image vs. sketch classification);
(3) We examine the discriminative parts of ancient glyphs learned by the network using gradient-based visualexplanations. This can provide an interesting interpretability capacity, which is important for domainexperts.
(4) We conduct a perceptual crowdsourcing study to assess the interpretability capacity of two models, namelySketch-a-Net and ResNet, by the help of GradCAM [34] visualization method.
Overall, our paper presents promising shape representation learning approaches for limited cultural heritagedata as well as giving insights on the interpretability of these representations. These two points are important inthe context of providing automated and interpretable tools to scholars in Digital Humanities.
The paper is organized as follows. Section 2 briefly presents related works. Section 3 describes the data. Section 4summarizes the methodology. Section 5 presents the classification results (RQ1 & RQ2). Section 5.4 discussesthe interpretability of the trained CNN models (RQ3), and presents our perceptual crowdsourcing study (RQ4).Finally, Section 6 concludes the paper.
2 RELATED WORKThis section discusses common architectures and training strategies with CNNs (i.e. analysis of pretrained CNNfeatures, fine-tuning or training deep CNNs from scratch); previous glyph and sketch recognition studies; andvisualization and interpretation of the learned representations.
CNN architectures. For handwritten digit classification, LeCun et al. proposed a sequential, i.e. feed-forward,network (LeNet) with three convolutional layers followed by a nonlinearity activation (e.g. sigmoid), and sub-sampling (e.g. max pooling) [23]. Krizhevsky et al. built upon the LeNet architecture, and proposed the AlexNet
ACM J. Comput. Cult. Herit., Vol. 1, No. 1, Article 1. Publication date: July 2018.
1:4 • G. Can et al.
[21] that has five convolutional layers with non-saturating rectified linear unit (ReLU) activations for objectclassification on ImageNet data [7]. Vanishing/exploding gradients during error backpropagation through thisdeep net were handled by the ReLU activations. Additionally, the dropout strategy [15] helped to prevent overfit-ting during training of the AlexNet. VGG networks illustrated the limits of deep sequential networks withoutany special design [37]. Simonyan et al. showed that such a network with 16 layers (VGG-16) outperforms theAlexNet.
More recently, graph-based architectures have emerged in CNN design such as GoogleNet with inception mod-ules [39], and residual networks (ResNets) with identity mapping connections [13]. One important commonalityof these models is heavy-usage of Batch Normalization (BN) [19] which enables to train very deep networks ina considerably short amount of time with improved performance, since BN reduces covariate shift in the dataduring training.Transfer learning and training with CNNs. Motivated by the common visual structures learned by CNNs
in the first layers, several transfer learning approaches reutilized and analyzed the effectiveness of pretrainedCNN representations on different datasets [6, 9, 35, 37]. The penultimate activations of a CNN, specificallyAlexNet [9, 35] and VGG [37] trained on ImageNet data, are shown as strong baselines for visual recognition tasks.Similarly, for character recognition tasks e.g. uppercase Latin letter classification, Cireşan et al. [6] indicated thatexisting pretrained nets (trained on digits or Chinese characters) can be utilized as feature extractors.
Alternatively, these pretrained networks can be fine-tuned, i.e. trained such that only the weights of last severallayers are modified, to be adapted to different tasks. Fine-tuning helps the training process start from a morerelevant point and results in improved performance and faster training compared to random initialization [6].Cireşan et al. [6] showed that even for the challenging task of 1000 Chinese character classification, fine-tuningthe last convolutional and fully-connected layers of a pretrained net for uppercase Latin letters outperforms arandomly initialized and trained network (8.4% vs. 20.8% test error rate respectively). Furthermore, Yosinski et al.[42] showed that fine-tuning the last convolutional layers helps the network to learn representations that are morespecific to the target dataset. Authors discuss that fine-tuning more number of layers (from last fully-connectedlayer towards input layer) might be essential as the nature of the target dataset becomes more different than theinitial source dataset used for pretraining.Training a CNN from scratch is one of the typical approaches in case of dissimilar data with particular
characteristics, e.g. our glyph data. Even though the impact of pretraining is emphasized above, there are recentnormalization techniques that reduce or eliminate the necessity of pretraining. Batch Normalization (BN) [19]is one of the most common approaches. BN showed considerable performance and efficiency improvements inCNN training [19]. Thus, when training a CNN from scratch in this paper, we initialized the network weightswith Glorot initialization [12], and utilized BN after each convolutional layer.
Glyph and sketch recognition. For Maya glyph recognition, several shape representations have built upontraditional knowledge-driven descriptors [18, 30]. These representations are based on bag-of-words (BoW) thatoutput the frequency histograms of local shape descriptors. As shown in a similar study on Egyptian glyphs [11],HOOSC [30] is a competitive candidate among other traditional shape descriptors.
Petroglyph, in other words rock-art, analysis [8, 28, 31–33, 46] is another related topic to our glyph recognitiontask. For petroglyph segmentation that can be considered as foreground/background classification of pixels,Seidl et al. [31] studied various combinations of traditional textural features. Specifically, third order Gray-LevelCo-occurrence Matrix (GLCM) and Local Binary Patterns (LBP) were shown to outperform color or dense-SIFTfeatures in a late classification fusion setting [31]. In a recent 3D petroglyph segmentation study, Poier et al. [28]reported that fully-connected CNNs produced better segmentation results thanks to capturing the spatial contextbetter than random forests. Poier et al. [28] also noted that the contribution of traditional color and texturalfeatures to final segmentation maps was negligible, therefore only depth maps and orthophotos generated fromthe point clouds were used as input to the classifiers.
ACM J. Comput. Cult. Herit., Vol. 1, No. 1, Article 1. Publication date: July 2018.
How to Tell Ancient Signs Apart?Recognizing and Visualizing Maya Glyphs with CNNs • 1:5
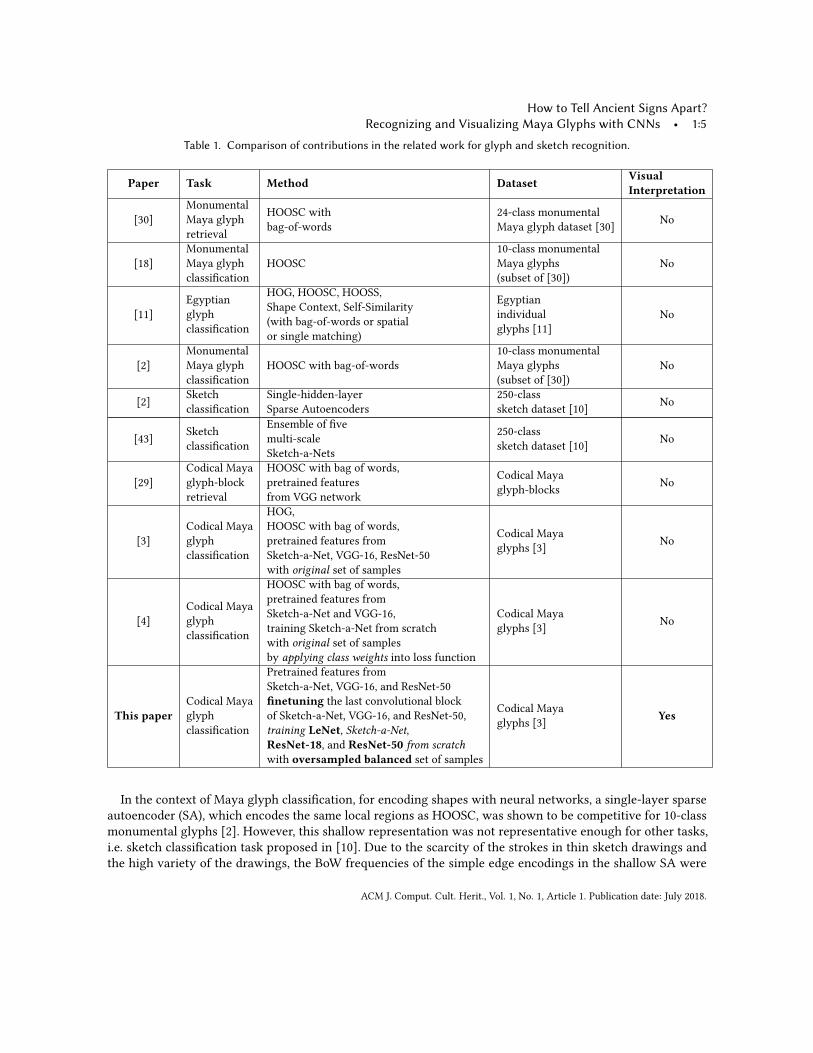
Table 1. Comparison of contributions in the related work for glyph and sketch recognition.
Paper Task Method Dataset VisualInterpretation
[30]MonumentalMaya glyphretrieval
HOOSC withbag-of-words
24-class monumentalMaya glyph dataset [30] No
[18]MonumentalMaya glyphclassification
HOOSC10-class monumentalMaya glyphs(subset of [30])
No
[11]Egyptianglyphclassification
HOG, HOOSC, HOOSS,Shape Context, Self-Similarity(with bag-of-words or spatialor single matching)
Egyptianindividualglyphs [11]
No
[2]MonumentalMaya glyphclassification
HOOSC with bag-of-words10-class monumentalMaya glyphs(subset of [30])
No
[2] Sketchclassification
Single-hidden-layerSparse Autoencoders
250-classsketch dataset [10] No
[43] Sketchclassification
Ensemble of fivemulti-scaleSketch-a-Nets
250-classsketch dataset [10] No
[29]Codical Mayaglyph-blockretrieval
HOOSC with bag of words,pretrained featuresfrom VGG network
Codical Mayaglyph-blocks No
[3]Codical Mayaglyphclassification
HOG,HOOSC with bag of words,pretrained features fromSketch-a-Net, VGG-16, ResNet-50with original set of samples
Codical Mayaglyphs [3] No
[4]Codical Mayaglyphclassification
HOOSC with bag of words,pretrained features fromSketch-a-Net and VGG-16,training Sketch-a-Net from scratchwith original set of samplesby applying class weights into loss function
Codical Mayaglyphs [3] No
This paperCodical Mayaglyphclassification
Pretrained features fromSketch-a-Net, VGG-16, and ResNet-50finetuning the last convolutional blockof Sketch-a-Net, VGG-16, and ResNet-50,training LeNet, Sketch-a-Net,ResNet-18, and ResNet-50 from scratchwith oversampled balanced set of samples
Codical Mayaglyphs [3] Yes
In the context of Maya glyph classification, for encoding shapes with neural networks, a single-layer sparseautoencoder (SA), which encodes the same local regions as HOOSC, was shown to be competitive for 10-classmonumental glyphs [2]. However, this shallow representation was not representative enough for other tasks,i.e. sketch classification task proposed in [10]. Due to the scarcity of the strokes in thin sketch drawings andthe high variety of the drawings, the BoW frequencies of the simple edge encodings in the shallow SA were
ACM J. Comput. Cult. Herit., Vol. 1, No. 1, Article 1. Publication date: July 2018.
1:6 • G. Can et al.
harder to capture than relatively-thicker glyph strokes. The authors of [2] discuss that deeper convolutionalnetworks trained with more data might capture more complex and more discriminative shape representationsfor this case. Complementary to this finding, Yu et al.[43] proposed “Sketch-a-Net” that is a modified version ofAlexNet [21] with fewer feature maps, yet larger first layer convolution kernels. Yu et al. demonstrated that a jointclassification decision from a set of Sketch-a-Nets (trained with data in multiple scales and multiple temporalchannels) beats human performance on the 250-class sketch dataset of [10].
In the context of Maya glyph-block retrieval, Roman-Rangel et al. [29] showed that the middle layer activations(conv5) of VGG outperform the penultimate layer activations (fc-7), and the bag-of-words representation of atraditional shape descriptor (HOOSC). This is a motivating point for learning the representations for Maya glyphs,and taking advantage from existing pretrained networks. Similarly, in our recent study [3], we presented theconv-5 activations of VGG-16 as a promising shape representation baseline on the challenging Maya Codicalglyph dataset. In a related study [4], we evaluated the HOOSC-BoW representation along with the activations oftwo pretrained networks, namely VGG-16 and Sketch-a-Net, on this Maya Codical glyph dataset. The data-drivenpretrained CNN representations outperformed the knowledge-driven HOOSC-BoW representation by a largemargin. Furthermore, we trained a Sketch-a-Net from scratch with glyphs, and demonstrated that average classaccuracies gave insights on the training process. We applied class weights in the loss function for the CNN notto overfit to the classes with many samples during training. This approach resulted in slight improvement inaverage class accuracies. Finally, to improve the performance of classes with few samples, we hinted that usingoversampled balanced sets were essential.In this paper, we substantially extend our work in [4] on the oversampled balanced sets of the Maya Codical
glyph dataset. Specifically, we perform a more comprehensive study with different networks including the recentResidual Networks. Furthermore, we also experiment with another transfer learning approach by fine-tuningthe pretrained networks. Additionally, we assess if the representations learned by the networks are indeeddiscriminative and interpretable by visualizing the network activations.Interpreting CNN representations. To understand the representations learned by CNNs, Zeiler et al. discuss
how to visualize them via deconvolutional layers [44]. They also present a method called occlusion maps suchthat a sliding window in the image is occluded and the predicted label of the image by the CNN model is checkedto see whether that region is diagnostic and important to identify the correct label.Simonyan et al. presented a simple gradient backpropagation approach for identifying the salient points of
the objects with a single forward pass [36]. Compared to occlusion maps, it is computationally more efficient.However, this approach does not point out to full object extent in general. Therefore, the authors use the outputsalient points from this approach as input to a classical background/foreground segmentation method for objectsegmentation in natural images. In our case, the segmentation of glyphs from a glyph-block with classicalapproaches is especially challenging, since neither color nor texture are discriminative for glyphs.
Zhou et al. introduced class activation maps (CAM) [45] for capturing the extensions of objects and not only fewsalient points of objects. The CAM approach requires to introduce an average pooling layer to model structure. Toavoid that, Grad-CAM [34] has been proposed as a generalization of CAM. As such, it does not require modifyingthe CNN model to visualize the activation maps, and it can be applied to any type of neural networks, even topretrained ones without the need of re-training.Beyond classification, interpretability is fundamental for domain experts, who need to understand what the
method does and match it with their own knowledge. Therefore, we adopt the Grad-CAM approach for illustratingthe discriminative parts of the glyphs for the trained models. We also illustrate the gradient backpropagationapproach and discuss the interpretability of the learned representations by the CNN models. Finally, we ask thenon-experts to rate the Grad-CAM visualizations of two models in terms of their level of interpretability. Tothe best of our knowledge, our study, specifically interpreting the CNN decisions for glyph classification andsubjective assessment of the CNN visualizations, is novel in Digital Humanities and Archaeology context.
ACM J. Comput. Cult. Herit., Vol. 1, No. 1, Article 1. Publication date: July 2018.
How to Tell Ancient Signs Apart?Recognizing and Visualizing Maya Glyphs with CNNs • 1:7
3 DATATo familiarize the reader with the studied data, this section first introduces the ancient Maya script, and thengives the details of the segmented Maya glyphs dataset used in the experiments.
3.1 Maya Writing SystemThe Maya writing system is quite visual, and is composed of complex logograms and syllabograms as opposed tostroke-based or continuous scripts of other languages [41]. In a recent catalog, Macri and Looper categorizes Mayaglyphs into semantic groups such as animals, body parts, and faces [25]. Other categories are not straightforwardto interpret as everyday objects, however they are also classified with some visual hints like square contour, withor without inner symmetry, elongated shapes, or variable number of components.
As with natural objects, samples from Maya glyph categories may exhibit high within-class variance and lowbetween-class differences. Due to the historical period, place changes, and artistic reasons, Maya glyphs from onecategory may look relatively different to the exception of some specific “diagnostic” parts [17]. Similarly, betweentwo similar-looking classes, the difference may be quite subtle, like changing diagnostic local parts such as eyesor teeth in human or animal head signs. Nevertheless, learning global patterns like shape contours (rectangular,head-shape, elongated) or local patterns (small circles, eyes, teeth) across classes, as CNN are truly capable ofachieving, would benefit the recognition task.
3.2 Crowdsourced Maya Glyph SegmentsIn [3], a Maya Codical dataset was curated by crowdsourcing segmenting each glyph from glyph-blocks inancient codices that survived until today (Dresden, Paris, Madrid). As these codices are from the post-classicalera, within-class variance is relatively lower than the one for the monumental glyphs coming from differenthistorical periods. However, it is possible to observe stylistic differences. The dataset is quite challenging as thenumber of samples per class is low, due to the lack of data.Furthermore, the visual differences can be quite subtle. Fig. 1 illustrates samples from the ten classes with
the highest number of samples per class. For example, the only visual difference between the first two and thelast two glyphs in the top row is the orientation. These examples demonstrate that the classification task is notstraightforward, even in the 10-class case with medium-scale data.
4 METHODOLOGYTo tackle the challenging glyph recognition task from the Maya codices, we used the deep CNNs that are able tolearn powerful representations for various computer vision tasks. In the scope of our first and second researchquestions, we experimented with different training strategies and CNN architectures. In the scope of our thirdand fourth research questions, we worked on understanding and qualitatively assessing the representations thatare learned by CNNs on glyph classification task. Thus, we followed two main steps in our methodology: (1)training a deep CNN to learn glyph representations, and (2) evaluating the visualizations of the discriminativeglyph parts in a crowdsourcing task.
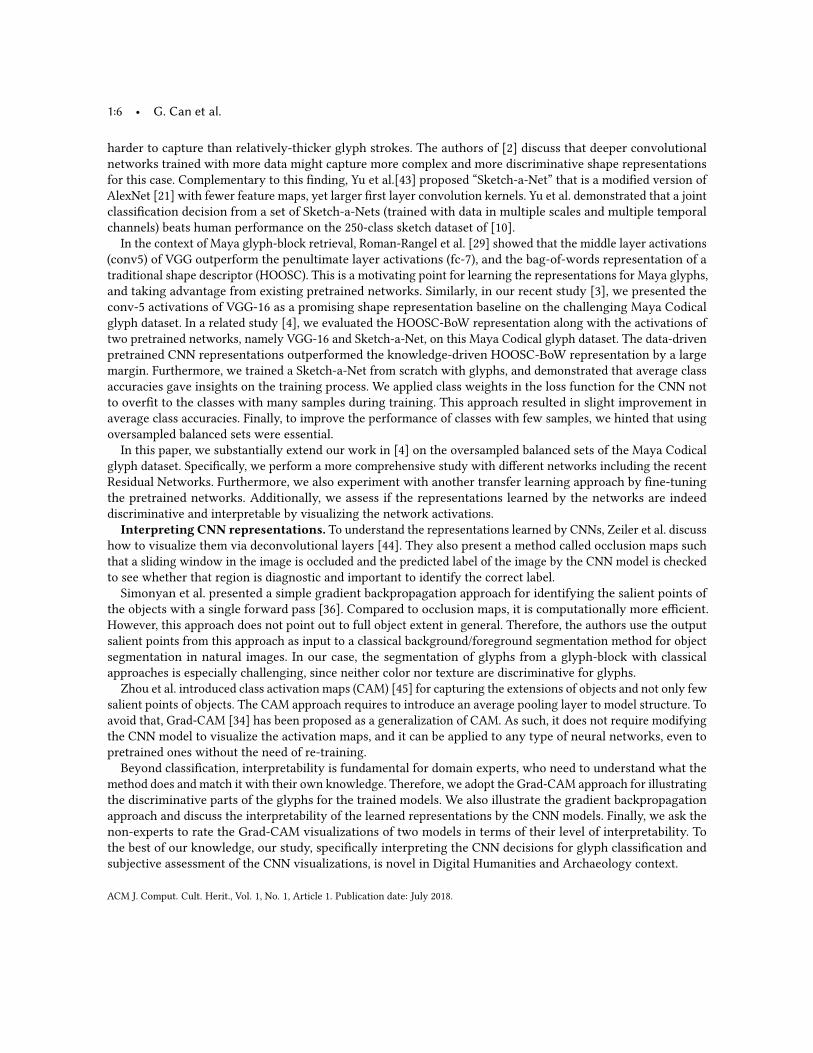
4.1 Learning Glyph Representations (RQ1 & RQ2)To learn discriminative glyph representations, we considered three approaches (i) assessing features learned by apretrained network, (ii) transferring knowledge from an existing network through fine-tuning, (iii) full networktraining. Fig.2 illustrates our data-driven approaches. The first two cases are a good alternative to the third onewhen dealing with the challenge of small amount of data, as in our case.
4.1.1 Pretrained Features. Method. Given a pretrained network, and following [16], we use the output of thelast convolutional or residual block from all glyph images in the training set as training features of a one-layer
ACM J. Comput. Cult. Herit., Vol. 1, No. 1, Article 1. Publication date: July 2018.
1:8 • G. Can et al.
Input
Deep Convolutional Neural Network CNN activationsGlyph class
probabilitiesShallow CNN
(a) Assessing pretrained CNN features.
Input
Deep Convolutional Neural Network
Last conv. block
Glyph class
probabilitiesShallow CNN
Fine-tune
(b) Fine-tuning the last convolutional block.
Input
Deep Convolutional Neural NetworkGlyph class
probabilities
Train
(c) Full network training.
Fig. 2. Three data-driven methods for supervised glyph classification. In each method, only the highlighted part of a CNNmodel was trained.
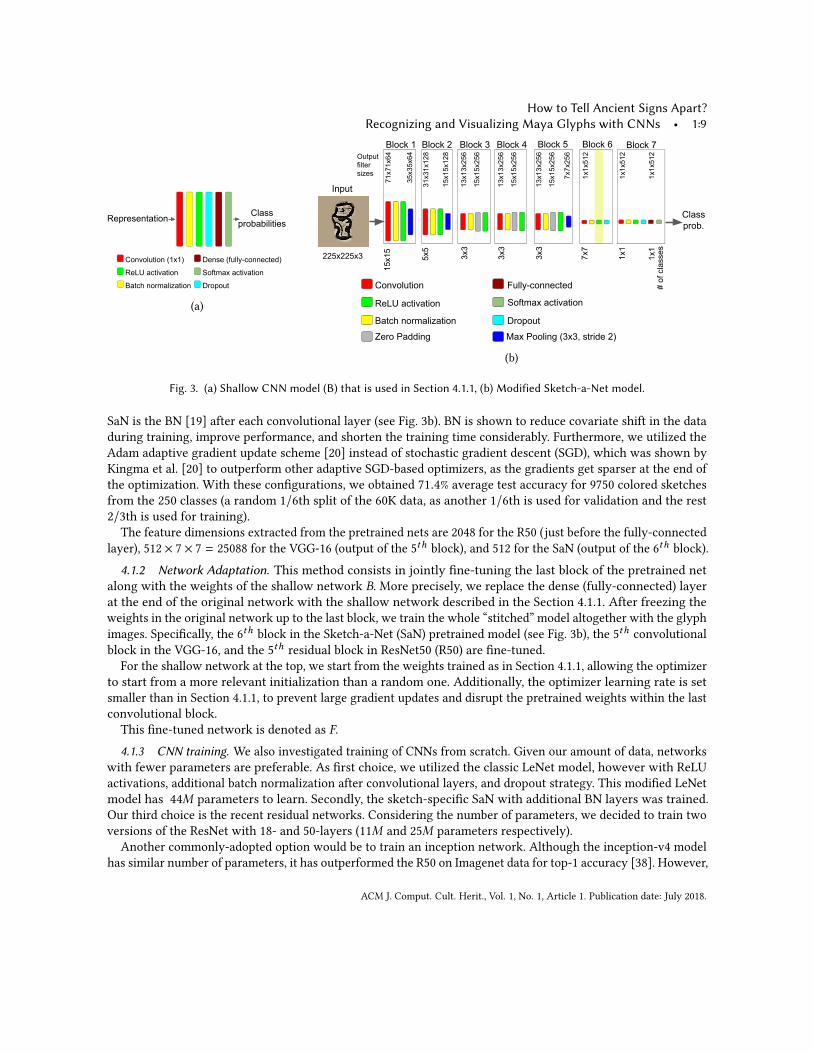
convolutional network (denoted as B). As depicted in Fig. 3a, this shallow network is composed of 1x1 convolutionlayer with 512 feature maps followed by batch normalization, ReLU nonlinearity, dropout, and a softmax classifier.Compared to the alternative approach of fine-tuning the fully-connected (FC) block of the pretrained net withour own data, this is much less costly.Considered Networks. As pretrained networks, we chose the VGG-16 [37] and ResNet-50 (R50) [13] pretrainedon ImageNet dataset, and the Sketch-a-Net (SaN) [43] pretrained on 250-class binary sketches [10].As Simonyan et al. [37] showed that their deep CNN with 16 layers (VGG-16) performs similar to the one
with 19 layers (VGG-19), we utilized VGG-16 in our experiments. We also experimented with the state-of-the-artresidual network that uses BN layers and residual connections. On the other hand, the SaN is an altered versionof the AlexNet for handling the sparse strokes with larger convolution kernels in the first layers. As there arefewer feature maps in the convolutional layers, this network has around 8.5M parameters compared to the 60Mparameters of the original AlexNet.For the VGG-16 and R50 models, we utilized existing pretrained models. However, due to the modifications
we applied in the network, we trained the single-scale version of SaN from scratch. It is a 3-channel versionof SaN for the populated colored versions of the sketch images (namely, sketch-RGB dataset) with three staticbackground colors that are used to populate glyph images in [3]. One important difference of our re-trained
ACM J. Comput. Cult. Herit., Vol. 1, No. 1, Article 1. Publication date: July 2018.
How to Tell Ancient Signs Apart?Recognizing and Visualizing Maya Glyphs with CNNs • 1:9
Convolution (1x1)
ReLU activation
Batch normalization
Dense (fully-connected)
Softmax activation
Dropout
Representation Class probabilities
(a)
Input
Class prob.
Convolution
ReLU activation
Batch normalization
Fully-connected
Softmax activation
Dropout
Zero Padding Max Pooling (3x3, stride 2)
Block 1 Block 2 Block 3 Block 4 Block 5 Block 6 Block 7
15x1
5
5x5
3x3
7x7
1x1
1x1
3x3
3x3
225x225x3
71x7
1x64
35x3
5x64
31x3
1x12
8
15x1
5x12
8
13x1
3x25
6
15x1
5x25
6
13x1
3x25
6
15x1
5x25
6
13x1
3x25
6
15x1
5x25
6Output filter sizes 1x
1x51
2
7x7x
256
# of
cla
sses
1x1x
512
1x1x
512
(b)
Fig. 3. (a) Shallow CNN model (B) that is used in Section 4.1.1, (b) Modified Sketch-a-Net model.
SaN is the BN [19] after each convolutional layer (see Fig. 3b). BN is shown to reduce covariate shift in the dataduring training, improve performance, and shorten the training time considerably. Furthermore, we utilized theAdam adaptive gradient update scheme [20] instead of stochastic gradient descent (SGD), which was shown byKingma et al. [20] to outperform other adaptive SGD-based optimizers, as the gradients get sparser at the end ofthe optimization. With these configurations, we obtained 71.4% average test accuracy for 9750 colored sketchesfrom the 250 classes (a random 1/6th split of the 60K data, as another 1/6th is used for validation and the rest2/3th is used for training).
The feature dimensions extracted from the pretrained nets are 2048 for the R50 (just before the fully-connectedlayer), 512 × 7 × 7 = 25088 for the VGG-16 (output of the 5th block), and 512 for the SaN (output of the 6th block).4.1.2 Network Adaptation. This method consists in jointly fine-tuning the last block of the pretrained net
along with the weights of the shallow network B. More precisely, we replace the dense (fully-connected) layerat the end of the original network with the shallow network described in the Section 4.1.1. After freezing theweights in the original network up to the last block, we train the whole “stitched” model altogether with the glyphimages. Specifically, the 6th block in the Sketch-a-Net (SaN) pretrained model (see Fig. 3b), the 5th convolutionalblock in the VGG-16, and the 5th residual block in ResNet50 (R50) are fine-tuned.
For the shallow network at the top, we start from the weights trained as in Section 4.1.1, allowing the optimizerto start from a more relevant initialization than a random one. Additionally, the optimizer learning rate is setsmaller than in Section 4.1.1, to prevent large gradient updates and disrupt the pretrained weights within the lastconvolutional block.This fine-tuned network is denoted as F.4.1.3 CNN training. We also investigated training of CNNs from scratch. Given our amount of data, networks
with fewer parameters are preferable. As first choice, we utilized the classic LeNet model, however with ReLUactivations, additional batch normalization after convolutional layers, and dropout strategy. This modified LeNetmodel has 44M parameters to learn. Secondly, the sketch-specific SaN with additional BN layers was trained.Our third choice is the recent residual networks. Considering the number of parameters, we decided to train twoversions of the ResNet with 18- and 50-layers (11M and 25M parameters respectively).
Another commonly-adopted option would be to train an inception network. Although the inception-v4 modelhas similar number of parameters, it has outperformed the R50 on Imagenet data for top-1 accuracy [38]. However,
ACM J. Comput. Cult. Herit., Vol. 1, No. 1, Article 1. Publication date: July 2018.
1:10 • G. Can et al.
Canzani et al. [5] have shown that the contribution of number of parameters to top-1 accuracy is higher for theR18 and R50 models compared to the inception-v4 model. This implies that the information density stored in theneurons of these residual networks are higher than the inception-v4 model. This accuracy vs. parameter analysisis especially important for training a CNN from scratch with small- to medium-scale data. Therefore, we omit theinception-v4 model comparison here.
4.2 Visualizing Discriminative Glyph Parts (RQ3 & RQ4)4.2.1 Visualization with CNNs. To understand the learned CNN representations, we utilized both gradient
backpropagation [36] and Grad-CAM [34]. With these methods, we visualized where the salient and the dis-criminative parts of the glyphs are for the model. Another use-case of such a class-activation visualization is tolocalize the glyphs in glyph-blocks (cluttered scenes) given the model trained on the desired glyph class.Salient point visualization. After a single forward pass of the input through the network, partial derivatives ofpredicted class score w.r.t. pixel intensities are backpropagated and visualized [36]. This corresponds to visualizingthe importance of input pixels such that the predicted class score gets influenced the most in case of a change inthe input intensities.CAM. Class Activation Mapping [45] is defined on a CNN that ends with a block of “convolutional layer →global average pooling layer → softmax layer”. Hence, this visualization approach requires re-training of theweights after changing the CNN architecture, i.e. by replacing the layers after the last convolutional layer withGlobal Average Pooling (GAP) and a softmax layer. Then, the class score is obtained by a forward pass of theactivations from the last convolutional layer:
yc =∑k
wc 1Z
∑i
∑j
Aki j , (1)
The localization map Lc ∈ Ru×v for class c with input widthu and heightv is computed as a linear combinationof k feature map activations Ak and the re-trained weightswc
k between the Global Average Pooling layer and thesoftmax layer:
Lc =∑k
wckA
k . (2)
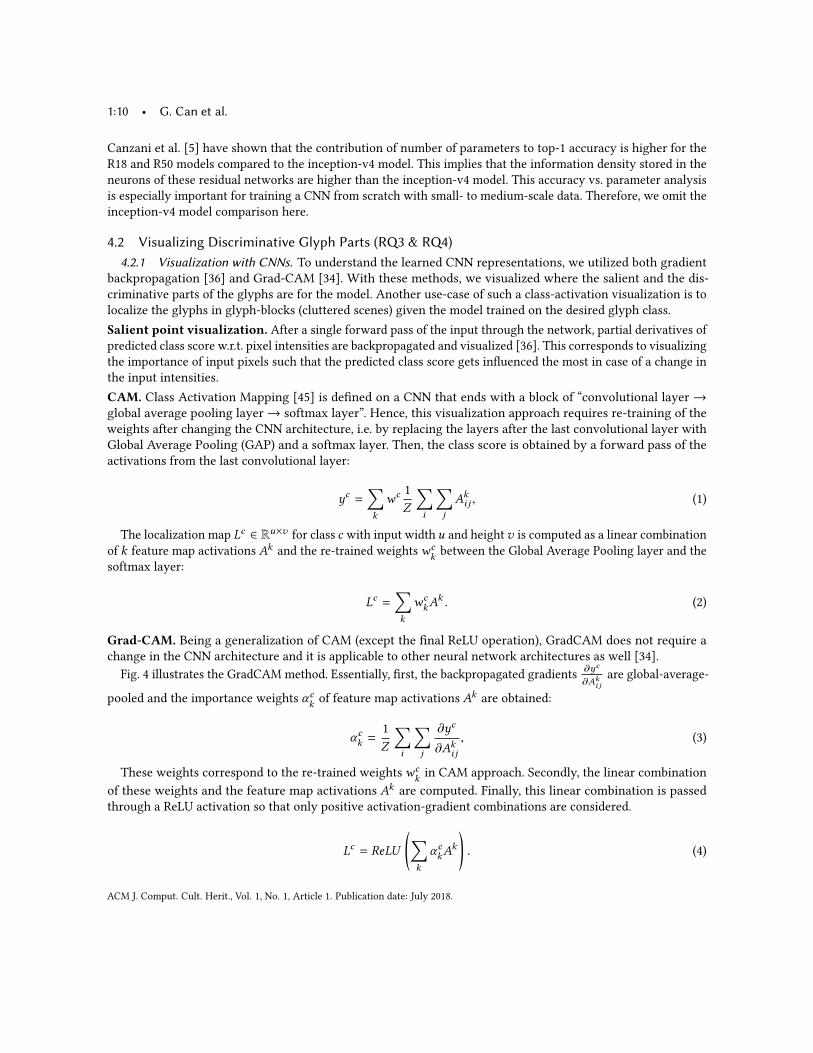
Grad-CAM. Being a generalization of CAM (except the final ReLU operation), GradCAM does not require achange in the CNN architecture and it is applicable to other neural network architectures as well [34].
Fig. 4 illustrates the GradCAM method. Essentially, first, the backpropagated gradients ∂yc
∂Aki jare global-average-
pooled and the importance weights αck of feature map activations Ak are obtained:
αck =1Z
∑i
∑j
∂yc
∂Aki j
, (3)
These weights correspond to the re-trained weightswck in CAM approach. Secondly, the linear combination
of these weights and the feature map activations Ak are computed. Finally, this linear combination is passedthrough a ReLU activation so that only positive activation-gradient combinations are considered.
Lc = ReLU
(∑k
αckAk
). (4)
ACM J. Comput. Cult. Herit., Vol. 1, No. 1, Article 1. Publication date: July 2018.
How to Tell Ancient Signs Apart?Recognizing and Visualizing Maya Glyphs with CNNs • 1:11
Input
GradCAM output
Block 5
c
...
Convolution
ReLU activation
Batch normalization
Dense (fully-connected)
Softmax activation
Dropout
Max Pooling Zero Padding
Global Average Pooling Pruning low activations (<0.5)
Fig. 4. Illustration of the GradCAM method.
In our case, to pay attention only to the most characteristic glyph parts, as a final operation, we eliminated theweak activation-gradient combinations (lower than 0.5) in the localization map.
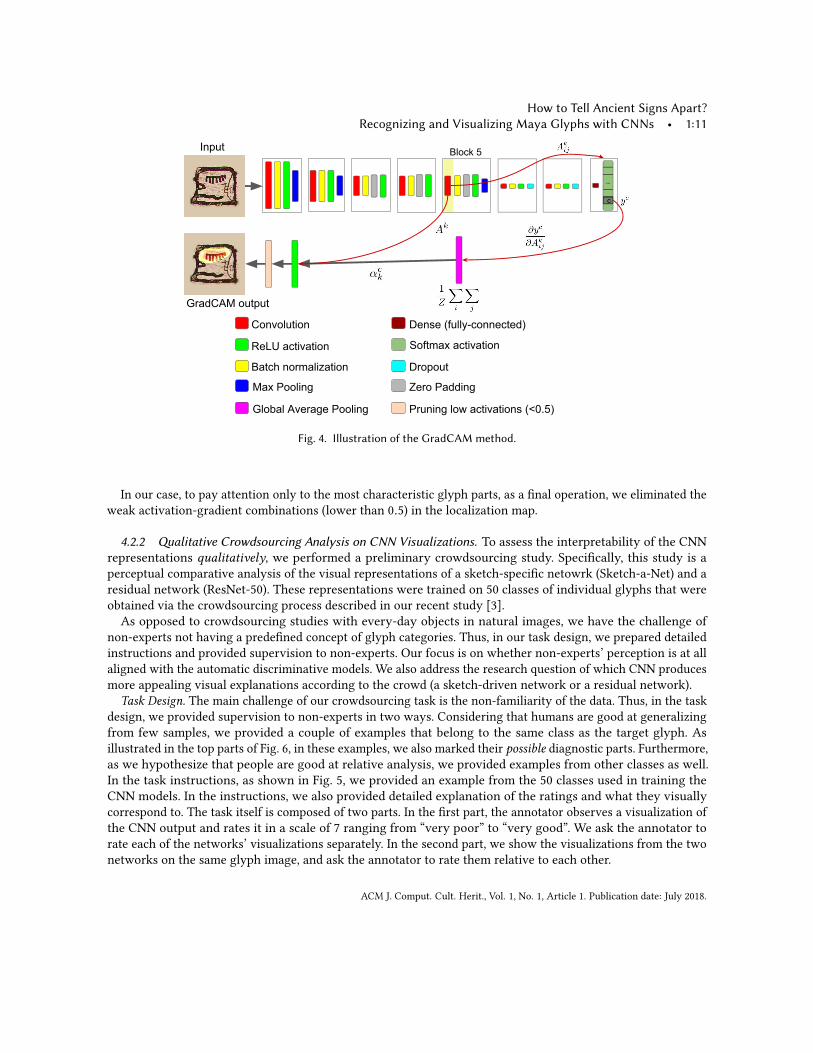
4.2.2 Qualitative Crowdsourcing Analysis on CNN Visualizations. To assess the interpretability of the CNNrepresentations qualitatively, we performed a preliminary crowdsourcing study. Specifically, this study is aperceptual comparative analysis of the visual representations of a sketch-specific netowrk (Sketch-a-Net) and aresidual network (ResNet-50). These representations were trained on 50 classes of individual glyphs that wereobtained via the crowdsourcing process described in our recent study [3].As opposed to crowdsourcing studies with every-day objects in natural images, we have the challenge of
non-experts not having a predefined concept of glyph categories. Thus, in our task design, we prepared detailedinstructions and provided supervision to non-experts. Our focus is on whether non-experts’ perception is at allaligned with the automatic discriminative models. We also address the research question of which CNN producesmore appealing visual explanations according to the crowd (a sketch-driven network or a residual network).
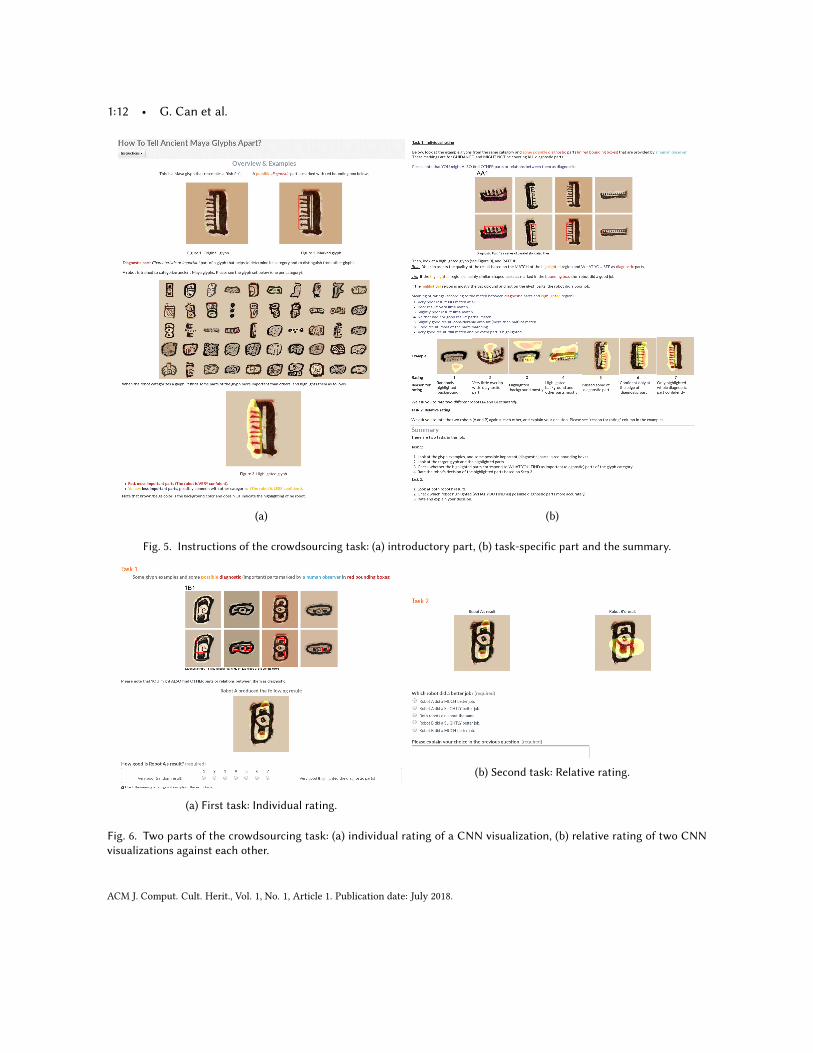
Task Design. The main challenge of our crowdsourcing task is the non-familiarity of the data. Thus, in the taskdesign, we provided supervision to non-experts in two ways. Considering that humans are good at generalizingfrom few samples, we provided a couple of examples that belong to the same class as the target glyph. Asillustrated in the top parts of Fig. 6, in these examples, we also marked their possible diagnostic parts. Furthermore,as we hypothesize that people are good at relative analysis, we provided examples from other classes as well.In the task instructions, as shown in Fig. 5, we provided an example from the 50 classes used in training theCNN models. In the instructions, we also provided detailed explanation of the ratings and what they visuallycorrespond to. The task itself is composed of two parts. In the first part, the annotator observes a visualization ofthe CNN output and rates it in a scale of 7 ranging from “very poor” to “very good”. We ask the annotator torate each of the networks’ visualizations separately. In the second part, we show the visualizations from the twonetworks on the same glyph image, and ask the annotator to rate them relative to each other.
ACM J. Comput. Cult. Herit., Vol. 1, No. 1, Article 1. Publication date: July 2018.
1:12 • G. Can et al.
(a) (b)
Fig. 5. Instructions of the crowdsourcing task: (a) introductory part, (b) task-specific part and the summary.
(a) First task: Individual rating.
(b) Second task: Relative rating.
Fig. 6. Two parts of the crowdsourcing task: (a) individual rating of a CNN visualization, (b) relative rating of two CNNvisualizations against each other.
ACM J. Comput. Cult. Herit., Vol. 1, No. 1, Article 1. Publication date: July 2018.
How to Tell Ancient Signs Apart?Recognizing and Visualizing Maya Glyphs with CNNs • 1:13
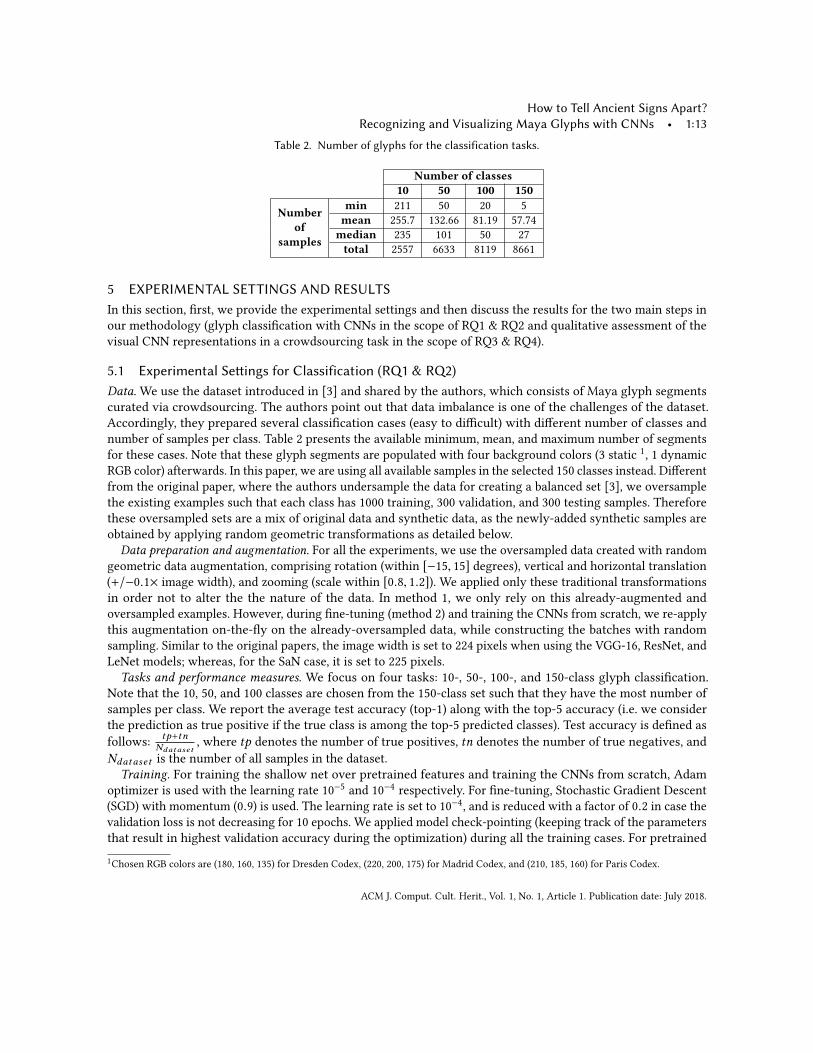
Table 2. Number of glyphs for the classification tasks.
Number of classes10 50 100 150
Numberof
samples
min 211 50 20 5mean 255.7 132.66 81.19 57.74median 235 101 50 27total 2557 6633 8119 8661
5 EXPERIMENTAL SETTINGS AND RESULTSIn this section, first, we provide the experimental settings and then discuss the results for the two main steps inour methodology (glyph classification with CNNs in the scope of RQ1 & RQ2 and qualitative assessment of thevisual CNN representations in a crowdsourcing task in the scope of RQ3 & RQ4).
5.1 Experimental Settings for Classification (RQ1 & RQ2)Data.We use the dataset introduced in [3] and shared by the authors, which consists of Maya glyph segmentscurated via crowdsourcing. The authors point out that data imbalance is one of the challenges of the dataset.Accordingly, they prepared several classification cases (easy to difficult) with different number of classes andnumber of samples per class. Table 2 presents the available minimum, mean, and maximum number of segmentsfor these cases. Note that these glyph segments are populated with four background colors (3 static 1, 1 dynamicRGB color) afterwards. In this paper, we are using all available samples in the selected 150 classes instead. Differentfrom the original paper, where the authors undersample the data for creating a balanced set [3], we oversamplethe existing examples such that each class has 1000 training, 300 validation, and 300 testing samples. Thereforethese oversampled sets are a mix of original data and synthetic data, as the newly-added synthetic samples areobtained by applying random geometric transformations as detailed below.
Data preparation and augmentation. For all the experiments, we use the oversampled data created with randomgeometric data augmentation, comprising rotation (within [−15, 15] degrees), vertical and horizontal translation(+/−0.1× image width), and zooming (scale within [0.8, 1.2]). We applied only these traditional transformationsin order not to alter the the nature of the data. In method 1, we only rely on this already-augmented andoversampled examples. However, during fine-tuning (method 2) and training the CNNs from scratch, we re-applythis augmentation on-the-fly on the already-oversampled data, while constructing the batches with randomsampling. Similar to the original papers, the image width is set to 224 pixels when using the VGG-16, ResNet, andLeNet models; whereas, for the SaN case, it is set to 225 pixels.Tasks and performance measures. We focus on four tasks: 10-, 50-, 100-, and 150-class glyph classification.
Note that the 10, 50, and 100 classes are chosen from the 150-class set such that they have the most number ofsamples per class. We report the average test accuracy (top-1) along with the top-5 accuracy (i.e. we considerthe prediction as true positive if the true class is among the top-5 predicted classes). Test accuracy is defined asfollows: tp+tn
Ndataset, where tp denotes the number of true positives, tn denotes the number of true negatives, and
Ndataset is the number of all samples in the dataset.Training. For training the shallow net over pretrained features and training the CNNs from scratch, Adam
optimizer is used with the learning rate 10−5 and 10−4 respectively. For fine-tuning, Stochastic Gradient Descent(SGD) with momentum (0.9) is used. The learning rate is set to 10−4, and is reduced with a factor of 0.2 in case thevalidation loss is not decreasing for 10 epochs. We applied model check-pointing (keeping track of the parametersthat result in highest validation accuracy during the optimization) during all the training cases. For pretrained1Chosen RGB colors are (180, 160, 135) for Dresden Codex, (220, 200, 175) for Madrid Codex, and (210, 185, 160) for Paris Codex.
ACM J. Comput. Cult. Herit., Vol. 1, No. 1, Article 1. Publication date: July 2018.
1:14 • G. Can et al.
net training and fine-tuning, the maximum number of epochs is set to 500 empirically, whereas for training fromscratch, we followed an early-stopping approach with a patience factor of 20 epochs, i.e. terminating training ifvalidation loss does not decrease for 20 epochs.
5.2 Experimental Settings for Crowdsourcing (RQ3 & RQ4)Data. In this preliminary study, we limited our dataset to 10 glyphs from 10 classes. We computed the Grad-CAMresults of two networks for these randomly-chosen 100 glyphs. To make the visualizations more selective, weeliminated the weak activations in these mappings (empirical threshold is set as 0.5 in the range of [0, 1]).In an attempt to understand the visualizations on this set of chosen glyphs, as a preliminary check, we
performed a pixelwise comparison between these visualizations and the manually-marked groundtruth masks.We observed that the pruned ResNet-50 visualizations overlap with the groundtruth masks in all cases, whereasthe Sketch-a-Net visualizations overlap with the groundtruth masks for 98 out of the 100 glyphs. Furthermore,the ResNet-50 visualizations were more diffused with higher average recall (0.754 vs. 0.582) and lower averageprecision values (0.255 vs. 0.431).Over this set of chosen glyphs, to make the perceptual task easier for non-expert observers, we used double-
colored visualizations. In these visualization, yellow color can be considered to correspond to “important” andred color to “very important” parts. Below, we give the details of our crowdsourcing task design.Task Settings. Using the Crowdflower terminology introduced in [3], we set 4 tasks in a page, and paid an
annotator 10 USD cents per page. We collected annotations from 10 annotators per task. We set 10 test questionsto be used in quiz mode. Quiz mode enables to eliminate spammers or low-performing annotators. In total, wecollected 1000 annotations (10 for each of the 100 glyphs).
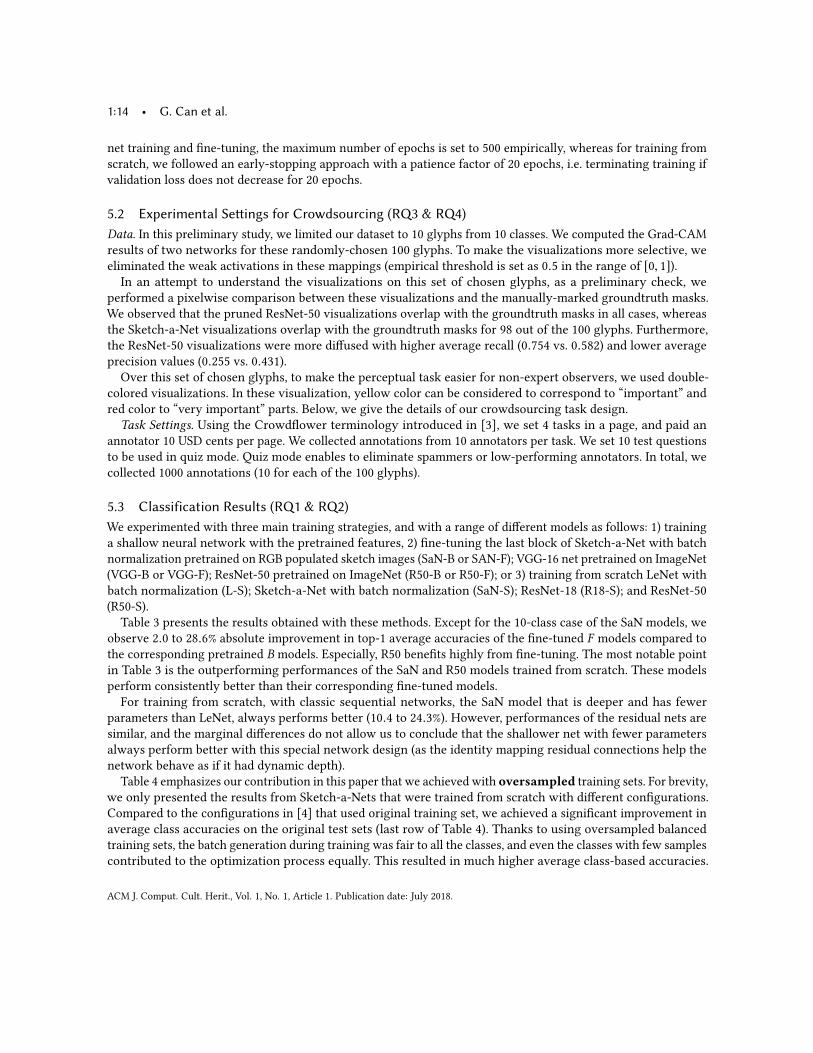
5.3 Classification Results (RQ1 & RQ2)We experimented with three main training strategies, and with a range of different models as follows: 1) traininga shallow neural network with the pretrained features, 2) fine-tuning the last block of Sketch-a-Net with batchnormalization pretrained on RGB populated sketch images (SaN-B or SAN-F); VGG-16 net pretrained on ImageNet(VGG-B or VGG-F); ResNet-50 pretrained on ImageNet (R50-B or R50-F); or 3) training from scratch LeNet withbatch normalization (L-S); Sketch-a-Net with batch normalization (SaN-S); ResNet-18 (R18-S); and ResNet-50(R50-S).
Table 3 presents the results obtained with these methods. Except for the 10-class case of the SaN models, weobserve 2.0 to 28.6% absolute improvement in top-1 average accuracies of the fine-tuned F models compared tothe corresponding pretrained B models. Especially, R50 benefits highly from fine-tuning. The most notable pointin Table 3 is the outperforming performances of the SaN and R50 models trained from scratch. These modelsperform consistently better than their corresponding fine-tuned models.For training from scratch, with classic sequential networks, the SaN model that is deeper and has fewer
parameters than LeNet, always performs better (10.4 to 24.3%). However, performances of the residual nets aresimilar, and the marginal differences do not allow us to conclude that the shallower net with fewer parametersalways perform better with this special network design (as the identity mapping residual connections help thenetwork behave as if it had dynamic depth).
Table 4 emphasizes our contribution in this paper that we achieved with oversampled training sets. For brevity,we only presented the results from Sketch-a-Nets that were trained from scratch with different configurations.Compared to the configurations in [4] that used original training set, we achieved a significant improvement inaverage class accuracies on the original test sets (last row of Table 4). Thanks to using oversampled balancedtraining sets, the batch generation during training was fair to all the classes, and even the classes with few samplescontributed to the optimization process equally. This resulted in much higher average class-based accuracies.
ACM J. Comput. Cult. Herit., Vol. 1, No. 1, Article 1. Publication date: July 2018.
How to Tell Ancient Signs Apart?Recognizing and Visualizing Maya Glyphs with CNNs • 1:15
Table 3. Average test top-1 (T-1) and top-5 (T-5) accuracies. Models: L: LeNet, SaN: Sketch-a-Net, R: ResNet, VGG-16.Conditions: B: pre-trained, F: fine-tunning, S: learned from scratch. Best performances in B, F, and S are in bold.
Number of classes10 50 100 150
Model T-1 T-5 T-1 T-5 T-1 T-5 T-1 T-5SaN-B 81.5 98.0 65.2 85.8 50.5 71.2 42.3 62.7VGG-B 87.9 99.1 77.1 91.9 62.4 81.3 52.8 74.0R50-B 77.8 96.4 54.3 79.0 50.3 75.0 31.8 52.8SaN-F 81.0 98.5 70.9 90.1 58.7 80.3 50.2 72.7VGG-F 89.9 98.9 85.4 95.9 73.5 89.2 64.5 83.5R50-F 87.0 99.3 79.4 93.9 70.5 87.7 60.4 78.9L-S 81.4 98.2 70.1 89.4 52.2 74.9 46.0 68.0
SaN-S 91.0 99.8 87.8 95.9 75.1 90.1 70.3 85.4R18-S 88.0 99.6 87.3 96.9 78.6 94.3 68.6 85.5R50-S 89.1 99.6 85.1 96.6 79.2 95.3 67.4 84.6
Table 4. Average sample-based top-1 (T-1) accuracies, and average class-based accuracies (CA) for the original test set.
Number of classes10 50 100 150
Method T-1 CA T-1 CA T-1 CA T-1 CASaN-S trained with original set [4] 91.7 77.1 89.1 51.9 86.7 26.9 84.2 16.0SaN-S trained with original set and class weights [4] 90.7 75.7 89.7 52.4 87.2 26.8 84.8 17.7SaN-S trained with oversampled set (this paper) 91.1 91.1 89.0 88.9 87.0 83.8 84.4 73.6
With this motivation, as hinted at the end of the discussion in [4], we decided to conduct all the experimentswith oversampled balanced sets as reported in Table 3.
Fig. 7 shows the individual class accuracies (average test top-1) compared to the ratio of the original trainingsamples for 150-class Sketch-a-Net trained from scratch. The blue line in the plot indicates the ratio of the numberof original training samples in a class to the number of oversampled training samples in a class. (This ratio waspresented as a percentage to be in the same scale with the accuracy -red line-.)
Fig. 7. The ratio of original training samples vs. average top-1 class accuracies for the SaN-S model for the 150 classes.Despite the performance fluctuations among classes, top 50 most frequent glyph classes exhibit a high performance trend,showing the importance of original training data size.
ACM J. Comput. Cult. Herit., Vol. 1, No. 1, Article 1. Publication date: July 2018.
1:16 • G. Can et al.
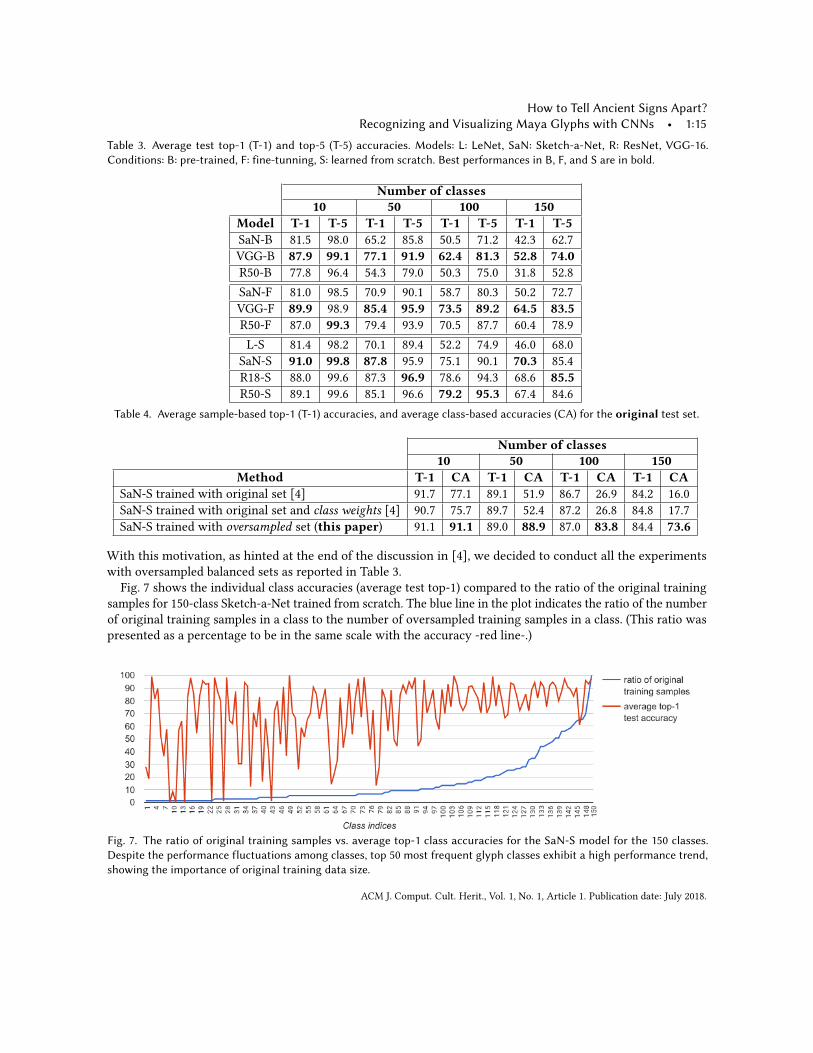
Table 5. Visual examples of the classes whose performances got affected the most when the 50-class SaN-S or 150-classSaN-S models were used.
ClassT-1 acc. withSaN-S trainedon 50 classes
T-1 acc. withSaN-S trainedon 150 classes
Similarclasses in
150 class-set
003
95.3 78.3
004 008
XE1
82.7 72.3
XE3 XE7
1SD
31.3 70.0
1SC
This plot demonstrates a lot of fluctuations in the class accuracies. We hypothesize this is due to the nature ofthe data, as some classes have small within-class variation and large between-class variation, so that they can beclassified well even with small amount of training samples. The maximum number of training samples is 900.Despite the fluctuations, we can observe the trend of increasing accuracy, especially when the number of originaltraining samples is more than 96 (i.e. at least 10.67% of the populated 900 samples are original samples). Thistrend is more visible from the class index 94 and on.Another question is how the performance on the existing classes get affected when a model is trained with
additional classes and in general more data. We inspected the class accuracies of the 50 classes from the 50-classand 150-class SaN-S models. We observed that the performance for 9 classes dropped 10% or more, howeverthe performance for 14 classes improved when trained within 150 classes. As expected, in the 150-class set, theclasses in the 50-class set get more competitors that share local features. In the discussion that follows, we referto signs using the Macri-Looper catalog naming system [25]. For instance, as illustrated in Table 5, due to theinclusion of other numerical signs, the performance of class 003 (literally 3 as three horizontal thick dots) drops.Similarly, sign XE1’s performance drops due to more similar-looking classes coming to play such as signs XE3and XE7 (all have dots and vertical parallel lines inside a square thick contour). Another notable difference is the38% increase in the performance of sign 1SD whereas its competitor sign 1SC’s performance drops by 17%. Thismight be due to the inclusion of more classes, which forces the network to spot more subtle differences, or dueto the inclusion of more head-signs (increasing in number from 4 to 29) so that the network becomes better atspotting "eyes" and distinguishing them from any other random circle (sign 1SD looks like a profile head signwith a prominent eye and mouth, whereas sign 1SC has two components: a head-like circle with three smallinner circles, and a body with inner details similar to 1SD).Summary of trends. From our experiments, we conclude that 1) VGG-16 seems to have more robust pretrained
representations than the ResNet-50 features; 2) fine-tuning improves the results compared to the pretrainedfeature classification baseline; 3) oversampling is essential for handling imbalanced small-scale glyph datasets; 4)batch normalization and dropout enables training a CNN from scratch with medium-scale oversampled data, andoutperforms fine-tuning results with a sketch-specific net.
ACM J. Comput. Cult. Herit., Vol. 1, No. 1, Article 1. Publication date: July 2018.
How to Tell Ancient Signs Apart?Recognizing and Visualizing Maya Glyphs with CNNs • 1:17
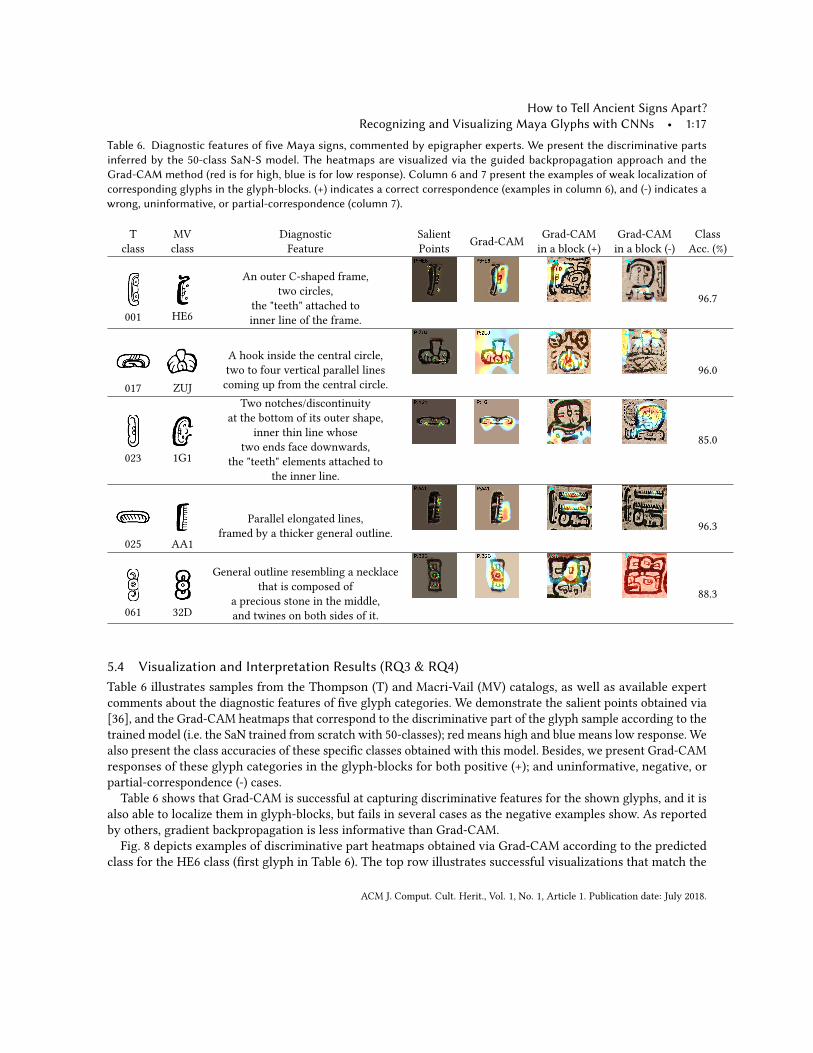
Table 6. Diagnostic features of five Maya signs, commented by epigrapher experts. We present the discriminative partsinferred by the 50-class SaN-S model. The heatmaps are visualized via the guided backpropagation approach and theGrad-CAM method (red is for high, blue is for low response). Column 6 and 7 present the examples of weak localization ofcorresponding glyphs in the glyph-blocks. (+) indicates a correct correspondence (examples in column 6), and (-) indicates awrong, uninformative, or partial-correspondence (column 7).
Tclass
MVclass
DiagnosticFeature
SalientPoints Grad-CAM Grad-CAM
in a block (+)Grad-CAMin a block (-)
ClassAcc. (%)
001 HE6
An outer C-shaped frame,two circles,
the "teeth" attached toinner line of the frame.
96.7
017 ZUJ
A hook inside the central circle,two to four vertical parallel linescoming up from the central circle.
96.0
023 1G1
Two notches/discontinuityat the bottom of its outer shape,
inner thin line whosetwo ends face downwards,
the "teeth" elements attached tothe inner line.
85.0
025 AA1
Parallel elongated lines,framed by a thicker general outline. 96.3
061 32D
General outline resembling a necklacethat is composed of
a precious stone in the middle,and twines on both sides of it.
88.3
5.4 Visualization and Interpretation Results (RQ3 & RQ4)Table 6 illustrates samples from the Thompson (T) and Macri-Vail (MV) catalogs, as well as available expertcomments about the diagnostic features of five glyph categories. We demonstrate the salient points obtained via[36], and the Grad-CAM heatmaps that correspond to the discriminative part of the glyph sample according to thetrained model (i.e. the SaN trained from scratch with 50-classes); red means high and blue means low response. Wealso present the class accuracies of these specific classes obtained with this model. Besides, we present Grad-CAMresponses of these glyph categories in the glyph-blocks for both positive (+); and uninformative, negative, orpartial-correspondence (-) cases.
Table 6 shows that Grad-CAM is successful at capturing discriminative features for the shown glyphs, and it isalso able to localize them in glyph-blocks, but fails in several cases as the negative examples show. As reportedby others, gradient backpropagation is less informative than Grad-CAM.Fig. 8 depicts examples of discriminative part heatmaps obtained via Grad-CAM according to the predicted
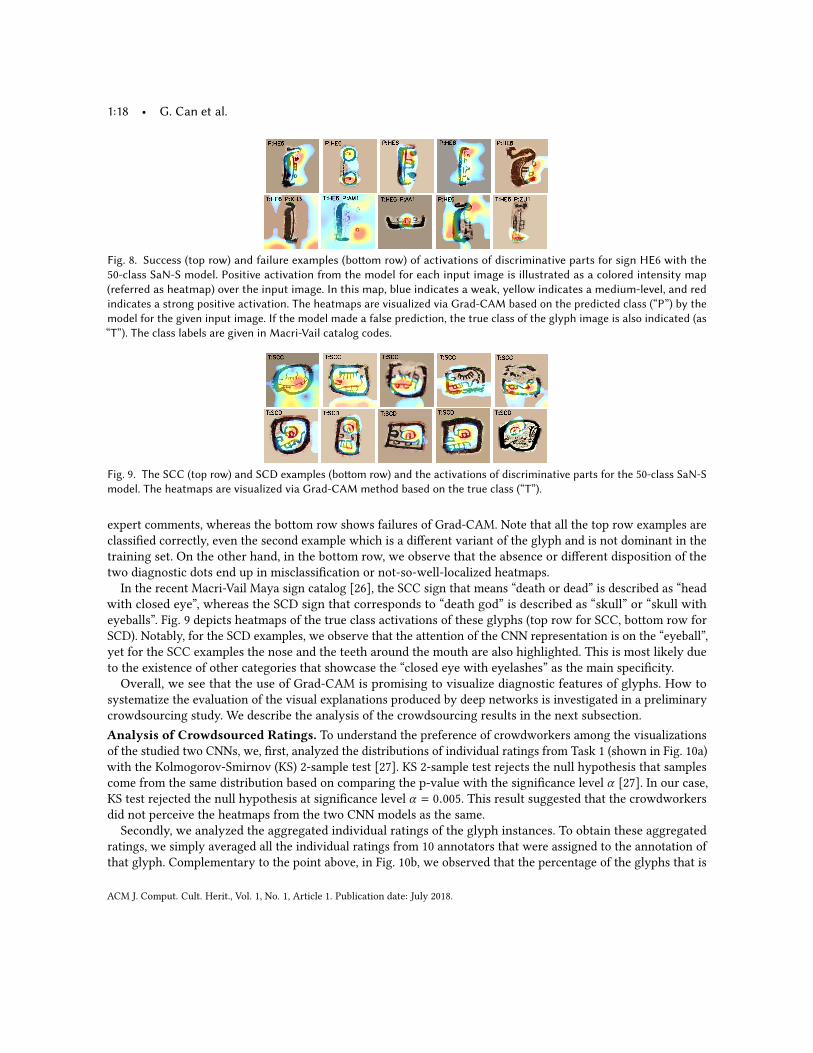
class for the HE6 class (first glyph in Table 6). The top row illustrates successful visualizations that match the
ACM J. Comput. Cult. Herit., Vol. 1, No. 1, Article 1. Publication date: July 2018.
1:18 • G. Can et al.
Fig. 8. Success (top row) and failure examples (bottom row) of activations of discriminative parts for sign HE6 with the50-class SaN-S model. Positive activation from the model for each input image is illustrated as a colored intensity map(referred as heatmap) over the input image. In this map, blue indicates a weak, yellow indicates a medium-level, and redindicates a strong positive activation. The heatmaps are visualized via Grad-CAM based on the predicted class (“P”) by themodel for the given input image. If the model made a false prediction, the true class of the glyph image is also indicated (as“T”). The class labels are given in Macri-Vail catalog codes.
Fig. 9. The SCC (top row) and SCD examples (bottom row) and the activations of discriminative parts for the 50-class SaN-Smodel. The heatmaps are visualized via Grad-CAM method based on the true class (“T”).
expert comments, whereas the bottom row shows failures of Grad-CAM. Note that all the top row examples areclassified correctly, even the second example which is a different variant of the glyph and is not dominant in thetraining set. On the other hand, in the bottom row, we observe that the absence or different disposition of thetwo diagnostic dots end up in misclassification or not-so-well-localized heatmaps.
In the recent Macri-Vail Maya sign catalog [26], the SCC sign that means “death or dead” is described as “headwith closed eye”, whereas the SCD sign that corresponds to “death god” is described as “skull” or “skull witheyeballs”. Fig. 9 depicts heatmaps of the true class activations of these glyphs (top row for SCC, bottom row forSCD). Notably, for the SCD examples, we observe that the attention of the CNN representation is on the “eyeball”,yet for the SCC examples the nose and the teeth around the mouth are also highlighted. This is most likely dueto the existence of other categories that showcase the “closed eye with eyelashes” as the main specificity.Overall, we see that the use of Grad-CAM is promising to visualize diagnostic features of glyphs. How to
systematize the evaluation of the visual explanations produced by deep networks is investigated in a preliminarycrowdsourcing study. We describe the analysis of the crowdsourcing results in the next subsection.Analysis of Crowdsourced Ratings. To understand the preference of crowdworkers among the visualizationsof the studied two CNNs, we, first, analyzed the distributions of individual ratings from Task 1 (shown in Fig. 10a)with the Kolmogorov-Smirnov (KS) 2-sample test [27]. KS 2-sample test rejects the null hypothesis that samplescome from the same distribution based on comparing the p-value with the significance level α [27]. In our case,KS test rejected the null hypothesis at significance level α = 0.005. This result suggested that the crowdworkersdid not perceive the heatmaps from the two CNN models as the same.Secondly, we analyzed the aggregated individual ratings of the glyph instances. To obtain these aggregated
ratings, we simply averaged all the individual ratings from 10 annotators that were assigned to the annotation ofthat glyph. Complementary to the point above, in Fig. 10b, we observed that the percentage of the glyphs that is
ACM J. Comput. Cult. Herit., Vol. 1, No. 1, Article 1. Publication date: July 2018.
How to Tell Ancient Signs Apart?Recognizing and Visualizing Maya Glyphs with CNNs • 1:19
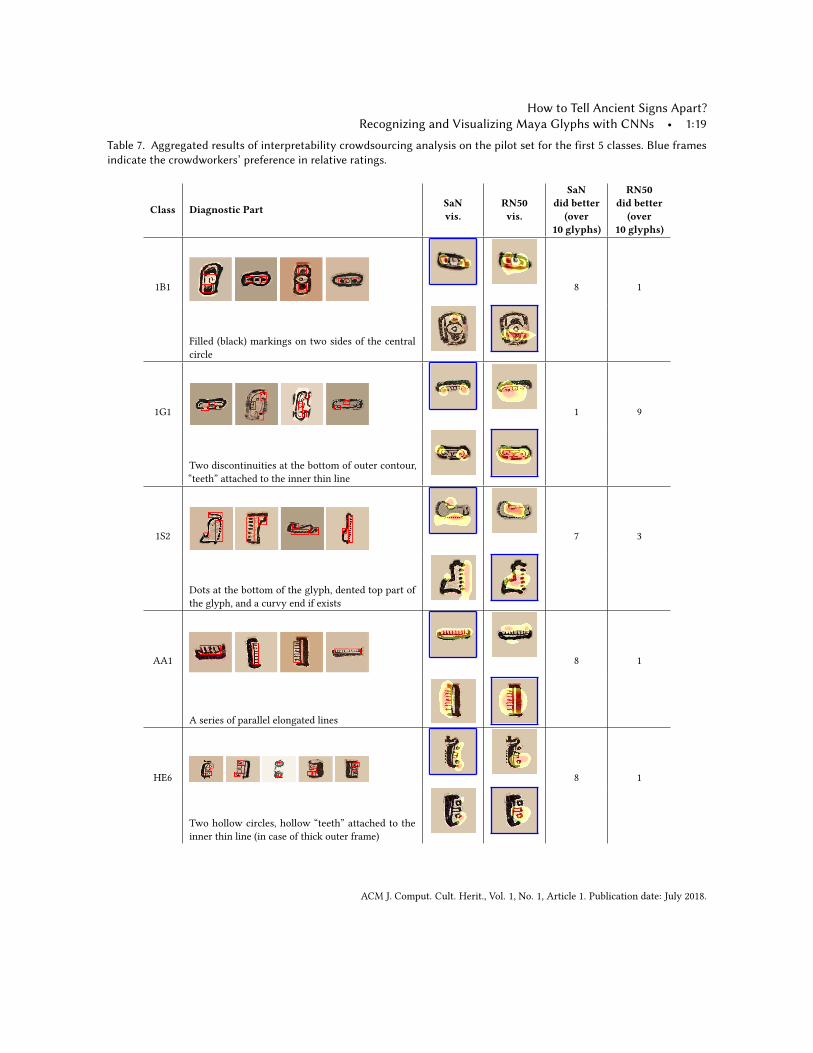
Table 7. Aggregated results of interpretability crowdsourcing analysis on the pilot set for the first 5 classes. Blue framesindicate the crowdworkers’ preference in relative ratings.
Class Diagnostic Part SaNvis.
RN50vis.
SaNdid better
(over10 glyphs)
RN50did better
(over10 glyphs)
1B1 8 1
Filled (black) markings on two sides of the centralcircle
1G1 1 9
Two discontinuities at the bottom of outer contour,“teeth” attached to the inner thin line
1S2 7 3
Dots at the bottom of the glyph, dented top part ofthe glyph, and a curvy end if exists
AA1 8 1
A series of parallel elongated lines
HE6 8 1
Two hollow circles, hollow “teeth” attached to theinner thin line (in case of thick outer frame)
ACM J. Comput. Cult. Herit., Vol. 1, No. 1, Article 1. Publication date: July 2018.
1:20 • G. Can et al.
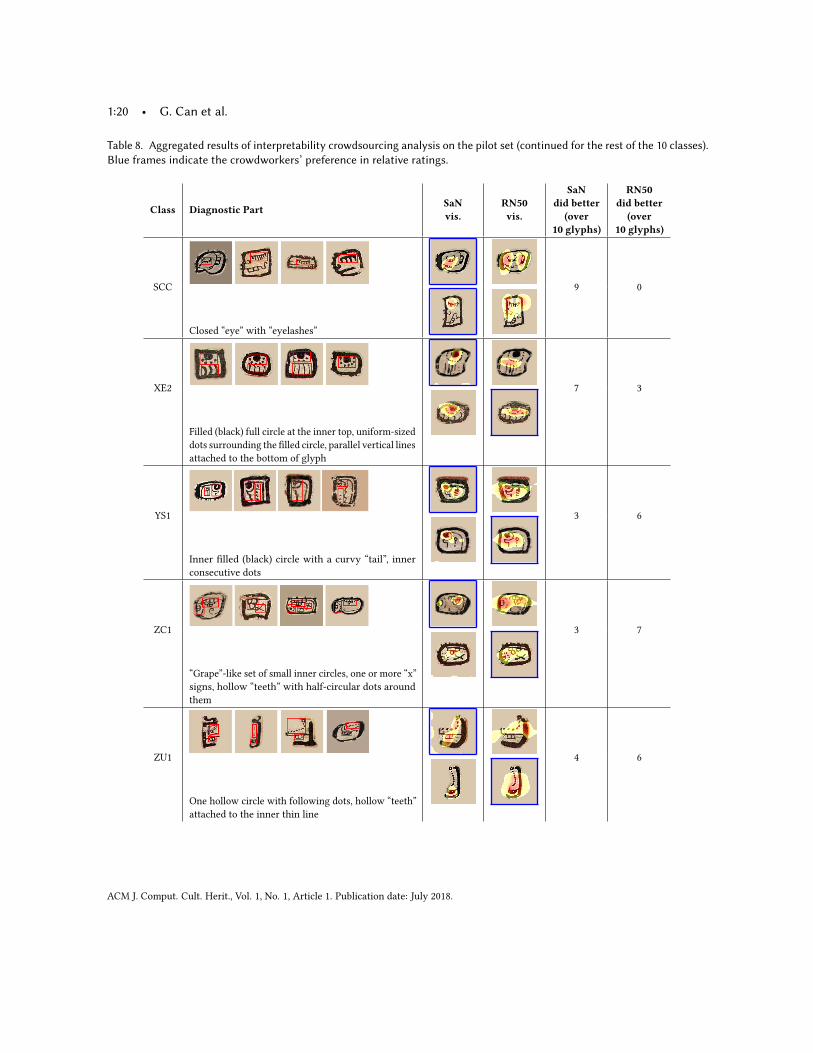
Table 8. Aggregated results of interpretability crowdsourcing analysis on the pilot set (continued for the rest of the 10 classes).Blue frames indicate the crowdworkers’ preference in relative ratings.
Class Diagnostic PartSaNvis.
RN50vis.
SaNdid better
(over10 glyphs)
RN50did better
(over10 glyphs)
SCC 9 0
Closed “eye” with “eyelashes”
XE2 7 3
Filled (black) full circle at the inner top, uniform-sizeddots surrounding the filled circle, parallel vertical linesattached to the bottom of glyph
YS1 3 6
Inner filled (black) circle with a curvy “tail”, innerconsecutive dots
ZC1 3 7
“Grape”-like set of small inner circles, one or more “x”signs, hollow “teeth” with half-circular dots aroundthem
ZU1 4 6
One hollow circle with following dots, hollow “teeth”attached to the inner thin line
ACM J. Comput. Cult. Herit., Vol. 1, No. 1, Article 1. Publication date: July 2018.
How to Tell Ancient Signs Apart?Recognizing and Visualizing Maya Glyphs with CNNs • 1:21
(a) Task 1. Individual ratings. (b) Task 1. Aggregated individual ratings.
(c) Task 2. Relative ratings.
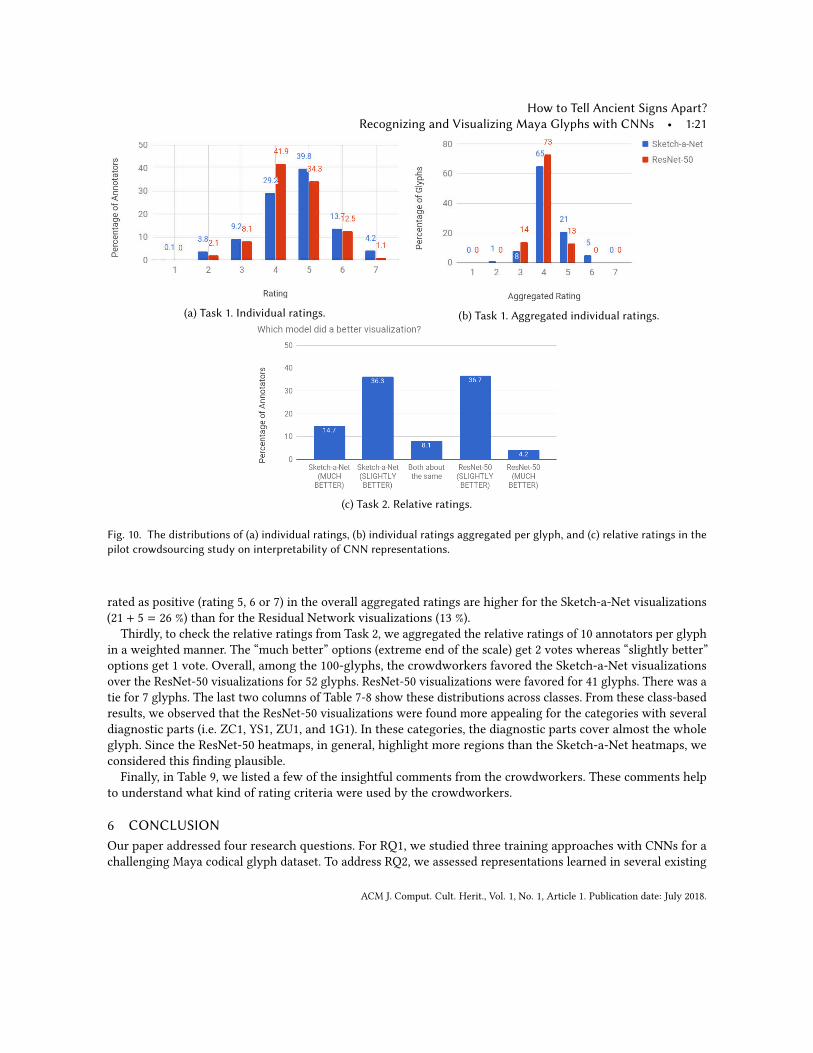
Fig. 10. The distributions of (a) individual ratings, (b) individual ratings aggregated per glyph, and (c) relative ratings in thepilot crowdsourcing study on interpretability of CNN representations.
rated as positive (rating 5, 6 or 7) in the overall aggregated ratings are higher for the Sketch-a-Net visualizations(21 + 5 = 26 %) than for the Residual Network visualizations (13 %).
Thirdly, to check the relative ratings from Task 2, we aggregated the relative ratings of 10 annotators per glyphin a weighted manner. The “much better” options (extreme end of the scale) get 2 votes whereas “slightly better”options get 1 vote. Overall, among the 100-glyphs, the crowdworkers favored the Sketch-a-Net visualizationsover the ResNet-50 visualizations for 52 glyphs. ResNet-50 visualizations were favored for 41 glyphs. There was atie for 7 glyphs. The last two columns of Table 7-8 show these distributions across classes. From these class-basedresults, we observed that the ResNet-50 visualizations were found more appealing for the categories with severaldiagnostic parts (i.e. ZC1, YS1, ZU1, and 1G1). In these categories, the diagnostic parts cover almost the wholeglyph. Since the ResNet-50 heatmaps, in general, highlight more regions than the Sketch-a-Net heatmaps, weconsidered this finding plausible.
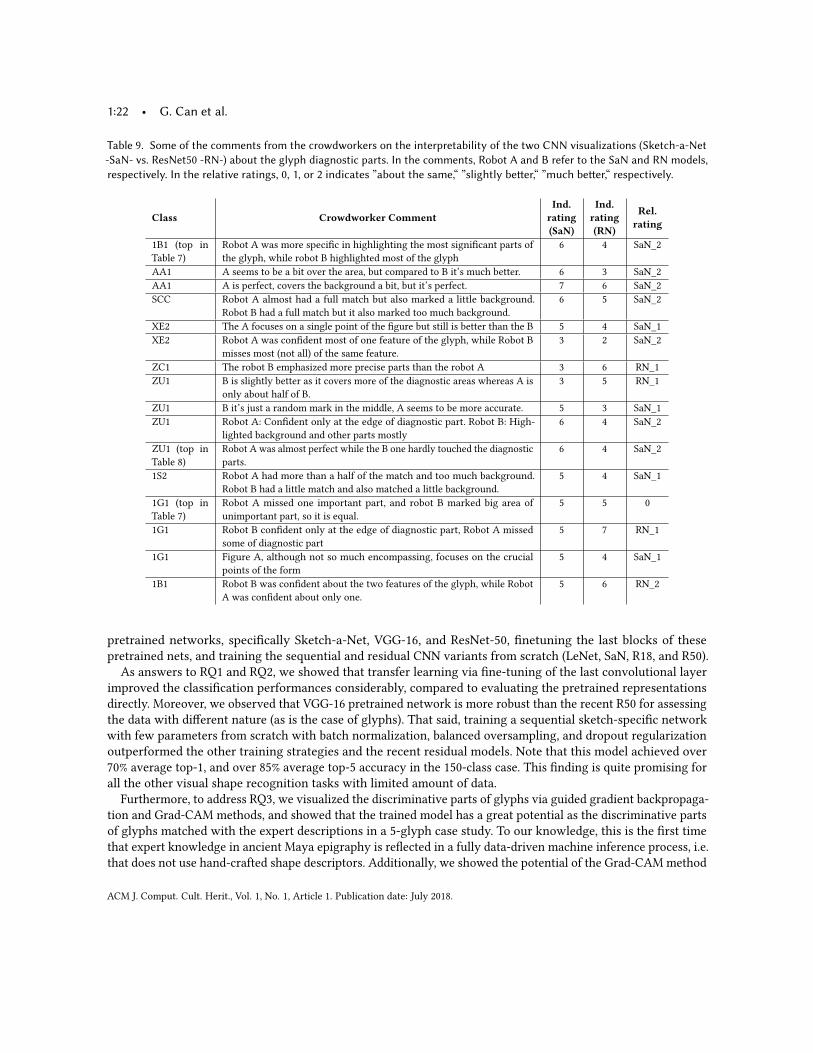
Finally, in Table 9, we listed a few of the insightful comments from the crowdworkers. These comments helpto understand what kind of rating criteria were used by the crowdworkers.
6 CONCLUSIONOur paper addressed four research questions. For RQ1, we studied three training approaches with CNNs for achallenging Maya codical glyph dataset. To address RQ2, we assessed representations learned in several existing
ACM J. Comput. Cult. Herit., Vol. 1, No. 1, Article 1. Publication date: July 2018.
1:22 • G. Can et al.
Table 9. Some of the comments from the crowdworkers on the interpretability of the two CNN visualizations (Sketch-a-Net-SaN- vs. ResNet50 -RN-) about the glyph diagnostic parts. In the comments, Robot A and B refer to the SaN and RN models,respectively. In the relative ratings, 0, 1, or 2 indicates ”about the same,“ ”slightly better,“ ”much better,“ respectively.
Class Crowdworker CommentInd.rating(SaN)
Ind.rating(RN)
Rel.rating
1B1 (top inTable 7)
Robot A was more specific in highlighting the most significant parts ofthe glyph, while robot B highlighted most of the glyph
6 4 SaN_2
AA1 A seems to be a bit over the area, but compared to B it’s much better. 6 3 SaN_2AA1 A is perfect, covers the background a bit, but it’s perfect. 7 6 SaN_2SCC Robot A almost had a full match but also marked a little background.
Robot B had a full match but it also marked too much background.6 5 SaN_2
XE2 The A focuses on a single point of the figure but still is better than the B 5 4 SaN_1XE2 Robot A was confident most of one feature of the glyph, while Robot B
misses most (not all) of the same feature.3 2 SaN_2
ZC1 The robot B emphasized more precise parts than the robot A 3 6 RN_1ZU1 B is slightly better as it covers more of the diagnostic areas whereas A is
only about half of B.3 5 RN_1
ZU1 B it’s just a random mark in the middle, A seems to be more accurate. 5 3 SaN_1ZU1 Robot A: Confident only at the edge of diagnostic part. Robot B: High-
lighted background and other parts mostly6 4 SaN_2
ZU1 (top inTable 8)
Robot A was almost perfect while the B one hardly touched the diagnosticparts.
6 4 SaN_2
1S2 Robot A had more than a half of the match and too much background.Robot B had a little match and also matched a little background.
5 4 SaN_1
1G1 (top inTable 7)
Robot A missed one important part, and robot B marked big area ofunimportant part, so it is equal.
5 5 0
1G1 Robot B confident only at the edge of diagnostic part, Robot A missedsome of diagnostic part
5 7 RN_1
1G1 Figure A, although not so much encompassing, focuses on the crucialpoints of the form
5 4 SaN_1
1B1 Robot B was confident about the two features of the glyph, while RobotA was confident about only one.
5 6 RN_2
pretrained networks, specifically Sketch-a-Net, VGG-16, and ResNet-50, finetuning the last blocks of thesepretrained nets, and training the sequential and residual CNN variants from scratch (LeNet, SaN, R18, and R50).
As answers to RQ1 and RQ2, we showed that transfer learning via fine-tuning of the last convolutional layerimproved the classification performances considerably, compared to evaluating the pretrained representationsdirectly. Moreover, we observed that VGG-16 pretrained network is more robust than the recent R50 for assessingthe data with different nature (as is the case of glyphs). That said, training a sequential sketch-specific networkwith few parameters from scratch with batch normalization, balanced oversampling, and dropout regularizationoutperformed the other training strategies and the recent residual models. Note that this model achieved over70% average top-1, and over 85% average top-5 accuracy in the 150-class case. This finding is quite promising forall the other visual shape recognition tasks with limited amount of data.
Furthermore, to address RQ3, we visualized the discriminative parts of glyphs via guided gradient backpropaga-tion and Grad-CAM methods, and showed that the trained model has a great potential as the discriminative partsof glyphs matched with the expert descriptions in a 5-glyph case study. To our knowledge, this is the first timethat expert knowledge in ancient Maya epigraphy is reflected in a fully data-driven machine inference process, i.e.that does not use hand-crafted shape descriptors. Additionally, we showed the potential of the Grad-CAMmethod
ACM J. Comput. Cult. Herit., Vol. 1, No. 1, Article 1. Publication date: July 2018.
How to Tell Ancient Signs Apart?Recognizing and Visualizing Maya Glyphs with CNNs • 1:23
in glyph localization in a cluttered setting, i.e. glyph-blocks. Finally, to address RQ4, we investigated on how toassess and exploit CNN visual outputs in a comparative study. According to this study, sketch-specific network(SaN) visualizations were found more focused and appealing compared to the more-diffused visualizations of theresidual network (ResNet-50). The ResNet-50 visualizations were favored only in the case of the glyph categoriesthat require a large region to diagnose. Therefore, we conclude that overall the crowdworkers perceived the SaNvisualizations more precise and insightful than the ResNet-50 visualizations in order to locate the diagnosticparts of the glyphs.
ACKNOWLEDGMENTSThis work was funded by the Swiss National Science Foundation through the MAAYA project and by the HaslerFoundation through the DCrowdLens project. We thank Carlos Pallán Gayol (Univ. of Bonn), Guido Krempel(Univ. of Bonn), Jacub Spotak (Comenius Univ. in Bratislava) for generating the glyph block dataset and forproviding the glyph annotations, and Rui Hu (Idiap) for discussions. The original images that are adapted in thefigures and the tables were created by Carlos Pallán Gayol for the MAAYA project.
REFERENCES[1] Abrar H Abdulnabi, Gang Wang, Jiwen Lu, and Kui Jia. 2015. Multi-task CNN model for attribute prediction. IEEE Transactions on
Multimedia 17, 11 (2015), 1949–1959.[2] Gulcan Can, Jean-Marc Odobez, and Daniel Gatica-Perez. 2016. Evaluating Shape Representations for Maya Glyph Classification. ACM
Journal on Computing and Cultural Heritage (JOCCH) 9, 3 (sep 2016).[3] Gulcan Can, Jean-Marc Odobez, and Daniel Gatica-Perez. 2017. Maya Codical Glyph Segmentation: A Crowdsourcing Approach.
Transactions on Multimedia (in press) (September 2017). https://doi.org/10.1109/TMM.2017.2755985[4] Gülcan Can, Jean-Marc Odobez, and Daniel Gatica-Perez. 2017. Shape Representations for Maya Codical Glyphs: Knowledge-driven or
Deep?. In Proceedings of the 15th International Workshop on Content-Based Multimedia Indexing (CBMI ’17). ACM, Article 32, 6 pages.https://doi.org/10.1145/3095713.3095746
[5] Alfredo Canziani, Adam Paszke, and Eugenio Culurciello. 2016. An Analysis of Deep Neural Network Models for Practical Applications.arXiv preprint arXiv:1605.07678 (2016).
[6] Dan C Cireşan, Ueli Meier, and Jürgen Schmidhuber. 2012. Transfer learning for Latin and Chinese characters with deep neural networks.In Neural Networks (IJCNN), The 2012 International Joint Conference on. IEEE, 1–6.
[7] Jia Deng, Wei Dong, Richard Socher, Li-Jia Li, Kai Li, and Li Fei-Fei. 2009. Imagenet: A large-scale hierarchical image database. InComputer Vision and Pattern Recognition. IEEE, 248–255.
[8] V. Deufemia, L. Paolino, and H. d. Lumley. 2012. Petroglyph Recognition Using Self-Organizing Maps and Fuzzy Visual Language Parsing.In IEEE 24th International Conference on Tools with Artificial Intelligence, Vol. 1. 852–859. https://doi.org/10.1109/ICTAI.2012.119
[9] Jeff Donahue, Yangqing Jia, Oriol Vinyals, JudyHoffman, Ning Zhang, Eric Tzeng, and Trevor Darrell. 2014. DeCAF: ADeep ConvolutionalActivation Feature for Generic Visual Recognition.. In ICML, Vol. 32. 647–655.
[10] Mathias Eitz, James Hays, and Marc Alexa. 2012. How Do Humans Sketch Objects? ACM Trans. Graph. 31, 4, Article 44 (jul 2012),10 pages.
[11] Morris Franken and Jan C van Gemert. 2013. Automatic egyptian hieroglyph recognition by retrieving images as texts. In ACMMultimedia Conference. ACM, 765–768.
[12] Xavier Glorot and Yoshua Bengio. 2010. Understanding the difficulty of training deep feedforward neural networks. In InternationalConference on Artificial Intelligence and Statistics. 249–256.
[13] Kaiming He, Xiangyu Zhang, Shaoqing Ren, and Jian Sun. 2016. Deep residual learning for image recognition. In Proceedings of theIEEE Conference on Computer Vision and Pattern Recognition. 770–778.
[14] Paulina Hensman and David Masko. 2015. The Impact of Imbalanced Training Data for Convolutional Neural Networks. TechnicalReport. KTH, Stockholm, Sweden. Degree Project, in Computer Science, First Level.
[15] Geoffrey E Hinton, Nitish Srivastava, Alex Krizhevsky, Ilya Sutskever, and Ruslan R Salakhutdinov. 2012. Improving neural networks bypreventing co-adaptation of feature detectors. arXiv preprint arXiv:1207.0580 (2012).
[16] Judy Hoffman, Eric Tzeng, Jeff Donahue, Yangqing Jia, Kate Saenko, and Trevor Darrell. 2013. One-shot adaptation of supervised deepconvolutional models. arXiv preprint arXiv:1312.6204 (2013).
[17] Stephen Houston, John Robertson, and David Stuart. 2000. The Language of Classic Maya Inscriptions. Current Anthropology 41, 3(2000), 321–356. https://doi.org/10.1086/300142
ACM J. Comput. Cult. Herit., Vol. 1, No. 1, Article 1. Publication date: July 2018.
1:24 • G. Can et al.
[18] Rui Hu, Gulcan Can, Carlos Pallan Gayol, Guido Krempel, Jakub Spotak, Gabrielle Vail, Stephane Marchand-Maillet, Jean-Marc Odobez,and Daniel Gatica-Perez. 2015. Multimedia Analysis and Access of Ancient Maya Epigraphy. Signal Processing Magazine 32, 4 (July2015), 75–84.
[19] Sergey Ioffe and Christian Szegedy. 2015. Batch Normalization: Accelerating Deep Network Training by Reducing Internal CovariateShift. In Proc. of International Conference on Machine Learning. 448–456.
[20] Diederik Kingma and Jimmy Ba. 2014. Adam: A method for stochastic optimization. arXiv preprint arXiv:1412.6980 (2014).[21] Alex Krizhevsky, Ilya Sutskever, and Geoffrey E Hinton. 2012. Imagenet classification with deep convolutional neural networks. In
Advances in Neural Information Processing Systems. 1097–1105.[22] Yann LeCun, Yoshua Bengio, and Geoffrey Hinton. 2015. Deep learning. Nature 521, 7553 (2015), 436–444.[23] Yann LeCun, Léon Bottou, Yoshua Bengio, and Patrick Haffner. 1998. Gradient-based learning applied to document recognition. Proc.
IEEE 86, 11 (1998), 2278–2324.[24] David G. Lowe. 1999. Object recognition from local scale-invariant features. In International Conference on Computer Vision, Vol. 2.
IEEE, 1150–1157.[25] Martha J. Macri and Matthew George Looper. 2003. The New Catalog of Maya Hieroglyphs: The Classic Period Inscriptions. Vol. 1.
University of Oklahoma Press.[26] Martha J. Macri and Gabrielle Vail. 2008. The New Catalog of Maya Hieroglyphs, vol. 2: The Codical Texts. University of Oklahoma
Press.[27] Frank J Massey Jr. 1951. The Kolmogorov-Smirnov test for goodness of fit. Journal of the American statistical Association 46, 253 (1951),
68–78.[28] Georg Poier, Markus Seidl, Matthias Zeppelzauer, Christian Reinbacher, Martin Schaich, Giovanna Bellandi, Alberto Marretta, and
Horst Bischof. 2017. The 3D-Pitoti Dataset: A Dataset for High-resolution 3D Surface Segmentation. In Proceedings of the 15thInternational Workshop on Content-Based Multimedia Indexing (CBMI ’17). ACM, New York, NY, USA, Article 5, 7 pages. https://doi.org/10.1145/3095713.3095719
[29] Edgar Roman-Rangel, Gulcan Can, Stephane Marchand-Maillet, Rui Hu, Carlos Pallan Gayol, Guido Krempel, Jakub Spotak, Jean-MarcOdobez, and Daniel Gatica-Perez. 2016. Transferring Neural Representations for Low-dimensional Indexing of Maya Hieroglyphic Art.In ECCV Workshop on Computer Vision for Art Analysis.
[30] Edgar Roman-Rangel, Carlos Pallan, Jean-Marc Odobez, and Daniel Gatica-Perez. 2011. Analyzing ancient maya glyph collections withcontextual shape descriptors. IJCV 94, 1 (2011), 101–117.
[31] Markus Seidl and Christian Breiteneder. 2012. Automated Petroglyph Image Segmentation with Interactive Classifier Fusion. InProceedings of the Eighth Indian Conference on Computer Vision, Graphics and Image Processing (ICVGIP ’12). ACM, New York, NY,USA, Article 66, 8 pages. https://doi.org/10.1145/2425333.2425399
[32] Markus Seidl, Ewald Wieser, and Craig Alexander. 2015. Automated classification of petroglyphs. Digital Applications in Archaeologyand Cultural Heritage 2, 2 (2015), 196 – 212. https://doi.org/10.1016/j.daach.2015.03.001 Digital imaging techniques for the study ofprehistoric rock art.
[33] Markus Seidl, Ewald Wieser, Matthias Zeppelzauer, Axel Pinz, and Christian Breiteneder. 2015. Graph-Based Shape Similarity ofPetroglyphs. Springer International Publishing, Cham, 133–148. https://doi.org/10.1007/978-3-319-16178-5_9
[34] Ramprasaath R Selvaraju, Abhishek Das, Ramakrishna Vedantam, Michael Cogswell, Devi Parikh, and Dhruv Batra. 2016. Grad-CAM:Why did you say that? arXiv preprint arXiv:1611.07450 (2016).
[35] Ali Sharif Razavian, Hossein Azizpour, Josephine Sullivan, and Stefan Carlsson. 2014. CNN Features Off-the-Shelf: An AstoundingBaseline for Recognition. In CVPR Workshops.
[36] Karen Simonyan, Andrea Vedaldi, and Andrew Zisserman. 2013. Deep inside convolutional networks: Visualising image classificationmodels and saliency maps. arXiv preprint arXiv:1312.6034 (2013).
[37] K. Simonyan and A. Zisserman. 2014. Very Deep Convolutional Networks for Large-Scale Image Recognition. CoRR abs/1409.1556(2014).
[38] Christian Szegedy, Sergey Ioffe, Vincent Vanhoucke, and Alex Alemi. 2016. Inception-v4, inception-resnet and the impact of residualconnections on learning. arXiv preprint arXiv:1602.07261 (2016).
[39] Christian Szegedy, Wei Liu, Yangqing Jia, Pierre Sermanet, Scott Reed, Dragomir Anguelov, Dumitru Erhan, Vincent Vanhoucke, andAndrew Rabinovich. 2015. Going deeper with convolutions. In Proceedings of the IEEE Conference on Computer Vision and PatternRecognition. 1–9.
[40] N. Tajbakhsh, J. Y. Shin, S. R. Gurudu, R. T. Hurst, C. B. Kendall, M. B. Gotway, and J. Liang. 2016. Convolutional Neural Networks forMedical Image Analysis: Full Training or Fine Tuning? IEEE Transactions on Medical Imaging 35, 5 (May 2016), 1299–1312.
[41] John Eric Sidney Thompson and George E. Stuart. 1962. A Catalog of Maya Hieroglyphs. University of Oklahoma Press.[42] Jason Yosinski, Jeff Clune, Yoshua Bengio, and Hod Lipson. 2014. How transferable are features in deep neural networks?. In Advances
in Neural Information Processing Systems. 3320–3328.
ACM J. Comput. Cult. Herit., Vol. 1, No. 1, Article 1. Publication date: July 2018.
How to Tell Ancient Signs Apart?Recognizing and Visualizing Maya Glyphs with CNNs • 1:25
[43] Qian Yu, Yongxin Yang, Yi-Zhe Song, Tao Xiang, and Timothy Hospedales. 2015. Sketch-a-net that beats humans. arXiv preprintarXiv:1501.07873 (2015).
[44] Matthew D Zeiler and Rob Fergus. 2014. Visualizing and understanding convolutional networks. In European conference on computervision. Springer, 818–833.
[45] B. Zhou, A. Khosla, Lapedriza. A., A. Oliva, and A. Torralba. 2016. Learning Deep Features for Discriminative Localization. CVPR (2016).[46] Qiang Zhu, Xiaoyue Wang, Eamonn Keogh, and Sang-Hee Lee. 2011. An efficient and effective similarity measure to enable data mining
of petroglyphs. Data Mining and Knowledge Discovery 23, 1 (01 Jul 2011), 91–127. https://doi.org/10.1007/s10618-010-0200-z
Received September 2017; revised November 2017; revised May 2018; accepted May 2018
ACM J. Comput. Cult. Herit., Vol. 1, No. 1, Article 1. Publication date: July 2018.
Related Documents