How to reduce greenhouse gas emissions, save money and maintain quality of life Rose, B J. 2009 Disclaimer: Author Ben Rose accepts no liability whatsoever, by reason of negligence or otherwise, arising from the use or release of any of the information in this booklet or any part of it. Copyright Ben Rose, 2009. Contact [email protected] for permission to make multiple copies of this publication.

Welcome message from author
This document is posted to help you gain knowledge. Please leave a comment to let me know what you think about it! Share it to your friends and learn new things together.
Transcript
How to reduce greenhouse gas
emissions, save money and
maintain quality of life
Rose, B J. 2009
Disclaimer: Author Ben Rose accepts no liability whatsoever, by reason of negligence or otherwise, arising from the use or
release of any of the information in this booklet or any part of it.
Copyright Ben Rose, 2009. Contact [email protected] for permission to make multiple copies of this publication.

1
Introduction
This booklet is designed to educate the
Australian community and schools towards:
• Awareness of the causes of global
warming, sources of greenhouse gases in
Australia and emissions abatement
measures.
• Sustainable, energy efficient domestic
consumption habits that reduce
greenhouse gas emissions.
Global Warming and its Causes
Global warming is caused by increasing
atmospheric concentrations of gases emitted by
human activities, primarily combustion of fossil
fuels. These emissions are occurring at a rate that
is double the capacity of the Earth’s oceans and
forests to assimilate them. CO2 concentrations in
the atmosphere are now over 380 ppm, which is
higher than any measured in ice core records over
400,000 years and is increasing at 2.5 % per year.
The IPCC points to the need for reductions in
global emissions of around 50 per cent by 2050
and 80 per cent by 2100 in order to limit global
warming to between 1.2 deg. and 2.3 deg. C by
the year 2100.
The main sources of anthropogenic greenhouse
gas emissions are, in order of magnitude:
• Stationary energy generation
• Agriculture and land clearing
• Transport
• Industrial processes
Emissions are first and foremost a problem
created by the affluent industrialized nations. The
USA and Australia have greenhouse gas
emissions averaging 22 and 28t per head
respectively, compared to less than 1t for many
developing nations, including China. The
sustainable level of emissions has been estimated
to be about 2 t for every person on planet Earth.
Emission abatement and the Kyoto Protocol
The Kyoto Protocol is a legal international
agreement under which 162 industrialized countries
will reduce their collective emissions of greenhouse
gases by 5.2% compared to the year 1990, by 2010.
The goal is to lower emissions from six greenhouse
gases - carbon dioxide, methane, nitrous oxide,
sulfur hexafluoride, HFCs, and PFCs - calculated as
an average over the five-year period of 2008-12.
National targets range from 8% reductions for the
European Union and some others to 7% for the US,
6% for Japan, 0% for Russia, and permitted
increases of 8% for Australia and 10% for
Iceland."(Wikipedia, 2005). The KP came into force
in Feb 2005. Participating nations have introduced
emission abatement schemes in the form of carbon
taxes or ‘cap and trade’ CO2 trading schemes.
Australia and the US have only recently ratified the
Protocol and are in the process of enacting
emissions abatement schemes. The UNFCCC has
been meeting annually to develop and international
agreement to come into force in 2012 and reduce
GHG emissions by 50% by 2050. Most developed
nations see an urgent need to achieve this, and keep
atmospheric CO2e concentrations below 450 ppm.
Although a large proportion of Australia’s
emissions are from primary resources exports, there
is great potential to reduce emissions from these
industries by energy efficiencies and changing
energy sources from coal to renewable fuels and
gas. Considerable progress has been made over the
past 5 years. Mandatory Energy Efficiency Audits
and Reporting have been enacted by the Australian
Government for the 200 largest corporate emitters.
A Carbon Pollution Reduction Scheme is about to
be enacted and a Mandatory Renewable Energy
Target for electricity generation of 20% by 2020 has
been enacted
Australia has joined the Asia Pacific Partnership on
Clean Development, in which the United States,
Australia, the People's Republic of China, India,
Japan and South Korea agreed to cooperate on
development and transfer of technology which
enables reduction of greenhouse gas emissions.

2
These countries are major coal producers and
consumers and their major focus is cleaner coal
combustion and geo-sequestration. To achieve the
emissions reductions of 50-60% that are required
to stabilize greenhouse gases in the atmosphere by
the middle of the century and avoid catastrophic
climate change (>2degree temperature rise), all of
the world’s major nations must join an
international agreement to reduce emissions.
Without the fiscal incentives provided by carbon
trading and carbon taxes, significant emissions
reductions are unlikely.
The issue of emissions from the developing world
is a vexed one, but it is clear that high
consumption ‘western’ lifestyles contribute a
large portion of greenhouse gas emissions. Figure
2 clearly illustrates how per capita emissions
relate to lifestyle and consumption. It is generally
agreed that China, which has surpassed the US as
the world’s highest emitting nation and India,
with their rapidly expanding economies and
increasing emissions, must be included in a global
emissions abatement scheme.
Fig.1.1. Sources of greenhouse gases globally
(IPCC, 2005)
Figure 1.2 Domestic greenhouse gas emissions – 3 person household – different lifestyles
0.0
5.0
10.0
15.0
20.0
25.0
30.0
35.0
40.0
45.0
Consumption category
GHG Emissions, tonnes CO2e/ year
HIGH (105 t) 15.1 12.7 40.2 9.0 5.6 13.4 1.4 8.0
AVERAGE household (48t) 8.9 7.6 8.4 5.2 4.2 7.7 0.9 4.8
ENERGY WISE (19 t) 4.2 3.6 0 2.0 1.6 4.9 0.8 1.0
THIRD WORLD (3.4 t) 0.4 0.5 0 0.3 0 2.0 0 0
Domestic-
heating, cooking,
appliances
Vehicle fuel
Air travel
(operational +
embodied)
Housing,
possessions
(embodied)
Cars (embodied)Food, groceries
(embodied)
Water supply
(embodied +
operational)
Waste
(embodied+
methane)

3
Domestic Sources of Greenhouse
Gas emissions
Australians produce, on average 28 tonnes of
greenhouse gas (GHG) emissions per person; the
highest in the world and 14 times the sustainable
level per head necessary to prevent global
warming of more than 2 degree C (IPCC, 2001).
We must reduce our emissions because these
levels are obviously sustainable. CO2e pollution
is also a useful ‘proxy’ or indication for other
impacts such as depletion of energy resources,
land use footprint and toxic air pollutants.
About 13 tonnes are from our domestic energy
use, consumption of goods and travel, excluding
services. If services are included, 58% of our
emissions are from household consumption. Of
this about 58 % is from consumption of home
energy, food and goods and 42% from transport
for private purposes. By making informed
decisions in all aspects of home and transport
energy consumption, most Australians can reduce
the emissions for which they are responsible by
half or more. Emissions from a typical Australian
household of 3 people (Figure 12) can be
classified as follows:
1. Car travel, fuel use for privately
owned vehicles 27%
2. Overseas travel air and sea 15%
3. Public transport bus/ train <1%
4. Electricity used in the home 14%
5. Other fuels gas, wood etc 3%
6. Food, water and groceries embodied emissions 22%
7. Waste embodied and methane
emissions 11%
8. House, appliances and other
possessions embodied emissions 12%
Figure 1 is a graph of emissions for a typical
Australian household (Australian Bureau of
Statistics Year Book, 2001; Rose, 2009), produced
using the GHG-Energy Calc.
The Calculator is designed to encourage self-
auditing of energy use and emissions by households
and small businesses. It estimates all energy and
emissions resulting from our consumption of energy
and goods:
1. Direct energy and emissions from fuel and
electricity used.
2. Upstream energy and emissions from the
extraction/ refining of the fuels and generation of
the electricity that we use.
(1+2 =’ full cycle’ energy and emissions)
3. Embodied energy and emissions from the
production and manufacture of:
• Food, groceries and water that we consume
and municipal solid waste.
• Vehicles and other transport modes, housing
and other possessions.
Want to estimate your energy consumption
and emissions? Do your own audit in a few
minutes using GHG-Energy Calc on
http://www.ghgenergycalc.com.au
* Greenhouse gas emissions are expressed in
tonnes of carbon dioxide equivalents (t CO2e)
** The energy used in the production of all
goods, e.g. food, vehicles, houses, containers
and packaging is termed Embodied energy.
Most of the embodied energy comes from fossil
fuels, and the greenhouse gases emitted in the
process are called Embodied emissions (EE).

4
Figure 1
GHG emissions for a typical 3 person Australian
family
15,000 km
11%
24,600 km
23%
35 kg/wk,
typical diet
21%5000 kWh/yr
18%
Waste
11%4 brm brick house
4%
Bus/train
1% water
2%
gas 3%
possessions
7%
0%
5%
10%
15%
20%
25%
30%
Transport - car
and public
Travel - air/
overseas
Food/groceries
and water
Home energy -
electricity and
gas
Embodied
energy of house
and
possessions
Waste
%
Figure 2
Greenhouse Emissions (kilograms
CO2e/Gigajoule) of Fuels
020406080100120140
Brown coal briquettes
Black coal
Kerosene, petrol, heating oil
LPG
Natural gas
Wood (residential heaters)
Wood biomass firing boiler
Fuel Type
kg CO2e per GJ

5
Greenhouse gas emission
checklist
If you are serious about reducing greenhouse gas
(GHG) emissions, start with your own household
or small business activities/ items that produce
most GHG emissions. The check list below
summarizes the 6 major areas of domestic energy
consumption and emissions. Use GHG-Energy
Calc to estimate your emissions and use a
‘scorecard’ approach to see where to most
effectively reduce your ‘annual GHG emission
score’.
1. Are you a frequent flier?
If so, air travel will
produce more GHG
emissions than
anything else you
do. For example an
economy return trip
by jet aircraft to
Europe for one person results in about 10 tonnes
of greenhouse gas emissions (20-30 tonnes if
traveling business or first class). The real cost of
air travel is not paid by travelers today. A pre-
WW II international agreement makes aviation
fuel virtually exempt from tax.
2. Do you own a car?
Traveling in large
vehicles that are not
utilized to capacity is the
most polluting activity
that Australians do. If
you travel the average
distance of 16,600 km
per year on your own in
a large car, add 6.6 tonnes CO2e per year to your
scorecard (4.8 t from fuel burned and 1.8t of
embodied emissions). Traveling the same
distance with 4 people in the car, GHG emissions
are 1.6 t per person and by bus, about 1.0 t. If
your household uses two medium to cars for
commuting, these are likely to account for about
10 t of greenhouse gases and car transport will be
by far your greatest source of emissions.
Although a fuel excise of 38c per litre on petrol
and diesel is paid to fund roads and road trauma,
this is low compared to the other OECD nations
most of which pay 60–95c/ L (Australian Institute
of Petroleum, 1999). There is a compelling case to
for Australia in increase its fuel taxes to at least
these levels and include license and insurance in
the cost of fuel, to ensure that users pay more
proportionally to their road usage and impacts. A
carbon price and tax should also be applied to
road and air transport fuels.
3. Do you have electric space heating
and cooling and water heating; are your
appliances efficient?
Coal-fired electricity is the
most polluting form of
energy in terms of
greenhouse gas emissions.
In Australia, 80% of
electricity is from coal fired
power stations (Australian Bureau of Statistics,
2002).
Transport is a major contributor to global
warming and pollution. You can help change
government and corporate action by:
• Purchasing a smaller, more efficient
vehicle from a company with good
sustainability accreditation.
• Switching from driving your own car
to going by bus, train or bike
wherever possible.
• Voting for political parties that have
policies to enact emissions abatement
schemes, improve bus, train and
bicycle transport and increase tax on
aircraft fuel.

6
Space and water heating account for at least 50%
of home energy use and emissions. Gas heating
appliances produce only 1/6th as much greenhouse
gas emissions as electric equivalents. Solar
appliances produce even less. Cut your home
energy emissions by up to 50% (about 5 tonnes)
or more by:
• Converting from electric to gas or solar
water and space heating systems.
• Insulating the home.
• Use fans instead of air conditioners and if
you must have an a/c ensure it is ‘4 star
plus’ efficiency rated.
• Switching heating and cooling appliances
off at the power point when they are not
being used.
• For more details, see ‘Simple ways to save
Energy’ on www.sedo.energy.wa.gov.au/
uploads/simple_ways_4pg_39.pdf
4. Are your house, cars and possessions
used to capacity?
Energy is used in the
production and manufacture
of everything we own. This
energy, termed the embodied
energy, varies according to
the type and weight of
materials, and also the manufacturing processes
used. The resulting embodied emissions can be
apportioned over the life of the product, for
example:
• A typical large car traveling 15,000
km/year for 15 years accounts for 1.1 t
CO2e / year in embodied emissions. This
is about 1/4 of the emissions from fuel
used by that vehicle.
• The average Australian double brick and
tile house of 185 sq. metres with typical
furnishings, plus the household’s
possessions for 3 people accounts for
about 4.3 t of embodied emissions per
year.
• Down-sizing house and cars to half the
sizes stated above would reduce embodied
emissions by over 2 tonnes per year and
fuel/ energy emissions by 5 tonnes.
5. Do you consume much meat, dairy,
and highly processed food?
If so, your emissions
score for food is likely
to be about 3 t / year /
person in your
household. This can
easily be reduced by 1.5
t per person (4.5 t for
the household of three)
by minimizing consumption of:
• Red meats, dairy products, other meats
and imported foods
• Foods, drinks or groceries in glass or
plastic bottles, cans or cartons.
Replace some or all of your meats, diary and
butter with nut and grain based foods (breads,
pastas and pulses such as soy and lentils) and
vegetable oils. To reduce packaging/ container
waste, consume home cooked food and home-
brewed drinks. Purchase products with minimal
packaging
5. How much do you throw in the bin?
Embodied fossil fuel
energy contained in the
waste we throw out and
methane from landfill
accounts for an average of
about 1.4t of emissions per
year for every Australian.
By reducing, reusing, recycling and composting
this figure can easily be halved.

7
Greenhouse gas
emissions per
passenger km for jet
aircraft travel are
about equal to one
person traveling in a
medium-sized car (30 kg CO2e per 100 km). A
passenger traveling on an average long-haul flight
by jet aircraft uses about 4 L per 100 km. (Boeing
website). However, in addition to CO2, aviation
turbine fuel burned in jet engines at high
temperatures produces, much higher levels of
nitrogen oxides (NO and NO2) than internal
combustion engines. These react in the upper
atmosphere to form ozone, a potent but short lived
greenhouse gas. Water vapor and a small amount
of soot are also produced from combustion of the
fuel and these form contrails, which in turn form
high ice clouds which also have a global warming
effect. The combined effect of ozone formation,
contrails and CO2 causes approximately 2.7 times
more global warming than the CO2 that would be
emitted by a car burning the same amount of fuel.
(Intergovernmental Panel on Climate Change,
1999, in www.rmi.org; Chooseclimate, 2002;
Climate Partners, 2002). Added to this are the
embodied emissions incurred in the building and
maintenance of the aircraft and airport facilities.
Business and first class seats take up 2-3 times the
space of economy class, therefore account for 2-3
times the emissions. ‘All economy’ configuration
can fit up to twice the number of passengers than
3 class configuration on the same type of aircraft.
Short-haul jet flights produce even more
emissions per km than long-haul flights, because
much more fuel is consumed on take-off, ascent
and landing than is used in level flight. Often,
short-haul plane flights are taken as a time saving
alternative to bus and train services to the same
destination. An economy return flight of 1,000 km
produces about 370 kg of emissions per person −
6 times more than by bus. Is a time saving of
several hours really worth this much more damage
to the atmosphere? When taking the bus or train,
more luggage can be carried, such as a bicycle or
camping gear to use on arrival. Sight-seeing can
be enjoyed en route and the service usually
terminates near the destination, eliminating airport
commuting and the resultant emissions.
Unfortunately, traveling by ocean liner incurs
even more emissions than jet aircraft. Budget
class liners emit about 34 kg CO2e per 100
passenger km. (About 10 % of this figure is the
embodied energy of the ship). Emissions from
luxury liners can be over twice this figure. The
main reason for the inefficiency of travel by ocean
liner is the huge mass – about 20-50 tonnes – of
ship that is required to transport every passenger.
@ote that shipping is the most efficient means of
transporting bulk products because only 1-2
tonnes of ship are required per tonne of freight.
• For land travel, go by bus or train rather than jet where possible . • Travel economy class – business or first class incur 2-3 times the emissions due to
greater space taken up. This applies to travel by aircraft, ocean liners and overnight trains. • Take fewer overseas trips and stay longer. For example, every economy return flight from
Sydney to the US or Europe not taken reduces your emission score by around 10 tonnes. • Calculate flight emissions before taking flights – about 0.27 t/ 1000 km for economy long-
haul economy and 0.38 t / 1000 km for short-haul. Use GHG-Energy Calc for quick calculation. Pay into a ‘Carbon Neutral’ program to offset your flight emissions (see section 7).
• Support introduction of a tax on jet fuel so users pay the real cost. Aviation fuel is currently tax exempt, so cheap air fares do not begin to cover the real environmental cost of flights.

8
Figure 3 Comparison of greenhouse gas emissions intensity of travel modes
Figure 4.
Figure 4
Transport emissions per passenger km
0
0.1
0.2
0.3
0.4
0.5
0.6
0.7
Short haul jet economy seat(<800 km)
Long haul jet economy seat
Med. Car, driver only, 20,000 km/yr
Bus (20 Passengers)
Emissions, kg CO2e/
passenger km
Fuel burnNOX/contrails athigh altitude
Fuel burn CO2
embodied
Return economy flight Sydney to Europe or USA, 34,000 km
1 PASSENGER , 10 TONNES CO2e; (20 t for business and 30t for first class)
Due to the extra global warming effect of nitrous oxides and contrails emitted in the upper atmosphere, jet emissions have 2-4 times more global warming effect** than the CO2 from the same amount of fuel used by a road vehicle.

9
Australians, like Americans seem to be addicted
to traveling in cars. Average car ownership is 600
per 1000 people and most households have two or
more cars. Through the 20th century, Australia
has developed with the automobile and our cities
have been designed around it. Most suburban
dwellers now live further than walking distance
from shops, services and work and habitually
drive to all these places. More than 80% of trips
are done by car and average car occupancy is only
1.2 persons. Although most Australians have
grown up with the car and see individual car use
as normal, this situation has only existed for about
60 years and is already unsustainable.
Car transport is the largest source of greenhouse
gases from Australian households. Added to this
is the fact that world demand for oil is projected
to ‘peak’ before 2010, after which demand for
limited oil will drive prices up. Even worse,
Australia’s crude oil reserves are projected to run
out in about 40 years (ABS, 2001).
We have to change our energy-hungry ‘car
culture’ This can be achieved by increasing our
uses of the more energy-efficient modes of travel,
such as bus, train, bike and shared car.
New technologies for hybrid, bio-fuel and
hydrogen-powered vehicles are ‘in the pipeline’.
However, many of these still use substantial
amounts of fossil fuels and both vehicle and fuel
costs are much higher than today’s cars.
Figure 5 illustrates greenhouse gases emitted by
existing commuting options. It shows that we can
continue to travel the same distances with only
10–20 % of the GHG emissions by simply
switching from ‘driver-only car’ to mass transit,
shared transport or ultra light-weight personal
transport. Table 2 shows dollar and GHG savings
from changing to more efficient transport modes.
The main problem today is the use of heavy
vehicles for transporting one or two people. One
person driving alone in a medium to large car as is
common in Australia today uses 9 to 15 litres of
fossil fuel, and emits 24 – 43 kg of greenhouse
gases for every100 km traveled.
To keep the per passenger fuel consumption to a
minimum, we need to travel in vehicles loaded to
their design capacity (Table 1). A useful ‘rule of
thumb’ for vehicle efficiency is a maximum 0.25
tonnes of vehicle weight for every passenger.
Table 1. Guide for efficient travel by motor vehicle
Vehicle Vehicle
weight
(tonne)
8o. of
passengers
Fuel
consumption,
L/100 km
Per passenger fuel
consumption, L /
100 km
Per passenger
emissions (kg
CO2e/100 km)
Bus
9 36 40 1.1 3.2
Moped bicycle
<25cc .03 1 1.2 1.2 5.5
Light car
.9 4 6 1.5 4.3
Large car
1.7 6 12 2.0 5.8
Motor cycle
250cc 0.15 1 3.5 3.5 10.1
10
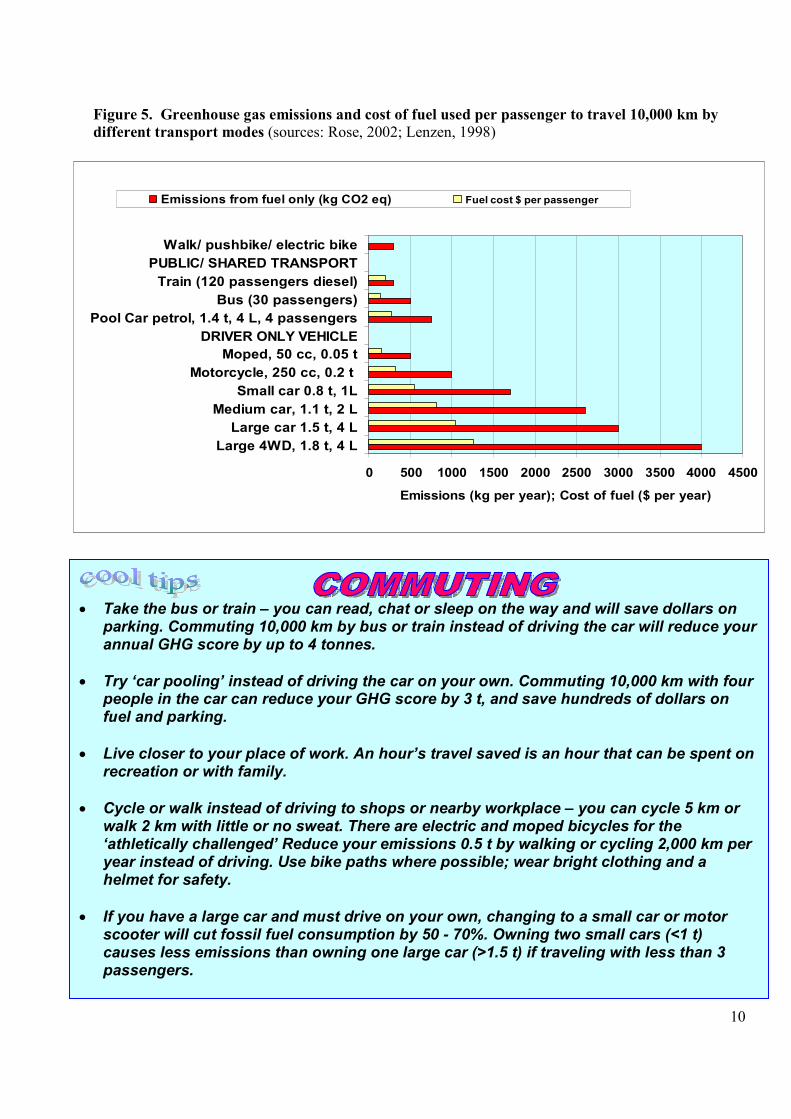
Figure 5. Greenhouse gas emissions and cost of fuel used per passenger to travel 10,000 km by
different transport modes (sources: Rose, 2002; Lenzen, 1998)
0 500 1000 1500 2000 2500 3000 3500 4000 4500
Large 4WD, 1.8 t, 4 L
Large car 1.5 t, 4 L
Medium car, 1.1 t, 2 L
Small car 0.8 t, 1L
Motorcycle, 250 cc, 0.2 t
Moped, 50 cc, 0.05 t
DRIVER ONLY VEHICLE
Pool Car petrol, 1.4 t, 4 L, 4 passengers
Bus (30 passengers)
Train (120 passengers diesel)
PUBLIC/ SHARED TRANSPORT
Walk/ pushbike/ electric bike
Emissions (kg per year); Cost of fuel ($ per year)
Emissions from fuel only (kg CO2 eq) Fuel cost $ per passenger
• Take the bus or train – you can read, chat or sleep on the way and will save dollars on
parking. Commuting 10,000 km by bus or train instead of driving the car will reduce your annual GHG score by up to 4 tonnes.
• Try ‘car pooling’ instead of driving the car on your own. Commuting 10,000 km with four
people in the car can reduce your GHG score by 3 t, and save hundreds of dollars on fuel and parking.
• Live closer to your place of work. An hour’s travel saved is an hour that can be spent on
recreation or with family. • Cycle or walk instead of driving to shops or nearby workplace – you can cycle 5 km or
walk 2 km with little or no sweat. There are electric and moped bicycles for the ‘athletically challenged’ Reduce your emissions 0.5 t by walking or cycling 2,000 km per year instead of driving. Use bike paths where possible; wear bright clothing and a helmet for safety.
• If you have a large car and must drive on your own, changing to a small car or motor
scooter will cut fossil fuel consumption by 50 - 70%. Owning two small cars (<1 t) causes less emissions than owning one large car (>1.5 t) if traveling with less than 3 passengers.

11
Table 2 Dollar and emissions savings from changing to more efficient transport mode (20,000 km)
Change from Change to Approx. Dollar savings,
for 1 year 20,000 km
CO2e emission
savings tCO2e
Bus or train
$9,500 5
Car with 5 occupants
sharing cost $8,800 4
Scooter 125 cc
$4,000 4
Large near new car,
driver only, cost
(including fuel, parking
at $18 per day and
depreciation) for 20,000
km = $11,000 Light car, hybrid or
small diesel, driver only $3,000 2 – 3
The only really effective way to reduce your
vehicle emissions is to select the lightest, most
fuel efficient model that you would use to at
least 50% capacity most of the time. Modern
petrol fuel injected vehicles of 1.0 to 1.6 litre
engine capacity and 0.8 to 1.0 tonne weight are
fuel efficient. These small models are the most
cost effective and lowest emitting option for most
families of up to 5 people.
Are diesel and LPG vehicles less polluting?
Diesels are used nearly all heavy load
applications, such as trucks and buses. Diesel
engines use up to 30 % less fuel than petrol
engines when used in large cars. Diesel is a higher
energy fuel than petrol and the engines are more
efficient. However CO2e emissions are only about
15% less because diesel has a higher emission
factor than petrol. Bio-diesel incurs about 50% of
the GHG emissions of diesel but the oil crop feed
stocks displace forests and food producing land,
making it a poor option environmentally All
diesels are generally worse for particulate
emissions (smoke), which can have negative
health effects.
LPG vehicles emit about 15% less CO2e than the
equivalent petrol vehicles and LPG is a cleaner
fuel. LPG has lower energy content than petrol, so
more is used per km, but it has a significantly
lower emission factor (Appendix 1). It is a cost
effective option for light commercial vehicles and
large cars such as taxis doing high mileage. The
increase in cost and weight over petrol models
offsets these benefits for smaller sized cars.
Diesels can be modified to run on up to 70%
compressed natural gas (CNG) Bus and truck
fleets and diesel power stations are increasingly
converting to this cheaper and cleaner fuel. CNG
vehicles are significantly cheaper to run as natural
gas is cheaper than diesel and the emissions
reduction is similar to LPG. Examples of cities
converting to CNG buses are New York and
Perth.

12
Figure 6. Fuel costs and emissions from traveling 10,000 km in petrol, diesel and LPG vehicles of the
same size and weight
$1,035$918
$689
1,1501,020
1,530
33303240
2870
0
500
1000
1500
2000
2500
3000
3500
petrol diesel gas
$ fuel cost @ 95c/L petrol/diesel;45c/L gas
Litres of fuel used for10,000 km
Kg of greenhousegas emissions for10,000 km
• The weight and size of the vehicle is the biggest factor affecting fuel consumption, for example, 0.75 tonne (4 seat) car with 1 litre engine – 5.5 L/ 100 km; 1.6 tonne (5 seat) car with 3.8 litre engine – 11 L/ 100 km.
• Select a vehicle of a size that you will use to more than 50% full capacity most of
the time and choose from the lightest, most fuel efficient models.
• If you need more room occasionally, hire a bigger vehicle or use a trailer.
• Going without a car also saves the embodied energy used and emissions resulting from manufacturing it –up to 1.2 tonnes GHG per year depending on the size of the car.
• LPG and diesel engines give up to 15% emissions savings over petrol for larger
vehicles.
• Remember that bus, train or bike are the least polluting and most sustainable ways to travel; use these where possible.
13
In addition to the energy and GHG emissions
from the fuel used by your cars, there are
embodied energy (EE) and emissions from their
manufacture and from construction and
maintenance of roads and parking lots. Embodied
emissions of cars typically amount to about ¼ of
the fuel emissions.
Making a vehicle last longer can reduce embodied
emissions, if the vehicle is fuel efficient.
However, replacing it with a new one that is even
10% more fuel efficient will reduce the per km
GHG emissions by more than would be saved by
keeping the old vehicle on the road. New vehicle
technologies may use more light- weight alloy and
plastic components, which have about 5 times
higher EE per kg than steel. However, the reduced
weight and improved fuel efficiency more than
offset the higher EE.
As a general rule, the embodied energy of new
cars currently on the market is proportional to the
size and weight of the vehicle. GHG-Energy Calc
assumes:
• CO2e from the manufacture of cars is
approximately 10.2 t CO2e per t weight of
vehicle. (Delucci et al, 2002)
• Embodied emissions are assumed to be
proportional to fuel consumption and
allocated per km over an assumed 225,000
km life.
• CO2e from road construction and
maintenance is 0.039 t / vehicle km
(Chester et al, 2005).
Obviously these are only indicative figures. In
real-life situations there will be significant
variations, depending on such factors as energy
sources and manufacturing plant efficiency.
Accurate comparisons between vehicle makes and
models will only be possible if LCA labeling is
introduced.
• Change to a lighter vehicle. The greater the weight of vehicles you own the greater will be the fuel consumption and the amount of embodied emissions you are responsible for. By changing from a heavy (1.8t) to a light (0.9t) vehicle, you will save 1.2 tonnes of embodied emissions in addition to about 3 tonnes of fuel emissions per year.
• Your vehicle(s) should be of a size that you will usually use to near full capacity. Plan all
trips so that the vehicle is at least 75% fully loaded.
• If you need a heavy vehicle or 4WD occasionally, hire one rather and owning it and using it for commuting. Don’t keep an old ‘fuel guzzler’ to save embodied emissions. You will reduce emissions much more by replacing it with a newer, smaller, more fuel efficient model.
• Consider doing without a car. This will cut your transport embodied emissions by more than
70%. Alternatives are using public transport and having a bicycle or moped. For the occasions that you still need a vehicle, hire one or join a car pool.
• Fit a tow hitch to your small car if you want to carry more luggage occasionally. Small cars
can carry much more than you think. A 1.3 litre 5-speed car will easily tow a 400 kg trailer at 90–100 km/hr in 4th gear. Traveling long distances in a lower gear and using higher revs will not damage modern engines.

14
GHG Emissions from the average home
(percent)
Appliances
, standby
power,
lighting
33%
Water
heating
29%
Home
heating/
cooling,
cooking
21%
Fridge/
freezer
17%
Home energy accounts for about 15% of the
average Australian domestic GHG emissions. On
average at least 50% of annual home energy use is
hot water heating and space heating / cooling
appliances. In colder southern or alpine areas,
home heating may be more than 3 times average
and in the tropics, air conditioning is by far the
greatest component of home energy use.
The main reason for the high emissions from
heating is that many homes still have electric
element hot water storage and space heaters.
Australian electricity is 75-80% generated by coal
fired power stations. Coal has the highest
emissions of any fossil fuel and electricity is only
about 30% efficient. Two thirds of the energy is
wasted as heat and transmission losses. On the
other hand, burning a cleaner heating fuel, such as
gas, directly in the heater or hot water system is
about 80% efficient.
In general, an electric element heating appliance
will emit about 6 times more GHG than gas than
an equivalent gas unit. Exceptions to this rule are
where electricity is generated by wind, hydro-
electric, solar, biomass or other renewable
sources. Reverse cycle air conditioners pump heat
into the room from outside with about 200-300%
efficiency, which to a degree offsets the
inefficiency of electricity generation. These are
the best option if ‘green power’ is available and
may be comparable to gas in some states but not
in Victoria, which has brown coal-fired electricity
1. PURCHASE ‘GREEN’ or ‘NATURAL’ POWER, to ensure that your power company will install more renewable energy generators to replace less coal-fired power stations.
2. Make sure you have an efficient GAS OR SOLAR HOT WATER SYSTEM and WATER SAVER SHOWER HEAD installed. Changing from electric to GAS OR SOLAR can reduce your GHG score by up to 4 t.
3. Make sure you have an efficient space heating system installed. Changing from electric element heaters to GAS, ELECTRIC HEAT PUMP or WOOD PELLET HEATER can reduce heating emissions by 70-80% or several tonnes for a typical southern Australian home. CAUTION : SMOKE FROM SOLID FUEL HEATERS IS A SERIOUS RESPIRITORY HEALTH HAZARD; KEEP FIRE BURNING BRIGHTLY AND NEVER CLOSE AIR SUPPLY.
4. Use ‘4 plus’ star rated appliances, no larger than the family needs. Heaters, air conditioners and refrigerators are the appliances that use the most energy in your home
5. Switch electronic appliances off at the power point when not in use; they draw 6-10 W
with the set turned off. Computers use 130 W even in ‘screen saver’ mode. Laptops with flat screens use about 30% as much power as large desktop computers. Large CR or plasma screens use several times more energy than small/ flat screens.
6. Change to energy efficient light bulbs. Replacing ten 75 W incandescent bulbs with 10 - 15 W compact fluorescents reduces annual GHG emissions by about 1.0t. Energy savings cover the cost of the bulbs in about 6 months.

15
Figure 7 Annual cost and greenhouse gas emissions calculated for an average household for a variety of
hot water systems (adapted from SEDO Western Australia, 2002)
Hot Water Systems
$2
$3
$14
$8
$6
$13
$5
$5
4.8
1.9
1.6
1.3
1.3
0.3
1.2
0.5
0 2 4 6 8 10 12 14
Electric - heat element
Solar, electric boosted, cool climate
3-star natural gas
5-star LPG bottle gas
5-star natural gas
Solar, electric boosted, warm climate
Solar, mains gas or wood boosted, cool climate
Solar, mains gas or wood boosted, warm climate
Emissions (t CO2 eq per year)/ Cost ($ per week)
Table 3. Cost savings from changing to a more efficient hot water system (for 200 L of hot water per day)
HOT WATER SYSTEMS
Existing lower
efficiency system
replaced
Energy
cost/ yr ($)
Capital
cost ($)
CHANGE TO High efficiency,
lower energy cost system
Energy
cost/ yr
($)
Capital
cost
($) *
Energy
savings
($/ year)
Payback
time*
(years)
5 star mains gas (constantflow)
$340 $800 $364 2.2
Solar- mains gas or ASA woodboost
$100 $900 $604 1.5
3 star mains gas (storage) $390 $800 $314 2.5
5 star LPG gas (constant flow) $660 $800 $44 18.2
Wood fired storage $150 $770 $554 1.4
Wood fired storage $150 $770 Solar- ASA wood boosted $60 $1,500 $90 16.7
5 star LPG gas(constant flow)
$660 $800Solar- mains gas or ASA woodboosted
$60 $1,500 $600 2.5
Electric element(constant flow)
$704 $5005 star mains gas (constantflow)
$340 $800 $364 2.2
*Cost of solar systems is after deduction of Government carbon credits
Electric elementstorage
$704 $700
@ote: Government rebate to replace electric element system and renewable energy certificates are subtracted
from cost of solar HWS.

16
Replacing an electric element hot water system with a solar (gas boosted is best), instantaneous gas or electric heat pump system is first priority for reducing emissions from water heating. GHG emissions will be reduced by 60-90%, with energy savings of up to $12 per week. Showering uses at least half of your hot water. With a standard ‘water waster’ shower head, most of the water is not used for warming your body, but goes straight down the drain. Install a ‘water saver’ shower head. It will reduce hot water flow from your shower from about 12- 14 L/ min to 3-6L/ min. This is 50 % less water to heat, which means 50% less energy and emissions. You can adjust the heater temperature, taps and shower head so your shower warms you just as well as with the ‘water waster’ head. Look for the energy star rating sticker on new hot water systems and select a system with four or more stars.
If coal fired electricity must be used for hot water heating, heat pump types are up to 3 times as efficient as the common heat element units, but still emit more GHG than gas or solar or wood.
Wood heaters can cause unacceptable smoke and methane pollution and are therefore not recommended. Boosting from an ASA standard wood or pellet heater is an option, provided that dry wood is always used; the fire is kept burning brightly and the air supply never closed off.
First priority – if you have electric element heaters, replace them with gas, wood pellet heater or, if electricity must be used, heat pump (reverse cycle air conditioners). This will reduce your heating emissions by 60-80%. Set heater thermostats at about 20 degrees C and put a jumper on before using the heater. Air conditioners particularly the large ducted units are big energy users. Running one of these takes 3-5 times more power than all of your other appliances combined. Only cool the room you are in. Set A/C thermostats at 25-27 degrees C and use fans instead on warm days. Place the heater or A/C as near as possible to the centre of the space to be heated.
By spending less than $2000 to retrofit your living rooms, you can save up to 40% on heating bills and be more energy efficient: Insulate ceilings, exterior walls and suspended floors. Install close-fitting, heavy curtains & pelmets. Fit draft seals to doors. These tips can prevent up to 40 % heat loss while keeping the house cooler in summer. ‘Solar heat’ your living rooms:
• Large, north-facing windows let in the winter sun, which is lower in the sky.
• Tiled concrete floors store solar heat in winter.
• Eaves, shutters, verandahs or solar pergolas, to shade out the summer sun.
• Minimize east and west facing windows to reduce summer heat gain.

17
Figure 8 Comparison of space heating options - $ per week and GHG emissions per year
(Source: adapted from SEDO Western Australia, 2002)
Home Heating
$3.77
$4.86
$5.43
$1.39
$5.59
$4.75
$1.83
$3.10
$2.80
1.7
0.7
0.6
0.3
3.1
2.6
1.0
0.6
0.5
0.0 1.0 2.0 3.0 4.0 5.0 6.0
Older wood stove in poor condition or open fire
Kerosene portable heater
LPG bottled gas portable heater
Wood ASA certified heater
FUEL HEATERS
Electric in-floor or radiant panel heaters
Electric portable/ heat element heaters
Electric reverse cycle air conditioner (heat pump)
Natural gas flued heater
Natural gas portable heater
MAINS GAS AND ELECTRIC HEATERS
$ COST per week GHG emissions, tonnes CO2eq per year
Table 4. Cost savings from changing to a more efficient home heating system (for 7,000 MJ per year)
Energy cost ($)
Capital cost
Energy cost ($)
Capital cost
Energy savings ($ peryear)
Pay-back time*(years)
ASA wood heater $72 $1,500 $218 4.1
Reverse cycle airconditioner, 2000W
$95 $2,000 $195 7.2
Portable heater mainsgas
$146 $1,000 $144 2.8
Portable gas heater(LPG gas)
$282 $700 $8 12.5
LPG gas heater $282 $1,000Equivalent ASA woodheater
$72 $1,500 $210 2.4
Old type stove orfireplace
$196 $1,000 ASA wood heater $72 $1,500 $124 4.0
* The table and graph on this brochure contain average figures for estimating purposes only. Consumers should refer to the energy star ratings andprices of particular appliances and consider suitability for their heating needs before purchasing.
Low efficiency heaters High efficiency heaters
Two 3,000W bar orradiant panel heaters
$290 $600
18
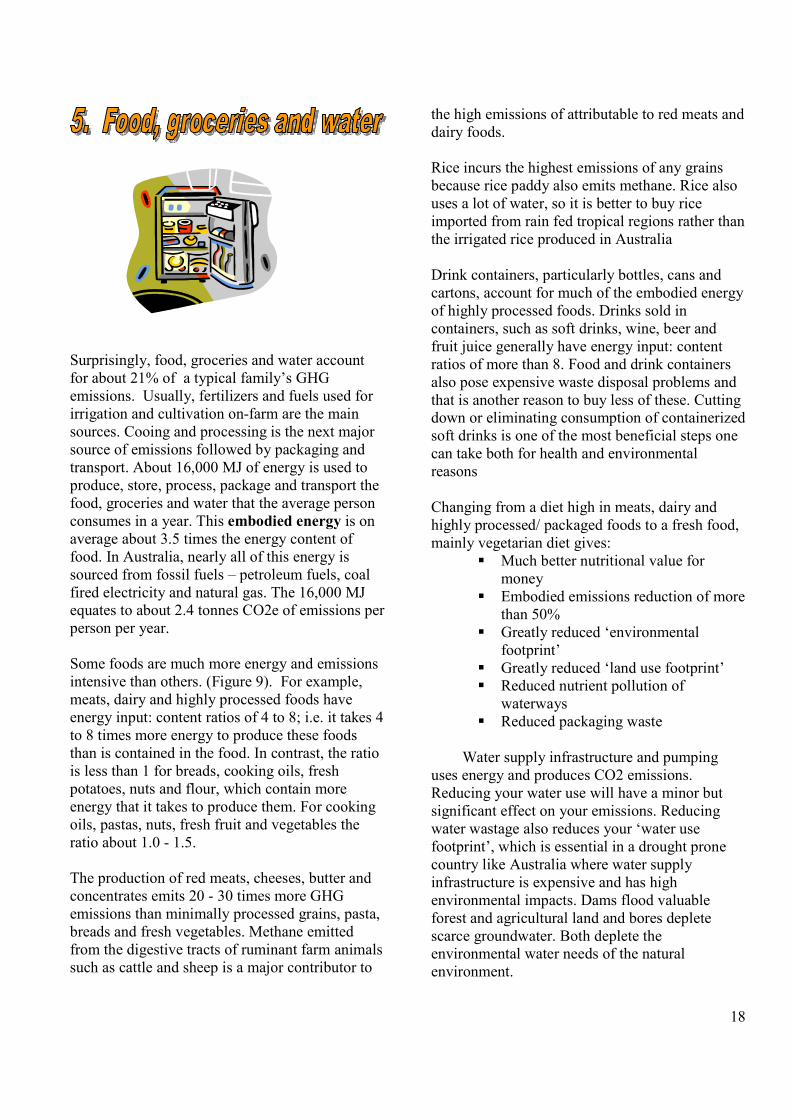
Surprisingly, food, groceries and water account
for about 21% of a typical family’s GHG
emissions. Usually, fertilizers and fuels used for
irrigation and cultivation on-farm are the main
sources. Cooing and processing is the next major
source of emissions followed by packaging and
transport. About 16,000 MJ of energy is used to
produce, store, process, package and transport the
food, groceries and water that the average person
consumes in a year. This embodied energy is on
average about 3.5 times the energy content of
food. In Australia, nearly all of this energy is
sourced from fossil fuels – petroleum fuels, coal
fired electricity and natural gas. The 16,000 MJ
equates to about 2.4 tonnes CO2e of emissions per
person per year.
Some foods are much more energy and emissions
intensive than others. (Figure 9). For example,
meats, dairy and highly processed foods have
energy input: content ratios of 4 to 8; i.e. it takes 4
to 8 times more energy to produce these foods
than is contained in the food. In contrast, the ratio
is less than 1 for breads, cooking oils, fresh
potatoes, nuts and flour, which contain more
energy that it takes to produce them. For cooking
oils, pastas, nuts, fresh fruit and vegetables the
ratio about 1.0 - 1.5.
The production of red meats, cheeses, butter and
concentrates emits 20 - 30 times more GHG
emissions than minimally processed grains, pasta,
breads and fresh vegetables. Methane emitted
from the digestive tracts of ruminant farm animals
such as cattle and sheep is a major contributor to
the high emissions of attributable to red meats and
dairy foods.
Rice incurs the highest emissions of any grains
because rice paddy also emits methane. Rice also
uses a lot of water, so it is better to buy rice
imported from rain fed tropical regions rather than
the irrigated rice produced in Australia
Drink containers, particularly bottles, cans and
cartons, account for much of the embodied energy
of highly processed foods. Drinks sold in
containers, such as soft drinks, wine, beer and
fruit juice generally have energy input: content
ratios of more than 8. Food and drink containers
also pose expensive waste disposal problems and
that is another reason to buy less of these. Cutting
down or eliminating consumption of containerized
soft drinks is one of the most beneficial steps one
can take both for health and environmental
reasons
Changing from a diet high in meats, dairy and
highly processed/ packaged foods to a fresh food,
mainly vegetarian diet gives:
� Much better nutritional value for
money
� Embodied emissions reduction of more
than 50%
� Greatly reduced ‘environmental
footprint’
� Greatly reduced ‘land use footprint’
� Reduced nutrient pollution of
waterways
� Reduced packaging waste
Water supply infrastructure and pumping
uses energy and produces CO2 emissions.
Reducing your water use will have a minor but
significant effect on your emissions. Reducing
water wastage also reduces your ‘water use
footprint’, which is essential in a drought prone
country like Australia where water supply
infrastructure is expensive and has high
environmental impacts. Dams flood valuable
forest and agricultural land and bores deplete
scarce groundwater. Both deplete the
environmental water needs of the natural
environment.

19
Figure 9 Greenhouse gas emissions from production, manufacture, packaging and transport of
food categories.
• Reduce your meat, cheese and butter consumption. Replace with nuts, eggs and
vegetable oils. Try some vegetarian or ‘low meat’ meals. This can reduce your emissions score by up to 1.5 t or more for an average family.
• Reduce consumption of canned and bottled drinks. Make coffee, tea, juices, wine and
beers at home and take a drink flask with you instead of buying canned or bottled drinks. This can reduce the GHG score of an average household by up to 1.3 t or more.
• Use fresh, minimally packaged foods, rather than frozen or canned products. Buy a
juicer to make fruit and vegetable drinks. It takes 5 minutes to make a litre of fresh juice.
• Purchase local in preference to imported food products. Transporting long distances,
particularly by air can add significantly to food energy inputs.
• Conserve water. Use a low volume shower head, use a front-loader washing machine. Replace lawn with native species, mulch your garden, replace sprinklers with drippers.
Kg CO2e per kg FOOD
Fresh local fruit – veg 0.6
Dried nuts/ fruit 2.4
Chicken 3.5
Red meat/cheese 13- - 20.0

20
Table 5. Example of dollar and emissions savings that could be made by a family of four by
changing from a diet high in animal products and processed packaged items to one high in fresh
local vegetable and grain based products. (Rose, 2007; Eckard, 2007; Karlsson Kanyama, 2002; AGO,
1999).
Potential Emissions and Dollar Savings From Food Purchases
Typical Australian Family of 4
* CO2e is all greenhouse emissions from production and manufacture, including CO2 from fossil fuel energy inputs, methane and nitrous oxides from agriculture
Replace 1 kg or 1 L of
$/kg or
L
Est.
CO2e*
/kg with 1 kg or 1L of
$/kg or
L
Est
CO2e* /
kg
Typical kg or
L replaced
weekly, family
of 4
saving per week
(kg CO2eq)
$ saving /
week
$
saving
/ year
COOL/ JUICE DRINKS(can/bot) 2 1.5
CUPS CORDIAL/ TEA/COFFEE 0.35 0.3 7 8.4 $12 $601
LAMB/ BEEF 15 14
BEANS, PASTA &sauce 5 3 3 33.0 $30 $1,560
BEEF 20 20 NUTS 12 3 1 17.0 $8 $416
BEEF 25 20 CHICKEN 8 4 2 32.0 $34 $1,768
MILKS interstate UHV 2.2 2 fresh local or soy milk 2 1.2 10 8.0 $2 $104
BUTTER 7 13 OLIVE OIL 12 4 0.5 4.5 -$3 -$130
CHEESE 10 13 NUTS 10 3 0.5 5.0 $0 $0
BEER OR WINE(bot/can/ctn) 3 2.5
HOME BREW BEEROR WINE 0.5 0.8 3 5.1 $8 $390
CANNED FRUIT/VEG 3 1.7
HOME COOKEDFRESH/DRIED 2 0.8 2 1.8 $2 $104
CANNED BEANS/PASTA 3 2.1
HOME COOKEDDRIED EQUIVALENT 1.5 1 2 2.2 $3 $156
BREAKFAST CEREAL(WHOLE GRAIN) 3.1 3.1
OAT/GRAIN PORRIDGE 2 1 0.5 1.1 $1 $29
BREAKFAST CEREAL(PROC.) 3.9 3.5 MUESLI 3 1.4 1 2.1 $1 $47
FROZEN VEG 7 1.6 FRESH VEG 5 0.6 3 3.0 $6 $312
35.5
123.2 $103
kg CO2e dollars
6.4 $5,356
t CO2e dollars
Copyright Ben Rose, July 2007. Contact [email protected] for permission to use this publication
TOTAL SAVING PER WEEK
TOTAL SAVING PER YEAR

21
Municipal Solid Waste (MSW) comprises
mainly food scraps, packaging, containers,
and discarded consumable items such as
newspapers and magazines. Australians on
average discard 71 kg of plastic and 184 kg of
paper products each year plus about 200 kg of
food scraps into kerb-side collection bins
(Waste Wise WA, 2002). This contributes to
greenhouse gas emissions in two ways:
1. Embodied emissions from fossil fuel
used to make the discarded materials. This
accounts for more than 80% of the total GHG
from waste.
2. Methane generation from anaerobic
decomposition of organics in landfill.
Woody garden waste is not included from the
calculations as it is essentially a non-
manufactured, renewable product and the fossil
fuel energy used to dispose of it would be
negligible compared to the other waste streams. It
is also assumed that very little garden waste is
buried in landfill and that no methane is generated
from it, as most municipal councils collect and
treat it separately by mulching or composting.
It is best to reduce and re-use, then finally re-
cycle the remaining waste. Recycling saves an
estimated 10% of emissions.
Table 6. Estimated average embodied energy and emissions of waste streams
Waste stream Average
embodied
energy, MJ/ kg
Average embodied
GHG emissions, kg
CO2-e/ kg waste)
Methane
emissions, kg
CO2-e/ kg waste
Organic- paper, cardboard, food scraps
to landfill
8 1.5 .3
Organic - paper, cardboard, food scraps
recycled or composted.
4.2 0.8 0
Inorganic - plastics, metals, glass, waste
to landfill
50 9.5 0
Inorganic - plastics, metals, glass
recycled or re-used.
16 3 0
Table 7. Embodied Energy of Virgin vs. Recycled Materials
Material Virgin MJ/kg Recycled MJ/kg
Aluminium 196 27
Polyethylene 98 56
PVC 65 29
Steel 40 18
Glass 30 13
Nylon(carpet) 120 32
Sources: Alcorn, 1998; Gregory et al, 1997
22
Recycled metal, plastic and paper materials have
significantly less embodied energy and emissions
than virgin materials (Table 7). The energy saved
is to some extent offset by the energy required to
collect and sort the recyclables but there is still a
net saving in energy and emissions. There are the
additional benefits of reducing landfill:
• Less methane emissions from organic waste
• Less impact on the environment
• Reduced dollar and land costs of landfill.
Methane emitted from landfill counts as GHG
emissions because it is produced from a man-
made source − anaerobic decomposition in
landfill. It would not have been produced if the
organic materials were decomposed or burned
aerobically.
Disposal of organic wastes by high temperature
incineration or aerobic composting produces carbon
dioxide, but it does not count as greenhouse
emissions as it is not from fossil sources. The CO2
taken up by the plants from which the organic
materials are made is cycled back into the
atmosphere, producing negligible net GHG
emissions. Although the energy contained in the
materials is wasted unless it is used as a source of
heating energy, high temperature incineration of
most wood and paper is preferable to disposal in
landfill.
Exceptions are CCA treated pine, particle board and
plastic wastes. Burning these materials is illegal as
toxic gases are emitted.
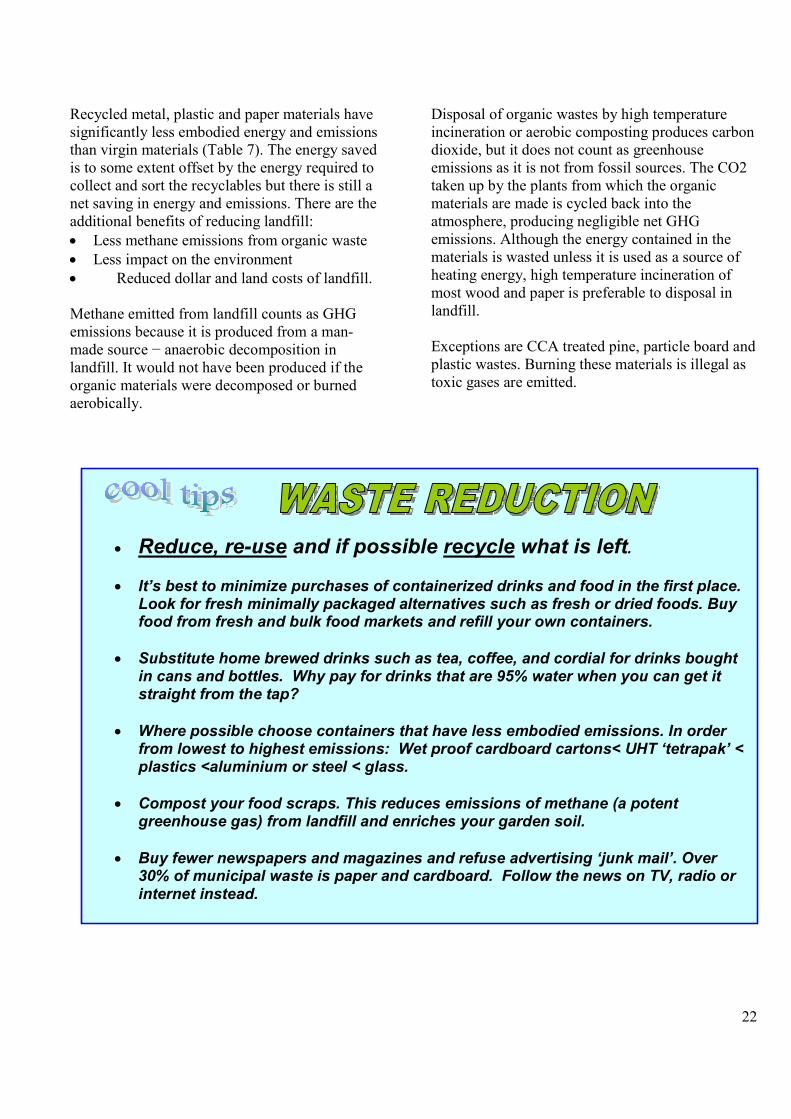
• Reduce, re-use and if possible recycle what is left.
• It’s best to minimize purchases of containerized drinks and food in the first place. Look for fresh minimally packaged alternatives such as fresh or dried foods. Buy food from fresh and bulk food markets and refill your own containers.
• Substitute home brewed drinks such as tea, coffee, and cordial for drinks bought
in cans and bottles. Why pay for drinks that are 95% water when you can get it straight from the tap?
• Where possible choose containers that have less embodied emissions. In order
from lowest to highest emissions: Wet proof cardboard cartons< UHT ‘tetrapak’ < plastics <aluminium or steel < glass.
• Compost your food scraps. This reduces emissions of methane (a potent
greenhouse gas) from landfill and enriches your garden soil.
• Buy fewer newspapers and magazines and refuse advertising ‘junk mail’. Over 30% of municipal waste is paper and cardboard. Follow the news on TV, radio or internet instead.

23
Embodied energy is the energy used to produce
the raw materials, process, manufacture,
package, transport, retail and maintain all of the
goods we acquire or consume.
Annualized embodied energy and emissions of
house contents and possessions are generally at
least as much as those from the house itself.
This is because houses have a lifetime of 60
years or more years whereas possessions such as
appliances and clothes may have a life of 5 – 20
years. Also, metals, plastics and textiles have
much higher embodied emissions per kilogram
than building materials.
Most embodied energy is provided by fossil
fuels in three main ways:
1. Use of fossil fuels as material feed-
stocks, e.g. coal is a feedstock for
making plastics and steel.
2. As direct energy sources, e.g. coal
and gas for heat; diesel for transport.
3. To generate the electricity used by
factories, wholesaling and retailing.
4. Fossil fuels – mainly coal and natural
gas – are the main fuels used in
power stations worldwide. Coal
generates 80% of the electricity used
in Australia.
The embodied fossil fuel energy results in
emissions of gaseous pollutants, termed
embodied emissions. Greenhouse gases –
mainly carbon dioxide and smaller amounts of
nitrous oxides, methane and hydrocarbons –
comprise the major, though invisible part of
these emissions. There are other pollutants, such
as sulphur dioxide, toxic gases, particulates
(smoke) and aerosols, emitted from
manufacturing processes but these are beyond the
scope of this publication.
Embodied energy used and emissions have been
calculated for some products by a process termed
Life Cycle Analysis (LCA). There is considerable
variation between different brands of a product
and between factories and production locations.
Some factors that influence embodied energy and
emissions are:
• type of fuel used in the power station
• efficiency of production technology
• transport distance.
Nevertheless, useful average embodied energy
and emissions can be estimated for foods and
goods, so long as qualifications are given as to the
production location, scale of production and the
variation that can be expected for that product.
For example, the embodied energy of bread made
in Australia in large bakeries can be between 6
and 10 MJ per kg. By comparison, the embodied
energy of cheese can be between 40 and 100 MJ
per kg, most of which is from the production of
the 10 L of milk required for every kg of cheese.
Although there is a large range for each product,
we can say that the embodied energy of cheeses
will always be at least five times (and can be up to
15 times) that of breads. @ote: Emissions from
dairy products are even higher as methane is
emitted by the digestive process of cattle.
A system of Life Cycle Analysis (LCA) labeling
is needed to inform consumers. If products were
labeled with their embodied energy (EE),
concerned consumers could consider EE in their
choice of products. The LCA label would have a
star rating or similar symbols, together with
embodied energy, GHG and other air emission
and water pollutant figures. A star labeling system
is already used successfully for the operational
energy efficiency of appliances. The LCA
labeling would enable consumers to make
purchasing decisions on the grounds of
environmental impact and motivate manufacturers
to provide ‘eco-friendly’ products.
24
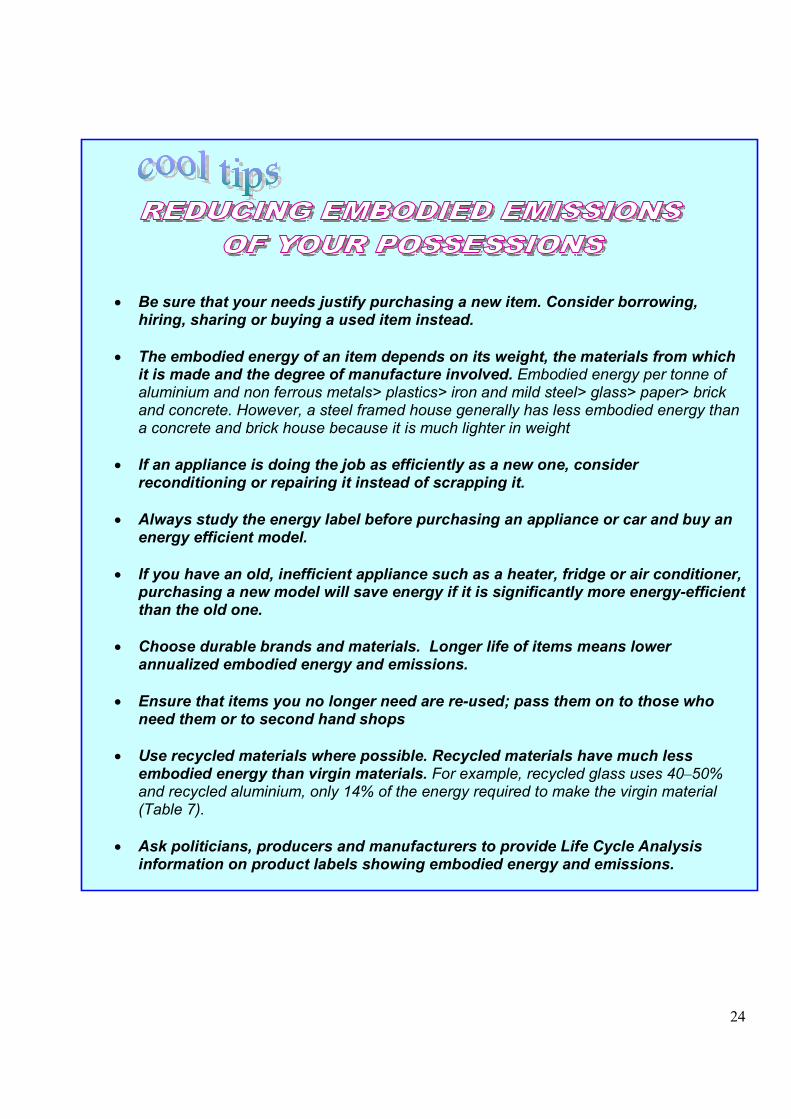
• Be sure that your needs justify purchasing a new item. Consider borrowing, hiring, sharing or buying a used item instead.
• The embodied energy of an item depends on its weight, the materials from which
it is made and the degree of manufacture involved. Embodied energy per tonne of aluminium and non ferrous metals> plastics> iron and mild steel> glass> paper> brick and concrete. However, a steel framed house generally has less embodied energy than a concrete and brick house because it is much lighter in weight
• If an appliance is doing the job as efficiently as a new one, consider
reconditioning or repairing it instead of scrapping it.
• Always study the energy label before purchasing an appliance or car and buy an energy efficient model.
• If you have an old, inefficient appliance such as a heater, fridge or air conditioner,
purchasing a new model will save energy if it is significantly more energy-efficient than the old one.
• Choose durable brands and materials. Longer life of items means lower
annualized embodied energy and emissions.
• Ensure that items you no longer need are re-used; pass them on to those who need them or to second hand shops
• Use recycled materials where possible. Recycled materials have much less
embodied energy than virgin materials. For example, recycled glass uses 40–50% and recycled aluminium, only 14% of the energy required to make the virgin material (Table 7).
• Ask politicians, producers and manufacturers to provide Life Cycle Analysis
information on product labels showing embodied energy and emissions.

25
The embodied energy and GHG emissions from
house construction and maintenance depends on
the type of construction. In general, lighter weight
framed construction has less EE than heavy
concrete and masonry, as shown in Table 3.1
below. Double brick / concrete construction
generally incurs about 50% more embodied CO2
emissions than an all timber house.
Table 8 Embodied emissions of housing (Source: Rose, 2009)
Construction type GHG emissions for 185 sq m house with
garage and pool (tonnes per year annualized)
Timber frame, floor and cladding, painted 1.2
Steel frame and roof, fibro-cement cladding concrete
floor painted 1.4
Timber frame, brick veneer, concrete floor unpainted 1.6
Double brick, concrete floor, unpainted 1.8
• When building a new home or extension: o Ensure that walls and ceiling are fully insulated during construction. It costs
less than retrofitting and will save thousands of dollars in energy bills. o Choose light-weight, strong components such as timber or light galvanized
steel frames and fibro-cement or colour-bond cladding where possible. o Consider using high performance glass and or double glazing. o Have the new home ‘passive solar’ designed.
• Is your house used to its capacity? The greatest energy inefficiency in housing is
under-utilization of space. A large home with few occupants means that each person uses more heating/ cooling energy and incurs more embodied energy.
• If you are a small family with a large house, consider moving into a smaller home or
unit, close to work and shops, and renting out the large home to a bigger family. • A home of energy efficient, light - weight, passive solar design, occupied to
capacity (30 sq m per person), can save over 50% on typical embodied energy per person for housing.
• Swimming pools and air conditioners use a lot of energy to run – avoid having
these or minimize size and usage. Evaporative A/C systems less than half of the energy of equivalent ducted heat pump and are suitable for most Australian cities where humidity is generally not excessive.

26
Joining a ‘carbon neutral’ (CN) program is a
way of offsetting your remaining emissions. The
CN organization calculates how many trees
need to be planted to offset your emissions and
you pay accordingly. Permanent tree plantations
or woodlots are planted, to fix the CO2 from
your fossil fuel energy consumption back into
wood, root mass and soil carbon produced by
leaf litter.
It must be stressed that ‘carbon offsetting’ is not
a ‘stand alone’ solution to the problem of
increasing atmospheric CO2 levels. For example,
if everyone in Western Australia was to have
trees planted to neutralize their emissions, the 5
million hectares or so that could reasonably be
planted would be all under trees in about 10
years.
Cutting down on emission intensive activities
and choosing cleaner technologies must be the
first priorities. Tree planting can ‘buy some
time’ while the world reduces its emissions.
Sites planted for carbon offsets must remain
under trees for perpetuity. It’s acceptable if the
trees are cut down for timber but they must be
re-established. In that way, the amount of wood
growing on a site can vary but an average
amount of CO2 fixed in wood, roots and soil on
that site can be estimated. If a site is cleared, the
fixed CO2 is released into the atmosphere and
the carbon sequestration is negated.
Carbon Neutral (CN) is a Western Australian
based program linked to the Men of the Trees
organization. You can go on-line (see below),
calculate your emissions using GHG-Energy
Calc and pay CN to offset your emissions by
planting trees.
CN tree plantings are highly commended for
many additional environmental and economic
benefits to current and future generations. Re-
establishing woodlots and tree belts on
agricultural land that has been over-cleared is
urgently needed for:
• Mitigating salinity
• Providing wood products
• Providing biomass for fuel and power
generation
• Wildlife habitat and biodiversity
• Reducing soil erosion.
• Improving soil health by increasing soil
carbon
• Carbon neutralizing your emissions is not a solution to global warming; the only solution is to reduce GHG emissions. However, it does ‘buy some time’ by compensating for your emissions by fixing carbon in permanent woodlots.
• First minimize your GHG emissions and then ‘carbon neutralize’ the remainder • Join a Carbon Neutral Program. For a cost of about $50–$200, depending on your GHG
emissions, about 20–80 trees are permanently established to neutralize your CO2 for that year. The website for Carbon Neutral is http://www.carbonneutral.com.au
• Plant trees on your own land or as a volunteer for a tree planting group.

27
GHG-Energy Calc is a user-friendly calculator,
easily downloaded from ghgenergycalc.com.au).
It is two calculators in one; you only have to
type in consumption figures once. Clicking a
button near the top right hand corner of the
screen switches between energy and emissions
results. It gives instant results for 7 categories of
consumption on the one screen: air and sea
travel, private vehicles, public transport,
electricity, other fuels and food/groceries and
housing/possessions. Results are shown in kWh
of energy per year, tonnes CO2e per year and
percentages in each category. Annual fuel cost
is also calculated. The Calculator works on three
simple principles:
1. All energy sources, whether electrical or
fuel, have an energy content that can be
expressed as kWh per unit of electricity or
kilograms of fuel.
2. Likewise, every energy source has a
greenhouse gas emission factor, which can
be expressed as kg of carbon dioxide
equivalents (CO2e) per unit of electricity
or kilogram of fuel.
3. Every consumer product – food,
consumables, vehicles, housing and other
possessions – has embodied energy and
emissions, which can be expressed as kWh
of energy and kg of CO2e respectively, per
unit weight or volume of the item. Public
transport is also a consumer product and
can be attributed an energy intensity in
kWh/ passenger km and emission intensity
in kg CO2e / passenger km.
How GHG-Energy Calc works
The Energy Calculator uses energy content factors
to calculate energy used and emission factors to
calculate greenhouse gas emissions.
The factors are taken directly from Australian
Department of Climate Change Factors and
Methods workbook and are listed in the
Appendix. Embodied energy and emissions of
consumer goods are estimates derived from
various sources (see references), most of which
are available on the Internet. Details are explained
in the background paper (Rose, 2009), which can
be downloaded from this website.
Want to know your GHG emissions and energy use? You can use GHG-Energy Calc
• Go to http://www.ghgenergycalc.com.au
• Click on Greenhouse Calculator and download it. The files are about 600 KB and can be downloaded and extracted in a less than 2 minutes.
• Use GHG-Energy Calc to do your own energy and greenhouse emissions audits.
You only need to fill in your data once (it only takes 10-20 minutes). It will instantly show energy and emissions for your transport, electricity/gas, food/groceries/water, housing and possessions, all on the one screen.

28
Figure 10 GHG-Energy Calc, showing results for a typical 3 person Australian household.

29
APPE8DIX 1
Table A1. Energy and greenhouse gas emission factors for electricity and fuels.
(source: adapted from Australian Greenhouse Office, 2002)
Energy source or consumer item Energy content Energy Units Emission factor GHG Units (CO2e)
Coal fired electricity 3.6 MJ/unit 1.05 Kg /unit
‘Green’ or renewable electricity 3.6 MJ/unit 0.129 Kg /unit
Mains gas 53.6 MJ/kg 3.43 Kg /kg fuel
LPG 49.5 MJ/kg 3.59 Kg /kg fuel
Wood burned in ASA standard heater 14 MJ/kg 0.25-0.47 Kg /kg fuel
Wood burned in open fire or old stove 14 MJ/kg 0.84 Kg /kg fuel
Petrol 34.2 MJ/L 2.89 Kg / L
Diesel 38.6 MJ/L 3.18 Kg / L
LPG (automotive) 25.7 MJ/L 1.86 Kg / L
Aviation turbine fuel 36.8 MJ/L 3.03 Kg / L
Table A4. Global Warming Potential (GWP) for 8 categories of foods, used in the GHG-Energy-Calculator. (Rose, 2007,
unpublished)
Food class Energy inputs -
lower (MJ/kg)
Energy
inputs -
higher
(MJ/kg)
Average
EI
energy
input
MJ/kg
(a)
Methane,
8ox
emissions
(kg CO2e
/ kg
product *
Emission
s from
energy,
lower, kg
CO2/kg
food =
Emissio
ns from
energy
higher,
kg
CO2/kg
Average
totlal
emissions kg
CO2e/kg
L1- Fresh/minimally processed. Fresh fruit/veg, grains, flour, rolled
oats
3 10 6.5 0 0.285 0.95 0.6
L2 - Pasta, biscuits, rice, muesli, pulses, soy products, canned/bottled
cool/juice drinks, cakes, breads11 20 15.5 0 1.045 1.9 1.5
M1 Milks (dairy and soy)
6 10 8 0.7 0.57 0.95 1.5
M2 - Processed containerised foods. Canned/bottled/frozen fruit/veg,
dried fruits/nuts, sugar, beer, breakfast cereals, honey, soaps, papers,
eggs, pastries
21 30 25.5 0 1.995 2.85 2.4
MH1 - Chicken meat, chocolates, wine, jam, potato chips, cooking oil,
margarine, tea/herbs, ground coffee. Dairy – yoghurts, icecreams
custards
30 44 37 0 2.85 4.18 3.9
H1 - Soup powders, instant coffee, spirits; pork, fish, detergents, soap,
shampoo, disposable nappies
45 120 82.5 0 4.275 11.4 7.8
H2 - Red meats (lamb and other ruminants), Dairy -
cheese/butter/cream/milk powders44 90 67 6.4 4.18 8.55 13
H3 Beef44 90 67 9 4.18 8.55 20

30
APPE8DIX 2
Embodied emission factors for goods
Embodied energy and emission factors are difficult to estimate because production systems are complex
and often use energy from several sources. For simplicity, three emission factors have been derived for
use in GHG-Energy Calc as follows:
Manufactured goods 0.12 kg CO2e/ MJ
Foods 0.095 kg CO2e/ MJ
Building materials 0.092 kg CO2e/ MJ
Source: Rose, 2009
REFERE8CES
1. AGO, 1999."End Use Allocation of Emissions" report
2. AGO, 2002. Australia’s @ational Greenhouse Inventory. Appendices A, B.
www.greenhouse.gov.au/inventory/inventory/natinv/method.html
3. Alcorn, A., 1998. In ATLA News, issue 7 no 4, Nov 1998 http://www.converge.org.nz/atla/new-11-98-p4.html 4. Alinta Gas, 2002. Energy invoice.
5. Australian Bureau of Statistics (ABS), 2001. Year Book Australia 2001.
6. Australian Greenhouse Office, 2002. Factors and Methods workbook.
7. Australian Greenhouse Office, 2002. Energy Fact Sheet, 2002. www.greenhouse.gov.au
8. Chooseclimate, 2002. Into the Sky: Aircraft Emissions of Greenhouse Gases, 2002.
http:/www.chooseclimate.org/flying/emit.html
9. Climate Partners, 2002. Greenhouse gas emissions from air travel. www.climatepartners
10. CSIRO, 2002. CSIRO Solutions for Greenhouse. www.csiro.au/csiro/ghsolutions/s4.html
11. CSIRO, 2001. Climate Change Projections for Australia.
www.dar.csiro.au/information/greenhouse.html
12. Eckard, R. University of Melbourne, DPI Victoria, 2007. Greenhouse accounting decision support
Framework calculators for beef, sheep and dairy
13. EPA NSW, 1997. @SW SoE 97 CH 5 Waste Generation and Disposal www.wastenews.com
14. Geocities, 2002. Monetization of Environmental Impacts on Roads.
http://www.geocities.com/davefergus/transportation/3chap3/htm .
15. Glover, J., 2001. Which is Better? Steel, Concrete or Wood: A Comparison of Assessments on Three
Building Materials in the Housing Sector. www.boralgreen.net.au/researchch3/chap6.htm
16. Gregory, A., Keolian, G, Kar, K, Manion, M., Bulkley, W, 1997. Industrial Ecology of the Automobile-
A Lifestyle Perspective. http://www.sustainable-busforum.org/bldgmat.html.
17. Institute of Lifecycle Analysis, 1998. Automobiles: Manufacture vs. Use.
http://www.ilea.org/lcas/macleanlave1998.html
18. Intergovernmental Panel on Climate Change, 1999, quoted in: Rocky Mountain Institute, 1999.
Climate- Air Travel Emissions. www.rmi.org/sitepage/pid600.php
19. Lawson, WR, 1996. Timber in Building Construction: Ecological Implications.
20. Lenzen, M., 1999. Total Requirements of Energy and Greenhouse Gases for Australian Transport.
Transportation Research, Vol 4 No 4, July 1999.

31
21. Leopold Centre for Sustainable Agriculture, 2001. Food Fuel and Freeways.
www.ag.iastate.edu/centres/leopold
22. Pullen, SF, 1999. Consideration of Environmental Issues when Renewing Facilities and Infrastructure.
Conf. paper. http://ausnet.rmit.au/papers/8dbmc
23. Rose, B.J., 2009. GHG- Energy Calc – Background Paper. http:/www.ghgenergycalc.com.au
24. Sustain/Elm Farm Research Centre, 2001. Eating Oil- Food in a Changing Climate.
25. Sustainable Energy Development Office WA, 2002. Home Heating- Running costs and Greenhouse Gas
Emissions.
26. US Dept of Environment, 2002. Energy Efficiency Report. www.eia.doe.gov
27. US Environmental Protection Agency Office of Solid Waste and Emergency Response, 1998.
Greenhouse gas Emissions from Management of Selected Materials in Municipal Solid Waste.
28. Vale, R. and Pritchard, M., 2001. An Analysis of the Environmental Impact of Food Production.
http://evworld.com/databases/storybuilder.cfm?storyid=193
29. Victoria Transport Institute, 2000. Transport Cost and Benefit Analysis – Resource Consumption
External Costs. www.vtpi.org
30. Waste Net, 2002. Municipal Solid waste.
31. Waste Wise W.A., 2002. Fact sheets: Plastic. Paper. Steel.
32. Western Power, 2002. Energy invoice.
33. Carlsson-Kanyama, A and Faist, M., 2000. 'Energy Use in the Food Sector, a Data Survey….Appendix
6: Food processing and food preparation' (compilation from various sources). FMS Environmental
Strategies Research Group, Stockholm University.
34. FAO "Livestock-environment initiative- Fossil fuels component".
www.fao.org/WAIRDOCS/LEAD/X6100E/fossil.pdf
35. Carlsson-Kanyama et al, 2002 (Swedish figures for product in supermarkets- includes wholesale/retail).
36. Dept of Agriculture WA crop budgeting handbooks.
37. Benders, R., Wilting, Kramer and Moll, 2001. 'Description and Application of the EAP. Computer
Program for Calculating Life Cycle Energy Use.
38. MAF, NZ. 'Total Energy Indicators of Agricultural Sustainability: Dairy Farming Case Study.'
39. Wilting, H., 1998. 'An Energy Perspective on Economic Activities'.
Related Documents

![Greenhouse Gas Emissions and Emissions Trading in North … · 2020. 2. 23. · 2002] Stephenson-Greenhouse Gas Emissions, Kyoto and U.S. Response 45 greenhouse gas molecules. This](https://static.cupdf.com/doc/110x72/60facf56e286b02f9b10de99/greenhouse-gas-emissions-and-emissions-trading-in-north-2020-2-23-2002-stephenson-greenhouse.jpg)


