How Thinking About Data Affects Mapping! (Cartography!) Alireza Karduni

How Thinking About Data Affects Mapping!
Jul 14, 2015
Welcome message from author
This document is posted to help you gain knowledge. Please leave a comment to let me know what you think about it! Share it to your friends and learn new things together.
Transcript

How Thinking About Data
Affects Mapping!(Cartography!)
Alireza Karduni

• Every mapping has a purpose!
• The purpose is to communicate!
• Communicate information!
• Geographical, Social, Population, …
A Story!

• We wanted to map how persons with disability move in urban areas.
• We wanted to map their TRIP PATTERNS (Trips, Destinations, home, work, etc)
• So we gave a number of them GPS devices
• The device recorded their location every 5 seconds.
• After a while, We got the device back
A Story!

• This is what we got back.
A story!!

• This is what we got back.
• Tables with more that 100,000 GPS points for each person
• With :
• Coordinates (location)
• Speed
• Headings (direction)
• Date
• Time ( when the data was recorded)
A story!!

• Now using only this data we want to make meaningful maps that serve our purpose.
A story!!

• We used Lat/Long information to make a point map of all GPS data!
Location!

• We projected the data to be able to use the base imagery!
• Imagery is a kind of data:
• We can change the tone and color to make the map more legible
Base Map!

• Imagery is a kind of data:
• We can change the tone and color to make the map more legible
• Did it serve our purpose well?
• Not really!
Base Map!

• Looking at parts of the data makes it easier to see patterns in the subjects trip.
• Now we can almost see the difference between his trips and destinations
Part of the data

• Does the point sizes matter?
• Yes it does !
• Does it make my map serve my purpose better ?
• I guess not!
Size!

• We can make lines out of our points.
• Is it better?
• Trips ?
• Destinations ?
Two points make a line

• Line Thickness makes a difference
• Same questions should be asked everytime!
Two points make a line

• Line Thickness makes a difference
• Same questions should be asked everytime!
Two points make a line
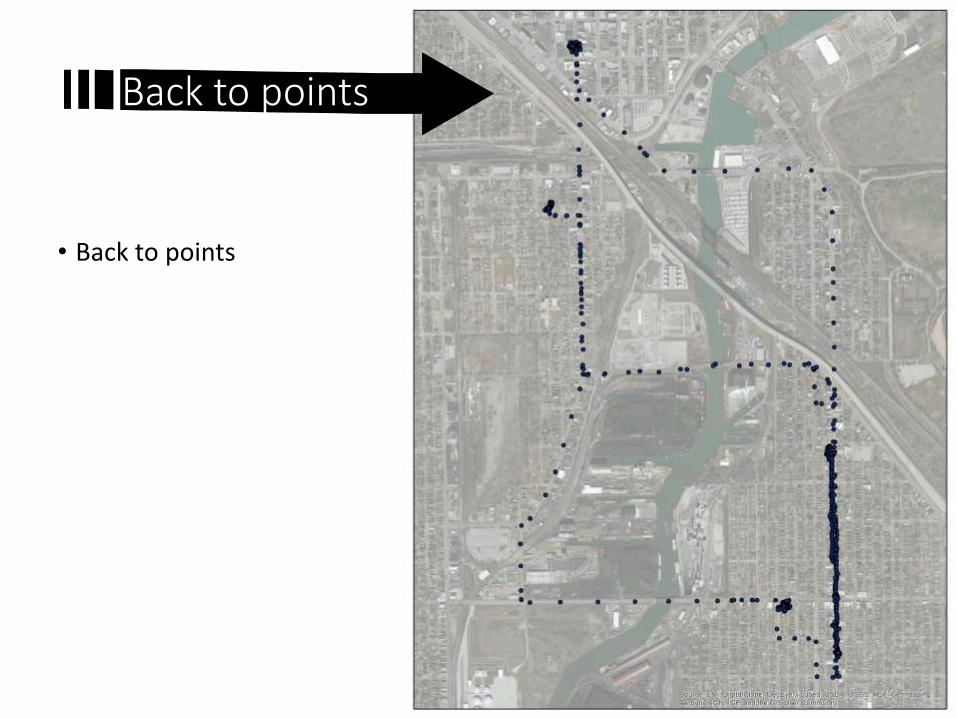
• Back to points
Back to points

• We can calculate point density using each points location.
Back to points

• What does it mean?
Back to points

• Make a map that colors the point based on the speed.
Speed?

• What does it mean?
• Inaccuracy always exists!
• Keep that in mind!
Speed?

• The locations are not accurate
• Can we use this fact for our purpose?
• Yes!
Inaccuracy?

• We have the direction for each point
• We can map it!
• But data is inaccurate!
Headings!

• When the subject goes inside a buildings the point go crazy
• The headings get really inaccurate!
• Can we use that to our own benefit?
Headings!

• When the subject goes inside a buildings the point go crazy
• The headings get really inaccurate!
• Can we use that to our own benefit?
Headings!

• We put the headings in 8 different categories
• N , NW , E , NE , ….
• Then counted how many different categories were in a 150 feet radius around each point
• If there is 8 different categories ! It means it is a inaccurate
• when does it get in accurate?
Headings!

• What does it mean?
Headings!

• After thinking about different ways to think about the data,
• And how to present them
• And what their meaning is
• We can decide which one serves our purpose better
Think about your data

•The best map is not always the easiest map to make!•The best map is not always the most complicated map!
DATA!

Thanks!
Related Documents