FACULDADE DE ECONOMIA PROGRAMA DE PÓS-GRADUAÇÃO EM ECONOMIA APLICADA HOW THE STOCHASTIC PROBLEM DRIVES THE BRAZILIAN ELECTRICITY SECTOR Pedro Guilherme Costa Ferreira Reinaldo Castro Souza Fernando Luiz Cyrino Oliveira TD. 010/2012 Programa de Pós-Graduação em Economia Aplicada - FE/UFJF Juiz de Fora 2012

Welcome message from author
This document is posted to help you gain knowledge. Please leave a comment to let me know what you think about it! Share it to your friends and learn new things together.
Transcript

FACULDADE DE ECONOMIA PROGRAMA DE PÓS-GRADUAÇÃO EM ECONOMIA APLICADA
HOW THE STOCHASTIC PROBLEM
DRIVES THE BRAZILIAN
ELECTRICITY SECTOR
Pedro Guilherme Costa Ferreira
Reinaldo Castro Souza
Fernando Luiz Cyrino Oliveira
TD. 010/2012
Programa de Pós-Graduação em Economia
Aplicada - FE/UFJF
Juiz de Fora
2012

HOW THE STOCHASTIC PROBLEM DRIVES THE BRAZILIAN ELECTRICITY
SECTOR
Pedro Guilherme Costa Ferreira, PhD Candidate
Electric EngineeringDepartment, PUC-RIO, Rio de Janeiro, Brazil
Reinaldo Castro Souza, PhD
Electric EngineeringDepartment, PUC-RIO, Rio de Janeiro, Brazil
Fernando Luiz Cyrino Oliveira, PhD Candidate
Electric Engineering Department, PUC-RIO, Rio de Janeiro, Brazil
Abstract:The Brazilian Electricity Sector (BES for short) is the ninth biggest in the world in
terms of electrical energy generation. In 2011, the generation, distribution and transmission
sectors had together (an income statement) a revenue of approximately USD 8.3 billion;
currently, electricity reaches more than 99% of the Brazilian houses. Brazil has approximately
90% of its energy supplied by hydroelectric plants. One of the main characteristics of the
generation systems that have hydraulic predominance is the strong dependence on the
hydrological regimes. Thus, this paper aims to show that the stochasticity verified in the
uncertainty related to the affluences is associated to the three fundamental activities of BES:
expansion planning, operation planning and energy Spot Price. In other words, the energy
synthetic series are crucial to determine which is the best way to operate the sector, providing
support to decisions on when it should, or not, happen an expansion, avoiding, unnecessary costs
and/or losses to the system. Finally, the paper presents the periodic autoregressive model, a
particular structure of the Box & Jenkins family, denoted by PAR (p), employed to model the
series of hydrological streamflow used for estimating the operational costs of the Brazilian hydro-
thermal optimal dispatch.
Key words: Brazilian Electricity Sector, stochasticity, operation planning, expansion planning;
energy spot price.

HOW THE STOCHASTIC PROBLEM DRIVES THE BRAZILIAN ELECTRICITY
SECTOR
1. Introduction
Brazilian Electricity Sector (BES) is the ninth biggest in the world in terms of energetic
generation, producing approximately 470 TWh(OECD, 2012). In 2011, the generation,
distribution and transmission sectors had together a revenueof about USD 8.3 billion (ABINEE,
2012); currently, electricity reaches more than 99% of the Brazilian houses.
To the quadrennial 2011-2014, it is estimated that the investments in the Electricity sector will
reach USD 56 billion (PAC, 2012), the second largest in relation to the investments among the
infrastructure sectors. The National Development Bank (BancoNacional de Desenvolvimento,
BNDES) is planning to invest about USD 34 billion in the sector, which is 10% of its whole
investment in this quadrennial(BNDES, 2012).
Besides the considerable economical wealthy of the BES, due to a historical use of the natural
resources for the electrical energy generation, it was also developed the interconnection of the
national grid (SIN for short). The continental size of the SIN allows that the energy generated at
any region, may the consumed by users at different regions. By interconnecting the regions, the
SIN allows a better use of the natural resources. As a consequence, the resulting system (BES)
has a huge dimension, very complex and requires computational tools to give support on the
operational planning of the SIN.
Then, in this context, Brazil has a system that involves billions of dollarsin generation,
distribution and transmission. This system is eminently hydraulic, nationally interconnected, and
mixed in terms of investments (that is, it combines public and private companies); and it also has,
in terms of market structure, monopolies, mainly in the transmission area, and big oligopolies, in
the areas of generation, distribution and transmission. This situation brings up a series of
problems and challenges that require processes of decision making in different time horizons,
long term (5 to 10 years – probability of future energy storage, expected value of the future costs
of the thermal generation etc), medium term (5 to 1 year – yearly contracts for the peak hours
expected demand etc.) and short term (up to 1 year – control of the energy flow, hourly dispatch
etc).
Such problems have different dimensions and are related to decision-makings directly linked to
the three pillars that support the BES: expansion planning; operation planning; and accounting
and settlement process of the energy transactions in the short term market. These functions are
developed by the Energy Research Center (Empresa de PesquisaEnergética, EPE), Electric
System National Operator (OperadorNacional do Sistema, ONS) and Board of Trade of
Electricity Energy (Câmara de Comercialização de EnergiaElétrica, CCEE).
From this overview, some questions arise naturally: how much energy should be generated
considering the hydraulic and the thermal possibilities? Which is the right moment to save water
and to use fossil fuels? Should it be an investment towards enlarging the system’s capacity, or is
it time to save and wait for a future moment with a bigger expansion? Which should be the short
term energy price, in order to pay all the production factors and to observe the tariff
moderateness?
These are some of the daily questions in the Brazilian Electricity Sector and the answers to them
are far from trivial. They all involve a comprehensive planning and a synchronized management.
Nevertheless, there is a common feature that connects the electricity sector’s three pillars which
is the stochasticity associated to the expansion planning, operation planning and Energy spot
price.

In order to carry out the expansion and operational planning and estimate the short term energy
price, BES opted for the use of a chain of computer modules, that has the property that as the
planning lead time reduces, the uncertainty representations also reduce, while the representation
of the physical characteristics increases (Maceiraet. al., 2012). The highest planning horizon
module of this chain is known as NEWAVE(CEPEL, 2011a). In this program, the optimal
strategy, i.e., the optimal share between the hydro and the thermal generation is obtained by a
stochastic optimization procedure that uses the Stochastic Dual Dynamic Programming (SDDP),
which determines the future costs function (FCF) that is used in the coupling process of the other
modules of the chain of computer programs;
Such optimization process has as the unique stochastic process the natural inflow of energyi
(NIE, for short), which is artificially generated by a Periodic Autoregressive model (PAR(p) for
short), whose hyperparameters are adjusted by the available historical values. One important
point must be emphasized; in order to avoid undesirable negative values for the simulated NIE,
the PAR(p) adopted within the BES structure, assumed a Log-Normal distribution for the model
residuals in the Monte Carlo generation of the artificial NIE series.
The expansion and operational planning used in the BES has been questioned in the latest years,
due to its lack of efficiency in the correct representation of the scenarios produced by the
simulated NIE series, producing distortions on the energy prices, especially on the difference
liquidity prices (DLP for short), which is used by the official bodies to compensate on price
differences at the moment of the energy trades. As an example of that, in June 2010 the Brazilian
regulator (ANEEL) put forward a determination (determination # 2654 of 24/06/2010) whereby
the forecasts of the inflows produced by the Monthly Operational Program (MOP) should be
reviewed, as, in some weeks, the estimated DLP presented substantial increases and, in others,
substantial decreases.
As one can see and it will be reinforced throughout the article, the evidence of the stochasticity
present in the three pillars of the BES is unquestionable, it is clear that the crucial element in this
context are the generation of the simulated NIE scenarios, produced by PAR(p) structures (one
for each month of the year). From them, the spot prices are generated and the decisions on the
operation and expansion policies of the sector are taken.
With these ideas in mind, the main task of this article is to clarify the relationship:
“stochasticity” vs“brazilian electricity sector”, by showing the stochastic model adopted and
raise methodological questions that are peculiar to the BES. Such questions may explain the
problem mentioned above concerning the inconsistency of the energy spot price.
To achieve this goal, the remaining paper is divided in three sections following this introduction.
Section 2, entitled “The relationship between the stochasticity and the BES” brings up thedetails
of the sector, identifying the relations among the three fundamental pillars mentioned and the
stochasticity. It is followed by section 3, where the PAR(p) model, which is the stochastic model
adopted by BES is described and discussed. Finally, the last section (section 4) is dedicated to
some concluding remarks.
2. The relationship betweenStochasticity and the Brazilian Electricity Sector
During the nineties and the beginning of the years 2000, some important reforms were carried out
in the Brazilian Electricity Sector ((Fernandeset. al., 2005); (Carpio & Pereira Jr, 2006)). After
the 2003 reform, the Central Government defined a complex and consistent set of official agents
with well defined tasks and competences, aiming three basic objectives: cheap tariffs, reliable
energy supply system and universality of the distribution of energy(Tolmasquim, 2011).
Following these reforms, the energy sector agents can be classified into three levels, following
their juridical nature and their institutional competences. They are; those that execute government

activities; those that perform regulatory activities, and those rerlated to private law entities that
run special activities.
Government activities are conducted by the National Council for Energy Policy
(ConselhoNacional de PolíticaEnergética, CNPE), the Ministry of Mines and Energy (Ministério
de Minas e Energia,MME) and by the Electricity Sector Monitoring Committee (Comitê de
Monitoramento do SetorElétrico, CMSE). The regulation activities are conducted by the
Brazilian Electricity Regulatory Agency (AgênciaNacional de EnergiaElétrica, ANEEL). Private
entities conduct the technical activities: medium and long term sectoral planning(EPE), feasibility
of trading activities (CCEE) and National Interconnected System coordination (ONS). Figure (1)
presents the relationship among the institutional agents.Asalready highlightedin this
paperanddiscussedin the following sections, the stochasticitydirectly interferesin the activities
ofEPE, ONSandCCEEthrough the generation of synthetic series of NIE.
The next step of this study is to show how operational entities, with different purposes, are
connected to the stochasticity associated with NEWAVE module, which supports the expansion
planning (EPE), the operation of the system (ONS) and the price of short-term energy (CCEE). CNPE
National Council for Energy Policy
MME
Ministry of Mines and Energy
CMSE
Electricity Sector MonitoringCommittee
ANEEL
Brazilian Electricity RegulatoryAgency
EPE
Energetic Research Center
CCEE
Board of Trade of Electricity
Energy
ONS
NationalNetwork Operator
GovermmentalActivities RegulatoryActivities Private Entities Activities Figure 1– Electrical Sector’s Institutional Agents
To achieve this objective in a clear and consistent manner, it is first presented the characteristics
of the Brazilian Electricity Sector addressing issues related to implementation of the three
activities mentioned above, followed by discussing separately such activities, showing how
stochasticity, linked to NEWAVE model, helps in implementing them.
The BES presents some peculiar characteristics that make it different from any other in the
international context, and this makes the system’s operation and planning a complex activity with
complex implementation. According(Marreco, 2007), both the technical and the economic
aspects must be highlighted. The energy sector has specific characteristics in relation to other
sectors, such as the natural monopoly (electric sector as a whole) and network industry (for
example, distribution and transmission segments). In addition to the features described, there are
some others specificities in the BES, such as: (i) hydroelectric base, with cascading plants of
different ownerships; (ii) high capital intensity; (iii) long term investment maturation; (iv) huge
interconnections; and (v) considerable uncertainties (hydrological, demand growth, fuels price,
among others).
Concerning the high capital intensity and the long term investment maturation, it is emphasized
that the time between the decision to build a hydroelectric plant and its effective entry into
operation may be greater than ten years. Another feature is the sunk costs, due to the high degree

of specificity of the activities associated with the sector (e.g. electrical energy transmission lines).
This scenario emphasizes the importance of the long term planning conducted by EPE.
Another technical attribute fundamental to the sector is the physical balance, which requires the
system coordination, since its parts work with strong interdependence. The electrical energy
generation can be obtained through various technologies with different costs and socio-
environmental impacts. In the case of the hydroelectric plants, for example, the input is a random
flow based on the rainfall, which implies a great complexity in the short and medium term
planning process, a task performed by ONS.
Even with an efficient electrical energy demand and supply planning system, due to the
magnitude of the ventures and the market peculiarities, there is a short term energy market whose
final objective is to solve the differences between supply and demand, operated by CCEE.
Seeking to facilitate the system’s operation and planning, the Electrical sector agents created the
National Interconnected System (SIN)(Figure2).This interconnection comes from the fact that the
country adopts a system that is basically hydro and the water reservoirs of the facilities are used
in a planned way, so that it is possible to profit from the rainfall diversity in the different existent
basins; this procedure assures the Brazilian system an important energetic gain. Such SIN, of
continental dimensions, allows, the energy generated at any point in the country be consumed by
different consumers in different regions (Carpio & Pereira Jr, 2006). The interconnection
between regions results in better use of the resources.
Within this context, the coordination of the operation of the SIN by ONS, according to general
guidelines of the Monitoring Committee of Energy, aims to meet the requirements of power
consumption of the system in order to guarantee the continuity of the supply of energy and
reduce operating costs. Thus, the rational use of resources must be planned aiming to meet the
requirements of the present system and seek ways to determine the needs for system expansion
(EPE) with subsequent investments.
Figure2– NationalInterconnected System

The considerations that underline the specificities of the electricity sector in relation to expansion
planning, operation planning and valuation of the spot price of energy highlight the prominence
of the theme. These decisions are often made before a climate of uncertainty and require
systematic processes for decision support, especially about future prospects.
To confirm what has been discussed so far, the next three sections present the planning of
expansion, the planning of the operation, and the determination of the spot price of energy,
separately identifying characteristics peculiar to each segment, and the relationship with the
stochasticity inherent in the sector
For ease of exposition of the arguments previously portrayed, it is first considered the planning of
the operation of the system, followed by the expansion planning and concluding with the
determination of the spot price. It is shown how way the stochastic component affect each one of
them.
2.1. The Operation Planning of the BES
The system ofelectrical power generationin Brazil, withapproximately 105,000MW, is
basicallyhydropower. The shareof this energy sourceis approximately80,000 MW, representing
approximately 70% of theinstalled generation capacity(and, under normal conditions,
isresponsible for producingapproximately 90% of the electricity consumedin the country). In
turn, thethermoelectric and thethermonuclearplants represent 18% and 2% of generation capacity,
respectively(ANEEL, 2012). To have anidea of theimportance of thishydro system, for example,
78% of China's output of electrical power is thermal, and out of this more than 90% is
coal(Andrews-Speed & Dow, 2000).
In this context, a hydrothermal system in which one has, at one hand, the uncertainty on the
future availability of hydro energy, at a cost of generation considered zero, and on the other hand,
the thermal energy with high cost of generation, emphasizes the need to decide at every moment
what is the best share of hydro and thermal plants.
In the operationofhydrothermal systems, unlike whathappensinpurelythermalsystemswhere
theoperationplanning problemcan be solved by finding acombination ofplantsthat minimizefuel
costs, in the hydrothermal systems, the decision makingis coupledin time, i.e.a decisiontaken
todaywill haveconsequencesin the future (Terry et. al., 1986).
For example, if there is asignificanthydroelectricorderbefore adry period, one may risk the use
ofthermaldispatchathigher costin the future. On the other hand, athermal dispatchbefore awet
periodmay causeloss, incurring wastedenergy (Figure3).
Decision
Hidroelectric
only
Thermics
on
GoodDecision
Rationing and high
costs
WaterDepletion (Energy
waste)
GoodDecision
Total Costs Present Costs Future Costs
Figure3–Problem of Operation Planning Decision
The optimal system operation will involve, therefore, a compromise between using or not using
water from the reservoirs. The decision variable is the water volume stocked at the end of the
period of operation (end volume).

Such a decision has an immediate cost, associated to the thermal generation (ICF - immediate
cost function), and a future cost, associated to the expectation of thermal dispatch, indicated by
the future cost function (FCF). The total cost is the sum of these costs and the optimal decision is
obtained equating to zero the derivative of the total cost in relation to the end volume equal to
zero (Pereira et. al, 1998).
As it is possible to observe in (Figure 4),the ICF increase with the growth of the final volume;
that is, the higher this water volume is, the bigger is the spent with thermal generation. The FCF
has an opposite behavior: as the final stock grows, the future expectation with fuels expenditures
diminishes.
Figure 4 – Operation Planning Criterion
This operation criterion, although apparently simple, involves complex calculation, causing the
operation of a coordinated hydrothermal system to be made in different stages, through the chain
models that enables the definition of an operation strategy.
As highlighted by (Pereira & Pinto, 1982) and (Lepecki & Kelman, 1985), the coordination of the
planning of the operation of a hydrothermal system, such as the Brazilian SIN, can be formulated
as large scale optimization problem, coupled with temporal and spatial operation, dynamic,
stochastic and nonlinear. Its solution requires that the problem is decomposed into a chain of
coupled models that consider long-term horizons (probability of future energy storage, expected
future value of thermal generation etc.), medium term (annual contracts to guarantee peak hours
supply etc) and short-term (flow control, dispatch time).
To proposed solution to this problem adopted by the BES is the use of a chain of coupled models
that consider different planning horizons: long, medium, short terms and daily programming
(Maceiraet. al., 2002). The coupling among the models is made through the future cost function
of the optimal energy operation.
More specifically, it is defined as operation planning, efforts to shape the behavior of the system
at a horizon of five years, promoting the rational use of resources to ensure quality and safety in
meeting the market demand. This is carried out by minimizing the operating costs of the
hydrothermal system.
The operation programming is to establish a short-term procedure of the hydrothermal system
providing operational decisions of the generation system that are feasible to the transmission
system and respect the goals set in the planning of the operation.
To solvethe models adoptedin the chain ofBES'senergy planning, it is used the
StochasticDualDynamic Programming(SDDP) ((Shapiro et. al., 2011); (Pereira & Pinto, 1991);
(Pereira & Pinto, 1985); (Pereira, 1989)).This methodologyuses the
techniqueofBendersdecomposition ( (Benders, 1962); (Pereira & Pinto, 1983)) seeking to

findoptimal strategiesfor the operation ofinterconnectedsubsystems, whileinflowsare treated as a
periodicautoregressive model(Hipel & McLeod, 1994).
The SSDP is used to determine the operating policy that minimizes the expected value of the
expected cost of the operation to the horizon of up to five years. The strategy is checked through
a simulation process that makes a thorough use of a series of natural energy, representative of
each subsystem. Such series may be either historical data or synthetic data. The set of
hydroelectric plants is represented by equivalent reservoirs in which a number of hydroelectric
plants is aggregated into a single equivalent reservoir that receives, stores and discharges energy
(Natural Inflow Energy, NIE) instead of water. On the other hand, the thermal plants are
represented through their operation costs of minimum and maximum generation. The NEWAVE
models produce future cost function (FCF) that is attached to the short-term module at the end of
planning horizon (Figure 5).
In order to reducethe computational effortrequired by theoptimization procedure, the models
usedfor planning theoperationin the medium termrequirethe aggregation ofplantsintoequivalent
reservoirs ofenergy for each subsystem(Southeast/Midwest, South, Northand Northeast). This
way, theSINisrepresented by four interconnected subsystem, each one with its equivalent fictions
reservoirs.
However, in order to check if the operating policy obtained by the strategic decision model is
viable, it is necessary to disaggregate the solution of the fictitious equivalent reservoirs into
individual plants, i.e. check whether the plants that make up the equivalent system will be able to
meet the amount of hydroelectricity for the system, given by the model of strategic decision. For
this purpose, the DECOMP and the DESSEM models are used to produce the weekly and the
daily programme, respectively (see figure 5), departuring from the optimal decision obtained
from the NEWAVE system.
Uncertainty
Rep
resentatio
noftheSystem
MediumTerm
(1-5 years)
NEWAVE/SUISHI
Short Term
(1 year)
DECOMP
Expected
Future Cost by
each subsystem
Very Short Term
(1 semana)
DESSEM - PAT
Daily Programming
24 horas
Expected
Future Cost by
each plant
Models
Months
Months and
weeks
Hours and half
hours
Eqivalent by each
subsystem
Individualized
Individualized
and Electric
Figure 5 - Chain of Models in Operation in the Brazilian Electric Sector

As already stated, this article will focus on the stochastic module that supports the planning
model NEWAVE. As noted, such a model is used, in general, to optimize the use of water and,
therefore, depends on the rainfall stochasticity, which is represented by synthetic series generated
from time series models that are included in Inflow Energy Modules (IEM) (Figure 6).
In the short term, the aspects of quality and service demands consist of meeting the generation
targets set in medium-term planning and monitoring operational feasibility in terms of restrictions
of generation and transmission equipment. In this planning horizon, the DECOMP model is used
and its goal is the minimization of the expected value of the total system cost.
When the study horizon is reduced to the short and very short term (DECOMP and DESSEM-
PAT), the representation of the system is refined to hydroelectric plants, expressing their
operating characteristics of water and energy restrictions. In operation programming the horizon
is up to two hours with discretization into hours or thirty minutes (Figure 5). The goal is to obtain
the optimal dispatch of the hydrothermal system, addressing the aspects related to energy,
hydrology and electrical. The horizon of short and very short term (daily schedule) allows one to
consider the values of inflows known or deterministic (Maceiraet. al., 2002).
Finally, it is important to notice that as the time interval decreases, the uncertainty regarding
inflows/NIE decreases, reaching a deterministic extrapolation, and the level of details of the
system representation increases as its features are considered individualized.
Following the logic proposed at the beginning of this section, it is presented the NEWAVE
model, emphasizing the connection between this model and the model for generating synthetic
series (Natural Energy Module), and DECOMP model, important for determining the short-term
energy price and which is coupled to the model NEWAVE future cost function.
NEWAVE Model
The NEWAVE is an optimization procedure to model to the medium term planning (up to
5 years ahead) with monthly discretization and representation to equivalent systems. Its objective
is to determine the hydraulic and thermal generation strategy of each stage that minimizes the
expected value of the operation cost to the whole planning period.
One of the main outcomes of this module are the future cost functions, essential to
determine the “water cost” and, consequently, the impacts of using the water stored in the
reservoirs. In this model, the load and the deficit cost function can be represented in levelsiiand
this enables the consideration of interconnection limits among the subsystems (CCEE, 2012).
The NEWAVE is composed of 4 operational modules: (i) Equivalent System Calculation
Module – calculates the equivalent energy subsystems, that is, based on the NIE time series and
on the characteristics of them, it calculates the Affluent Natural Energy; (ii) Inflow Energy
Module – estimates the stochastic model parameters and generates affluent energy synthetic
series, using them to calculate hydrothermal operation policy; (iii) Hydrothermal Operation
Policy Calculation Module – determines the most economic operation policy to the equivalent
subsystems, considering the uncertainties in the future affluences, the unavailability of the
equipments and the demand levels; (iv) Operation Simulation Module – simulates the system
operation during the planning period for different scenarios of hydrological sequences (CEPEL,
2011a).
As can be observed in (Figure 6), the four modules are interconnected. It is possible to
observe that the Affluent Energies Module receives NIE’s series from the equivalent system
calculation module, estimates the PAR(p) model and generates synthetic series to each
subsystem, and provides the simulation and the operation policy modules with the parameters
generated by the model and with the energy synthetic series. With these stochastic variables, the
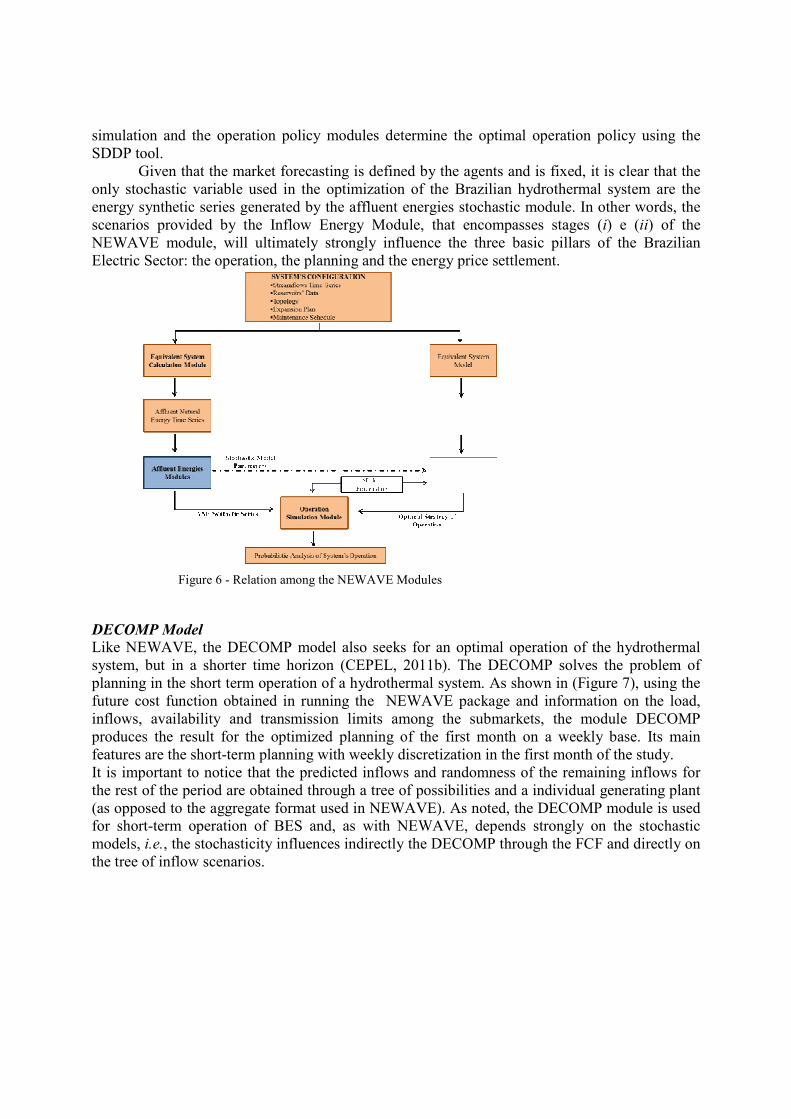
simulation and the operation policy modules determine the optimal operation policy using the
SDDP tool.
Given that the market forecasting is defined by the agents and is fixed, it is clear that the
only stochastic variable used in the optimization of the Brazilian hydrothermal system are the
energy synthetic series generated by the affluent energies stochastic module. In other words, the
scenarios provided by the Inflow Energy Module, that encompasses stages (i) e (ii) of the
NEWAVE module, will ultimately strongly influence the three basic pillars of the Brazilian
Electric Sector: the operation, the planning and the energy price settlement.
Figure 6 - Relation among the NEWAVE Modules
DECOMP Model
Like NEWAVE, the DECOMP model also seeks for an optimal operation of the hydrothermal
system, but in a shorter time horizon (CEPEL, 2011b). The DECOMP solves the problem of
planning in the short term operation of a hydrothermal system. As shown in (Figure 7), using the
future cost function obtained in running the NEWAVE package and information on the load,
inflows, availability and transmission limits among the submarkets, the module DECOMP
produces the result for the optimized planning of the first month on a weekly base. Its main
features are the short-term planning with weekly discretization in the first month of the study.
It is important to notice that the predicted inflows and randomness of the remaining inflows for
the rest of the period are obtained through a tree of possibilities and a individual generating plant
(as opposed to the aggregate format used in NEWAVE). As noted, the DECOMP module is used
for short-term operation of BES and, as with NEWAVE, depends strongly on the stochastic
models, i.e., the stochasticity influences indirectly the DECOMP through the FCF and directly on
the tree of inflow scenarios.

Figure 7 - DECOMP Program Main Inputs and Outputs
2.2. Expansion Planning of the BES
According to (Tolmasquim, 2011), just like the operation planning involves the compromise
between the immediate use and the future use of water, in the case of the expansion planning,
there is the relation between the future and the immediate use of the financial capital available to
the expansion.
To put it differently, the agents need to decide between investing now and run the risk of
system’sexcess supply due to the demand growth below the expected, or postpone the investment
and run the risk of rationing, as can be seen in(Figure 8).
Decision
Investiment
save
Demand
Demand
Demand
Demand
Demandmeeting
Excess Suply
Rationing
Demandmeeting
Figure 8 - Investment Decision
Following the same logic of the water use in the operation, the decision to expand the system
capacity diminishes the stock of capital, with an immediate cost (expansion cost, which is
known) and a future cost (deficit cost, which is estimated).
This way, the decision to “save” has low immediate cost and high future cost, the latter due to the
increase in fuels consumption and rationings. On the other hand, the decision to “invest” has high
immediate cost and low future cost (Figure 9) (Tolmasquim, 2011).
As in the operation process, in the planning case, for a given predicted demand, there are various
possibilities for the expansion. Each possibility is equivalent to a level of reliability R (x - axis),
where the expansion costs will depend on the demand, which is unique and the level of reliability
R desired by the planning responsible.

Figure 9 - Expansion Planning Criterion
Similarly to what happens with the operationprocess, the solution to the planning process
is given by an optimization exercise, having as decision variable the reliability level (R) and, as
objective function, the total cost (sum of expansion and operation costs). It is worth remembering
that the reliability level (R*) and expansion plan are optimal in the minimal total cost point
(Tolmasquim, 2011).
In the optimal plan, the derivative of the expansion cost in relation to the demand represents the
Expansion Marginal Cost (EMC), which is linked to the cost of an incremental load, with
capacity expansion. While the operation cost derivative in relation to the demand represents the
Operational Marginal Cost (OMC), being the cost to meet the incremental demand, without
capacity expansion.
Considering that the demand increases in time, the Brazilian Electricity Sector expansion
takes place when the OMC is equal to the EMC; in expanding, the OMC decreases in relation to
the EMC and another cycle starts.
As in the planning of the operation, the expansion planning uses the NEWAVE model to support
decision making. The calculation of OMC is performed by simulations of the operation of the
system, based on the NEWAVE model. Since the calculation of the EMC is estimated based on
the results of new energy auctions, considering that the winning bid of the more expensive
project of the auction, which reveals the agents' willingness to invest, is a good approximation of
the EMC.
Finally, it is crucial to observe that, given the time to the maturation of the investments in
the electrical sector and the serious consequences of a rationing, the generation planning needs to
meet the reliability level defined by the Energetic Policy National Council, through which the
annual risk of deficit should not overcome 5% in any subsystem. Yet, to meet the economic
criterion, it is necessary have equality between the OMC and the EMC.
In summary, it was verified that the stochasticity is intrinsically linked to the BES
expansion planning, since, as observed, the decision to expand the system is intimately connected
to the OMC, which is calculated from the NEWAVE model and has as one of the stochastic
variable the energy synthetic series.
2.3. Electrical Energy Trading of BES
The New Model divided Brazilian energy market into twotrading environments: the Regulated
Trading Environment (Ambiente de ContrataçãoRegulada, ACR), aiming at meeting the
demands of the captive consumers, represented by term contracts on energy from the market
Pool; and the Free Trading Environment (Ambiente de ContrataçãoLivre, ACL), dedicated to

companies with bigger consumption volume, and where the bilateral contracts are freely
negotiated, following specific trading rules and procedures (Castro & Leite, 2010).
However, due to the fact that the electrical energy physical attribute requires an instantaneous
balance between demand and supply, the supply predicted ex ante is not necessarily equal to the
observed demand; this calls for an instantaneous balance in two points: energy supply and
financial accounting (Rodrigues, 2007).
In what regards the supply, the Electric System National Operator (ONS) centralizes the dispatch
of the plants through the aggregation of generation and transmission ventures, so that it requires a
more effective management of the energy production cost. In this case, it can happen that a
generator, even with all its capacity contracted, is not able to offer this capacity to the system due
to decisions of the operator.
Concerns the first, ONS, responsible for planning the operation of the system, centralizes the
dispatch of the plants through the aggregation of generation plants and the transmission lines in
order to perform a more effective management use of resources, and consequently, minimize the
cost of energy. In this case, a generator, even with all its energy being contracted, may not have
to supply it to the system due to the decisions of the operator.
The second is a function of theBoard of Trade of Electricity Energy (CCEE), which accounts the
differences between what was produced or consumed and what was contracted. The positive or
the negative differences are liquidated in the short term market (spot) and evaluated by the
Differences Liquidation Price (DLP), which is weekly set to each load level and to each
submarket, and having as its base the subsystem’s OMC. The DLP is limited by a minimum and
maximum price.
As observed, the price in this market does not follow the economic relation between supply and
demand set by the agents, but is determined by a set of computational models (e.g., NEWAVE,
DECOMP), operated by the ONS and CCEE. The expectations in relation to the future electricity
consumption and to the future ENA’s regime play a determinant role in the use of the energy
accumulated in the hydroelectric reservoirs, consequently on the short term energy price.
Therefore, the expected minimum cost in a given horizon should take into account different
inflow scenarios that result in different operational decision.
In short, in discussing the three pillars of BES, it was shown that the NEWAVE model calculates
the optimal operating system policy, considering present and future costs. The predominance of
hydroelectric generating facilities in Brazil makes the question of randomness of inflows an
important problem in optimization of the total cost of operation in the time horizon considered, as
the future cost is a function of future inflows that are random, while the immediate cost is a
function of the current dispatch of hydro and thermal plants, the latter considered zero. It should
be noted, however, that this marginal cost will be zero (corresponding to the cost of the water, i.e.
the hydraulic generation) only in the situations of full reservoirs in the present and in the future,
i.e., arising from inflow series with very favorable hydrology.
Thus, it is quite clear that there is a strong relationship in the BES between the stochasticity and
the three pillars of the sector, i.e., the synthetic series of energy/inflows are crucial in determining
what is the best way to operate the sector, give support to decisions on when should the system
be expanded or not, thus avoiding cost and/or unnecessary losses. And yet, they are an important
factor in determining the short-term price of electricity, since the amount simulated/predicted of
water at the reservoirs in the future will be one of the most important factor to set the short term
price.
The next section discusses the stochastic Periodic Autoregressive model (PAR (p)) adopted by
the Brazilian Electricity Sector to generate synthetic series of ENA, which are used in the
NEWAVEmodel.

3. The stochastic model adopted: PAR(p) Model
According to (Hipel & McLeod, 1994), some historic series, among them the seasonal
hydrological series show an autocorrelation structure that depends not only on the interval
between the observations, but also on the period observed. Also according to (Salas &
Obeysekera, 1982), stochastic processes that represents natural phenomena are usually second
order stationary; that is, the first and the second orders moments do not depend on the choice of
the time origin(Harvey, 1981). In the periodic process class, two models stand out: PAR (periodic
autoregressive) and PARMA (periodic autoregressive-moving average). The PAR (p) model
adjusts an AR (p) model for each period of the series. In a similar way, a PARMA (p,q) model
consists of an ARMA (p,q) model for each period under study. According to (Hipel & McLeod,
1994), in hydrology the PAR (p) modeling was developed after the research carried out by
(Thomas & Fiering, 1962).
According to (Rasmussen et. al., 1996), the extrapolation of PAR (p) models into PARMA (p,q)
models is not a trivial task and may not be justifiable, since the autoregressive models perform
well. Besides that, according to (Hosking, 1984), the literature shows descriptions of procedures
for hydrological series modeling that present long dependence, that is, they have the d parameter
of the ARIMA model (differentiation degree), assuming fractionary values. These models are
known as ARFIMA (Trevisanet. al., 2000).
The analysis and the modeling of the hydrological series that present a periodic behavior of its
probabilistic properties can be performed through periodic autoregressive formulations. These are
known as "periodic autoregressive" and PAR (p) referenced models, where p is the order of the
model. In general, p is a vector, p = [p1, p2, ..., p12], where each element provides the order of
each period (month, in the case of monthly series).
The PAR (p) model is mathematically described by:
t
pm
pmptm
p
m
mtm
m
mtm
m
mt aZZZZ
m
mm
m+
−++
−+
−=
−
−
−−
−
−−
−
−−
σ
µϕ
σµ
ϕσ
µϕ
σµ
K
2
222
1
111
(1)
tZ Seasonal series of period s
S Number of periods (s = 12 for monthly series)
T Time index, t = 1, 2, ..., sN, year function T (T = 1, 2, ..., N) and function of
the period m (m = 1,2, ..., s)
N Number of years
mµ Seasonal average of the period m
mσ Seasonal standard deviation of the period m
m
iϕ i-th autoregressive coefficient of the period m
mp Autoregressive operator order of the period m
ta Series of independent noises with zero average and variance )(2 m
aσ
The implemented approach uses the moment estimation procedure by the Yule-Walker system of
equations to obtain the parameters for each one of the 12 models identified to each month of the
year. As stated in (Pagano, 1978) and (Troutman, 1979), for autoregressive structures, the
moment estimation procedure is consistent and asymptotic efficient for Gaussian time series,
equivalent to the Maximum Likelihood estimation. In this particular approach the 12 models are
independently estimated. Therefore, in the case of a PAR(1) model for a particular model m, only
the autoregressive parameter ( m
1ϕ ) is estimated (besides the noise variance).

In other words, the PAR (p) model is adopted in the modeling and simulation of NIE in the BES
and thus adjusts an autoregressive model of p order to each period (months) of the historic series
of NIE. And this is carried out for each one of the four subsystems that form the Brazilian
Interconnected System i.e., Southeast/Mid-West, South, Northeast and North subsystems. For the
generation of hydrological scenarios, through the Monte Carlo Simulation a lognormal
distribution is adjusted to the residuals((Maceiraet. al., 2005); (Spinney & Watkins, 1996)).
4. Final Remarks
The aim of this article was to present the reader with a different view of the Brazilian Electric
Sector, i.e., as was noticed in the text, there is an intrinsic relationship between the stochasticity
and the activities performed by BES, a major infrastructure sector of the country, which has not
been emphasized in every article.
It was evident that the synthetic series of energy/inflows are crucial in determining what is the
best way to operate the sector, subsidize decisions about when to expand it or not, thus avoiding
cost and/or unnecessary losses. And yet, they are a major factor in determining the short-term
price of electricity, since the amount simulated/predicted level of water at the reservoirs in the
future will be one of the determinants in setting the short term price.
The importance of this article goes far beyond what was discussed in its essence, it opens a range
of possibilities and discussions on how determination being carried out the operation planning,
the expansion planning and the electricity spot price. In this sense, the idea of this paper is to
provide an intangible result creating a research agenda on the stochastic modeling involving BES.
In other words, one should discuss points of improvements to the model adopted by the sector,
whether the current model is the most appropriate and discuss points related to the effects of
climate change that has occurred over the years on the planet, because, as evidenced changes in
rainfall, can cause great damage to BES and consequently damage to the economy.
This way, the idea of this article, much more than presenting the relationship: stochasticityvs
BES, is to put foward a real problem, where policymakers should be alert not only to the
modeling problems that exist today, but also should consider what are the attitudes of the country
if any climate event affects in a "unpredicted way" the NIEs of a given subsystem.
Finally, as an extension of this work, is a discussion of the models existing today in BES and
used to generate synthetic series for the NEWAVE model and yet, the search for new models and
studies that address the occurrence of unexpected climatic events.
5. References ABINEE. (2012). Desempenho Setorial. Retrieved February 15, 2012, from Associação Brasileira da
Indústria Elétrica e Eletrônica: http://www.abinee.org.br
Andrews-Speed, P., & Dow, S. (2000). Reform of China's electric power industry challenges facing the
government. Energy Policy 28, 28.
ANEEL. (2012). 2012 Report. Retrieved March 20, 2012, from Agência Nacional de Energia Elétrica:
http://www.aneel.gov.br
Benders, J. F. (1962). Partitioning Procedures for Solving Mixed Variables Program-ming Problems.
Numerische Mathematik, 4, pp. 238-252.
BNDES. (2012). 2012 Report. Retrieved February 15, 2012, from Banco Nacional de Desenvolvimento
Econômico e Social: http://www.bndes.gov.br/
Carpio, L. G., & Pereira Jr, A. O. (2006). Independent operation by subsystems: Strategic behavior for the
Brazilian electricity sector. Energy Policy 34 , pp. 2964-2976.
Castro, N. J., & Leite, A. L. (2010). Preço spot de eletricidade: teoria e evidências do caso brasileiro. IV
Encontro de Economia Catarinense, Criciúma. IV Encontro de Economia Catarinense .
CCEE. (2012). Arquivo 2012. Acesso em 15 de March de 2012, disponível em Câmara de Comercialização de
Energia Elétrica: http://www.ccee.org.br

CEPEL. (2011b). Manual de referência do modelo DECOMP. Rio de Janeiro, Brazil: Centro de Pesquisas em
Energia Elétrica.
CEPEL. (2011a). Manual de referência do modelo NEWAVE. Rio de Janeiro, Brazil: Centro de Pesquisas em
Energia Elétrica.
EPE. (2009). Atualização do valor para patamar único de custo de déficit. Rio de Janeiro, Brazil: Empresa de
Pesquisa Energética.
Fernandes, E., Fonseca, M., & Alonso, P. (2005). Natural gas in Brazil's energy matrix: demand for 1995–
2010 and usage factors. Energy Policy 33 , pp. 365-386.
Harvey, A. C. (1981). Time Series Models. Philip Allan, London.
Hipel, K. W., & McLeod, A. I. (1994). Time series modelling of water resources and environmental systems.
Amsterdan, The Netherlands: Elsevier.
Hosking, J. R. (1984). Modelling Persistence in Hydrological Time Series Using Fractional Differencing.
Water Resource Research 20 , pp. 1898-1908.
Lepecki, J., & Kelman, J. (1985). Brazilian Hydroelectric System. Water International, 10 (4).
Maceira, M. E., Penna, D. D., & Damazio, J. M. (2005, November 20-24). Geração de Cenários Sintéticos de
Energia e Vazão para o Planejamento da Operação Energética. XVI Simpósio Brasileiro de Recursos Hídricos .
Maceira, M. E., Terry, L. A., Costa, F. S., Damázio, J. M., & Melo, A. C. (2002). Chain of Optimization
models forSetting the Energy Dispatch and Spot price in the Brazilian System. 14th PSCC .
Maceira, M. E., Terry, L. A., Costa, F. S., Damázio, J. M., & Melo, A. C. (2002). Chain of Optimization
models forSetting the Energy Dispatch and Spot price in the Brazilian System. 14th PSCC .
Marreco, J. M. (2007). Planejamento de Longo Prazo da Expansão da Oferta de Energia Elétrica no Brasil sob
uma Perspectiva da Teoria das Opções Reais. Doctoral Thesis. Federal University of Rio de Janeiro .
OECD. (2012). 2011 Report. Retrieved February 15, 2012, from Organisation for Economic Co-operation and
Development: http://www.oecd.org/home/
PAC. (2012). 2011 Report. Retrieved February 15, 2012, from Programa de Aceleração do Crescimento:
http://www.brasil.gov.br/pac
Pagano, M. (1978). On periodic and multiple autorregressions. The Annals of Statistics, 6 (6), pp. 1310-1317.
Pereira, M. V. (1989). Optimal Stochastic Operations Scheduling of Large Hydroelectric Systems.
International Journal of Electric Power and Energy Systems, 11 (3), pp. 161-169.
Pereira, M. V., & Pinto, L. M. (1983). Application of decomposition techniques to the mid and short term
scheduling of hydrothermal systems. IEEE Transactions on Power Apparatus and Systems (11).
Pereira, M. V., & Pinto, L. M. (1982). Decomposition Approach to the Economic Dispatch of Hydrothermal
Systems. WM .
Pereira, M. V., & Pinto, L. M. (1991). Multi-stage stochastic optimization applied to energy planning.
Mathematical Programming.
Pereira, M. V., & Pinto, L. M. (1985). Stochastic optimization of multireservoir hydroelectric system: A
decomposition approach. Water Resources Research, 21 (6).
Pereira, M. V., Campodónico, N., & Kelman, R. (1998). Long-term Hydro Scheduling based on Sthocastic
Models. EPSOM’98 .
Rasmussen, R. F., Salas, J., Fagherazzi, L., Rassam, J. C., & Bobee, R. (1996). Estimation and validation of
contemporaneous PARMA models for streaflow simulation. Water Resources Research, 32 (10), pp. 3151-3160.
Rodrigues, R. D. (2007). Gerenciamento de Risco no Setor Elétrico Brasileiro através do uso de derivativos.
Master Thesis. Federal University of Rio de Janeiro .
Salas, J. D., & Obeysekera, J. T. (1982). ARMA Model Identification of Hydrologic Time Series. Water
Resources Research, 18 , pp. 1011-1021.
Shapiro, A., Tekaya, W., Costa, J. P., & Soares, M. P. (2011). Risk neutral and risk averse Stochastic Dual
Dynamic Programming method.
Spinney, P. J., & Watkins, G. C. (1996). Monte Carlo Simulation techniques and electric utility resource
decisions. Energy Policy 24 , pp. 155-163.
Terry, L. A., Pereira, M. V., Neto, T. A., Silva, L. F., & Sales, P. R. (1986). Coordinating the Energy
Generation of the Brazilian National Hydrothermal Electrical Generating System. Interfaces, 16.
Thomas, H. A., & Fiering, M. B. (1962). Mathematical synthesis of streamflow sequences for the analysis of
river basins by simulation. Design of Water Resource Systems , pp. 459-463.
Tolmasquim, M. T. (2011). Novo Modelo do Setor Elétrico Brasileiro. Brasilia, Brazil: Editora Synergia.
Trevisan, E. S., Souza, L. R., & Souza, R. C. (2000). Estimação do parâmetro “d” em modelos ARFIMA.
Pesquisa Operacional 20 , pp. 73-82.
Troutman, B. M. (1979). Some results in periodic autoregressions. Biometrika 67 , pp. 365-373.

iNatural Inflow Energy is the amount of electricity that can be generated by hydroelectric park with water that
reaches the hydro. This energy is estimated assuming that the level of the reservoirs is an average level of 65% of its
total capacity and a political operation. Remember that this value can change according to the operation policy
(Terry, Pereira, Neto, Silva, & Sales, 1986). ii It is important to note that such levels can be of different natures, that is, (i) load level, which is an
aggregation of the energy values over a time interval (e.g., months) to separate low demand (load light), medium and
high. Broadly, it is the time period in which the characteristics of energy consumption tend to be similar, and (ii)
Threshold curve cost deficit, which were regarded as different thermal costs, each with ability of a particular
"generation", for example, 5% of the demand for the first stage of thermal deficit (or the "first level"). For more
detailssee: (EPE, 2009).
Related Documents