1 How the In-Situ Combustion Process Works in a Fractured System: Two-Dimensional, Core and Block Scale Simulation H. Fadaei, SPE, Institut Français du Pétrole; G. Debenest, Université de Toulouse, IMFT; A.M. Kamp, SPE, Open and Experimental Centre for Heavy Oil (CHLOE); M. Quintard, Université de Toulouse, IMFT; G. Renard, SPE, Institut Français du Pétrole Summary Simulation of an in situ combustion process (ISC) was done for a fractured system at core and matrix block scales. The aim of this work was: 1) to predict the ISC extinction/propagation condition(s), 2) understand the mechanism of oil recovery and 3) provide some guidelines for ISC upscaling for a fractured system. The study was based on a fine grid, single porosity, multi-phase and multi-component simulation using a thermal reservoir simulator. Firstly the simulator was validated for 1-D combustion using the corresponding analytical solutions. 2-D combustion was validated using experimental results available in the literature. It was found that the grid size should not be larger than the combustion zone thickness in order for the results to be independent of grid size. ISC in the fractured system was strongly dependent on the oxygen diffusion coefficient while the matrix permeability played an important role in oil production. The effect of each production mechanism was studied separately whenever it was possible. Oil production is governed mainly by oil drainage due to gravity force, which is enhanced by viscosity reduction; possible pressure gradient generation in the ISC process seems to have a minor effect. The nature (oil production rate, saturations distribution, shape of the combustion front) of ISC at core scale was different from that in a single block with surrounding fracture. The important characteristics of different zones (i.e. combustion, coke and oil zones) at block scale were studied and some preliminary guidelines for upscaling are presented. Introduction In spite of its strategic importance, recovery of heavy crudes from fractured carbonate reservoirs (one third of global heavy oil resources) has found limited applications due to the complexity of such reservoirs. Extensive work has been done on the development of thermal processes (Butler 1991; Crawford and Chu 1983; Farouq Ali and Meldau 1983;

Welcome message from author
This document is posted to help you gain knowledge. Please leave a comment to let me know what you think about it! Share it to your friends and learn new things together.
Transcript
1
How the In-Situ Combustion Process Works in a
Fractured System: Two-Dimensional, Core and Block
Scale Simulation
H. Fadaei , SPE, Institut Français du Pétrole; G. Debenest , Université de Toulouse, IMFT; A.M. Kamp ,
SPE, Open and Experimental Centre for Heavy Oil (CHLOE); M. Quintard , Université de Toulouse, IMFT;
G. Renard , SPE, Institut Français du Pétrole
Summary
Simulation of an in situ combustion process (ISC) was done for a fractured system at core and matrix block scales. The
aim of this work was: 1) to predict the ISC extinction/propagation condition(s), 2) understand the mechanism of oil
recovery and 3) provide some guidelines for ISC upscaling for a fractured system. The study was based on a fine grid,
single porosity, multi-phase and multi-component simulation using a thermal reservoir simulator.
Firstly the simulator was validated for 1-D combustion using the corresponding analytical solutions. 2-D combustion
was validated using experimental results available in the literature. It was found that the grid size should not be larger
than the combustion zone thickness in order for the results to be independent of grid size. ISC in the fractured system
was strongly dependent on the oxygen diffusion coefficient while the matrix permeability played an important role in
oil production. The effect of each production mechanism was studied separately whenever it was possible. Oil
production is governed mainly by oil drainage due to gravity force, which is enhanced by viscosity reduction; possible
pressure gradient generation in the ISC process seems to have a minor effect. The nature (oil production rate,
saturations distribution, shape of the combustion front) of ISC at core scale was different from that in a single block
with surrounding fracture. The important characteristics of different zones (i.e. combustion, coke and oil zones) at
block scale were studied and some preliminary guidelines for upscaling are presented.
Introduction
In spite of its strategic importance, recovery of heavy crudes from fractured carbonate reservoirs (one third of global
heavy oil resources) has found limited applications due to the complexity of such reservoirs. Extensive work has been
done on the development of thermal processes (Butler 1991; Crawford and Chu 1983; Farouq Ali and Meldau 1983;
2
Prats 1982; Pooladi Darvish 1994; Sarkar and Sarathi 1993). However, for in situ combustion (ISC) applied to
fractured reservoirs, a multi-scale multi-process problem has to be dealt with, and many unknowns are still remaining.
The recovery mechanism, reservoir and operational conditions at which the combustion can propagate in fractured
systems are not clearly understood. In situ combustion has been a matter of concern for many researchers. Most of their
studies were carried out for reservoirs without a dominant presence of fractures. These studies are mainly concerning
two aspects: determining the kinetics of in situ combustion reactions (Audibert and Monin 1985; Fassihi et al. 1984;
Moore et al. 1996) using a kinetic cell reactor and understanding the behavior of the in situ combustion process in the
combustion tube or 3-D physical model (Butler 1991; Moore et al. 1998; Greaves and Turta 2000; Xia et al. 2005; Akin
et al. 2000; Castanier et al. 1992; Sarathi 1999).
Few works may be found in literature concerning ISC in a fractured system. Schulte and De Vries (1985) studied ISC
in a fractured core at laboratory scale. They simulated the fracture through the use of narrow pathway adjacent to the
core situated vertically in a core holder in a combustion tube experiment. They observed that the process was governed
by diffusion of oxygen into the matrix. The main oil production mechanisms were found to be thermal expansion and
evaporation. A cone shaped front was observed after cutting the core sample and the front inside the sample had
advanced less than in the fracture. The same experimental configuration was studied by Greaves et al. (1991). As in the
other experiment the cone shape front was observed and the main oil production mechanism was found to be expansion
and evaporation. In another study done by Miller et al. (1983) using a fractured core, 33% of the initial oil in place was
produced as a result of the combustion process while 45% was used as fuel by the combustion. The combustion
experiment with a fracture propped with glass beads was not successful because in this case the air flow passed through
the fracture and was not supplied to the combustion front. Some works are currently on-going at Stanford University on
in situ combustion in a fractured core (Awoleke 2007). It was observed that the combustion front was not hindered by
small scale heterogeneity (average 0.025 m) while it was not sustained in the case of large scale heterogeneity (0.67 m).
Simulation of in-situ combustion in a fractured core was done by Tabasinejad et al. (2005). Their results show that the
combustion front propagated successfully in the tube and high oil recovery (>80%) was achieved although it was less
than for a conventional combustion process. Air injection into a light oil fractured reservoir was studied by Lacroix et
al. (2004). They performed a fine grid simulation at core scale where they found that oxygen diffusion into the matrix
and the thermodynamic exchanges between gas in the fracture and oil in the matrix are controlled by matrix-fracture
exchange.
In this study we have used two important parameters (oxygen diffusion coefficient and matrix permeability) to
determine the ISC propagation condition. To our knowledge this approach was not used by the previous researchers.
3
Effect of air injection rate on the propagation and extinction of the combustion front was studied by Schulte and De
Vries (1985). Doing analytical modeling they have concluded that to prevent oxygen breakthrough, injection rate
should be limited (determined by fracture spacing) and to sustain the front propagation a minimum injection rate is
necessary based on heat losses. The effect of air injection rate also studied by Tabasinejad et al. (2006) who found that
increase in air injection rate can increase the front advancement and cause higher temperature and higher oil recovery.
Considering the diffusion dominated system which is predominant in fractured reservoirs, oxygen flux into the matrix
is determined by the parameters of this diffusive flow (diffusion coefficient and the concentration gradient). For this
reason, our approach we investigate the propagation condition based on the parameters of the diffusive flow and matrix
permeability.
Another important contribution of this work is the analysis of the behavior of ISC at single block scale of fractured
system based on dimensionless numbers. Dimensionless numbers have been presented in literature for other thermal
processes like steam injection and SAGD (Butler 1991; Pooladi Darvish 1994), but not for ISC in a fractured system.
Another contribution which we did not find in previous studies is proposing some up-scaling guidelines based on the
observed characteristic lengths of temperature and saturation profiles. Understanding the underlying processes at single
block scale is a crucial step for setting up the dual medium models which currently are the only practical way for ISC
simulation at field scale.
Mathematical model used in the thermal simulator
Based on current knowledge of crude oil combustion in porous media, we chose to consider four phases for modeling
the problem: oil, gas, water and solid. The oil and gas phases are multi-component (i.e. hydrocarbon components in oil
and gas phases, water may exist in the gas phase), solid phase may contain inert solid and coke; the water phase
however is considered to have only one component. Reactions are taking place in the oil, in the gas and on the surface
of the solid phase (when coke is present). Coke is formed due to pyrolysis and deposited on the solid surface. Reactions
in oil and gas phases are homogeneous but the coke generation reaction is heterogeneous. We used a commercial
thermal reservoir simulator (Software user guide, 2006). We have applied the single porosity approach also considering
the thermal equilibrium between phases at Darcy scale. Both heat and mass conservation equations handle the
convection and dispersion as well as the reaction terms. Reactions are considered to be of the Arrhenius type. Darcy
equation is applied for momentum conservation equation. More details of the mathematical model describing the mass,
momentum and energy conservation as well as the reaction scheme can be found in Fadaei et al. (2008).
4
Results
Simulator validation
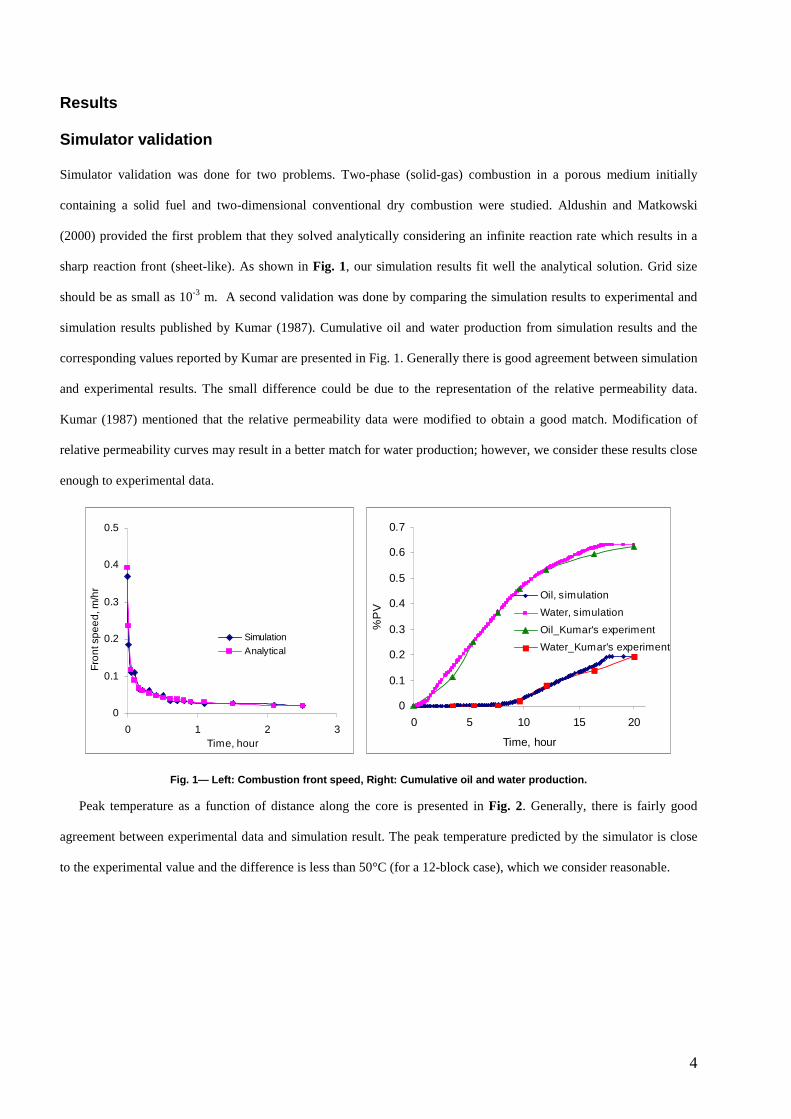
Simulator validation was done for two problems. Two-phase (solid-gas) combustion in a porous medium initially
containing a solid fuel and two-dimensional conventional dry combustion were studied. Aldushin and Matkowski
(2000) provided the first problem that they solved analytically considering an infinite reaction rate which results in a
sharp reaction front (sheet-like). As shown in Fig. 1, our simulation results fit well the analytical solution. Grid size
should be as small as 10-3 m. A second validation was done by comparing the simulation results to experimental and
simulation results published by Kumar (1987). Cumulative oil and water production from simulation results and the
corresponding values reported by Kumar are presented in Fig. 1. Generally there is good agreement between simulation
and experimental results. The small difference could be due to the representation of the relative permeability data.
Kumar (1987) mentioned that the relative permeability data were modified to obtain a good match. Modification of
relative permeability curves may result in a better match for water production; however, we consider these results close
enough to experimental data.
0
0.1
0.2
0.3
0.4
0.5
0 1 2 3Time, hour
Fro
nt s
pe
ed
, m/h
r
Simulation
Analytical
0
0.1
0.2
0.3
0.4
0.5
0.6
0.7
0 5 10 15 20
Time, hour
%P
V
Oil, simulation
Water, simulation
Oil_Kumar's experiment
Water_Kumar's experiment
Fig. 1— Left: Combustion front speed, Right: Cumula tive oil and water production.
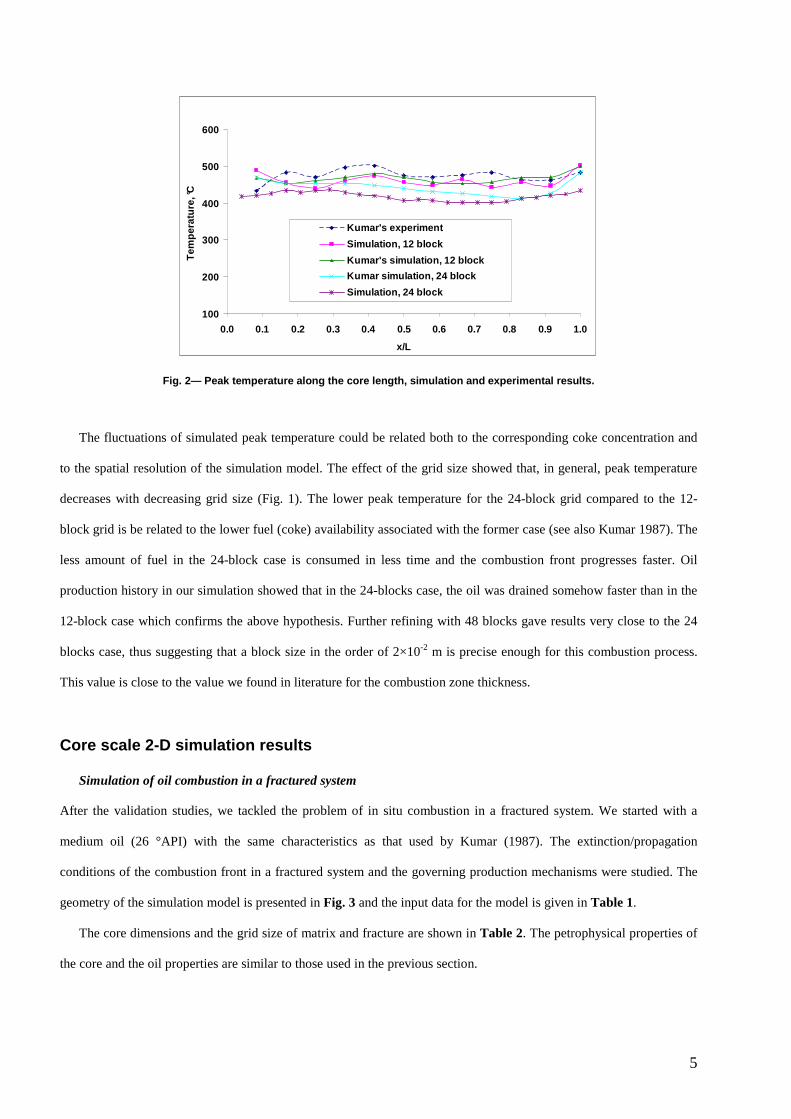
Peak temperature as a function of distance along the core is presented in Fig. 2. Generally, there is fairly good
agreement between experimental data and simulation result. The peak temperature predicted by the simulator is close
to the experimental value and the difference is less than 50°C (for a 12-block case), which we consider reasonable.
5
100
200
300
400
500
600
0.0 0.1 0.2 0.3 0.4 0.5 0.6 0.7 0.8 0.9 1.0
x/L
Tem
pera
ture
, °C
Kumar's experiment
Simulation, 12 block
Kumar's simulation, 12 block
Kumar simulation, 24 block
Simulation, 24 block
Fig. 2— Peak temperature along the core length, sim ulation and experimental results.
The fluctuations of simulated peak temperature could be related both to the corresponding coke concentration and
to the spatial resolution of the simulation model. The effect of the grid size showed that, in general, peak temperature
decreases with decreasing grid size (Fig. 1). The lower peak temperature for the 24-block grid compared to the 12-
block grid is be related to the lower fuel (coke) availability associated with the former case (see also Kumar 1987). The
less amount of fuel in the 24-block case is consumed in less time and the combustion front progresses faster. Oil
production history in our simulation showed that in the 24-blocks case, the oil was drained somehow faster than in the
12-block case which confirms the above hypothesis. Further refining with 48 blocks gave results very close to the 24
blocks case, thus suggesting that a block size in the order of 2×10⁻² m is precise enough for this combustion process.
This value is close to the value we found in literature for the combustion zone thickness.
Core scale 2-D simulation results
Simulation of oil combustion in a fractured system
After the validation studies, we tackled the problem of in situ combustion in a fractured system. We started with a
medium oil (26 °API) with the same characteristics as that used by Kumar (1987). The extinction/propagation
conditions of the combustion front in a fractured system and the governing production mechanisms were studied. The
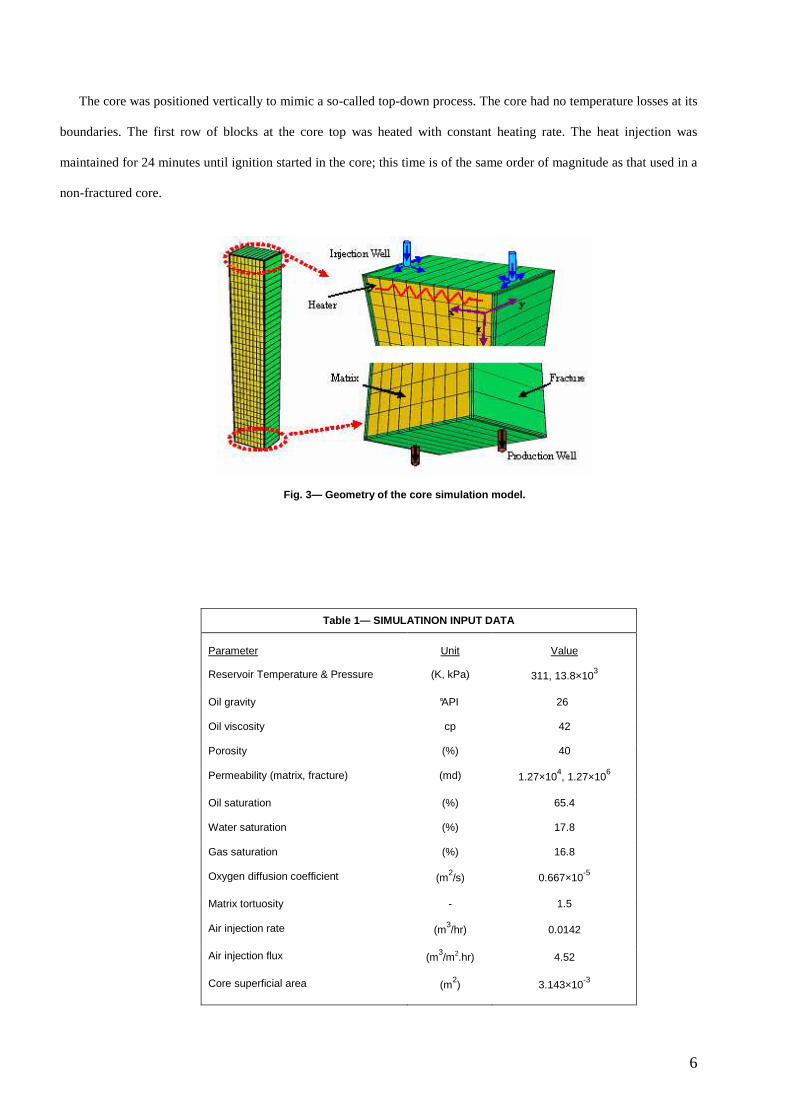
geometry of the simulation model is presented in Fig. 3 and the input data for the model is given in Table 1.
The core dimensions and the grid size of matrix and fracture are shown in Table 2. The petrophysical properties of
the core and the oil properties are similar to those used in the previous section.
6
The core was positioned vertically to mimic a so-called top-down process. The core had no temperature losses at its
boundaries. The first row of blocks at the core top was heated with constant heating rate. The heat injection was
maintained for 24 minutes until ignition started in the core; this time is of the same order of magnitude as that used in a
non-fractured core.
Table 1— SIMULATINON INPUT DATA
Parameter Unit Value
Reservoir Temperature & Pressure (K, kPa) 311, 13.8×10³
Oil gravity °API 26
Oil viscosity cp 42
Porosity (%) 40
Permeability (matrix, fracture) (md) 1.27×10⁴, 1.27×10⁶
Oil saturation (%) 65.4
Water saturation (%) 17.8
Gas saturation (%) 16.8
Oxygen diffusion coefficient (m2/s) 0.667×10⁻⁵
Matrix tortuosity - 1.5
Air injection rate (m3/hr) 0.0142
Air injection flux (m3/m2.hr) 4.52
Core superficial area (m2) 3.143×10⁻³
Fig. 3— Geometry of the core simulation model.
7
Cumulative oil production at standard condition after 15 hr showed that for the base case most of the oil (about
70%) has been produced in the first half of the burning process. The ignition temperature was 325°C and after that, the
peak temperature continuously increased. This increase may be due to an increase in coke concentration as the oxygen
flux into the matrix is insufficient to burn the amount of coke generated. This is resulted in combustion zone expansion
and peak temperature increase. Another reason was that not all the injected air passes through the matrix due to higher
permeability in the fracture, so the cooling efficiency of injected air is somehow lower than in the non fractured
combustion case. The mass of oil which has been burnt during the combustion is calculated to be 13% of the total
initial mass of the oil while it is 6.4% for a non fractured core. This may explain the temperature increase in the
fractured system.
Extinction/propagation condition
Out of many parameters that may influence the behavior of a combustion process (Schulte and De Vries 1985;
Greaves et al. 1991; Awoleke 2007; Tabasinejad et al. 2006), only oxygen diffusion and matrix permeability were
varied in our study. The former is believed to govern the crude oil combustion in the fractured core (Greaves et al.
1991; Schulte and De Vries 1985) and the latter is related to the inherent characteristics of carbonate reservoirs, which
have naturally very low permeability (yet in a typical combustion tube, permeability is usually very high compared to
that encountered in a real reservoir).
Several computations were performed using different values of oxygen diffusion and matrix permeability. The
cumulative oil production at standard condition, as a function of oxygen diffusion and matrix permeability, is shown in
Fig. 4. Values for matrix permeability and oxygen diffusion coefficient are presented in Table 3. Permeability in the
fracture was 1.27e6 md in all cases. This figure reflects the extinction or propagation of the combustion front. The x
and y axes indicate the ratios of oxygen diffusion coefficient and permeability to their respective reference value (the
reference being the base case). The base case corresponds to maximum oxygen diffusion and matrix permeability
(Kumar’s experiment). In this figure, zero production means that the combustion is not sustained, however, in such
case there is a small amount of production due to natural gravity drainage.

8
From Fig. 4 it is evident that whether combustion sustains in the matrix strongly depends upon the oxygen diffusion
coefficient. When this coefficient is 50 times smaller than in the base case, the combustion front does not propagate
through the core. However if we reduce the permeability even 1000 times, the combustion is still sustained. On the
other hand, the diffusion coefficient does not have a significant influence on oil production while oil production
Table 3 — PERMEABILITY AND DIFFUSION COEFFICIENT VA LUES
mk (md) *
2OD (m2/s)
12700+ 0.667×10⁻⁵+
1270 0.667×10⁻⁶
245 0.133×10⁻⁶
127 0.667×10⁻⁷
24.5 0.133×10⁻⁸
12.7 0.667×10⁻⁸
+: Reference case
Fig. 4 — Propagation/ extinction diagram.
Table 2 — DIMENSIONS OF THE SIMULATION MODEL
Dimensions (m) [x, y, z] Blocks number [x , y , z] ∆xf (m)* ∆xm (m) ∆zm (m) ∆zf (m)
[0.064, 0.0488, 0.51] [13, 1, 37] 0.002 0.0067 0.015 0.015
*f, m: fracture and matrix respectively
10 0
10 -1
10 -2
10 -3
10 0
10 -1
10 -2
10 -3
0
1
2
3
D/Dref
K/Kref
NP, m3
10-4
9
decreases sharply if we reduce the permeability 10 times. Some preliminary tests showed that for some cases where
combustion does not occur, changing the initial condition may lead to propagation of combustion. Examples of such
changes in initial condition are a higher injection rate, a longer initial heating time or more oil saturation in the first
block.
Oil production mechanisms in a fractured reservoir under ISC
In order to distinguish the effect of each driving force during the ISC process, we have tried to study the effect of
each mechanism separately whenever it was possible.
Natural gravity drainage
To study the effect of gravity we kept the same geometry as for the base case, removing all reactions and let the
system drain by gravity. Oil production under only gravity drainage was very slow and less than 8% of oil was
produced during 20 hours which is a typical burning time in the ISC process. So the natural gravity drainage is unlikely
to be of economical interest.
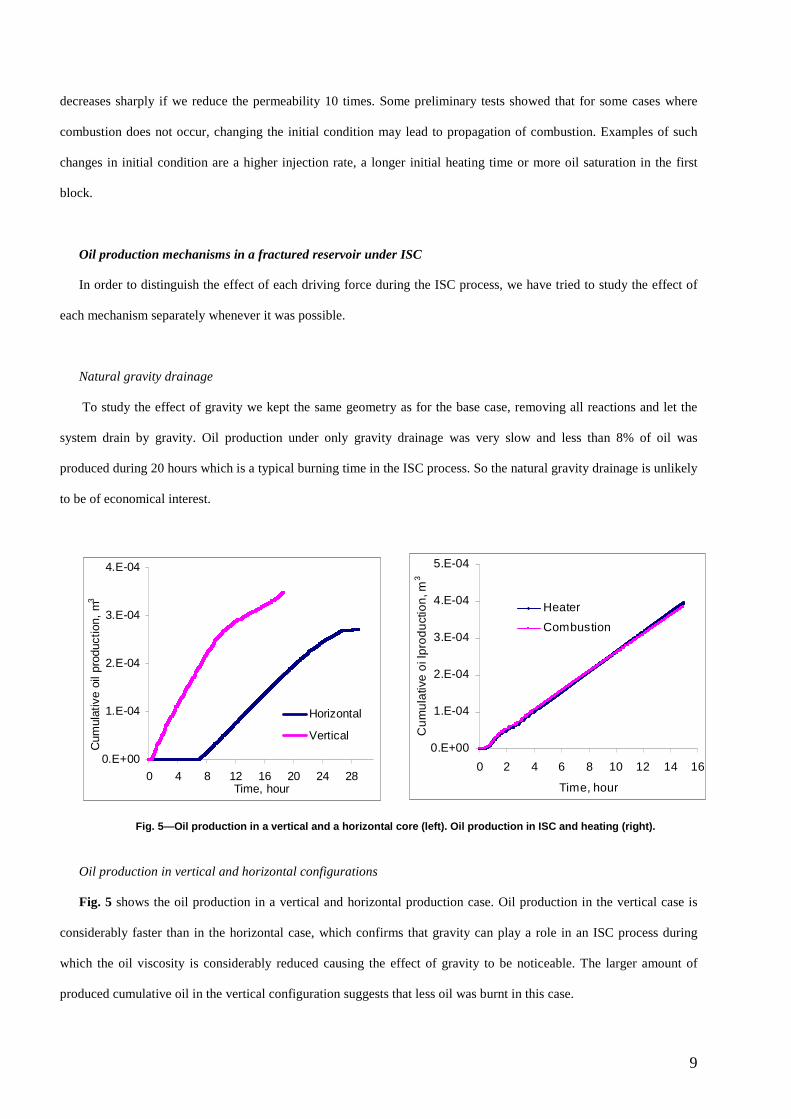
Oil production in vertical and horizontal configurations
Fig. 5 shows the oil production in a vertical and horizontal production case. Oil production in the vertical case is
considerably faster than in the horizontal case, which confirms that gravity can play a role in an ISC process during
which the oil viscosity is considerably reduced causing the effect of gravity to be noticeable. The larger amount of
produced cumulative oil in the vertical configuration suggests that less oil was burnt in this case.
0.E+00
1.E-04
2.E-04
3.E-04
4.E-04
0 4 8 12 16 20 24 28Time, hour
Cum
ulat
ive
oil p
rodu
ctio
n, m
3
Horizontal
Vertical
0.E+00
1.E-04
2.E-04
3.E-04
4.E-04
5.E-04
0 2 4 6 8 10 12 14 16
Time, hour
Cu
mu
lativ
e o
i lpr
od
uct
ion
, m3
Heater
Combustion
Fig. 5—Oil production in a vertical and a horizonta l core (left). Oil production in ISC and heating (r ight).
10
Oil production via ISC and programmed heating
We carried out a simulation study during which the temperature observed in an ISC process in a core was applied
by external heaters to another core while all reactions were removed from the model. The cumulative oil production by
programmed heating after 15 hours (Fig. 5) is slightly greater than that for ISC (2%). This indicates that temperature
effects are predominant factors for oil production and that non-thermal effects, such as differential pressure generation
during ISC, do not play a major role. This may also be explained by the fact that the pressure gradient generated during
ISC will be released because of high matrix permeability, initial gas saturation (18%) and the presence of fractures.
Conclusion of this part
Simulation results show that in-situ combustion is feasible for a fractured porous medium at core-scale. The peak
temperature and the extent of the coke zone were increased during the process while these two parameters are rather
constant during conventional in situ combustion. Oxygen diffusion coefficient was found to have a major influence on
extinction/ propagation of combustion and matrix permeability to play an important role in oil production. Considering
the characteristics of the porous matrix for the base-case, the simulation results showed that more fuel was consumed
during ISC in a fractured system than in a non-fractured case. Gravity drainage, when ISC is present, and thermal
effects were found to be important contributing mechanisms in oil production. Any possible pressure gradient
generation in the matrix block during the ISC process seems to have a minor effect on oil production. A small pressure
gradient in the fracture is enough to make fluids flow toward a producing well or adjacent fracture.
Simulation of ISC process in a single matrix block
Model
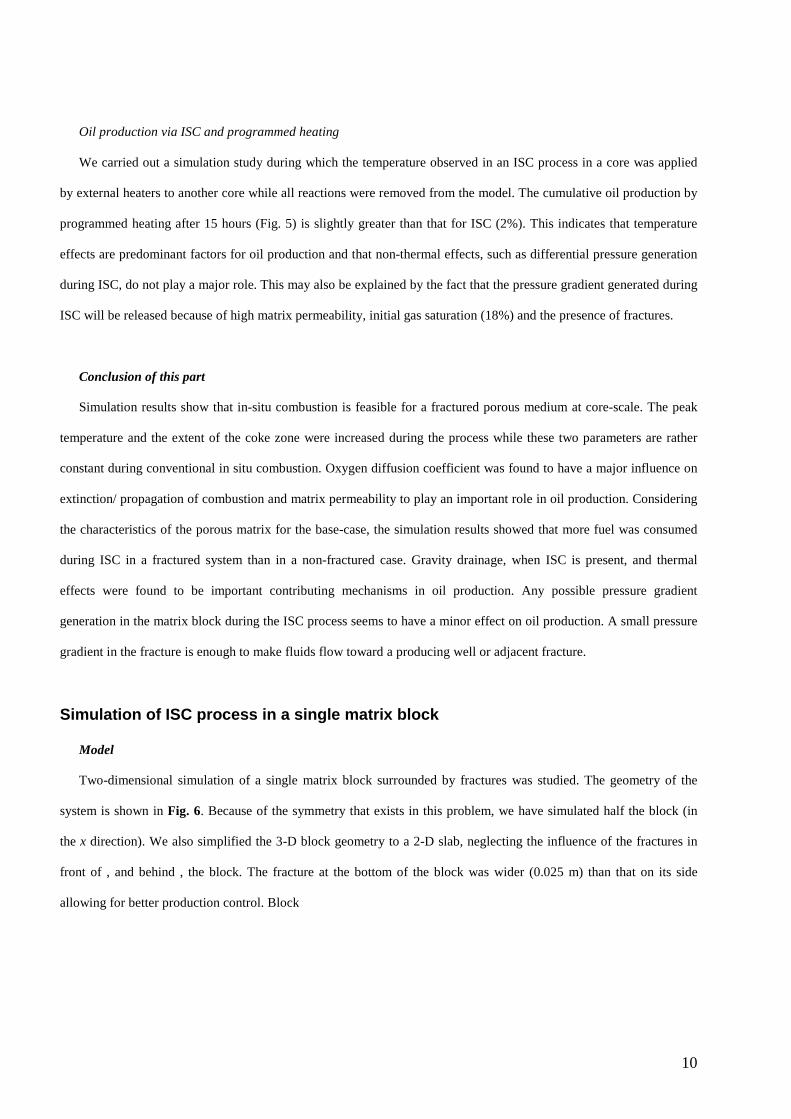
Two-dimensional simulation of a single matrix block surrounded by fractures was studied. The geometry of the
system is shown in Fig. 6. Because of the symmetry that exists in this problem, we have simulated half the block (in
the x direction). We also simplified the 3-D block geometry to a 2-D slab, neglecting the influence of the fractures in
front of , and behind , the block. The fracture at the bottom of the block was wider (0.025 m) than that on its side
allowing for better production control. Block
11
Fig. 6— Schematic of a model used for single block simulation.
Dimensions in x, y and z directions were 1, 0.05 and 0.5 (m) respectively. The matrix block was discretized by
16×16 grid blocks in x and z directions and two grid blocks were considered for fractures which resulted in a 20*20
simulation grid. The same reservoir properties, initial condition and reaction scheme were used as in the previous part
except that here oil was made more viscous at initial reservoir condition (4000 cp). Air was injected onto the fracture
from the top-left and oil was produced also from the fracture at the bottom-left of the simulation domain. Heat losses to
the block surroundings were considered to be zero.
Some observations of the combustion process in a single block
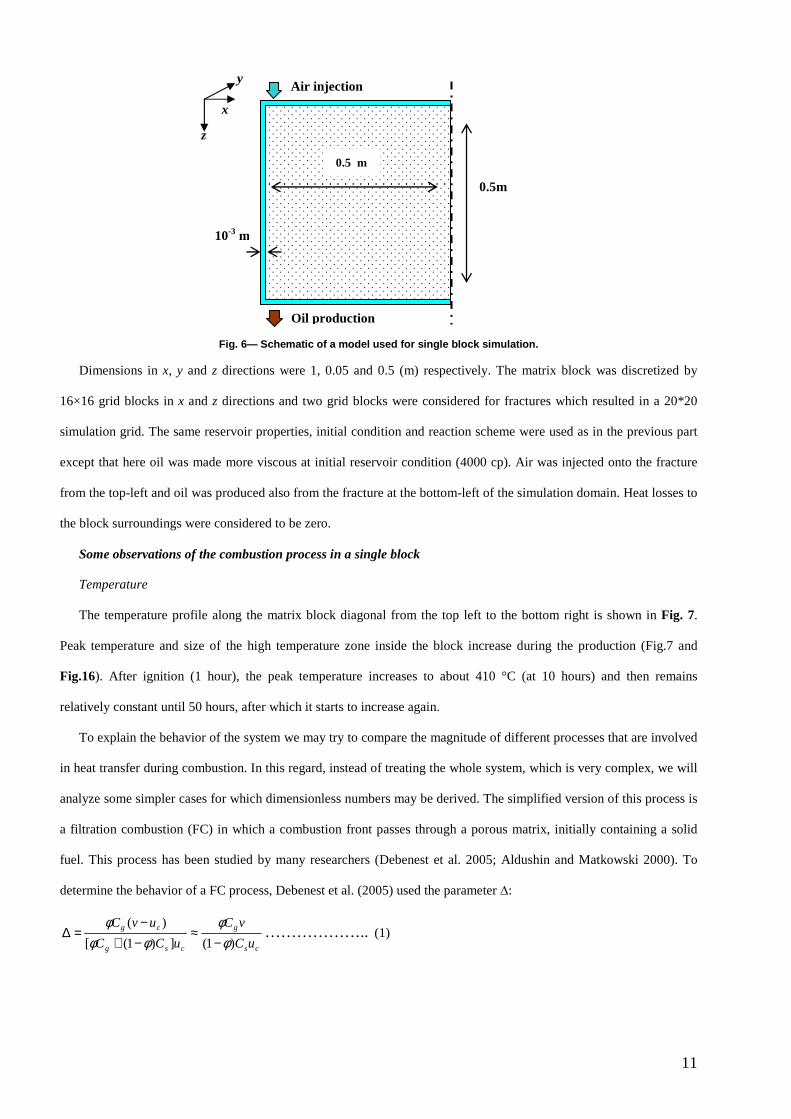
Temperature
The temperature profile along the matrix block diagonal from the top left to the bottom right is shown in Fig. 7.
Peak temperature and size of the high temperature zone inside the block increase during the production (Fig.7 and
Fig.16). After ignition (1 hour), the peak temperature increases to about 410 °C (at 10 hours) and then remains
relatively constant until 50 hours, after which it starts to increase again.
To explain the behavior of the system we may try to compare the magnitude of different processes that are involved
in heat transfer during combustion. In this regard, instead of treating the whole system, which is very complex, we will
analyze some simpler cases for which dimensionless numbers may be derived. The simplified version of this process is
a filtration combustion (FC) in which a combustion front passes through a porous matrix, initially containing a solid
fuel. This process has been studied by many researchers (Debenest et al. 2005; Aldushin and Matkowski 2000). To
determine the behavior of a FC process, Debenest et al. (2005) used the parameter ∆:
cs
g
csg
cg
uC
vC
uCC
uvC
)1(])1([
)(
φφ
φφφ
−≈
−+−
=∆ ……………….. (1)
0.5m
0.5 m
10-3 m
Air injection
Oil production
x
y
z
12
Fig. 7— Temperature along the block diagonal at dif ferent times for k=1270 md.
When ∆>1, heat is transferred from upstream (behind the front) to downstream (ahead of the front) by convective
gas flow. ∆=1 corresponds to a situation where heat remains in the vicinity of the reaction front and when ∆<1 there is
no convective heat transfer from upstream to downstream. This analysis is based on the hypothesis that the dominant
heat flow regime is gas convection. In our case, however, we expect that heat conduction is also significant.
To start the analysis we may write the energy balance equation in the form used by Aldushin and Matkowski (2000)
for a 1-D system of solid-gas combustion in a coordinate system that is moving with the combustion front:
2
2
)(x
Tk
x
TvC
t
Tu
t
TC eqggcP ∂
∂=∂∂+
∂∂−
∂∂ φ ………………. (2)
gsP CCC φφ +−= )1( ………………………………. (3)
This energy balance is written in 1-D for a region near the combustion front. Upstream of the front the fluid is in a
gas phase and downstream at the vicinity of the combustion front the oil saturation is equal or less than its residual
saturation and no water is present due to high temperature. Under this condition it is reasonable to consider only solid
and gas phase in the energy equation.
Choose the following dimensionless variables:
L
xX = ,
*t
t=τ , cu
Lt =* ,
refT
T=θ ………………… (4)
Here L is the length of the matrix and t* is the time for combustion to travel the matrix length. Usually the gas
phase heat capacity is negligible compared to solid phase heat capacity in Eq.3. Thus the equivalent heat capacity is:
sP CC )1( φ−≈
13
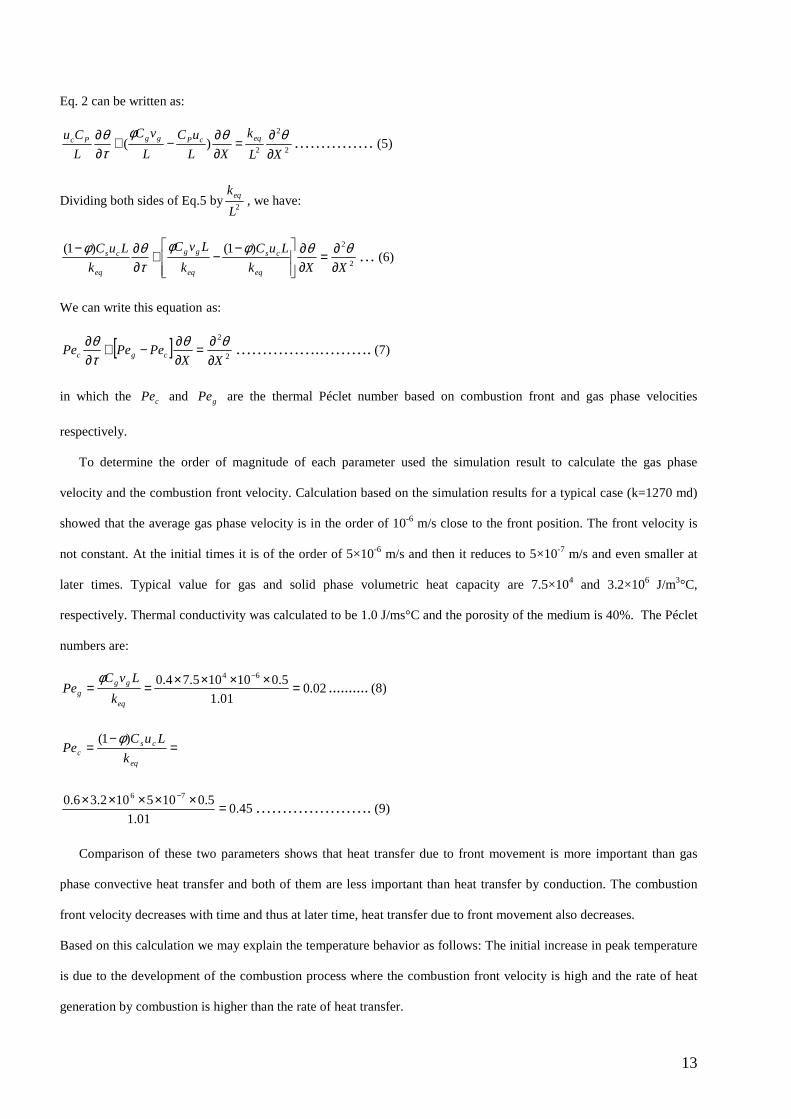
Eq. 2 can be written as:
2
2
2)(
XL
k
XL
uC
L
vC
L
Cu eqcPggPc
∂∂=
∂∂−+
∂∂ θθφ
τθ …………… (5)
Dividing both sides of Eq.5 by2L
keq , we have:
2
2)1()1(
XXk
LuC
k
LvC
k
LuC
eq
cs
eq
gg
eq
cs
∂∂=
∂∂
−−+
∂∂− θθφφ
τθφ … (6)
We can write this equation as:
[ ]2
2
XXPePePe cgc ∂
∂=∂∂−+
∂∂ θθ
τθ …………….………. (7)
in which the cPe and gPe are the thermal Péclet number based on combustion front and gas phase velocities
respectively.
To determine the order of magnitude of each parameter used the simulation result to calculate the gas phase
velocity and the combustion front velocity. Calculation based on the simulation results for a typical case (k=1270 md)
showed that the average gas phase velocity is in the order of 10-6 m/s close to the front position. The front velocity is
not constant. At the initial times it is of the order of 5×10⁻⁶ m/s and then it reduces to 5×10⁻⁷ m/s and even smaller at
later times. Typical value for gas and solid phase volumetric heat capacity are 7.5×10⁴ and 3.2×10⁶ J/m3°C,
respectively. Thermal conductivity was calculated to be 1.0 J/ms°C and the porosity of the medium is 40%. The Péclet
numbers are:
02.001.1
5.010105.74.0 64
=××××==−
eq
ggg k
LvCPe
φ.......... (8)
=−
=eq
csc k
LuCPe
)1( φ
45.001.1
5.0105102.36.0 76
=××××× −
…………………. (9)
Comparison of these two parameters shows that heat transfer due to front movement is more important than gas
phase convective heat transfer and both of them are less important than heat transfer by conduction. The combustion
front velocity decreases with time and thus at later time, heat transfer due to front movement also decreases.
Based on this calculation we may explain the temperature behavior as follows: The initial increase in peak temperature
is due to the development of the combustion process where the combustion front velocity is high and the rate of heat
generation by combustion is higher than the rate of heat transfer.
14
Subsequently the relatively constant temperature suggests that the heat produced by the combustion process is
transported mainly by conduction to the colder parts of the block. Finally when the heat front reaches the symmetric
no-flow boundary on the right side of matrix block, peak temperature starts to increase as conduction heat transfer is
limited by this boundary.
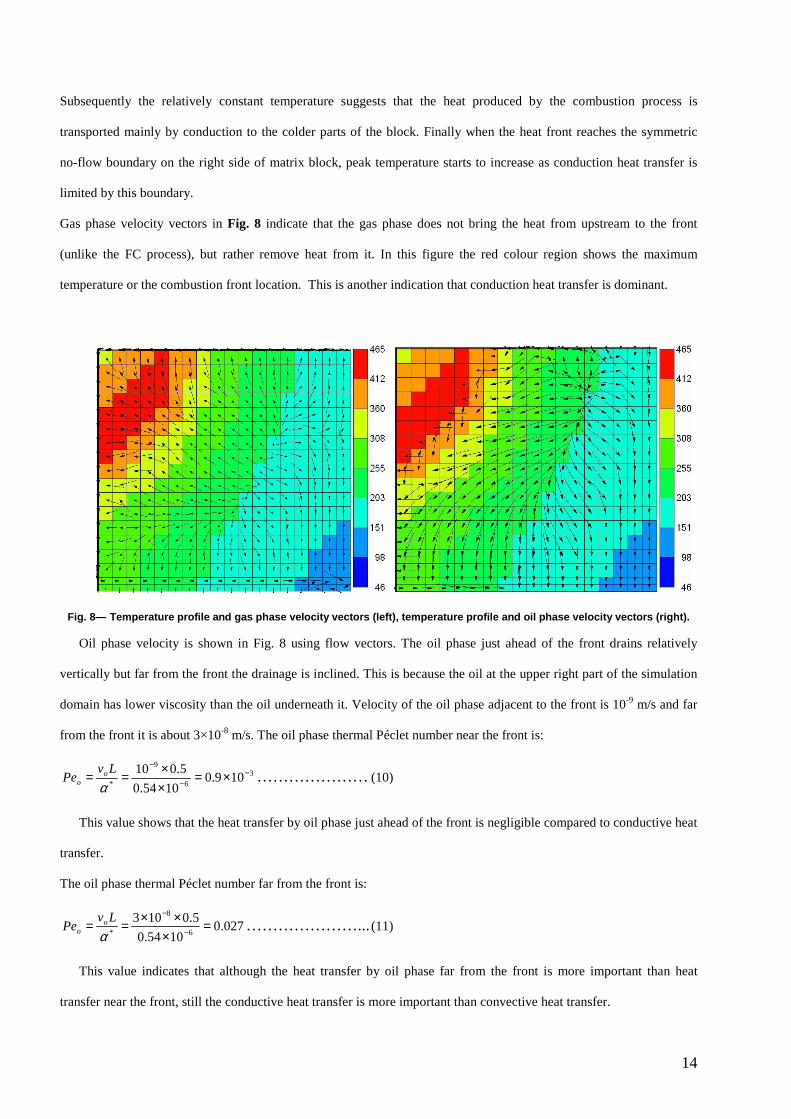
Gas phase velocity vectors in Fig. 8 indicate that the gas phase does not bring the heat from upstream to the front
(unlike the FC process), but rather remove heat from it. In this figure the red colour region shows the maximum
temperature or the combustion front location. This is another indication that conduction heat transfer is dominant.
Fig. 8— Temperature profile and gas phase velocity vectors (left), temperature profile and oil phase velocity vectors (right).
Oil phase velocity is shown in Fig. 8 using flow vectors. The oil phase just ahead of the front drains relatively
vertically but far from the front the drainage is inclined. This is because the oil at the upper right part of the simulation
domain has lower viscosity than the oil underneath it. Velocity of the oil phase adjacent to the front is 10-9 m/s and far
from the front it is about 3×10⁻⁸ m/s. The oil phase thermal Péclet number near the front is:
36
9
*109.0
1054.0
5.010 −−
−
×=××==
αLv
Pe oo ………………… (10)
This value shows that the heat transfer by oil phase just ahead of the front is negligible compared to conductive heat
transfer.
The oil phase thermal Péclet number far from the front is:
027.01054.0
5.01036
8
*=
×××== −
−
αLv
Pe oo …………………... (11)
This value indicates that although the heat transfer by oil phase far from the front is more important than heat
transfer near the front, still the conductive heat transfer is more important than convective heat transfer.
15
Considering an oxygen diffusion coefficient equal to 0.67×10⁻⁵ m2/s and a characteristic length of 0.5 m for the
matrix, the Péclet number for the gas phase is:
08.01067.0
5.0105
6
*=
××== −
−
D
LvPe g
g ………………… (12)
This value shows that the process of oxygen delivery to the combustion front is also diffusion dominated.
Péclet number in the fracture:
Gas phase velocity inside the fracture is in the order of 10-3 m/s. The Péclet number in the fracture is:
5010
5.0105
3
*=×== −
−
D
LvPe g
g ………………………... (13)
which shows that the oxygen transport in the fracture is convection dominated.
To calculate the thermal Péclet number inside the fracture we consider the air heat capacity and thermal
conductivity as 7.5×10⁴ J/m3°C and 4×10⁻² J/ms°C. The thermal Péclet number is then:
52
4
10104
5.0105.7 ≈×
××== −g
ggg k
LvCPe ………………... (14)
These calculations show that the main transport mechanism for both heat and mass in the fracture is convection.
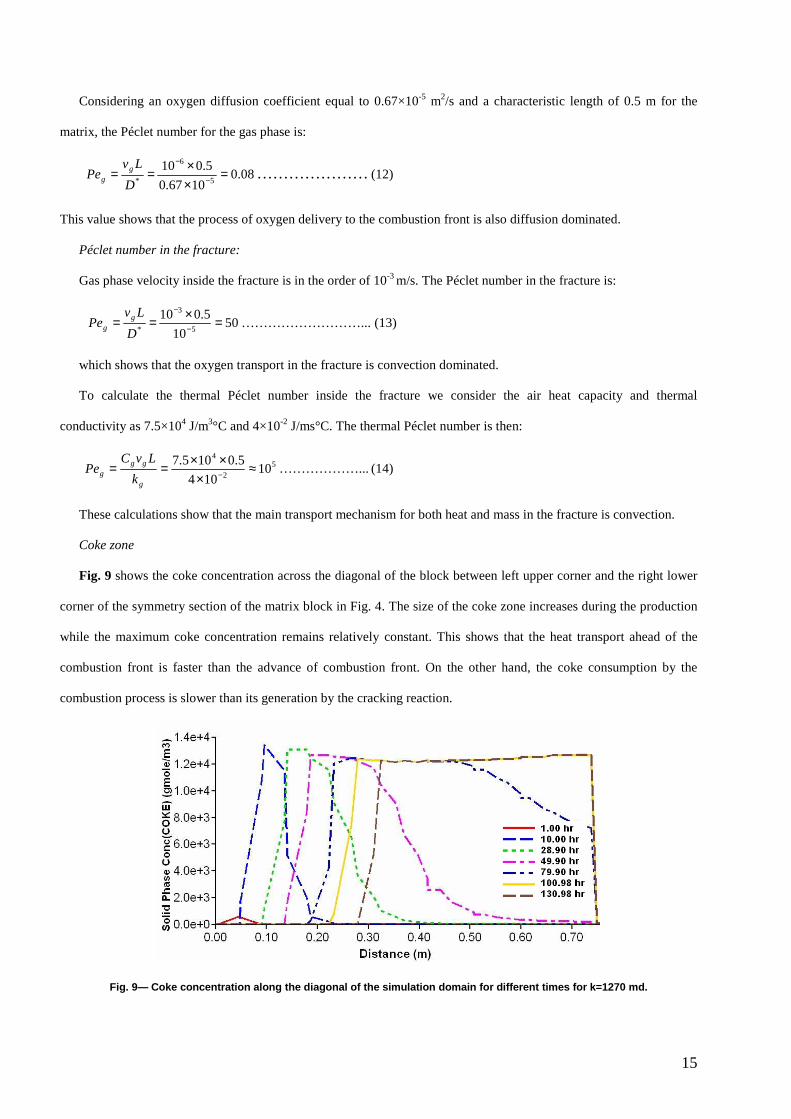
Coke zone
Fig. 9 shows the coke concentration across the diagonal of the block between left upper corner and the right lower
corner of the symmetry section of the matrix block in Fig. 4. The size of the coke zone increases during the production
while the maximum coke concentration remains relatively constant. This shows that the heat transport ahead of the
combustion front is faster than the advance of combustion front. On the other hand, the coke consumption by the
combustion process is slower than its generation by the cracking reaction.
Fig. 9— Coke concentration along the diagonal of th e simulation domain for different times for k=1270 md.
16
It is important to mention that values for coke concentration may not be necessarily generalized, but our aim here is
mainly to show how the extent of the coke zone evolves during the ISC process. Another important point is that the
coke concentration also depends to the reaction scheme and it may vary for different oils.
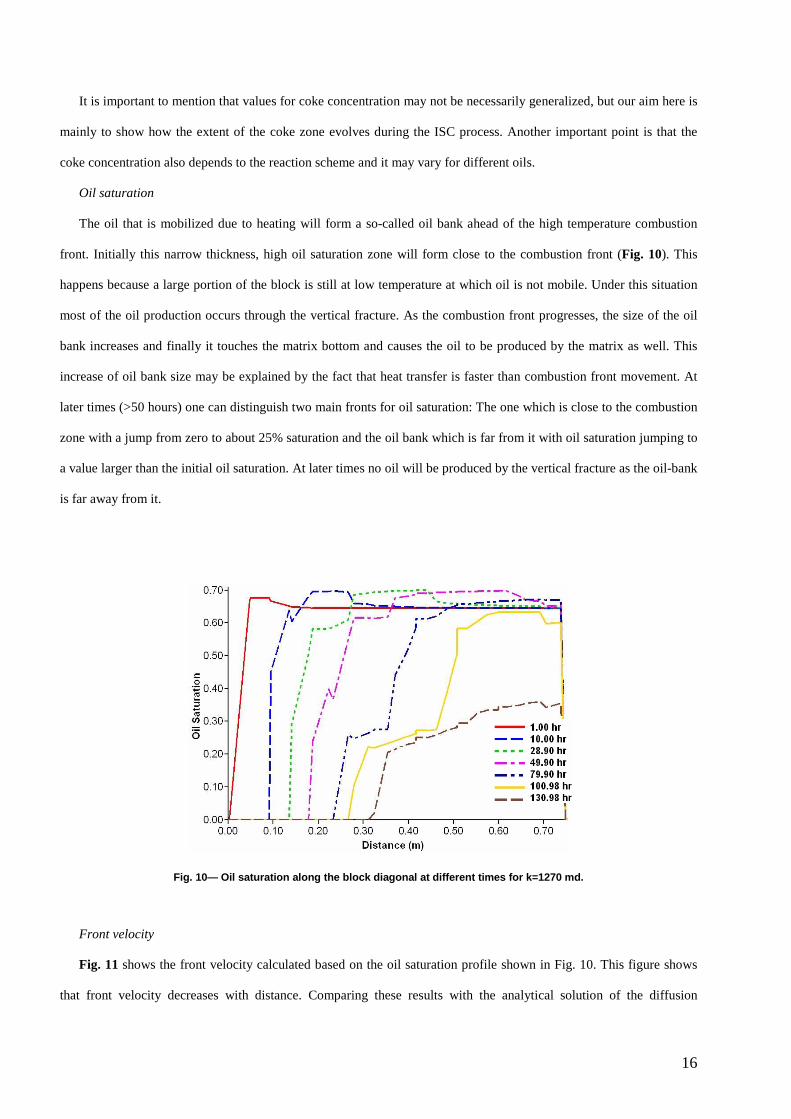
Oil saturation
The oil that is mobilized due to heating will form a so-called oil bank ahead of the high temperature combustion
front. Initially this narrow thickness, high oil saturation zone will form close to the combustion front (Fig. 10). This
happens because a large portion of the block is still at low temperature at which oil is not mobile. Under this situation
most of the oil production occurs through the vertical fracture. As the combustion front progresses, the size of the oil
bank increases and finally it touches the matrix bottom and causes the oil to be produced by the matrix as well. This
increase of oil bank size may be explained by the fact that heat transfer is faster than combustion front movement. At
later times (>50 hours) one can distinguish two main fronts for oil saturation: The one which is close to the combustion
zone with a jump from zero to about 25% saturation and the oil bank which is far from it with oil saturation jumping to
a value larger than the initial oil saturation. At later times no oil will be produced by the vertical fracture as the oil-bank
is far away from it.
Fig. 10— Oil saturation along the block diagonal at different times for k=1270 md.
Front velocity
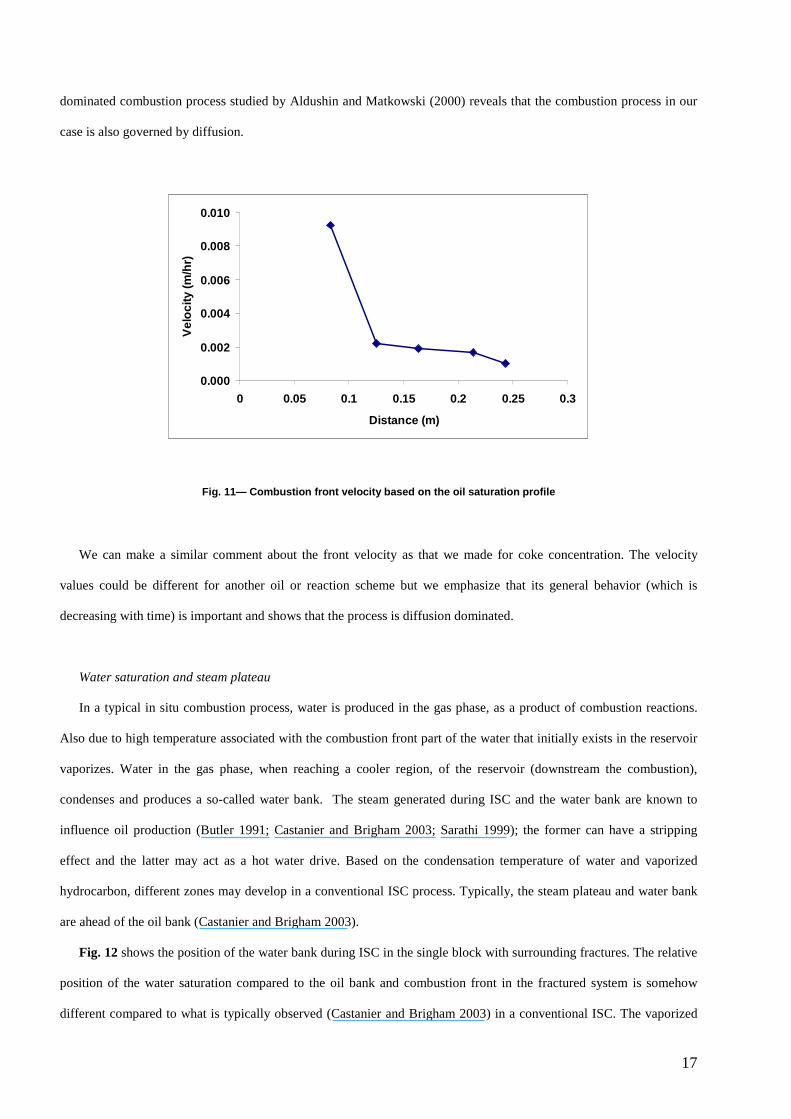
Fig. 11 shows the front velocity calculated based on the oil saturation profile shown in Fig. 10. This figure shows
that front velocity decreases with distance. Comparing these results with the analytical solution of the diffusion
17
dominated combustion process studied by Aldushin and Matkowski (2000) reveals that the combustion process in our
case is also governed by diffusion.
0.000
0.002
0.004
0.006
0.008
0.010
0 0.05 0.1 0.15 0.2 0.25 0.3
Distance (m)
Vel
ocity
(m/h
r)
Fig. 11— Combustion front velocity based on the oil saturation profile
We can make a similar comment about the front velocity as that we made for coke concentration. The velocity
values could be different for another oil or reaction scheme but we emphasize that its general behavior (which is
decreasing with time) is important and shows that the process is diffusion dominated.
Water saturation and steam plateau
In a typical in situ combustion process, water is produced in the gas phase, as a product of combustion reactions.
Also due to high temperature associated with the combustion front part of the water that initially exists in the reservoir
vaporizes. Water in the gas phase, when reaching a cooler region, of the reservoir (downstream the combustion),
condenses and produces a so-called water bank. The steam generated during ISC and the water bank are known to
influence oil production (Butler 1991; Castanier and Brigham 2003; Sarathi 1999); the former can have a stripping
effect and the latter may act as a hot water drive. Based on the condensation temperature of water and vaporized
hydrocarbon, different zones may develop in a conventional ISC process. Typically, the steam plateau and water bank
are ahead of the oil bank (Castanier and Brigham 2003).
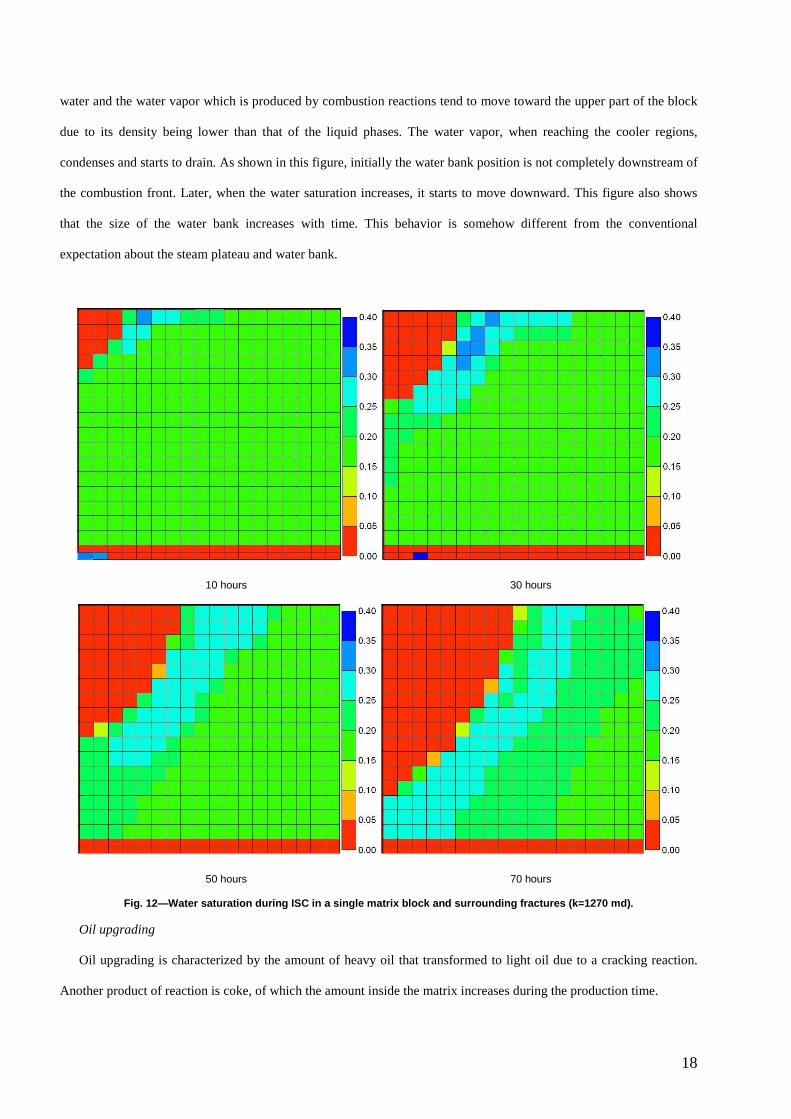
Fig. 12 shows the position of the water bank during ISC in the single block with surrounding fractures. The relative
position of the water saturation compared to the oil bank and combustion front in the fractured system is somehow
different compared to what is typically observed (Castanier and Brigham 2003) in a conventional ISC. The vaporized
18
water and the water vapor which is produced by combustion reactions tend to move toward the upper part of the block
due to its density being lower than that of the liquid phases. The water vapor, when reaching the cooler regions,
condenses and starts to drain. As shown in this figure, initially the water bank position is not completely downstream of
the combustion front. Later, when the water saturation increases, it starts to move downward. This figure also shows
that the size of the water bank increases with time. This behavior is somehow different from the conventional
expectation about the steam plateau and water bank.
10 hours 30 hours
50 hours 70 hours
Fig. 12—Water saturation during ISC in a single mat rix block and surrounding fractures (k=1270 md).
Oil upgrading
Oil upgrading is characterized by the amount of heavy oil that transformed to light oil due to a cracking reaction.
Another product of reaction is coke, of which the amount inside the matrix increases during the production time.
19
Cracking reactions occur in two different temperature ranges. Heavy oil cracking that takes place below 350°C
called visbreaking which reduces the oil viscosity. The high temperature cracking produces coke and light hydrocarbon
(Audibert and Monin 1985; Castanier and Brigham 2003). However low temperature oxidation reactions that occur at
temperature below 350°C, produce some complex components with high viscosity. Thus the oil upgrading is a result
of the combination of all these different reactions.
Experimental study of ISC in a fractured core (Greaves et al. 1985) showed significant upgrading of Wolf Lake oil
with enriched air (32% oxygen in air). With normal air, the API gravity of the oil was increased by 3 degrees.
Application of ISC at field scale showed an oil upgrading as much as 6° API (Ramey et al 1992). In an attempt for in
situ upgrading Atabasca bitumen, Xu et al. (2001) found that low temperature oxidation followed by temperature
increase (i.e. steam injection) can significantly reduce viscosity. An experimental study done by Xia and Greaves
(2001) on bitumen applying a SARA-based analysis, showed signification increase (8°) in oil API gravity. Castanier
and Brigham (2003) proposed sulphur removal by using some water soluble additives. A review of possible upgrading
process can also be found in their work. In another work on comparison between ISC and steam distillation of two
Canadian crudes, Freitag et al. (2006) have reported that, opposite to common belief, before steam breakthrough, the
properties of the produced oil are much more influenced by steam distillation than by cracking reactions. They also
found that increases in the recovery due to a combustion front effect were much more pronounced for the heavier oil
than those due to steam (79% higher compared to steam flooding recovery for Wolf Lake).
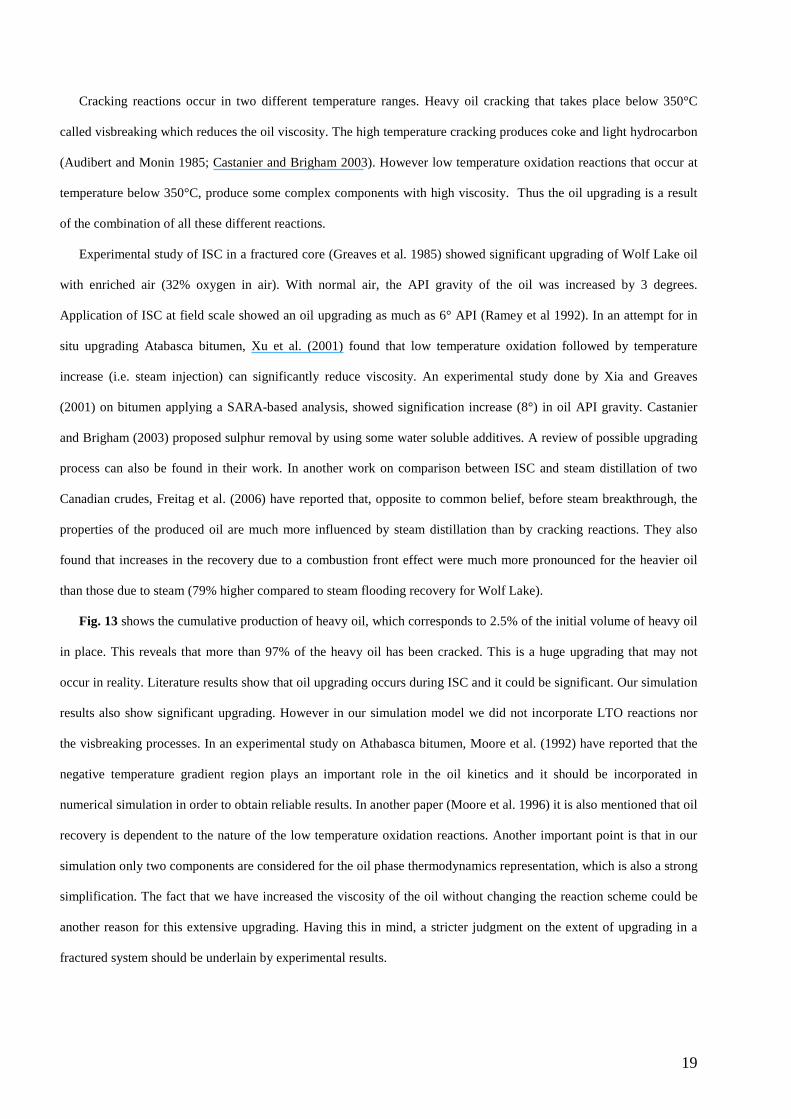
Fig. 13 shows the cumulative production of heavy oil, which corresponds to 2.5% of the initial volume of heavy oil
in place. This reveals that more than 97% of the heavy oil has been cracked. This is a huge upgrading that may not
occur in reality. Literature results show that oil upgrading occurs during ISC and it could be significant. Our simulation
results also show significant upgrading. However in our simulation model we did not incorporate LTO reactions nor
the visbreaking processes. In an experimental study on Athabasca bitumen, Moore et al. (1992) have reported that the
negative temperature gradient region plays an important role in the oil kinetics and it should be incorporated in
numerical simulation in order to obtain reliable results. In another paper (Moore et al. 1996) it is also mentioned that oil
recovery is dependent to the nature of the low temperature oxidation reactions. Another important point is that in our
simulation only two components are considered for the oil phase thermodynamics representation, which is also a strong
simplification. The fact that we have increased the viscosity of the oil without changing the reaction scheme could be
another reason for this extensive upgrading. Having this in mind, a stricter judgment on the extent of upgrading in a
fractured system should be underlain by experimental results.
20
0
0.5
1
1.5
2
2.5
0 50 100 150 200
Time, hour
Hea
vy o
il pr
oduc
ed, %
of i
nitia
l Hea
vy
oil i
n pl
ace
Fig. 13— Cumulative volume of heavy oil produced as a fract ion of initial volume, both measured at standard co ndition.
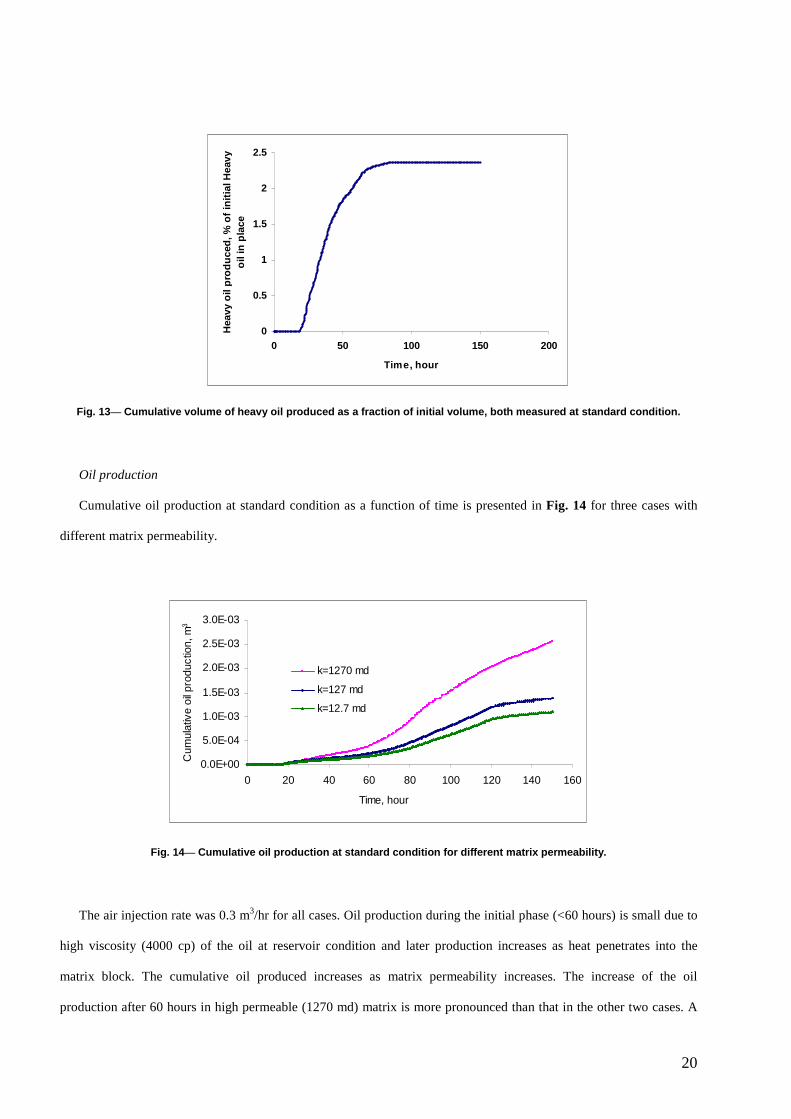
Oil production
Cumulative oil production at standard condition as a function of time is presented in Fig. 14 for three cases with
different matrix permeability.
0.0E+00
5.0E-04
1.0E-03
1.5E-03
2.0E-03
2.5E-03
3.0E-03
0 20 40 60 80 100 120 140 160
Time, hour
Cum
ulat
ive
oil p
rodu
ctio
n, m
3
k=1270 md
k=127 md
k=12.7 md
Fig. 14— Cumulative oil production at standard condition fo r different matrix permeability.
The air injection rate was 0.3 m3/hr for all cases. Oil production during the initial phase (<60 hours) is small due to
high viscosity (4000 cp) of the oil at reservoir condition and later production increases as heat penetrates into the
matrix block. The cumulative oil produced increases as matrix permeability increases. The increase of the oil
production after 60 hours in high permeable (1270 md) matrix is more pronounced than that in the other two cases. A
21
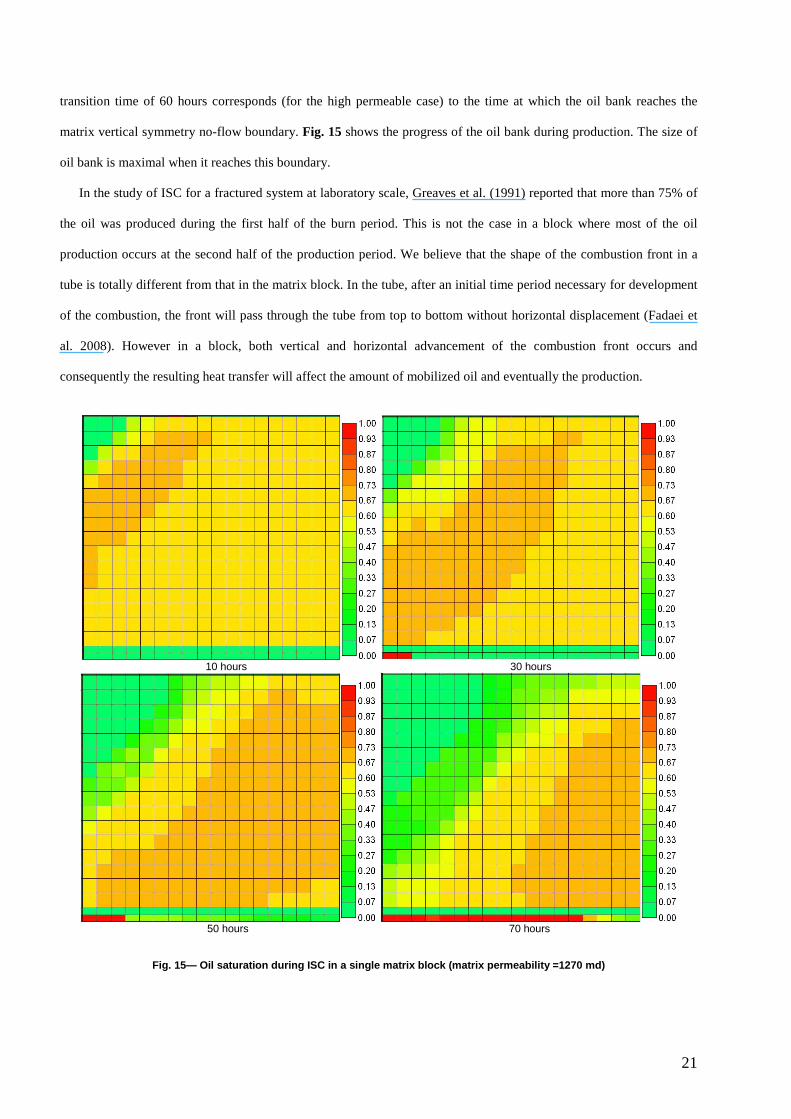
transition time of 60 hours corresponds (for the high permeable case) to the time at which the oil bank reaches the
matrix vertical symmetry no-flow boundary. Fig. 15 shows the progress of the oil bank during production. The size of
oil bank is maximal when it reaches this boundary.
In the study of ISC for a fractured system at laboratory scale, Greaves et al. (1991) reported that more than 75% of
the oil was produced during the first half of the burn period. This is not the case in a block where most of the oil
production occurs at the second half of the production period. We believe that the shape of the combustion front in a
tube is totally different from that in the matrix block. In the tube, after an initial time period necessary for development
of the combustion, the front will pass through the tube from top to bottom without horizontal displacement (Fadaei et
al. 2008). However in a block, both vertical and horizontal advancement of the combustion front occurs and
consequently the resulting heat transfer will affect the amount of mobilized oil and eventually the production.
10 hours 30 hours
50 hours 70 hours
Fig. 15— Oil saturation during ISC in a single matr ix block (matrix permeability =1270 md)
22
Conclusion
Simulation of ISC at matrix block scale showed that the underlying process is diffusion dominated both for heat and
mass (i.e. oxygen) transfer. Heat transfer due to the movement of the combustion front velocity is slow compared to
heat transfer by conduction; this is the reason for the observed increase of combustion front temperature during the
process. In this multi front process, different zones can be distinguished for oil saturation and temperature with sizes
that vary over time. The relative size of the heat and saturation zones and the change of their size during the burning
process suggest that any up-scaling method should take into account these phenomena. On the other hand, for a multi-
block situation, homogenizing the matrix block as a single node in the simulation model may introduce large errors as
the nature of the process inside the matrix is highly heterogeneous. More detailed mathematical manipulation is needed
to address this issue based on the characteristic length scale of the processes on-going in the matrix and the averaged
values of different parameters. We will address these issues in future work.
23
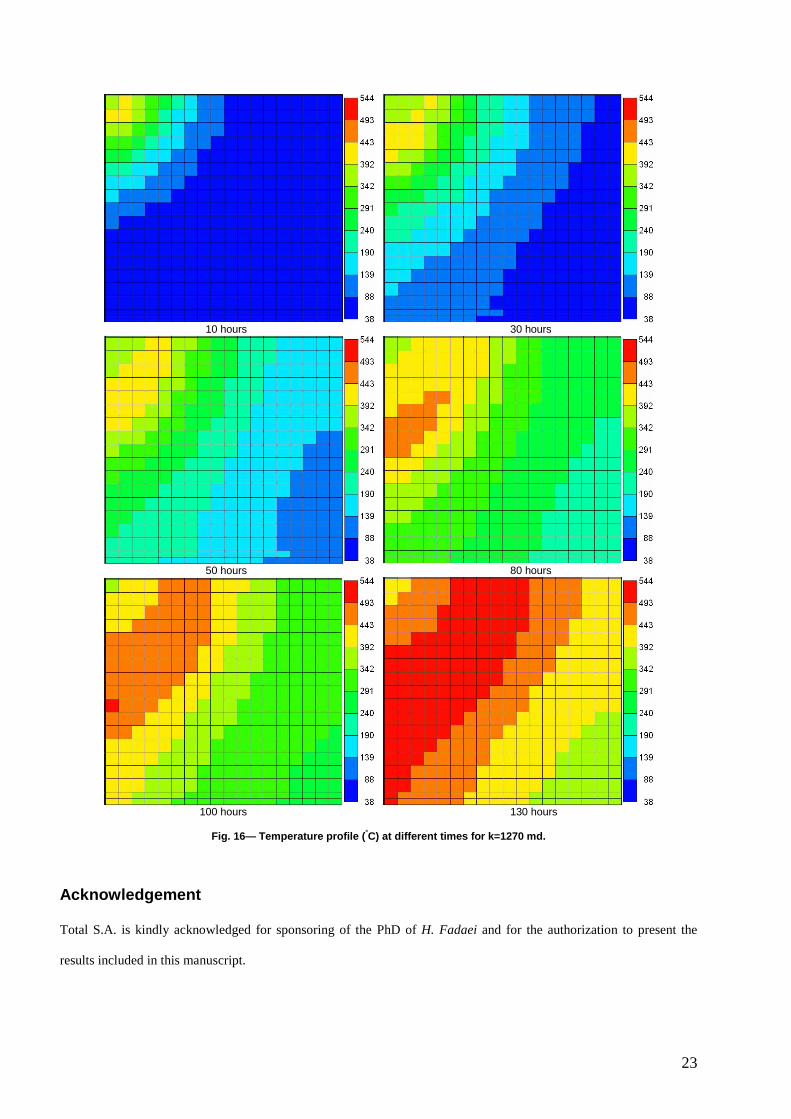
10 hours 30 hours
50 hours 80 hours
100 hours 130 hours
Fig. 16— Temperature profile ( °C) at different times for k=1270 md.
Acknowledgement
Total S.A. is kindly acknowledged for sponsoring of the PhD of H. Fadaei and for the authorization to present the
results included in this manuscript.

24
Nomenclature
gC Gas volumetric heat capacity, m/t2LT, J/m3.°C
SC Solid volumetric heat capacity, m/t2LT, J/m3.°C
PC Equivalent volumetric heat capacity, m/t2LT, J/m3.°C *D Effective mass diffusivity, L2/t, m2/s
k Absolute permeability, L2, md
eqk
Equivalent thermal conductivity, mL/t2T, W/m.°C
φ−= 1)(f
sfeq k
kkk
fk Fluid thermal conductivity, mL/t2T, W/m.°C )( wwggoof kSkSkSk ++= φ
sk Solid thermal conductivity, mL/t2T, W/m.°C
L Block characteristic length, L, m
Pe Péclet number *D
vLPe= or
*αvL
Pe=
S Saturation (%)
t Time, t, s
t* Characteristic time, t, s
T Temperature, T, °C
refT Reference temperature, T, °C
cu Combustion front velocity, L/t, m/s
gv Gas phase velocity, L/t, m/s
X Dimensionless distance
*α Effective heat diffusivityS
eq
C
k=*α , L2/t, m2/s,
θ Dimensionless temperature
τ Dimensionless time
φ Porosity
Subscripts
c: Combustion front o: Oil g: Gas s: Solid f: Fluid eq: Equivalent
References
Akin, S., Versan, K.M. and Bagci, S. 2000. Oxidation of Heavy Oil and Their SARA Fractions: Its Role in Modeling In-situ
Combustion. Paper SPE 63230 presented at the 2000 SPE Annual Technical Conference and Exhibition, Dallas, Texas, 1–4
October.
Aldushin, A.P. and Matkowsky, B.J. 2000. Diffusion Driven Combustion Waves in Porous Media. Combust. Sci. and Tech.
156: 221–250.
Audibert, A. and Monin, J.C. 1985. Laboratory Simulation of Thermal Changes of Heavy Crudes during Thermal Recovery.
Presented at the 3rd UNITAR (UNDP) Conference on Heavy Crudes and Tar Sands, Long Beach, U.S.A., July 22-31.
25
Awoleke, O.G. 2007. An Experimental Investigation of In-situ Combustion in Heterogeneous Porous Media. MS Thesis,
Stanford University., Palo Alto.
Butler, R.M. 1991. Thermal Recovery of Oil and Bitumen, Engelwood Cliffs, New Jersey: Prentice-Hall ECS Professional.
Castanier, L.M. and Brigham, W.E. 2003. Upgrading of Crude Oil via In-situ Combustion. Journal of Petroleum Science and
Engineering. 39: 125–136.
Castanier, L.M., Ramey H.J. Jr., and Brigham W.E. 1992. Thermal Recovery Research at Stanford University. Presented at the
VNIGRI Symposium on Enhanced Oil Recovery, St. Petersburg, Russia, 11-12 October.
Crawford, P.B and Chu, C. 1983. Improved oil recovery, Chapter VI, Interstate Oil Compact Commission, Oklahoma City,
Oklahoma.
Debenest, G., Mourzenko, V.V. and Thovert, J.F. 2005. Smoldering in Fixed Beds of Oil Shale Grains: Governing Parameters
and Global Regimes. Combustion Theory and Modeling. 2: 301–321.
Fadaei, H., Debenest, G., Kamp, A.M., Quintard, M. and Renard, G. 2008. Study of Heavy Oil Recovery from a Fractured
Carbonate Reservoir Using In-situ Combustion. Presented at the 11th European Conference on the Mathematics of Oil
Recovery, Bergen, Norway, 8 - 11 September.
Farogh Ali, S.M and Meldau, P.B. 1983. Improved oil recovery, Chapter VII, Interstate Oil Compact Commission, Oklahoma
City, Oklahoma.
Fassihi, M.R, Brigham, W. E., Ramey, H. J. Jr. 1984. Reaction Kinetics of In-situ Combustion. I: Observations, SPEJ, 24 (4):
399-407.
Freitag, N.P. and Exelby, D.R. 2006. SARA Based Model for Simulating Pyrolysis Reactions That Occur in High Temperature
EOR Processes. J. Cdn. Pet. Tech. 45 (3): 38-44.
Greaves, M., Javanmardi, J., and Field, W. 1991. In-situ Combustion in Fractured Heavy Oil Reservoir. Presented at the 6th,
European IOR-Symposium, Stavanger, Norway, May 21-23.
Greaves, M. and Turta, A. 2000. Oil Field In Situ Combustion Process, Canadian Patent No. 2,176,639.
Kumar, M. 1987. Simulation of Laboratory In-situ Combustion Data and Effect of Process Variation. Paper SPE16027
presented at the Ninth SPE Symposium on Reservoir Simulation, San Antonio, Texas, USA, February 1-4.
Lacroix, S., Delaplace, P., and Bourbiaux, B. 2004. Simulation of Air Injection in Light Oil Reservoir: Setting-Up a Predictive
Dual Porosity Model. Paper SPE 89931 presented at the SPE Annual Technical Conference and Exhibition held in Houston,
Texas, U.S.A., 26-29 September.
Miller, J.S and Ray, J. 1883. Laboratory Experiments Simulating Fire Flooding Through a Fractured Reservoir. United States
Department of Energy Report, DE 83009350, April.
Moore, R. G., Mehta, S. A., and Laureshen, C.J. 1998. Strategies for Successful Air Injection Based on IOR Processes. In
Proceedings of the 7th UNITAR International Conference on Heavy Oil and Tar Sands, Beijing, China, 27-30 October.
26
Moore, R.G., Belgrave, J.D.M., Mehta, R., Ursenbach, M., Laureshen, C.J. and Xi, K. 1992. Some Insights into the Low-
Temperature and High-Temperature In-situ Combustion Kinetics. Paper SPE/DOE 24174 presented at the Eighth Symposium
Enhanced Oil Recovery, Tulsa, Oklahoma, April 22-24.
Moore, R.G., Laureshen, C.J., Ursenbach, M., Mehta, R. and Belgrave, J.D.M. 1996. Combustion/Oxidation Behavior of
Athabasca Oil Sands Bitumen. Paper SPE 35392 presented at the Improved Oil Recovery Symposium held In Tulsa, Oklahoma,
April 21-24.
Pooladi Darvish, M. 1994. Steam Heating of Fractured Formation Containing Heavy Oil-Single Block Analysis. Paper SPE
28642 presented at the SPE 69th Annual Technical Conference and Exhibition, New Orleans, LA, U.S.A., 25-28 September.
Prats, M. 1982. Thermal Recovery. Monograph Series, SPE, AIME, New York.
Ramey, Jr., H.J., Stamp, V.V., and Pebdani, F.N. 1992. Case History of South Belridge, California, In-situ Combustion Oil
Recovery. Paper SPE 24200 presented at the 9th SPE/DOE EOR Symposium, Tulsa, 21-24 April.
Sarathi, P.S. 1999. In-situ Combustion Handbook -Principles and Practices. DOE/PC/91008-0374 Technical Report. National
Petroleum Technology Office, Tulsa, Oklahoma.
Sarkar, A.K. and Sarathi, P.S. 1993. Thermal Processes for Heavy Oil Recovery. Technical report. FC22-83FE60149, National
Institut for Petroleum and Energy Research, Bartlesville, Oklahoma.
Schulte, W.M. and de Vries, A.S. 1985. In-situ Combustion in Naturally Fractured Heavy Oil Reservoirs. SPEJ, 25 (1): 67-77.
STARS User's Guide, 2006, Advanced Process and Thermal Reservoir Simulator, Computer Modelling Group Ltd.
Tabasinejad, F., Karrat, R., and Vossoughi, S. 2006. Feasibility Study of In-situ Combustion in Naturally Fractured Heavy Oil
Reservoirs. Paper SPE 103969 presented at the First International Oil Conference and Exhibition, Cancun, Mexico, 31 August-
2 September.
Xia, T. X., Greaves, M. and Turta, A. 2005. Main Mechanism for Stability of THAI – Toe-to-Heel Air Injection, J. Cdn. Pet.
Tech. 44 (1): 42-48.
Xia, T.X. and Greaves, M., 2001. Down hole Upgrading Athabasca Tar Sand Bitumen Using THAI-SARA Analysis. Paper
SPE 69693 Presented at the Heavy Oil Operation Symposium, Porlamar, Venezuela, 12 March.
Xu, H.H., Okazawa, N.E., Moore, R.G, Laureshen, C.J., Ursenbach, J. and Mallory, D.H., 2001. In-situ Upgrading of Heavy
Oils. J. Cdn. Pet. Tech. 40 (8).
Related Documents


![Combustion and Flame - Home - Alexei A. Mailybaevalexei.impa.br/data/_uploaded/file/papers/2016... · [3], downward buoyant filtration combustion [4] and the advance of in-situ combustion](https://static.cupdf.com/doc/110x72/5e910c64098c6923ea742fd8/combustion-and-flame-home-alexei-a-3-downward-buoyant-iltration-combustion.jpg)