Project AIR FORCE R Prepared for the UNITED STATES AIR FORCE Approved for public release; distribution unlimited HOW SHOULD THE U.S. AIR FORCE DEPOT MAINTENANCE ACTIVITY GROUP BE FUNDED? INSIGHTS FROM EXPENDITURE AND FLYING HOUR DATA EDWARD G. KEATING FRANK CAMM

Welcome message from author
This document is posted to help you gain knowledge. Please leave a comment to let me know what you think about it! Share it to your friends and learn new things together.
Transcript

Project AIR FORCE
R
Prepared for the
UNITED STATES AIR FORCE
Approved for public release; distribution unlimited
HOW SHOULDTHE U.S.
AIR FORCEDEPOT
MAINTENANCEACTIVITY GROUP BE FUNDED?
INSIGHTS FROMEXPENDITURE AND FLYING HOUR DATA
EDWARD G. KEATINGFRANK CAMM

RAND is a nonprofit institution that helps improve policy anddecisionmaking through research and analysis. RAND® is aregistered trademark. RAND’s publications do not necessarily reflectthe opinions or policies of its research sponsors.
© Copyright 2002 RAND
All rights reserved. No part of this book may be reproduced in anyform by any electronic or mechanical means (includingphotocopying, recording, or information storage and retrieval)without permission in writing from RAND.
Published 2002 by RAND1700 Main Street, P.O. Box 2138, Santa Monica, CA 90407-2138
1200 South Hayes Street, Arlington, VA 22202-5050201 North Craig Street, Suite 202, Pittsburgh, PA 15213-1516
RAND URL: http://www.rand.org/To order RAND documents or to obtain additional information,
contact Distribution Services: Telephone: (310) 451-7002; Fax: (310) 451-6915; Email: [email protected]
Library of Congress Cataloging-in-Publication Data
Keating, Edward G. (Edward Geoffrey), 1965–How should the U.S. Air Force Depot Maintenance Activity Group be funded? :
insights from expenditures and flying hour data / Edward G. Keating, Frank Camm.
p. cm.“MR-1487.”Includes bibliographical references.ISBN 0-8330-3143-01. Depot Maintenance Activity Group (U.S.) 2.United States. Air Force—
Equipment—Maintenance and repair. 3. United States. Air Force—Operational readiness. 4. United States. Air Force—Appropriations and expenditures. I. Camm, Frank A., 1949– II. Title.
UG1103 .K43 2002358.4'175'0973—dc21
2002017938
The research reported here was sponsored by the United States AirForce under Contract F49642-01-C-0003. Further information maybe obtained from the Strategic Planning Division, Directorate ofPlans, Hq USAF.
iii
PREFACE
Despite much effort and high leadership visibility over the last sev-eral years, the U.S. Air Force continues to experience unacceptablylow mission capability (MC) rates for critical weapon systems andunexpectedly high support costs for these weapon systems at the endof each fiscal year. Multiple reviews over the last several years of thelogistics process that the U.S. Air Force uses to support its weaponsystems all agree that the process does not work well in its currentenvironment.1 It needs to change to meet the needs of a force andprocedures that are different from those in place when the processwas devised. Different reviews find different sources of problems.Taken together, the reviews point to two kinds of problems:
• Given the resources it is willing to commit to logistics activitiesand how its logistics process actually performs, the Air Force triesto do more with its operational weapon systems than its logisticssupport budgets allow.
______________ 1See, for example, Air Force Materiel Command Reparable Spares Management Board(Frank Camm, chair), Final Report, Wright-Patterson Air Force Base, Ohio, March1998. The following General Accounting Office reports offer a variety of corroboratingempirical evidence on the recent state of the Air Force depot management system: AirForce Supply Management: Analysis of Activity Group’s Financial Reports, Prices, andCash Management, GAO/AIMD/NSIAD-98-118, June 1998; Air Force Supply:Management Actions Create Spare Parts Shortages and Operational Problems,GAO/NSIAD/AIMD-99-77, April 1999; Air Force Depot Maintenance: Analysis of ItsFinancial Operations, GAO/AIMD/NSIAD-00-38, December 1999; and Air ForceDepot Maintenance: Budgeting Difficulties and Operational Inefficiencies,GAO/AIMD/NSIAD-00-185, August 2000.

iv How Should the U.S. Air Force Depot Maintenance Activity Group Be Funded?
• Given the resources it is willing to commit to logistics activities,the Air Force could improve how its logistics process performs.
The Air Force Directorate of Supply (AF/ILS) asked RAND to examinethe first kind of problem. When AF/ILS began the Spares Campaignin March 2001, it asked RAND to study particular issues. The RANDteam focused on improving procedures relevant to programmingand budgeting decisions for the depot-level logistics process for thefollowing reasons:
• Programming and budgeting decisions are related to problemsassociated with the level of funding available for logistics activi-ties designed to meet set weapon system availability targets.
• No matter how the Air Force tries to improve its logistics process,it will encounter adverse weapon system availability and costoutcomes unless its logistics programs and budgets reflect howthe logistics process will actually work during the program andbudget period. Getting these decisions right is a precondition toresolving other problems in the supply chain.
• Prices in working capital funds, which have been implicated insignificant disconnects between users and providers of depot-level logistics services, are an integral part of the Air Force bud-geting process. Any real change in the logistics budgeting pro-cess must address these disconnects.
• Success in using empirically based evaluation to close the loopon programming and budgeting decisions could point the way tobetter organizational relationships and better analytic ap-proaches, with implications for helping to close the loop on otherdecisions as well.
This report addresses a key element of the analysis undertaken inthis project. The Air Force Planning, Programming, and BudgetingSystem (PPBS) process today ultimately asks operating commands todevelop budgets for the depot-level support they will need. Such anapproach naturally raises the following question: How should thelevel of activity in an operating command in a particular future yearaddressed in the PPBS process be related to the actual costs that AirForce Materiel Command (AFMC) will have to cover in that year?The Air Force has evolved a system, commonly known as the

Preface v
“AFCAIG process,” to make this link. The Air Force Cost AnalysisImprovement Group (AFCAIG) coordinates the effort. But each yearover the last decade, the money that the operating commands haveprovided to cover AFMC costs has fallen short of costs. This outcomeis an integral part of the problem of “unexpectedly high supportcosts” mentioned in the first paragraph.
To provide an analytic context for understanding this problem, thestudy team sought a basic understanding of the link between operat-ing command activities and actual AFMC costs. As explained in thetext, the analysis focused on one key link to allow some precision:how costs in depot-level maintenance shops funded by the DepotMaintenance Activity Group (DMAG) vary in response to changes inflying hours in the operating commands.
This report should interest those responsible for planning, analyzing,or improving budgeting and pricing systems that coordinate the ac-tivities of separate government organizations. It should be of par-ticular interest to those working on policy for defense working capitalfunds that buffer the transfers between one defense organization in-curring costs to provide a service and another consuming and fund-ing the service. The research took place in Project AIR FORCE'sResource Management Program.
PROJECT AIR FORCE
Project AIR FORCE, a division of RAND, is the Air Force federallyfunded research and development center (FFRDC) for studies andanalyses. It provides the Air Force with independent analyses ofpolicy alternatives affecting the development, employment, combatreadiness, and support of current and future aerospace forces.Research is performed in four programs: Aerospace ForceDevelopment; Manpower, Personnel, and Training; ResourceManagement; and Strategy and Doctrine.

vii
CONTENTS
Preface ......................................... iii
Figures ......................................... ix
Tables.......................................... xi
Summary ....................................... xiii
Acknowledgments................................. xvii
Abbreviations .................................... xix
Chapter OneINTRODUCTION .............................. 1Depot-Level Fixed Costs ......................... 2Roadmap .................................... 3
Chapter TwoRESEARCH APPROACH.......................... 5H036A Data................................... 6Analysis Foci.................................. 8Estimation Procedure ........................... 9
Chapter ThreeLINKING DMAG EXPENDITURES TO OPERATING
COMMAND FLYING HOURS .................. 11Do More Flying Hours Increase DMAG Expenditures? ... 11A Noisy Link .................................. 14

viii How Should the U.S. Air Force Depot Maintenance Activity Group Be Funded?
Chapter FourEMPIRICAL FINDINGS .......................... 17Variability in Flying Hours and DMAG Organic Repair
Expenditures .............................. 17General Relationships Between Flying Hours and DMAG
Organic Repair Expenditures .................. 18Relationships Based on Accrued Expenditures ......... 21Potentially Different Patterns for Cargo Aircraft and for
Fighters and Bombers ....................... 24Summary .................................... 26
Chapter FiveCONCLUSIONS AND IMPLICATIONS ............... 29An Alternative Approach to Budgeting ............... 31Improved Supply Chain Integration................. 33
AppendixA. DMAG Expenditures—Fleet Flying Hour
Regressions ............................... 35B. The Perils of Cross-System Analysis ............... 51C. Costs, Prices, and Budgeting Factors:
Background Notes .......................... 55
References ...................................... 65

ix
FIGURES
2.1. FY00 Organic DMAG Expenditures .............. 73.1. The DMAG’s Position in the Air Force ............ 124.1. C-135 Flying Hours and DMAG Organic Repair
Expenditures............................... 184.2. Quarterly C-135 Flying Hours and DMAG Organic
Repair Expenditures ......................... 194.3. Monthly C-135 Flying Hours and DMAG Organic
Repair Expenditures ......................... 204.4. C-135 Flying Hours and DMAG Accrued Repair
Expenditures............................... 235.1. A Conceptualization of the Activity-to-Depot
Process................................... 30A.1. C-5 Flying Hours and DMAG Organic Repair
Expenditures............................... 43B.1. Eight MDs’ Flying Hours and DMAG Repair
Expenditures............................... 51

xi
TABLES
4.1. Monthly Organic C-135 DMAG Repair ExpendituresRegressed on Monthly Fleet Flying Hours,FY97–FY00 ................................ 21
4.2. Monthly Organic C-135 DMAG Repair ExpendituresRegressed Stepwise on Monthly Fleet Flying Hours,FY97–FY00 ................................ 22
4.3. Official and Accrued Expenditures ofJON 00081B417 ............................. 23
4.4. Monthly Organic C-135 DMAG Accrued RepairExpenditures Regressed Stepwise on Monthly FleetFlying Hours, FY97–FY00...................... 24
4.5. How One Extra Flying Hour Affects Accrued DMAGOrganic Repair Expenditures Over 13 Months ...... 25
4.6. Correlations of Monthly Fleet Flying Hours, FY97–FY00..................................... 27
A.1. Monthly Organic B-1 DMAG Repair ExpendituresRegressed on Monthly Fleet Flying Hours,FY97–FY00 ................................ 36
A.2. Monthly Organic B-1 DMAG Repair ExpendituresRegressed Stepwise on Monthly Fleet Flying Hours,FY97–FY00 ................................ 37
A.3. Monthly Organic B-52 DMAG Repair ExpendituresRegressed on Monthly Fleet Flying Hours,FY97–FY00 ................................ 38
A.4. Monthly Organic B-52 DMAG Repair ExpendituresRegressed Stepwise on Monthly Fleet Flying Hours,FY97–FY00 ................................ 39

xii How Should the U.S. Air Force Depot Maintenance Activity Group Be Funded?
A.5. Monthly Organic C-130 DMAG Repair ExpendituresRegressed on Monthly Fleet Flying Hours,FY97–FY00 ................................ 40
A.6. Monthly Organic C-130 DMAG Repair ExpendituresRegressed Stepwise on Monthly Fleet Flying Hours,FY97–FY00 ................................ 41
A.7. Monthly Organic C-141 DMAG Repair ExpendituresRegressed on Monthly Fleet Flying Hours,FY97–FY00 ................................ 42
A.8. Monthly Organic C-141 DMAG Repair ExpendituresRegressed Stepwise on Monthly Fleet Flying Hours,FY97–FY00 ................................ 43
A.9. Monthly Organic C-5 DMAG Repair ExpendituresRegressed on Monthly Fleet Flying Hours,FY97–December 1999 ........................ 44
A.10. Monthly Organic C-5 DMAG Repair ExpendituresRegressed Stepwise on Monthly Fleet Flying Hours,FY97–December 1999 ........................ 45
A.11. Monthly Organic F-15 DMAG Repair ExpendituresRegressed on Monthly Fleet Flying Hours,FY97–FY00 ................................ 46
A.12. Monthly Organic F-16 DMAG Repair ExpendituresRegressed on Monthly Fleet Flying Hours,FY97–FY00 ................................ 47
A.13. Monthly Organic F-16 DMAG Repair ExpendituresRegressed Stepwise on Monthly Fleet Flying Hours,FY97–FY00 ................................ 48
A.14. Cargo/Tanker Aircraft Accrued Expenditure—FlyingHour Estimations, FY97–FY00 .................. 49
A.15. Bomber/Fighter Aircraft Accrued Expenditure—Flying Hour Estimations, FY97–FY00 ............. 50
B.1. Multisystem Regression of Natural Log of AnnualOrganic DMAG Repair Expenditures Regressed onNatural Log of Annual Fleet Flying Hours,FY97–FY00 ................................ 52

xiii
SUMMARY
The basic inquiry in this report is how Air Force Materiel Command(AFMC) depot-level expenditures relate to operating command ac-tivity levels, i.e., flying hours. We hypothesize that a large portion ofdepot-level costs are unrelated to operating command activities.
APPROACH
We examine the recorded expenditures of AFMC’s DepotMaintenance Activity Group (DMAG) and relate Mission Design(MD)-specific DMAG repair expenditures to various lags of fleet fly-ing hours.
Our analysis uses H036A data, which track DMAG expenditures byJob Order Number (JON). The data describe where work was per-formed and for which MD and customer; the data break expendi-tures into various types, e.g., direct civilian labor, materiel, overhead.Direct civilian labor is a minority of organic DMAG expenditures;considerably more is spent on materiel and operating overhead.
The basic model we estimated was a linear regression with DMAGexpenditures as the dependent variable and various lags of fleet fly-ing hours the independent variables. If increasing flying hours in-creases DMAG expenditures, we expect positive regression coeffi-cient estimates.

xiv How Should the U.S. Air Force Depot Maintenance Activity Group Be Funded?
LINKING DMAG EXPENDITURES TO OPERATINGCOMMAND FLYING HOURS
The DMAG directly and indirectly supports the warfighter. It pro-vides programmed depot maintenance (PDM) and related servicesdirectly to the warfighter, and it repairs components for the SupplyMaintenance Activity Group (SMAG), which in turn provides them tothe warfighter.
Positing a relationship between flying hours and DMAG expendituresrequires a series of assumptions. More flying must generate morebroken parts. More broken parts must flow from installations to theSMAG. The SMAG must pass more broken parts to the DMAG. TheDMAG must perform extra work and this extra work must increaseDMAG expenditures. Such a process is more relevant to componentrepair than to PDM, because PDM does not take place directly in re-sponse to recent or current flying, whereas component repair does.For component repair, such a process should involve a series of lagsof uncertain length.
EMPIRICAL FINDINGS
We find, across a variety of weapon systems, that although both fly-ing hours and official DMAG repair expenditures for component re-pair vary considerably month-to-month, there is no consistent,across-weapon-system relationship between the series. We come tothe same nonfinding using an accrued expenditure approach we de-veloped that we believe more accurately records how expendituresoccur.
We find some suggestion that cargo and tanker aircraft have a closerconnection between flying hours and DMAG expenditures than istrue for fighters and bombers. This result could be explained by less-robust base-level support of cargo and tanker aircraft. We view thisfinding as speculative but worthy of further examination.
CONCLUSIONS AND IMPLICATIONS
We expected and found that many DMAG costs (e.g., programmedmaintenance, overhead) are unrelated to flying hours. Indeed, we

Summary xv
could not find any category of organic DMAG expenditures that isconsistently positively correlated with flying hours across multipleweapon systems.
The lack of consistent positive correlation between DMAG expendi-tures and fleet flying hours argues for an alternative approach tobudgeting and pricing. Budgets should reflect a general level ofcapability maintained in AFMC, regardless of the level of flying hoursin a particular year. Prices that operating commands pay for AFMCservices should reflect the underlying cost structure in AFMC. If theydid, prices would not place nearly as much emphasis on individualrepairs as current prices do. Rather, prices would focus on the totalcosts of maintaining, in AFMC, the level of capability that eachoperating command wants. The new cost recovery and pricingsystem recommended by the Air Force Spares Campaign(sometimescalled "multi-part pricing") represents a useful move in thisdirection. Under such an approach, AFMC would receive a budgetto pay for a portion of its fixed costs and operating commands wouldno longer face prices that include these fixed costs. The findings inthis report suggest that the Air Force could define fixed AFMC coststo cover a much broader set of costs.

xvii
ACKNOWLEDGMENTS
This research was sponsored by Brigadier General Robert Mansfield,U.S. Air Force Directorate of Supply (AF/ILS).
The authors appreciate the assistance of numerous Air Force per-sonnel at Wright-Patterson Air Force Base and Hill Air Force Base inobtaining the H036A expenditure and workload data. ValerieRobertson and Jeff Jones at Hill were particularly helpful. MikeCerda (AFMC/FMR), Tom Meredith (AF/ILSY), and Michelle Rachie(AF/ILSY) also assisted us. This research was briefed to EdwardKoenig, Director of the Aircraft/Missile Support Division of the AirForce Directorate of Supply (AF/ILSY), and his staff on August 17,2001.
We received constructive reviews of an earlier draft of this researchfrom RAND colleagues Greg Hildebrandt and Ray Pyles. MattSchonlau provided statistical advice. Mary Wrazen created Figure5.1. Jeanne Heller edited this document. The authors also thankcolleagues Laura Baldwin, Mary Chenoweth, Chris Hanks, RodgerMadison, Gary Massey, C. Robert Roll, and Hy Shulman for their as-sistance on this research. Randy King, Ginny Mattern, and RobertSteans of the Logistics Management Institute provided helpful input.Earlier versions of this research were briefed at the United States AirForce Academy on November 20, 2000 and to seminars at RAND onMay 18, 2001, July 2, 2001, and August 2, 2001. Also, this researchwas briefed to the American Institute of Astronautics andAeronautics Economics Technical Committee on January 23, 2002.The insights of seminar participants were appreciated.
Of course, remaining errors are the authors’ responsibility.

xix
ABBREVIATIONS
AFCAIG Air Force Cost Analysis Improvement Group
AFMC Air Force Materiel Command
AIMD Accounting and Information ManagementDivision
CINC Commander-in-Chief
Df Degrees of Freedom
DLR Depot-Level Reparable
DMAG Depot Maintenance Activity Group
FH Flying Hours
FMR Directorate of Financial Management andComptroller, Working Capital Funds Division
FY Fiscal Year
G&A General and Administrative
GAO General Accounting Office
ILS Deputy Chief of Staff for Installations andLogistics, Directorate of Supply
ILSY Aircraft/Missile Support Division
JON Job Order Number

xx How Should the U.S. Air Force Depot Maintenance Activity Group Be Funded?
LRU Line Replaceable Unit
MC Mission Capability or Mission Capable
MD Mission Design
MDS Mission Design Series
MERLIN Multi-Echelon Resource and LogisticsInformation Network
MICAP Mission Capability
MISTR Management of Items Subject to Repair
MSD Materiel Support Division
NATO North Atlantic Treaty Organization
NOR Net Operating Result
NSIAD National Security and International AffairsDivision
OSD Office of the Secretary of Defense
P Probability
PDM Programmed Depot Maintenance
PPBS Planning, Programming, and BudgetingSystem
RCCC Resource Cost Control Center
REMIS Reliability and Maintainability InformationSystem
RGC Repair Group Category
RSP Readiness Spares Package
SE Standard Error
SMAG Supply Maintenance Activity Group
Abbreviations xxi
SS Sum of Squares
WCF Working Capital Fund

1
Chapter One
INTRODUCTION
How do Air Force Materiel Command (AFMC) costs relate to operat-ing command activity levels?
The Planning, Programming, and Budgeting System (PPBS) currentlyrequires operating commands to develop budgets that will covercosts of relevant AFMC support services. The operating commandsuse the Air Force Cost Analysis Improvement Group (AFCAIG) pro-cess to do that. Roughly speaking, this process divides expected ex-penses into fixed and variable components and develops a budgetestimate for each. We are particularly interested in how the methodsused to address the variable component, expressed in terms of cost-per-flying-hour factors, relate to the actual costs in AFMC.
In this study, we try to better understand the cost structure of depotsupport services. How much do these costs change when operatingcommand activity levels change? It is well known that many mea-sures of activity level—like flying hours, sortie length, engine cycles,and landings—can be important cost drivers in particular circum-stances. Several may be important at the same time in any particularcircumstance. For simplicity, we focus on the single factor that thePPBS process currently emphasizes. Because the AFCAIG processfocuses on flying hours as an activity driver, we focus on flying hoursas well. It may be useful for future analysis to examine the relevanceof other potential cost drivers; however, understanding alternativecost drivers is not critical to the analysis at hand.
We believe the analysis presented here raises questions about howvariable costs are reflected in the Air Force’s command-based bud-geting system. Specifically, we find that the expenditures of AFMC’s

2 How Should the U.S. Air Force Depot Maintenance Activity Group Be Funded?
Depot Maintenance Activity Group (DMAG) are inconsistently corre-lated with flying hours across different weapon systems.
DEPOT-LEVEL FIXED COSTS
We hypothesized ex ante that many depot-level costs are unrelatedto operating command activities. For example, programmed depotmaintenance (PDM) is scheduled years in advance and is unrelatedto current operations. The current AFCAIG process recognizes thisphenomenon.
The Air Force command-level budgeting process treats unscheduledmaintenance costs in the year of execution as though they weredriven by operating command flying hours in that year. While theremay be evidence that costs from the standpoint of the major com-mands are related to flying hours, we show that costs actually in-curred by AFMC are not related to flying hours in the short run.
For example, materiel procurement has long lead times. Itemsbought with funds obligated in the year of execution need not be de-livered to support flying hours for a year or more. Similarly, itemsdelivered and paid for in the year of execution need not experience ademand in that year.
As we will discuss in more detail below, the organic DMAG has con-siderable general and administrative (G&A) and overhead costs. Bydefinition, these costs are essentially independent of system activityin any year of execution.
There are also considerable rigidities in the government-employedcivilian labor force. See, for instance, Robbert, Gates, and Elliott(1997). Government civilian personnel policy strongly limits AFMC’sability to use temporary labor. Also, the skills required in one main-tenance shop are typically too specialized to allow much substitutionof available workers between shops to match fluctuations in shops’demands over time.
Even if labor were freely flexible, AFMC is only now systematicallyattempting to match maintenance shop priorities to priorities in theoperating commands. Until a systematic match can be taken forgranted, there is no reason to expect a demand generated by an op-

Introduction 3
erating command’s flying hours to match a maintenance action inAFMC.
What depot-level costs vary with operating command activity levels?The major commands employ operating and support cost factors forDepot-Level Reparables (DLRs) based on calculated costs to themper flying hour. Although these factors are quite helpful in forecast-ing the DLR costs to the major commands, they are much less suc-cessful in predicting how a change in flying hours in any monthwould affect actual AFMC costs during the months following thatmonth. Our analysis suggests that cost factors, like average cost perflying hour, relevant for long-term purposes, have great difficultyexplaining how changes in operating command activity levels affectactual depot-level costs to the Air Force in a particular month.
ROADMAP
Chapter Two explains our analytic approach. Chapter Three pro-vides a stylized overview of the supply chain, and explains the link-ages that contribute to any connection between flying hours in theoperating commands and expenditures recorded in depot mainte-nance shops. Chapter Four summarizes our empirical findings.Chapter Five discusses the conclusions’ policy implications. The ap-pendices present more detail underlying the analysis.

5
Chapter Two
RESEARCH APPROACH
Our analysis focuses on the DMAG, where the majority of AFMC lo-gistics support costs are incurred. The DMAG funds all programmedand nonprogrammed maintenance in AFMC. The DMAG buys ma-teriel from the Supply Maintenance Activity Group (SMAG), but un-less this materiel is new, the DMAG is responsible for returning it toserviceable status, so much of what the DMAG pays the SMAG sim-ply covers DMAG costs incurred earlier. The only SMAG costs notactually incurred in the DMAG earlier cover purchases of new ma-teriel and administrative costs within the SMAG; as a result, costs inthe DMAG drive total costs in the Air Force working capital fund(WCF).
We examine recorded DMAG expenditures, not Air Force CostAnalysis Improvement Group (AFCAIG) cost factors. AFCAIG cost-per-flying-hour factors attempt to capture what the operating com-mands pay AFMC for services. In this analysis, we are not looking atwhat the operating commands pay AFMC; this is a paper transferwithin the Air Force. (As discussed in Appendix C, however, this pa-per transfer is a real cost from the perspective of the operating com-mand.) Instead, we are concerned with the actual costs to the AirForce as a whole of supporting the operating commands. AFMC in-curs these costs when it pays its labor, buys materiel, pays for utilityservices, and so on. These are the costs we examine.
We focus on DLR repair expenditures, not PDM. According to thedata we obtained, repair represented 42 percent of DMAG expendi-tures in fiscal year 2000 (FY00).

6 How Should the U.S. Air Force Depot Maintenance Activity Group Be Funded?
We focus on specific weapon systems in the operating commands asthe drivers of maintenance activities in AFMC. We are concernedwith that fraction of repair expenditures that is unambiguously at-tributed to specific Mission Designs (MDs). In FY00, only about halfof organic DMAG repair expenditures was attributed to a specificweapon system. (The rest was attributed to non-system-specificcategories like “Engines, Turbines, and Compressors” and“Communication, Detection, and Radio Equipment.”)
We use fleet flying hours as our proxy for operating command activ-ity. As noted above, we do this because the AFCAIG process uses thisapproach as well. We recognize that other cost drivers may be im-portant.
We then use various lags of fleet flying hours to try to find some rela-tionship with repair expenditures.
H036A DATA
Our analysis is based on the DMAG’s organic H036A data. Thesedata record monthly accumulated costs in the DMAG by Job OrderNumber (JON). The Air Force does not attribute actual expendituresto individual JONs. Instead, we infer that these data are based on thefollowing logic: The Air Force can track actual expenditures permonth by resource cost control center (RCCC)—typically an individ-ual depot shop. Using standard hours for every maintenance task, itallocates actual civilian labor costs by RCCC to all JONs in progress inthat RCCC per month. If this inference is correct, the data we haveon costs per JON include distortions where systematic differencespersist between actual and standard hours for particular kinds ofmaintenance actions. But we use these data to construct cost perperiod at the MD level. Such systematic differences should not biasour analyses of cost relationships between total AFMC costs permonth and operating activity levels per month, by MD.
Unfortunately, we have not been able to corroborate our inferencesabout how data are accumulated in the H036A. The Air Force doesnot directly use the data in H036A for its own management purposes;it maintains the data solely to report them to the Office of theSecretary of Defense (OSD). We used these data because we weretold by several Air Force sources that they provide the best data

Research Approach 7
available for attempting to link MD support costs as closely as possi-ble to actual costs in AFMC. We were able to use the data fromH036A to duplicate the DMAG costs that AFMC reported in its FiscalYear 2000 Annual Report on the Air Force WCF. This match gives usan important degree of confidence in the data’s integrity.
These data cover all costs relevant to maintenance—direct labor,materiel, overhead, and so on—and distinguish these cost categories.Each record indicates a month, whether a job is completed or is inprogress, where the work is occurring, the customer, the MD, andvarious types of expenditure (e.g., direct civilian labor, materiel,overhead). We have monthly H036A data for fiscal years 1997–2000,inclusive.
Figure 2.1 breaks out FY00 organic DMAG expenditures by materiel,operating overhead, direct civilian labor, and G&A for both pro-grammed and repair work. (Figure 2.1 does not display expenditures
0
100
200
300
400
500
600
700
Materiel Operatingoverhead
Direct civilianlabor
G&A
Programmed
Repair
FY00organicDMAGexpenditures($millions)
RAND MR1487-2.1
Figure 2.1—FY00 Organic DMAG Expenditures ($ millions)

8 How Should the U.S. Air Force Depot Maintenance Activity Group Be Funded?
we categorized as neither programmed nor repair. The largest such“Other” categories are “Software” and “Exchangeables ServiceWork.”)
“Materiel” covers the costs of all DMAG purchases from the SMAG.Note that these are not actual costs to the Air Force as a whole, buttransfers from the DMAG to the SMAG. Even if we see a strong rela-tionship between activity levels and materiel costs, we cannot infer astrong relationship between activity levels and actual costs to the AirForce in the year of execution.
Operating overhead and G&A are clearly fixed costs in the year of ex-ecution. Note that operating overhead exceeds direct civilian laborcosts. Direct civilian labor represents a distinct minority of organicDMAG expenditures.
Direct civilian labor costs are the most likely cost category shown toreflect a direct relationship between activity levels and actual costs tothe Air Force as a whole. But, as noted above, they too may well dis-play only a limited relationship in the year of execution.
ANALYSIS FOCI
We focused our analysis in several ways. We examined only organicexpenditures attributed to MDs. We looked at organic expenditures,because over the period that our data cover, the Air Force gavegreater emphasis to tightening order-and-ship times between oper-ating commands and repair facilities for organic than for contract fa-cilities. Similarly, the Air Force gave greater emphasis to prioritizingrepairs in organic than in contract facilities. Contract repair also re-portedly experienced greater budget-induced turbulence over thisperiod than organic repair, because the Air Force tended to cut con-tract repair more than organic repair when funds were short. Toavoid the likely effects of all these factors, we focused on organic re-pair, where we expected to see a cleaner relationship between actualAFMC costs and operating command activity levels.
More prosaically, the organic H036A data are more detailed and de-scriptive than contract H036A data.
Within organic DMAG expenditures, we looked at total repair costs[or what H036A calls “Management of Items Subject to Repair

Research Approach 9
(MISTR)” expenses], which is what the AFCAIG process emphasizesin its treatment of variable costs.
As we will discuss, we took two perspectives on DMAG expenditures.The first uses expenditures associated with completed JONs during amonth as the unit of observation. This “official” version of the dataaccords, as noted above, with the FY00 AFMC annual report. Thesecond perspective analyzed “accrued” expenditures using monthlyfirst differences of work-in-progress expenditure totals. Such firstdifferences measure changes in the value accumulated against JONs.
We restricted ourselves to MDs for which we had monthly fleet flyinghours as well as H036A expenditure data. The flying hours data camefrom the Air Force’s Multi-Echelon Resource and LogisticsInformation Network (MERLIN) system, which obtains the data fromthe Reliability and Maintainability Information System (REMIS). Weanalyzed the B-1, B-52, C-130, C-135, C-141, C-5, F-15, and F-16.
We have flying hours at the Mission Design Series (MDS) level (e.g.,F-15Cs), but the H036A data tend to be only by MD (e.g., F-15s).
ESTIMATION PROCEDURE
Our basic estimation procedure was to estimate the parameters ofthe equation
Expend t a b i FH t i
i
i( ) ( ) ( ) ,= + − +
=
=∑ ε
0
12
where Expend(t) is DMAG repair expenditures in month t in supportof this MD and FH(t – i) is total Air Force flying hours for this MD imonths prior to month t. We regressed, for a given MD, monthly ex-penditure data on current-month and 12 monthly lags of flyinghours. We assume that the residual term, ε, is well behaved with zeroexpectation, independence between observations, and a fixed vari-ance.
If increasing flying hours increases expenditures, we expect the sumof the 13 b(i) estimates to be positive.

10 How Should the U.S. Air Force Depot Maintenance Activity Group Be Funded?
One could consider other potential cost drivers. The number of ob-servations (47 or 48, depending on whether we use accrued or officialexpenditure data) limits the number of independent variables onecan consider. Adding additional variables will probably require useof a simpler lag structure. The data force us to accept such analytictrade-offs. An alternative would be to add years to the database. ButAir Force logistics policy has been dynamic enough since 1991 tomake additional years suspect; with each additional year of data, theargument that we are measuring a stable underlying structure—oneof the assumptions of linear regression analysis—becomes harder tosustain. Also, H036A data were not readily available to us for yearsbefore FY97.

11
Chapter Three
LINKING DMAG EXPENDITURES TO OPERATINGCOMMAND FLYING HOURS
Figure 3.1 roughly describes the DMAG’s position in the Air Force.1
The DMAG directly and indirectly supports the warfighter. It pro-vides PDM directly to the warfighter at the flight line. It providescomponent repair to the SMAG, which in turn provides serviceableparts as needed to the flight line. The SMAG covers all materiel in theMateriel Support Division (MSD) and base supply.
Our econometric approach measures the extent of a relationshipbetween the wing flight line, where flying hours are measured, andorganic component repair shops in the DMAG.
DO MORE FLYING HOURS INCREASE DMAGEXPENDITURES?
A series of conditions must hold true for increased flying hours to in-crease DMAG expenditures.
First, more flying must generate more parts needing servicing.2 Weknow that the Air Force expects flying hours to drive failures for only
______________ 1Extensive flows of services, serviceable and unserviceable materiel, money, and in-formation accompany the processes in the supply chain. To keep things as simple aspossible, we depict only flows of services and serviceables from sources of supply andrepair to users.2There is an extensive literature on the presence of uncertainty in the generation ofdemand on the supply chain from flying hours. See, for example, Brown (1956),

12 How Should the U.S. Air Force Depot Maintenance Activity Group Be Funded?
Military capabilities for�CINCs, Joint and�Unified Commands
SMAG
DMAG
Basemaintenance
Organic depot andcontract component
Organic andcontract PDM
Wholesaleorganic
Wing flightlines, etc.
Base supply
RAND MR1487-3.1
Figure 3.1—The DMAG’s Position in the Air Force
a portion of its aircraft-related inventory. In some cases, historicaldata indicate that another driver—perhaps sorties, cycles, or opera-tional hours—is a better predictor of failures. Failure-induced de-mand for many items is related to the size of the inventory, but not toany specific activity level. And for many items, no empirical relation-ship has ever performed well enough to predict demand. Itemsfalling into all of these categories drive workload in the DMAG.Flying hours are relevant only to those items for which (1) flyinghours are the primary driver or (2) the primary driver is correlatedwith flying hours. Any relationship that we capture will be better de-
_____________________________________________________________ Hodges (1985), Crawford (1988), Cohen, Abell, and Lippiatt (1991), Adams, Abell, andIsaacson (1993), Pyles and Shulman (1995), and Feinberg et al. (2001).

Linking DMAG Expenditures to Operating Command Flying Hours 13
fined as items with a demand driven by flying hours become moredominant in DMAG’s workload.
Second, these failure-induced demands for additional parts mustpass from base maintenance into the SMAG. That is, items that re-quire servicing must generate a demand in base supply. To the ex-tent that base maintenance relies on cannibalized line replaceableunits (LRUs) or aircraft to fill a demand on the flight line, it can delaythe time at which a demand is generated in base supply. Within theSMAG, base supply must then pass an effective demand on to whole-sale supply. If base supply draws down a stock level, wholesale sup-ply can decide not to fill it immediately and thereby avoid passingthe demand along.
In the last few years, operating commands have complained increas-ingly that the SMAG was slow to fill depleted base-level stocks be-cause doing so did not generate sales for the SMAG. To the extentthat this is true, the link between a demand generated at the flightline and a demand on the DMAG is further weakened.
Third, the SMAG must pass additional demands for replacementparts on to the DMAG. To do so, it must present a requisition andcommit resources to cover the cost of servicing the requisition.Because Air Force policy on stock leveling allows the SMAG to receivemore requisitions than it can pay for, it will tend to pass on requisi-tions first for items it will have the least difficulty selling to the oper-ating commands. That is, the SMAG may delay placing a demand onthe DMAG to avoid expenditures that would degrade its financialperformance. In the extreme, if the SMAG buys too many parts fromthe DMAG that it cannot sell, it may not have the financial capacityto buy anything from the DMAG for some period, even if the DMAGhas resources available to commit to repair.
Fourth, the DMAG must perform additional work. To do so, it must(1) have all the parts required to perform the maintenance, includingan unserviceable carcass, and (2) give the repair enough priority toinduct the item in question. Without the basic repair capacity andpriority, a specific induction can wait, loosening the link between theoperating command and depot-level maintenance costs.
Finally, this extra work must increase DMAG expenditures. This as-sumption is not trivial in that we believe the DMAG has a large num-

14 How Should the U.S. Air Force Depot Maintenance Activity Group Be Funded?
ber of fixed costs that do not increase with workload. In principle,expenditures occur immediately when the DMAG commits civilianlabor to a task and pays for materiel and other inputs to support therepair. As noted above, it is not clear how closely H036A links anyrepair action to recorded expenditures. More broadly, any delaysbetween actual and recorded expenditures in other data systems thatthe Air Force uses to manage depot maintenance will dampen thelink between an operating command and recorded costs in ways thatwe cannot observe directly.
These concerns make each of the links necessary to connect flyinghours and DMAG expenditures problematic. Some failures lead todemands that pass through the supply chain extremely quickly.Other failures generate demands that languish in the supply chainand generate work in a DMAG shop long after, if ever.
A NOISY LINK
In sum, we expect the link between flying hours and recorded DMAGexpenditures to be very noisy.
The initial failure process is noisy. Variance-to-mean ratios of 5 ormore have been observed for some parts. See, for instance, Crawford(1988). With low probabilities of failure, there can be extreme vari-ability from year to year in the number of failures generated by aconstant flying hour program. This variability alone could preventan analytic method that is suitable for developing long-term cost fac-tor averages from yielding useful information for any particular fu-ture year.
Many demands upon the DMAG result not from flying hours butfrom other measures of operating command activity levels. Theseexogenous demands are also likely to be highly stochastic, injectingmore variation in total DMAG demands that has no direct connec-tion to flying hours at all.
Initial demands pass through the supply chain in idiosyncratic ways.If the Air Force had optimized the supply chain and made decisionsat each level to support optimal outcomes, the link between operat-ing command demands and DMAG costs might tighten. Perhaps abetter system would attempt to (1) match repair actions to actual

Linking DMAG Expenditures to Operating Command Flying Hours 15
demands as closely as possible to avoid unnecessary costs, and (2)standardize the pipeline lengths at as low a level as possible to re-duce demand for pipeline inventories.
The distributed lag structure discussed at the end of the precedingchapter could be estimated to link demand to DMAG cost, reflectingthe unavoidable delays in the pipeline. However, it could be that thebasic lag structure for the logistics pipeline is stochastic and may notbe stable over significant periods of time, adding noise to any at-tempt to identify the underlying structure.
High variance-to-mean ratios in initial demands, additional variabil-ity added from demands not driven by flying hours, and a stochasticlag structure lead to significant variability in demands placed uponthe DMAG in any period. These challenges would suggest that, evenif both the underlying stochastic structure of each element in thissystem and flying hours remained constant, the realized demands onthe DMAG would vary substantially over time.
In contrast, we know that DMAG overhead and G&A costs are fairlystable. Direct civilian labor is fairly stable. So it is highly unlikelythat performed workload in DMAG shops will vary enough to ac-commodate the demand variability implied by the above factors.The DMAG will be managed to absorb this demand uncertainty in aneffort to keep its own direct civilian labor fairly steadily employedand to limit variability in demand for materiel inputs from the SMAG.
How will such accommodation affect the link between demands inthe operating commands and reported costs in the DMAG? AnyDMAG activity will accommodate such variation by working downstanding backlog or standing idle when shop capacity exceeds cur-rent demand or allowing backlog to accumulate when current de-mand exceeds shop capacity. Changing the level of backlog simplymoves the time when the DMAG services any particular demandfrom an operating command. Such accommodation is likely to in-troduce additional discretion that further dilutes any relationship be-tween flying hours and DMAG costs.

17
Chapter Four
EMPIRICAL FINDINGS
Our analysis produced three basic empirical findings.
• First, flying hours and DMAG organic repair expenditures variedsignificantly over time for all weapon systems examined. Thisvariation provided the basis for the remaining empirical analysis.
• Second, we found no strong patterns of results that suggest auniform relationship between flying hours and DMAG organicrepair expenditures across weapon systems. To the extent thatany relationships exist, they differ substantially across systems.
• Third, the data suggest that increased flying hours may increasesubsequent DMAG expenditures associated with cargo-type air-craft while reducing subsequent DMAG expenditures associatedwith fighters and bombers.
This chapter discusses each of these findings in turn.
VARIABILITY IN FLYING HOURS AND DMAG ORGANICREPAIR EXPENDITURES
Both flying hours and DMAG organic repair expenditures vary con-siderably month-to-month across all weapon systems studied.Figure 4.1 illustrates this pattern for the C-135. The early 1999 spikein C-135 flight hours, for example, is related to North Atlantic TreatyOrganization (NATO) operations in the Balkans.

18 How Should the U.S. Air Force Depot Maintenance Activity Group Be Funded?
�
����
������
������
������
������
������
������
�����������
� �� �� � ���� ����
����� �����
���� ������� �� ����! ��"�#���� $��� �% &�� '(
���� MR1487-4.1
Figure 4.1—C-135 Flying Hours and DMAG Organic Repair Expenditures
From a purely analytic point of view, the degree of variability in bothdata series is a good thing. Without it, we would be unable to mea-sure any correlation between recorded DMAG organic expendituresand operating command activity levels. We worried initially thatcareful management in the operating commands and in the DMAGshops would prevent the variation we needed to proceed. So this re-sult is very important.
GENERAL RELATIONSHIPS BETWEEN FLYING HOURS ANDDMAG ORGANIC REPAIR EXPENDITURES
We observed no straightforward relationship between the DMAG’sorganic repair expenditure and flying hour series that is consistentacross weapon systems.

Empirical Findings 19
Viewing the same C-135 data a different way, Figure 4.2 plots quar-terly C-135 flying hours against C-135 DMAG organic repair expendi-tures covering FY97–FY00. There is no obvious relationship.
The figure looks essentially the same if one looks at a quarterly lag offlying hours as the independent variable.
Figure 4.3 uses the same C-135 data, but on a monthly basis. Again,there is no clear relationship between flying hours and DMAG or-ganic repair spending.
Formalizing the intuition of Figures 4.1–4.3, Table 4.1 presents theresults of regressing C-135 DMAG organic repair expenditures oncurrent-month plus 12 monthly lags of C-135 fleet flying hours.
�
������
������
������
������
������
������
������
�����
�� �� ������������ ����� ���� ����� ��� �!
"��!�#$%�� ���� !&
� ������ ������ ������ ������ ������ ������ ������ �����
�� �� �� ����� #����� '�� !
���� MR1487-4.2
Figure 4.2—Quarterly C-135 Flying Hours and DMAG Organic RepairExpenditures
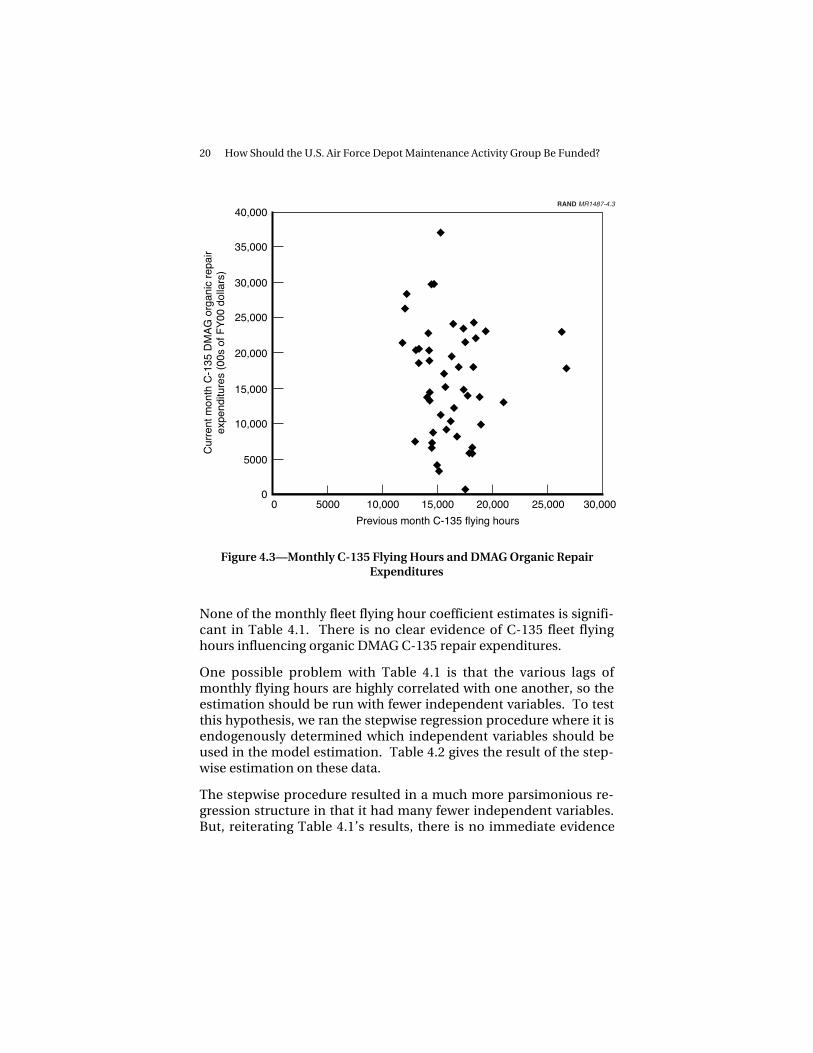
20 How Should the U.S. Air Force Depot Maintenance Activity Group Be Funded?
�
����
������
������
������
������
������
������
���������������������������������
�������������� !����""��#
� ���� ������ ������ ������ ������ ������
$%���� ����� ����� �"&��� ����
���� MR1487-4.3
Figure 4.3—Monthly C-135 Flying Hours and DMAG Organic RepairExpenditures
None of the monthly fleet flying hour coefficient estimates is signifi-cant in Table 4.1. There is no clear evidence of C-135 fleet flyinghours influencing organic DMAG C-135 repair expenditures.
One possible problem with Table 4.1 is that the various lags ofmonthly flying hours are highly correlated with one another, so theestimation should be run with fewer independent variables. To testthis hypothesis, we ran the stepwise regression procedure where it isendogenously determined which independent variables should beused in the model estimation. Table 4.2 gives the result of the step-wise estimation on these data.
The stepwise procedure resulted in a much more parsimonious re-gression structure in that it had many fewer independent variables.But, reiterating Table 4.1’s results, there is no immediate evidence

Empirical Findings 21
Table 4.1
Monthly Organic C-135 DMAG Repair ExpendituresRegressed on Monthly Fleet Flying Hours, FY97–FY00
Observations 48
R-squared 0.25
F 0.89Pr > F 0.57
Df SS
Regression 13 7.6E12Residual 34 22.4E12Total 47 30.0E12
Coefficient SE T-Statistic P-Value
Intercept 4460558 2194804 2.03 0.05Current month –6.35 60.98 –0.10 0.92
FH-1a –32.13 78.72 –0.41 0.69FH-2 39.99 77.63 0.52 0.61FH-3 –106.24 80.86 –1.31 0.20FH-4 18.25 80.81 0.23 0.82FH-5 63.22 81.58 0.77 0.44FH-6 –152.17 85.53 –1.78 0.08FH-7 82.67 83.40 0.99 0.33FH-8 –25.57 83.81 –0.31 0.76FH-9 –52.16 84.94 –0.61 0.54FH-10 –91.09 81.40 –1.12 0.27FH-11 159.26 81.66 1.95 0.06FH-12 –70.92 65.71 –1.08 0.29
aFH-1 refers to fleet flying hours lagged one month, FH-2 is fleet flying hourslagged two months, and so forth.
that C-135 fleet flying hours have a marked impact on DMAG organicC-135 repair expenditures.
RELATIONSHIPS BASED ON ACCRUED EXPENDITURES
We were surprised at the month-to-month variability of the DMAGexpenditure data in the preceding figures. One explanation, we be-lieve, is that the DMAG does not systematically use accrual account-ing. Instead, expenditures are booked sporadically, i.e., when a JONis closed out. We undertook a work-in-progress monthly first-

22 How Should the U.S. Air Force Depot Maintenance Activity Group Be Funded?
Table 4.2
Monthly Organic C-135 DMAG Repair Expenditures RegressedStepwise on Monthly Fleet Flying Hours, FY97–FY00
Observations 48
R-squared 0.11
F 2.84Pr > F 0.07
Df SS
Regression 2 3.4E12Residual 45 26.6E12Total 47 30.0E12
Coefficient SE T-Statistic P-Value
Intercept 1108024 726696 1.52 0.13FH-10 –90.05 50.92 –1.77 0.08FH-11 121.06 51.32 2.36 0.02
difference accrual adjustment for this phenomenon. Thisadjustment implies a divergence from the data in the AFMC FY00annual report. But we believe it more nearly captures the actualexpenditures incurred per month in DMAG shops.
To illustrate how our accrual adjustment process worked, Table 4.3shows a specific JON (associated with C-130 work at Warner RobinsAir Force Base) and its progression of total organic expendituresbetween September 1999 and June 2000. This example illustrateshow the official tabulation method creates an artificially clusteredand lagged portrayal of expenditures relative to the accruedmethodology.
Figure 4.4 shows the C-135 organic repair expenditures, according tothe official H036A data, compared to the pattern using our accrualadjustment. The accrued repair expenditures show considerably lessmonth-to-month variability, as one would expect.
It turns out, however, that none of our results concerning the lack ofa consistent connection between flying hours and DMAG organic re-pair expenditures is changed based on whether one uses official ver-sus accrued expenditure data. Table 4.4 gives the C-135 stepwise re-

Empirical Findings 23
Table 4.3
Official and Accrued Expenditures of JON 00081B417
MonthCumulative
Expenditures Official Accrued
September 1999 28872 0 28872October 1999 332774 0 303902November 1999 570108 0 237334December 1999 888240 0 318132January 2000 1185753 0 297513February 2000 1185753 0 0March 2000 1510393 0 324640April 2000 1514941 0 4548May 2000 1524771 0 9830June 2000 1524775 1524775 4
�
����
������
������
������
������
������
������
������
���� ��� ��� ���� ���� ����
�����
����� �����
���� ������� �� ��� !�" ��#�$���� %��� �& '�� ()
������# �� ��� �" ��#�$���� !%��� �& '�� ()
���� MR1487-4.4
Figure 4.4—C-135 Flying Hours and DMAG Accrued Repair Expenditures

24 How Should the U.S. Air Force Depot Maintenance Activity Group Be Funded?
Table 4.4
Monthly Organic C-135 DMAG Accrued RepairExpenditures Regressed Stepwise on Monthly Fleet
Flying Hours, FY97–FY00
Observations 47
R-squared 0.24
F 6.79Pr > F 0.00
Df SS
Regression 2 2.3E12Residual 44 7.6E12Total 46 10.0E12
Coefficient SE T-Statistic P-Value
Intercept 21657 467958 0.05 0.96FH-10 65.12 21.82 2.98 0.00FH-12 34.78 21.84 1.59 0.12
gression results where the dependent variable is accrued repair ex-penditures. In Appendix A, we present similar analyses for otherweapon systems.
POTENTIALLY DIFFERENT PATTERNS FOR CARGOAIRCRAFT AND FOR FIGHTERS AND BOMBERS
An interesting pattern emerges when we look at the implications ofthe regressions estimated in a slightly different light.1 Suppose weuse these equations to ask how much accrued DMAG organic repairexpenditures would rise if flying hours rose by one hour. Table 4.5summarizes the results of asking this question in three differentways. It asks how an extra flying hour would affect accrued DMAGexpenditures over the 13-month period we have examined—themonth concurrent with the increase in flying and the 12 followingmonths. Results differ depending on which form of the model weuse to answer this question.
______________ 1The analysis that follows benefits from discussions with Ray Pyles.

Empirical Findings 25
Table 4.5
How One Extra Flying Hour Affects Accrued DMAGOrganic Repair Expenditures Over 13 Months
SystemFull
RegressionStepwise
RegressionConstrainedRegression
C-130 $1401 $683 $689C-135 $76 $100** $39C-141 $194** $187** $182**C-5 $1189 $1943* $1807B-1 –$693 –$632* –$1027**B-52 –$2879** –$2342** –$2132**F-15 –$2089 – –$1716*F-16 –$1710** –$1414** –$1560**
NOTE: * denotes a sum that is statistically significant at the 95% confi-dence level; ** denotes 99% significance.
Column 1 lists the eight weapon systems studied. Column 2 showsthe implication of applying a full regression, like that reported inTable 4.1. Column 3 shows the implication of applying a stepwiseregression, like that reported in Tables 4.2 and 4.4. Column 4 showsthe implication of applying a full regression, but constraining all thecoefficients on flying hours to be equal.2 The asterisks show whenthe sums of the relevant coefficient estimates are statistically signifi-cantly different from zero. Tables A.14 and A.15 provide more detailon the estimations underlying Table 4.5.
The answers for each weapon system are roughly the same acrossmodels, but the statistical significance of the findings varies consid-erably. That said, it is hard to dismiss a systematic difference in re-sults for cargo aircraft and for fighters and bombers. These resultssuggest that an additional flying hour is likely to increase DMAG ex-penditures relevant to cargo aircraft, but to decrease expendituresrelevant to fighters and bombers. This was a totally unexpected out-come.
Further work is required to determine whether this result is real and,if it is, what causes it. Our colleague, Ray Pyles, offers the following
______________ 2Greg Hildebrandt suggested this type of model to test the robustness of our results inthe face of multicollinearity. As the results in Table 4.5 demonstrate, the findings arequite robust across the three functional forms.

26 How Should the U.S. Air Force Depot Maintenance Activity Group Be Funded?
hypothesis as one worth exploring further: Cargo and other supportaircraft tend to receive less ample spares levels than do bombers andfighters because
• their aircraft availability goals are set lower,
• their de facto operating configuration (worldwide dispersed op-erations) is ignored, thereby underestimating required safetylevels, and
• the C-5 and C-141 war reserve readiness spares package (RSP)computations assume operations from one base instead of thedispersed squadron deployment assumed for combat aircraft.
As a result, a support aircraft DLR demand surge (perhaps caused bya higher operational tempo) will run through the available sparesmore quickly than a proportional surge in combat aircraft DLR de-mands. Any additional demands will cause “holes” in aircraft, calledmission capability (MICAPs) failures, which receive higher priority inboth depot repair and transportation functions than other demands.If demands increase in response to a forcewide operational temposurge, the combat aircraft will experience relatively fewer MICAPsthan support aircraft and more of the available DMAG repair capac-ity will be devoted to the cargo and other support aircraft. Thisworkload emphasis shifts because the SMAG and the DMAG workwith fixed overall budgets, and so can only reallocate workload tominimize the worst effects of a demand surge.
Table 4.6 shows that the flying hours for the eight weapon systemsstudied here do, in fact, tend to move together. Cross correlationsare significant between almost all of these systems and are oftenquite high. This pattern lends credence to the Pyles hypothesis de-scribed above. We urge further research on the potential differentialtreatment of the support and combat fleets in the depot system.
SUMMARY
The current method the Air Force uses to build budgets for the op-erating commands to pay for DMAG services leads one to believethat actual DMAG expenditures are proportional to flying hours andthat flying hours can explain the preponderance of DMAG expendi-tures in any year. The results reported here fail to support this view

Empirical Findings 27
Table 4.6
Correlations of Monthly Fleet Flying Hours, FY97–FY00
System B-1 B-52 C-130 C-135 C-141 C-5 F-15
B-52 0.52**C-130 0.58** 0.47**C-135 0.36* 0.41** 0.66**C-141 0.09 0.24 0.31* 0.46**C-5 0.19 0.26 0.40** 0.43** 0.49**F-15 0.67** 0.54** 0.76** 0.76** 0.37* 0.31*F-16 0.70** 0.55** 0.84** 0.75** 0.38** 0.42** 0.91**
NOTE: * denotes a sum that is statistically significant at the 95% confidence level;** denotes 99% significance.
in two different ways. First, the specific relationships we find be-tween DMAG organic repair expenditures and flying hours are quiteidiosyncratic across weapon systems. Second, it may be that in-creased flying hours increase DMAG expenditures for aircraft thatthe Air Force gives relatively few spare parts and decrease DMAG ex-penditures for aircraft that the Air Force favors with more spareparts. Whether or not this hypothesis turns out to be true on closerexamination, the current budgeting system clearly assumes a rela-tionship between flying hours and actual costs in AFMC that is notfound if one examines the relationship between actual DMAG costsand flying hours in the months preceding these costs.

29
Chapter Five
CONCLUSIONS AND IMPLICATIONS
We expected and found that many DMAG costs are unrelated to fly-ing hours. Programmed maintenance, by definition, is independentof current operating command activity levels. A sizable fraction ofDMAG expenditures goes to output-invariant costs like G&A andoverhead. Also, government civilian worker regulations tend tomake labor costs hard to quickly reduce. Indeed, analysis byWallace, Kem, and Nelson (1999) suggested that 80 percent of work-ing capital fund costs are fixed with respect to the amount of depot-level reparable sales.
Our multisystem data analysis found a variety of relationship pat-terns between flying hours and organic DMAG expenditures, some inthe intuitive positive direction but others in the counterintuitivenegative direction. These patterns are not consistent across aircraft.Further, the estimated lag structures vary considerably, both in du-ration and magnitude.
Figure 5.1 provides a conceptual portrayal of what we think is occur-ring. The rows show successive activities in the supply chain, frominitial activity at the flight line to the depot maintenance shop.Within a row, time moves from left to right; the Xs show events ateach stage in the supply chain that can be traced back to the initialflight-line activity.
At the top of Figure 5.1, we show flight-line activity, i.e., flying air-craft. Flying aircraft probably causes some removals at base, al-though Bachman and Kruse (1994) report only low-to-moderate cor-relation between flying hours and non-overhaul demand across 50aviation systems.

30 How Should the U.S. Air Force Depot Maintenance Activity Group Be Funded?
Activity level
Removals at base
Demands on�
base supply
Demands on�
wholesale supply
Demands on depot
maintenance
Depot inductions
Expenditures for�
real resources
X X X X X X
X X X X X X
X X X X X X
X X XX X X
X X X X X X
X X X X X X
12 months
X X X X X X
RAND MR1487-5.1
Figure 5.1—A Conceptualization of the Activity-to-Depot Process
Removals at base cause demands on base supply, but perhaps withsome lags. Similarly, demands on base supply eventually translateinto demands on wholesale supply, but not instantaneously.Managers in base and wholesale supply make a variety of discre-tionary decisions that serve to diffuse the relationship between de-mands at the flight line and depot-level activity.
Wholesale supply demands eventually translate into demands ondepot maintenance but, again, the process may be lagged based oninventory status, the financial condition of the SMAG, and otherfactors.
Depot maintenance demands do not instantaneously translate intodepot inductions because the depot system might have variousbacklogs it is managing. Only when work actually occurs do we seedepot-level expenditures recorded in H036A. As depicted in Figure5.1, these expenditures may considerably lag, by uncertain length,the activity that ultimately generated the expenditures.

Conclusions and Implications 31
We are not suggesting flying hours are irrelevant. If the flying hourprogram changes, we would expect total demand on depot shops toincrease. However, (1) it will take a long time, (2) the exact effect inany time period will be uncertain, (3) increased demand will not leadto proportionally increased expenditures even in the long run, and(4) until depot capacity actually changes, increased demand is morelikely to increase the backlog than to increase expenditures in thedepot.
AN ALTERNATIVE APPROACH TO BUDGETING
Our empirical findings are consistent with an alternative approach tobudgeting. This analysis suggests, and other analyses support theview, that the DMAG has significant fixed costs that we would notexpect to change with any measure of activity level in the operatingcommands. The current AFCAIG process recognizes that PDM costsshould be viewed in this way.
We believe that many AFMC costs considered variable in the majorcommand budgeting process are also, in all probability, fixed in anyyear of execution. For example, G&A and overhead costs account forlarge portions of DMAG component repair costs but are unlikely torespond much to changes in repair workload in the depot.
Our empirical results suggest that even costs that many would linkdirectly to component repair costs, like the costs of direct civilian la-bor, do not vary proportionately with operating command activitylevels in the months leading up to the month when AFMC incurredthese costs. In all likelihood, DMAG costs this year depend on pastdecisions about capacity that affect labor costs today. Tentative re-sults in the previous chapter also raise the possibility that past in-vestment decisions about spares parts may affect DMAG costs todayin unexpected ways. Both labor and materiel costs today may bedriven more by past investment decisions than by current activitylevels. These results suggest that the Air Force should not budget forcosts associated with direct civilian labor or materiel costs in theDMAG shops by assuming that they are related to flying hours thatoccurred in the year leading up to the month in which the DMAG in-curred these costs. The logic offered here about uncertainty, lags,discretionary action in the supply chain, and workload smoothing in

32 How Should the U.S. Air Force Depot Maintenance Activity Group Be Funded?
the DMAG shops helps us understand why no such correlation needbe present.
If actual current costs in the DMAG do not depend much on currentactivity levels in the operating commands, budgeting for these costsis more likely to succeed if it addresses the factors that do driveDMAG costs. Suppose current costs in the DMAG depend more oncurrent depot repair capacity than on current activity levels in theoperating commands. The Air Force, in effect, chooses a level ofcomponent repair capability in AFMC each year and programs re-sources to provide that capability. In fact, to be successful, ongoingefforts to implement agile combat support and an expeditionary AirForce must focus on proactively choosing a flexible maintenance ca-pability that can meet future uncertain demands when they arise.Total flying hours in any year is only one factor relevant to the designand sizing of such a capability. There is no reason to expect that ag-ile depot-level support for expeditionary forces should display a coststructure that is proportional to flying hours. Once a robust, flexibledepot repair capability is in place, the variable cost of servicing indi-vidual flying hours is likely to be small.
We have looked directly only at budgeting in this analysis. But if theempirical results presented here hold up to additional investigation,this budgeting analysis raises questions about WCF pricing as well.The literature on optimal internal transfer prices is clear that pricesshould reflect the decisions they are designed to inform. If they in-form investment decisions, they should reflect all future costs of in-vestment; if they inform the ongoing use of existing assets, theyshould reflect only marginal costs associated with marginal use ofthese assets. Fixed or sunk costs that do not vary with output levelsare irrelevant to prices that inform decisions about output. SeeBaldwin and Gotz (1998).
In this case, WCF prices should reflect information on how the costsof WCF activities, including DMAG shops, vary in response tochanges in the operating commands’ demand for the services pro-vided by these activities. Our analysis suggests that DMAG costs inany month may vary little in response to changes in the operatingcommands’ demand in the year leading up to that month. The costsmove around within the DMAG as the DMAG shifts its attention fromone class of repair activities to another. But if total capacity utiliza-
Conclusions and Implications 33
tion does not change much in response to a surge in demand,marginal costs are likely to be quite low. This finding raises ques-tions about the structure of WCF prices. If AFMC can better budgetfor funds to cover significant DMAG costs than can the operatingcommands, perhaps AFMC should take this responsibility and re-move relevant funds from the WCF altogether.
This observation accords with skepticism about the appropriatenessof current WCF pricing policies expressed in Camm and Shulman(1993), Baldwin and Gotz (1998), Keating and Gates (1999), andBrauner et al. (2000).
The new approach to cost recovery and pricing recommended by theAir Force Spares Campaign represents a useful step toward a pricingstructure consistent with the findings reported here. Under thisproposal, AFMC would receive a budget to pay for all MSD costs notdriven by operating command activity levels. Based on theprevailing wisdom about what AFMC costs are variable, the new costrecovery and pricing proposal suggests that WCF prices wouldinclude only direct labor and materiel costs. Our empirical findingssuggest that these costs are not proportional to flying hours either, atleast not within a specific year. Our findings suggest that even alarger portion of AFMC costs might be removed from the WCF andbe budgeted for directly by AFMC. Further analysis of the existingcost structure in AFMC is needed to determine what variable costs anoperating command actually imposes on AFMC when it demands aspecific service. It is quite possible that operating commands im-pose costs on AFMC mainly by demanding capacity, not individualrepairs. To the extent that this is true, it might be appropriate to ori-ent prices to annual fees for capacity rather than individual repairtransactions.
IMPROVED SUPPLY CHAIN INTEGRATION
These thoughts about budgeting and pricing focus on the Air Forcesupply chain as it currently operates. At any time, budgeting andpricing methods should be compatible with the supply chain as itcurrently operates. But the supply chain can also improve over time.One way to react to the empirical results reported here is to concludethat the supply chain is not working as well as it could. Certainly,Figure 5.1 does not portray a well-integrated supply chain. If it turns

34 How Should the U.S. Air Force Depot Maintenance Activity Group Be Funded?
out that indeed an increase in flying hours systematically shiftsDMAG focus from combat to support aircraft, the constraints in thesupply chain that cause this behavior should be removed.
If the supply chain were better integrated, DMAG expenditureswould be better aligned with current activity levels in the operatingcommands. Once alignment improved, Air Force budgeting andpricing processes should recognize the change and adjust to reflectan appropriate link between budgets and prices on the one hand andactivity levels in the operating commands on the other.

35
Appendix A
DMAG EXPENDITURES—FLEET FLYING HOURREGRESSIONS
In Chapter Four, we found a limited connection between C-135 fleetflying hours and C-135 DMAG organic repair expenditures. In thisappendix, we develop parallel analyses for seven other MDs: the B-1,B-52, C-130, C-141, C-5, F-15, and F-16. Our broad-brush finding isthat there is no evidence of a consistent, cross-system, positive flyinghour link to DMAG organic repair expenditures.
We first replicate Tables 4.1 and 4.2 for other systems and assess therelationship between official (consistent with the FY00 AFMC annualreport) DMAG organic repair expenditures and fleet flight hours. Wethen replicate and expand upon Tables 4.4 and 4.5 using accrued,rather than official, repair expenditure data.
OTHER SYSTEMS’ LINK BETWEEN OFFICIAL DMAG REPAIREXPENDITURES AND FLEET FLYING HOURS
Table A.1 shows the results of regressing official organic B-1 DMAGexpenditures on contemporaneous and 12 monthly lags of B-1 fleetflying hours. Only the current-month flying hour coefficient is posi-tive and significant. A number of other months have negative pointestimates.
As in the C-135 case, we accompany our full regression results withresults of stepwise regression. Stepwise regression endogenouslychooses which independent variables to include. The resultant re-gression is typically more parsimonious, and arguably more appro-priate, than the full regression.

36 How Should the U.S. Air Force Depot Maintenance Activity Group Be Funded?
Table A.1
Monthly Organic B-1 DMAG Repair Expenditures Regressed onMonthly Fleet Flying Hours, FY97–FY00
Observations 48
R-squared 0.35
F 1.43Pr > F 0.20
Df SS
Regression 13 1.4E12Residual 34 2.6E12Total 47 4.0E12
Coefficient SE T-Statistic P-Value
Intercept 578019 856755 0.67 0.50Current month 558.51 203.84 2.74 0.01FH-1 113.05 191.11 0.59 0.56FH-2 171.83 166.43 1.03 0.31FH-3 0.58 165.74 0.00 1.00FH-4 44.12 171.86 0.26 0.80FH-5 –148.57 170.49 –0.87 0.39FH-6 21.71 167.36 0.13 0.90FH-7 –146.23 168.16 –0.87 0.39FH-8 –10.08 170.32 –0.06 0.95FH-9 –191.97 166.76 –1.15 0.26FH-10 –29.49 162.55 –0.18 0.86FH-11 –78.57 166.11 –0.47 0.64FH-12 –330.48 174.99 –1.89 0.07
In Table A.2, we show the stepwise results for the B-1 case. Again,the current-month coefficient estimate is positive and significant.However, the negative coefficient estimates for months 7, 9, and 12imply that increased flying hours eventually have a negative effect onDMAG organic repair expenditures, netting out the positive effect ofthe current-month coefficient with the negatives in months 7, 9, and12.
We conclude that there is little evidence of a persistent positive im-pact of B-1 fleet flying hours on official B-1 DMAG organic repair ex-penditures.

DMAG Expenditures—Fleet Flying Hour Regressions 37
Table A.2
Monthly Organic B-1 DMAG Repair Expenditures RegressedStepwise on Monthly Fleet Flying Hours, FY97–FY00
Observations 48
R-squared 0.29
F 4.49Pr > F 0.00
Df SS
Regression 4 1.2E12Residual 43 2.9E12Total 47 4.0E12
Coefficient SE T-Statistic P-Value
Intercept 801755 461596 1.74 0.09Current month 550.03 173.19 3.18 0.00FH-7 –195.70 131.45 –1.49 0.14FH-9 –202.85 134.76 –1.51 0.14FH-12 –294.35 148.96 –1.98 0.05
Table A.3 presents results for the B-52. No monthly lag of fleet flyinghours has a significant effect.
Table A.4 presents stepwise results for the B-52. All three chosenmonthly lags have negative fleet flying hour coefficient estimates.
The B-52 shows no evidence of fleet flying hours increasing officialDMAG organic repair expenditures.
Table A.5 presents the now-familiar pattern of no statistically signifi-cant flying hour coefficients, this time for the C-130.
The stepwise procedure (Table A.6) reduced the number of C-130independent variables to only the five-month lag. The five-monthlag coefficient estimate is positive but statistically insignificant.
Table A.7 presents regression results for the C-141. The eight-monthlag has the lone statistically significant coefficient estimate and it isnegative.

38 How Should the U.S. Air Force Depot Maintenance Activity Group Be Funded?
Table A.3
Monthly Organic B-52 DMAG Repair Expenditures Regressed on MonthlyFleet Flying Hours, FY97–FY00
Observations 48
R-squared 0.40
F 1.75Pr > F 0.10
Df SS
Regression 13 4.0E12Residual 34 5.9E12Total 47 9.9E12
Coefficient SE T-Statistic P-Value
Intercept 5210804 1286554 4.05 0.00Current month –110.58 278.43 –0.40 0.69FH-1 –248.61 274.56 –0.91 0.37FH-2 192.33 273.11 0.70 0.49FH-3 –250.37 272.94 –0.92 0.37FH-4 –425.17 256.59 –1.66 0.11FH-5 –489.28 265.98 –1.84 0.07FH-6 –193.82 250.38 –0.77 0.44FH-7 –427.85 263.64 –1.62 0.11FH-8 86.07 260.18 0.33 0.74FH-9 187.41 259.38 0.72 0.47FH-10 –198.27 258.76 –0.77 0.45FH-11 –287.77 258.21 –1.11 0.27FH-12 –242.48 272.29 –0.89 0.38
Curiously, the C-141 stepwise procedure (Table A.8) reduces theresult to just a six-month lag. Its coefficient estimate is statisticallysignificant and positive but fairly small.
We had to handle the C-5 regression differently. Figure A.1 illustratesthe problem: recorded C-5 DMAG organic repair expendituresplummeted in early to mid calendar year 2000. We believe this dataproblem relates to the relocation of C-5 organic repair work from theclosing Kelly Air Force Base to Warner Robins Air Force Base. Thenew Warner Robins C-5 expenditures do not seem to be registeringin H036A.

DMAG Expenditures—Fleet Flying Hour Regressions 39
Table A.4
Monthly Organic B-52 DMAG Repair Expenditures Regressed Stepwise onMonthly Fleet Flying Hours, FY97–FY00
Observations 48
R-squared 0.26
F 5.16Pr > F 0.00
Df SS
Regression 3 2.6E12Residual 44 7.3E12Total 47 9.9E12
Coefficient SE T-Statistic P-Value
Intercept 3090856 614185 5.03 0.00FH-3 –337.12 220.56 –1.53 0.13FH-4 –460.44 220.45 –2.09 0.04FH-7 –477.32 197.67 –2.41 0.02
To address this problem, our C-5 analyses run up to December 1999,not September 2000 as was the case for other systems.
Table A.9 finds no monthly lags with a significant relationship be-tween C-5 DMAG official organic repair expenditures and C-5 fleetflying hours.
Table A.10 finds only a negative and insignificant relationship be-tween two-month lagged C-5 fleet hours and official C-5 DMAG or-ganic repair expenditures.
Table A.11 finds no statistically significant F-15 coefficients.
Indeed, the stepwise procedure degenerated for the F-15. No inde-pendent variables beyond the intercept term met the criterion forinclusion. Such a result is evidence of the apparent irrelevance of F-15 fleet flying hours on F-15 organic DMAG repair expenditures.
Table A.12 presents F-16 results. Unlike some other systems, fourmonths’ variables have statistically significant coefficient estimates(current month, months 5, 8, and 12), but the last three estimates arenegative.

40 How Should the U.S. Air Force Depot Maintenance Activity Group Be Funded?
Table A.5
Monthly Organic C-130 DMAG Repair Expenditures Regressed on MonthlyFleet Flying Hours, FY97–FY00
Observations 48
R-squared 0.19
F 0.63Pr > F 0.81
Df SS
Regression 13 9.9E13Residual 34 41.2E13Total 47 51.2E13
Coefficient SE T-Statistic P-Value
Intercept –14820582 17319230 –0.86 0.40Current month 897.72 501.71 1.79 0.08FH-1 133.36 472.00 0.28 0.78FH-2 0.73 469.16 0.00 1.00FH-3 96.43 484.42 0.20 0.84FH-4 –292.61 507.08 –0.58 0.57FH-5 569.77 515.10 1.11 0.28FH-6 238.87 526.88 0.45 0.65FH-7 –102.17 513.12 –0.20 0.84FH-8 57.48 501.11 0.11 0.91FH-9 13.45 502.28 0.03 0.98FH-10 175.45 502.41 0.35 0.73FH-11 –12.54 500.34 –0.03 0.98FH-12 –703.97 504.90 –1.39 0.17
The stepwise finding (Table A.13) for the F-16 is analogous. Moremonths are included than was true for other MDs, but all but thecurrent month’s point estimate are negative.
OTHER SYSTEMS’ LINK BETWEEN ACCRUED DMAG REPAIREXPENDITURES AND FLEET FLYING HOURS
We replicated the preceding analyses using accrued, rather than of-ficial, DMAG repair expenditures. We again undertook full (currentmonth and 12 monthly lags) and stepwise regression. We also esti-mated a “flying hour sum” regression in which only a constant termand the sum of the current and 12 monthly lags of flying hours areindependent variables. As noted in Chapter Four, Greg Hildebrandt

DMAG Expenditures—Fleet Flying Hour Regressions 41
Table A.6
Monthly Organic C-130 DMAG Repair Expenditures RegressedStepwise on Monthly Fleet Flying Hours, FY97–FY00
Observations 48
R-squared 0.05
F 2.36Pr > F 0.13
Df SS
Regression 1 2.5E13Residual 46 48.7E13Total 47 51.2E13
Coefficient SE T-Statistic P-Value
Intercept –1096530 4211147 –0.26 0.80FH-5 334.19 217.76 1.53 0.13
suggested this additional estimation to assuage concerns abouthighly colinear independent variables.
In the interest of parsimony, Table A.14 presents the three types ofresults for cargo/tanker MDs (C-130, C-135, C-141, and C-5). The FHcoefficient sum is the sum of the 13 flying hour coefficient estimates.The asterisks show when the sums are statistically significantly dif-ferent from zero.
We would like to highlight two points in Table A.14. First, the foursystems’ results are different on a number of dimensions: regressionR-squared, monthly lags chosen in the stepwise regression, and thesign and magnitude of the intercept terms.
What unifies the four cargo/tanker systems is that each shows a netpositive effect, under all three estimation procedures, of flying hourson accrued organic DMAG repair expenditures. Only in some of thecases, however, is the net effect estimate statistically significantlypositive. In general, the findings suggest (although the timing andmagnitude of the effects vary) that increasing cargo/tanker flyinghours eventually results in more DMAG expenditures.
The smaller scale of the “flying hour sum” coefficient estimates is nota surprise. In the first two regressions, each regression coefficient

42 How Should the U.S. Air Force Depot Maintenance Activity Group Be Funded?
Table A.7
Monthly Organic C-141 DMAG Repair Expenditures Regressed on MonthlyFleet Flying Hours, FY97–FY00
Observations 48
R-squared 0.29
F 1.08Pr > F 0.41
Df SS
Regression 13 9.2E12Residual 34 22.3E12Total 47 31.5E12
Coefficient SE T-Statistic P-Value
Intercept –19541 653263 –0.03 0.98Current month –564.23 288.30 –1.96 0.06FH-1 292.10 332.47 0.88 0.39FH-2 84.72 315.07 0.27 0.79FH-3 173.96 295.80 0.59 0.56FH-4 –347.17 298.11 –1.16 0.25FH-5 97.12 299.09 0.32 0.75FH-6 336.54 282.53 1.19 0.24FH-7 167.64 306.70 0.55 0.59FH-8 –676.55 334.22 –2.02 0.05FH-9 342.04 357.95 0.96 0.35FH-10 30.69 344.69 0.09 0.93FH-11 19.79 322.97 0.06 0.95FH-12 182.55 257.19 0.71 0.48
represents the total effect of an increase of one flying hour on DMAGexpenditures. The “flying hour sum” coefficient, by contrast, repre-sents the one-month estimate of an effect that will, in total, last for 13months (the current month through 12 months from now, inclusive).Roughly speaking, we expect the FH coefficient sums to be 13 timeslarger than the “flying hour sum” coefficients. To adjust for this scaledifference, Table 4.5’s “constrained regression” coefficient estimatesare 13 times the “flying hour sum” coefficients shown here.
As shown in Table A.15, the opposite finding holds for bombers andfighters. Each of these MDs has a negative coefficient estimate of thecumulative effect of fleet flying hours on accrued organic DMAG

DMAG Expenditures—Fleet Flying Hour Regressions 43
repair expenditures. Only in some of the cases, however, are the netcoefficient estimates statistically significantly different from zero.
Table A.8
Monthly Organic C-141 DMAG Repair Expenditures RegressedStepwise on Monthly Fleet Flying Hours, FY97–FY00
Observations 48
R-squared 0.11
F 5.75Pr > F 0.02
Df SS
Regression 1 3.5E12Residual 46 28.0E12Total 47 31.5E12
Coefficient SE T-Statistic P-Value
Intercept 320991 533690 0.60 0.55FH-6 145.06 60.48 2.40 0.02
0
5000
10,000
15,000
20,000
25,000
30,000
35,000
40,000
1996 1997 1998 1999 2000 2001
C-5
Flying hours
DMAG organic repair �expenditures (000s of FY00 $)
RAND MR1487-A.1
Figure A.1—C-5 Flying Hours and DMAG Organic Repair Expenditures

44 How Should the U.S. Air Force Depot Maintenance Activity Group Be Funded?
Table A.9
Monthly Organic C-5 DMAG Repair Expenditures Regressed on MonthlyFleet Flying Hours, FY97–December 1999
Observations 39
R-squared 0.30
F 0.82Pr > F 0.63
Df SS
Regression 13 3.1E14Residual 25 7.3E14Total 38 10.4E14
Coefficient SE T-Statistic P-Value
Intercept 15048044 17293789 0.87 0.39Current month 1989.64 1326.31 1.50 0.15FH-1 –830.10 1381.62 –0.60 0.55FH-2 –2039.65 1331.21 –1.53 0.14FH-3 –283.29 1340.47 –0.21 0.83FH-4 –1523.72 1335.85 –1.14 0.26FH-5 1143.22 1368.99 0.84 0.41FH-6 1463.44 1381.39 1.06 0.30FH-7 315.45 1358.94 0.23 0.82FH-8 1439.26 1319.45 1.09 0.29FH-9 –500.63 1309.75 –0.38 0.71FH-10 –1127.90 1307.92 –0.86 0.40FH-11 –994.59 1402.51 –0.71 0.48FH-12 1358.81 1394.61 0.97 0.34

DMAG Expenditures—Fleet Flying Hour Regressions 45
Table A.10
Monthly Organic C-5 DMAG Repair Expenditures RegressedStepwise on Monthly Fleet Flying Hours, FY97–December 1999
Observations 39
R-squared 0.08
F 3.14Pr > F 0.08
Df SS
Regression 1 0.8E14Residual 37 9.6E14Total 38 10.4E14
Coefficient SE T-Statistic P-Value
Intercept 27414613 5806349 4.72 0.00FH-2 –1996.32 1127.32 –1.77 0.08

46 How Should the U.S. Air Force Depot Maintenance Activity Group Be Funded?
Table A.11
Monthly Organic F-15 DMAG Repair Expenditures Regressed onMonthly Fleet Flying Hours, FY97–FY00
Observations 48
R-squared 0.17
F 0.52Pr > F 0.89
Df SS
Regression 13 1.7E14Residual 34 8.4E14Total 47 10.1E14
Coefficient SE T-Statistic P-Value
Intercept 36889295 28021708 1.32 0.20Current month –276.13 694.82 –0.40 0.69FH-1 249.50 546.98 0.46 0.65FH-2 –456.75 560.78 –0.81 0.42FH-3 –369.06 559.49 –0.66 0.51FH-4 –43.06 557.15 –0.08 0.94FH-5 330.93 556.92 0.59 0.56FH-6 –429.94 551.22 –0.78 0.44FH-7 –381.70 542.67 –0.70 0.49FH-8 –119.40 542.79 –0.22 0.83FH-9 –239.95 555.34 –0.43 0.67FH-10 –3.30 555.98 –0.01 1.00FH-11 –837.79 549.37 –1.53 0.14FH-12 535.59 700.16 0.76 0.45

DMAG Expenditures—Fleet Flying Hour Regressions 47
Table A.12
Monthly Organic F-16 DMAG Repair Expenditures Regressed on MonthlyFleet Flying Hours, FY97–FY00
Observations 48
R-squared 0.58
F 3.64Pr > F 0.00
Df SS
Regression 13 1.6E14Residual 34 1.1E14Total 47 2.7E14
Coefficient SE T-Statistic P-Value
Intercept 57265168 10987197 5.21 0.00Current month 372.36 162.90 2.29 0.03FH-1 –226.72 125.51 –1.81 0.08FH-2 –251.24 131.88 –1.91 0.07FH-3 –6.72 130.59 –0.05 0.96FH-4 –29.28 138.71 –0.21 0.83FH-5 –498.21 141.93 –3.51 0.00FH-6 55.52 140.31 0.40 0.69FH-7 87.27 138.02 0.63 0.53FH-8 –539.78 136.80 –3.95 0.00FH-9 –178.05 133.11 –1.34 0.19FH-10 118.64 131.33 0.90 0.37FH-11 –189.28 126.44 –1.50 0.14FH-12 –506.73 163.62 –3.10 0.00

48 How Should the U.S. Air Force Depot Maintenance Activity Group Be Funded?
Table A.13
Monthly Organic F-16 DMAG Repair Expenditures Regressed Stepwise onMonthly Fleet Flying Hours, FY97–FY00
Observations 48
R-squared 0.55
F 7.00Pr > F 0.00
Df SS
Regression 7 1.5E14Residual 40 1.2E14Total 47 2.7E14
Coefficient SE T-Statistic P-Value
Intercept 55928745 7985698 7.00 0.00Current month 373.46 145.06 2.57 0.01FH-1 –186.90 107.44 –1.74 0.09FH-2 –296.74 105.05 –2.82 0.01FH-5 –426.34 104.74 –4.07 0.00FH-8 –517.77 100.82 –5.14 0.00FH-11 –209.96 103.94 –2.02 0.05FH-12 –481.66 153.43 –3.14 0.00

DMAG Expenditures—Fleet Flying Hour Regressions 49
Table A.14
Cargo/Tanker Aircraft Accrued Expenditure—Flying Hour Estimations,FY97–FY00
C-130 C-135 C-141 C-5
Full R-squared 0.3986 0.3600 0.5852 0.4043Full F 1.68 1.43 3.58 1.25Pr > F 0.1121 0.1988 0.0015 0.3051Intercept –21093207 404572 –265733 10668207Current month 1318** 11 9 527FH-1 205 –23 204 738FH-2 190 –14 –157 –856FH-3 –130 11 –121 416FH-4 303 –18 126 1128FH-5 169 71 40 –737FH-6 149 –80 –67 –346FH-7 –17 24 91 238FH-8 279 1 –59 826FH-9 83 7 –104 –752FH-10 –217 45 102 1084FH-11 –111 9 –141 –910FH-12 –820* 32 271* –167FH coefficient sum 1401 76 194** 1189
Stepwise R-squared 0.3213 0.2358 0.5153 0.1713Stepwise F 6.79 6.79 23.39 3.62Pr > F 0.0008 0.0027 0.0001 0.0374Intercept –7335033 21657 –321397 6536509Current month 1325**FH-1FH-2FH-3FH-4 408* 1050FH-5FH-6FH-7FH-8 893FH-9 –89FH-10 65**FH-11FH-12 –1050** 35 276**FH coefficient sum 683 100** 187** 1943*
Flying sum R-squared 0.0175 0.0077 0.3853 0.0324Flying sum F 0.80 0.35 28.21 1.21Pr > F 0.3752 0.5571 0.0000 0.2795Intercept –8156751 962595 –136989 7226919Flying hour sum 53 3 14** 139
NOTE: * denotes a coefficient estimate that is statistically significant at the 95% confi-dence level; ** denotes 99% significance.

50 How Should the U.S. Air Force Depot Maintenance Activity Group Be Funded?
Table A.15
Bomber/Fighter Aircraft Accrued Expenditure—Flying Hour Estimations,FY97–FY00
B-1 B-52 F-15 F-16
Full R-squared 0.3328 0.5410 0.1900 0.7495Full F 1.27 2.99 0.60 7.60Pr > F 0.2810 0.0054 0.8401 0.0001Intercept 1894771* 6057260** 37530593 55022814**Current month 274 –385 –336 42FH-1 27 –311 57 –215**FH-2 100 –335 –225 –89FH-3 –30 –169 –571 –120FH-4 –207 –307 –2 –215**FH-5 –42 –394* 337 –174*FH-6 –38 –368 –472 –143*FH-7 –110 –341 –310 –107FH-8 –168 –254 –300 –132FH-9 –47 –128 –249 –238**FH-10 –12 110 275 –97FH-11 –97 –41 –910 –104FH-12 –343* 44 617 –118FH coefficient sum –693 –2879** –2089 –1710**
Stepwise R-squared 0.2887 0.4739 0.6579Stepwise F 4.26 6.00 12.82Pr > F 0.0055 0.0002 0.0001Intercept 1767400** 5069030** 46558775**Current month 257 –479**FH-1 –259**FH-2 –333FH-3FH-4 –257* –292 –282**FH-5 –480** –243**FH-6 –346*FH-7 –412*FH-8 –277* –208**FH-9 –294**FH-10FH-11FH-12 –355** –128*FH coefficient sum –632* –2342** –1414**
Flying sum R-squared 0.1514 0.2738 0.0234 0.5216Flying sum F 8.03 16.97 1.08 49.07Pr > F 0.0069 0.0002 0.3045 0.0000Intercept 2541950 4720745 32037630 50716508Flying hour sum –79** –164** –132 –120**
NOTE: * denotes a coefficient estimate that is statistically significant at the 95% confi-dence level; ** denotes 99% significance.

51
Appendix B
THE PERILS OF CROSS-SYSTEM ANALYSIS
Appendix A demonstrated that there is little consistent, cross-system,short-term relationship between fleet flying hours and DMAG repairexpenditures. We note in this appendix, however, that if one aggre-gates flying hour and expenditure data across systems, one can find aspurious positive and significant relationship between fleet flyinghours and DMAG repair expenditures.
20
19
18
17
16
15
LN(D
MAG
repairexpendituresin
FY01dollars)
B-1
B-52
C-130
C-135
C-141
C-5
F-15
F-16
9.5 10 1110.5 11.5
LN (flying hours)
12 12.5 13
RAND MR1487-B.1
Figure B.1—Eight MDs’ Flying Hours and DMAG Repair Expenditures

52 How Should the U.S. Air Force Depot Maintenance Activity Group Be Funded?
To illustrate this phenomenon, Figure B.1 plots the natural log of an-nual official DMAG organic repair expenditures against the naturallog of annual fleet flying hours. There are 31 observations in FigureB.1: four fiscal years (FY97–FY00) for seven MDs (B-1, B-52, C-130, C-135, C-141, F-15, and F-16) and three fiscal years of the C-5 (weomitted FY00 because of data problems).
The regression line in Figure B.1 plots the regression findings shownin Table B.1.
How is it, then, that data that show no consistent flying hour influ-ence on DMAG repair expenditures show a positive and significantimpact of the natural log of flying hours on the natural log of DMAGexpenditures when analyzed across systems?
The explanation, we believe, is that cross-system data aggregate twosystems that do not fly a large number of hours and do not cost anenormous amount of money (the B-1 and B-52) with three systemsthat both fly more and cost more in aggregate (the C-130, F-15, andF-16). The C-5 is the high-center outlier in Figure B.1: C-5s cost asurprisingly large amount given their number of flying hours.
Table B.1
Multisystem Regression of Natural Log of Annual Organic DMAG RepairExpenditures Regressed on Natural Log of Annual Fleet Flying Hours,
FY97–FY00
Observations 31
R-squared 0.38
F 17.95Pr > F 0.00
Df SS
Regression 1 15.593Residual 29 25.193Total 30 40.786
Coefficient SE T-Statistic P-Value
Intercept 8.9820 1.9442 4.62 0.00LN(flying hours) 0.7139 0.1685 4.24 0.00

The Perils of Cross-System Analysis 53
Our verdict is that cross-system estimations of this sort are spuriousin suggesting a positive and significant linkage between fleet flyinghours and DMAG repair expenditures.

55
Appendix C
COSTS, PRICES, AND BUDGETING FACTORS:BACKGROUND NOTES
It is easy to confuse concepts like “cost,” “price,” and “budgeting fac-tor.” This appendix reviews these concepts, distinguishes them, andexplains how they relate to the work in the text.
SOME BASIC DEFINITIONS
A “cost” is the value of something that an organization gives up whenit does something: The activity of depot maintenance imposes a coston the Air Force by consuming real resources that the Air Force hasthe right to use and that it cannot use elsewhere when it decides touse these resources in depot maintenance. Two kinds of costs areimportant to think about. One is a cost when the Air Force pays toget or use an asset or service from someone else. For example,
• The Air Force pays its workers wages and benefits in exchange fortheir services.
• The Air Force pays a contractor or other government organiza-tion to repair a component.
• The Air Force buys a spare part or equipment or pays for theconstruction of a facility.
In each case, money passes from Air Force accounts to external par-ties. The second cost is the opportunity cost of using assets that theAir Force owns or controls the rights to—it has already paid for therights to use. For example,

56 How Should the U.S. Air Force Depot Maintenance Activity Group Be Funded?
• The Air Force uses a test stand to repair one item rather thananother.
• The Air Force asks a full-time employee to spend her time repair-ing an item rather than going to a training class.
In each case, the Air Force experiences no direct cash flow, but it usesup a valuable asset under its control that it could have applied in an-other way.
These costs are the real costs relevant to planning when the Air Forcemakes investments, when it uses the assets it has invested in, andwhen it buys additional goods or services. When it makes invest-ments, it wants to consider the money cost of the investment. Whenit uses assets it has invested in, it wants to consider their value of al-ternative uses. When it buys additional goods and services, it wantsto consider the money cost of these purchases.
A “price” is a transfer between two parties. One party pays the priceand experiences it as a cost, because it could have used the moneyspent to buy something else. The other party receives the price andexperiences it as income. This income gives the seller resources itcan use to buy things it needs.
The Air Force uses internal transfer prices to transfer funds betweenits operating commands and AFMC. Operating commands payprices to the SMAG for spares and component repair services.Operating commands pay prices to the DMAG for programmed de-pot maintenance and engine overhauls. DMAG pays prices to SMAGfor parts; SMAG pays DMAG prices for component repair. All ofthese prices are simply transfers from one Air Force fund to another;in themselves, they impose no real costs on the Air Force as a wholeand generate no income for the Air Force as a whole. Rather, eachuse of a price imposes a cost on one Air Force organization and gen-erates income for another Air Force organization.
As long as the operating commands must turn to AFMC for support,DMAG must turn to SMAG, and SMAG must turn to DMAG, theseinternal transfer prices do not create the high-powered incentivestypically attributed to prices in a free market. The existence of theseprices typically motivates buyers and sellers to seek ways to escapethe locked relationships they have with one another. But as long as

Costs, Prices, and Budgeting Factors: Background Notes 57
the players are locked together, such prices function primarily totransfer funds from one administrative claimant to another.
A “budgeting factor” is a parameter the Air Force uses to constructfuture budgets for specific Air Force organizations. For example, asdefined above, DMAG needs a budget to pay all the external partieswho provide assets and other goods and services that the Air Forceneeds for depot maintenance. SMAG needs a budget to pay the ex-ternal parties who supply assets and other goods and services thatthe Air Force needs to procure reparable and consumable parts.Each of these organizations develops its own budget, anticipatingwhat payments it will have to make to provide the depot-level main-tenance and supply support the Air Force needs. But the Air Forcedoes not fund these organizations directly. Rather, the Air Forcefunds its operating commands, which then administratively transferfunds to DMAG and SMAG through prices. The Air Force uses bud-geting factors tied to key “cost drivers” in the operating commands toconstruct the commands’ budgets. Keep in mind that the “costs” inquestion are not costs to the Air Force—which the DMAG and SMAGmust cover each year—but costs to the operating commands in theform of the prices they pay for DMAG and SMAG services. DMAGand SMAG then make decisions that seek to generate enough incometo cover the budgets they have developed to define their expectedcosts during any year.
For simplicity, the discussion above says nothing about timing.Timing can be important because
• The Air Force records an event—for example, a payment—at adifferent time than it actually occurs, creating uncertainty aboutactual timing.
• Discount rates and inflation rates affect the meaning of costs,prices, and budgeting factors stated for different dates.
• An announcement at one date can affect actions at another date,transferring the time at which an organization experiences theeffects of those actions. For example, if an organization obligatesmoney today or even expects today to obligate money in the fu-ture, it may experience elements of the “real cost” associatedabove with an actual expenditure, which could come at a muchlater date. Similarly, a proposed budget may lead an organiza-

58 How Should the U.S. Air Force Depot Maintenance Activity Group Be Funded?
tion to act before authorizations, appropriations, and a finalbudget define the money it will actually have available.
These timing factors can be critical. They need to be considered inthe particular circumstances of any policy issue.
Costs, prices, and budgeting factors all have incentive effects. Costsby definition constrain any organization’s alternatives. An organiza-tion naturally asks whether the value it gets from a good, services, ordecision exceeds its cost. If value is not high enough, the organiza-tion must ask why it needs the good or service or why it should makethe decision.
By transferring money, prices impose costs on the buyer and gener-ate income for the seller. Economists often argue that prices shouldbe designed to align the incentives faced by buyer and seller; theprice should reflect the real cost to the seller, so that the buyer agreesto pay the price only when the value of the transaction to itself ex-ceeds the true cost of the transaction to the seller. When buyer andseller are locked together, such decisions cannot occur. When pricesare not meant to inform decisions, it is best to design them for ad-ministrative simplicity and to coordinate them with budgeting fac-tors to ensure that the financial management system does not artifi-cially constrain the substantive performance of the supply chain.Such actions in effect seek to wash maladaptive incentives out of aninternal transfer pricing system.
Over the long turn, budgeting factors can have incentive effects if theorganization being funded asks how a budgeting factor compareswith the cost it expects to perform the activity in question. For ex-ample, an operating command could try to increase flying hours ifthe budgeting factor it received for flying hours were too high and tocut flying hours if the factor were too low. Any incentives associatedwith budgeting factors obviously operate on a different time horizonthan the incentives associated with costs or prices discussed above.
OUR FOCUS
Our focus is specific. Given the real costs that AFMC can expect toincur in a particular year to support the operating commands, de-fined in terms of real payments to external parties for assets and

Costs, Prices, and Budgeting Factors: Background Notes 59
other goods and services, how well does the current budgetingmethod to cover these costs work? And more specifically, how welldoes that method work with regard to the real costs in the DMAG?Phrased in this way, these questions raise the following subsidiaryquestions:
1. What methods does the Air Force use to budget for these costs?
2. How does the money budgeted move from the Air Force organi-zations that receive the money to the Air Force organizations thatpay the Air Force’s bills?
3. How should we measure the “real costs” to the Air Force of payingits bills?
4. How can we link answers to the three subsidiary questions aboveto answer our primary questions?
1. The Air Force process to build the budgets that will cover DMAGcosts is very complex. At the heart of this process are two costdrivers and associated budgeting factors:
• Number and types of programmed depot maintenance, engineoverhaul, and other major actions. The cost drivers are thenumber and type; the budgeting factors are costs to the operat-ing commands of receiving these services from AFMC.
• Number and types of flying hours. The cost drivers are the num-ber and type; the budgeting factors are the costs to the operatingcommands of receiving the services required from AFMC to sup-port these flying hours.
For simplicity, we focus on the second type of budgeting factor bylooking only at the costs that DMAG associates with JONs that serviceday-to-day operating command demands likely to be driven by flyinghours.
2. The Air Force uses prices for individual component repairs tomove funds budgeted for the operating commands to the SMAG;it uses another set of prices to move funds from the SMAG to theDMAG. The SMAG and DMAG both operate under financial man-agement constraints that seek to make their incomes in any fiscal

60 How Should the U.S. Air Force Depot Maintenance Activity Group Be Funded?
year as close as possible to their costs. That is, each maintains aportion of the Air Force Working Capital Fund. And each seeks tomaintain a net operating result (NOR) of zero in each fiscal year ofoperation. When this nominal goal is achieved, all of the moneybudgeted for operating commands to cover their flying hours eachyear flow through the SMAG to the DMAG, which then spends allof that money to pay external sources of goods and services.Expenditures need not occur in the same year as the budget.Budgeted funds this year can cover expenditures next year; bud-geted funds from previous years can cover expenditures this year.But the DMAG and SMAG both operate their working capitalfunds within very tight tolerances; the more closely budgetedfunds and expenditures match one another in real time, the moresmoothly these working capital funds run.
3. The “real costs to the Air Force” relevant to this inquiry are thecosts that the Air Force has budgeted for to pay for the AFMC ser-vices to support day-to-day operations in the operating com-mands. Ideally, we would identify all cash payments from AFMCrequired to support the services provided in the DMAG andSMAG. The AFMC financial management community maintainssuch data, but it does not link them to information directly rele-vant to the operating commands because it has not been asked todo so. Hence, we sought data on “real costs” as close to this idealas possible to link to operating command demands.
A search through alternatives in AFMC revealed the H036A databaseas the best compromise among these goals. Most important, it pro-vides a link between expenditures in DMAG shops and identifiableweapon systems in the operating commands. It identifies the costthat AFMC allocates to each JON each month. Although it does nottake us directly to the checks that the Air Force cuts to pays its bills inDMAG, it gets close. The following details help explain how close itgets.
A JON covers a particular maintenance action in a particular re-source cost recovery center. AFMC does not maintain data on theactual checks cut to support each individual JON. At best, it canmaintain expenditures to external parties at the RCCC level; in somecases, it maintains such expenditure data for several RCCCs

Costs, Prices, and Budgeting Factors: Background Notes 61
managed jointly. AFMC policy uses a set of formulas to allocate ex-penditures to individual JONs.1
• One formula uses a standard for the labor hours required toachieve a task to allocate standard labor hours to a JON. Thisstandard is based on historical experience with each task and isupdated periodically as experience accumulates.
• Another formula sums standard hours across JONs to determinehow many standard labor hours have been expended at theRCCC level or higher.
• AFMC uses the ratio between this total standard figure and thetotal actual labor hours spent on all work at this level to define ameasure called “labor efficiency”; the higher the labor efficiency,the more standard hours a given level of actual hours generates.
• AFMC divides its actual cost per labor hour by its labor efficiencyto generate a value for the labor cost per standard hour.
• To identify the labor cost of a JON, AFMC can then multiply thestandard hours for the JON by the calculated cost per standardhour.
This cost includes a factor to capture the cost of low-value consum-ables and other materiel. The cost of higher-value materiel is identi-fied directly with each relevant JON. Indirect costs are added with aset of standard factors.
Each JON “expenditure,” then, includes
• an estimated cost for labor that, summed across all labor em-ployed in the relevant accounting unit, covers all actual laborcosts in that unit,
• a factor to pick up the estimated cost of low-value materiel inproportion to standard labor applied,
• actual cost for high-value materiel, and
______________ 1An OSD study is reviewing how data enter H036A to determine whether this policy isapplied in practice. Because the study was not complete when we published, we can-not look beyond the formal policy itself.

62 How Should the U.S. Air Force Depot Maintenance Activity Group Be Funded?
• a charge for indirect costs that covers all other costs in theDMAG.
How close is this estimate of expenditures to the actual value ofchecks cut in a particular period? Two questions are important:
• How close are the actual and the attributed labor cost? As notedabove, the sum of attributed costs finally equals the actual cost asyou aggregate more JONs. We aggregate JONs to develop a valuefor all JONs associated with a particular weapon system (at theMD level). This aggregation alone will tend to wash out randomerrors associated with individual JONs. That said, any remainingerror will weaken any relationship we can establish between ex-penditures and flying hours, and we cannot quantify how largethat effect might be. Remaining error will be larger and moretroubling if systematic biases exist in the standard labor hoursassociated with one MD when compared with the standard laborhours associated with another MD drawing services from DMAGshops within the same accounting center. If such biases exist,the nominal method explained above systematically overesti-mates the actual labor hours for one MD and underestimates theactual labor hours for another. We are unaware of any such bi-ases, and we have not been given any reason to expect them.Further work may be appropriate to determine their influence.
• How close in time are the expenditures attributed to a JON andthe actual government checks associated with these expendi-tures? This is the subject of an ongoing OSD study; no resultswere available when we published. We assume that AFMC at-tributes expenditures to JONs close to the time when the AirForce pays for the goods and services relevant to these JONs.Differences could introduce errors that weaken any relationshipwe can establish between expenditures and flying hours, and wecannot quantify how large that effect might be.
4. We link Air Force budgeting methods to “real costs” to the AirForce by crafting an analytic method that reflects all of the aboveconsiderations.

Costs, Prices, and Budgeting Factors: Background Notes 63
• We focus on flying hours as the primary cost driver, because theAir Force uses flying hours to budget for the support of day-to-day operations.
• We employ a definition of “real costs” that allows us to use exist-ing data to link costs to operating individual weapon systemsday-to-day.
• We focus on the expenditures that that definition allows us tolink most directly: DMAG expenditures on JONs that can be as-sociated with the repair of components linked to specific weaponsystems.
• We recognize difficulties in the potential gap—in the definitionof labor costs and in timing—between measured expenditureson JONs and the ideal “real cost” that we seek. We expect suchdifficulties to affect primarily the error term in our statisticalmodel.
• We adjust the Air Force data to allocate the cost of each JON to amonth. For our purposes, subject to the concerns about dataproblems, we believe this allocation yields a more meaningfulmeasure of real cost than the Air Force measure based on JONswhen they close out.
• We depend on management decisions in the operating com-mands, SMAG, and DMAG, which are consistent with each oftheir organizational goals, to transform demands associated withflying hours into DMAG expenditures.
• Recognizing the uncertainties about the levels and timing of ef-fects implied by the above considerations, we use an open defi-nition of a lag structure in our statistical model. We have no ba-sis for closing that definition or even expecting that it will looksimilar across weapon systems. We want the data to drive anyrelationship we can find between flying hours and DMAG ex-penditures as hard as possible.
Stated in terms of costs, prices, and budgeting factors, our analysis:
• Tries to focus on real costs to the Air Force of supporting day-to-day operations in the operating commands.

64 How Should the U.S. Air Force Depot Maintenance Activity Group Be Funded?
• Has no direct interest in the values of prices that act as simpletransfers within the Air Force. But it recognizes that the currentuse of such prices, with associated working capital funds andcontrols on these funds, should play a critical role in how de-mands in the operating commands affect real costs to the AirForce. It takes those effects as given and focuses on understand-ing how well the current system links operational budgets andactual costs to the Air Force in any year.
• Takes the budgeting factors that the Air Force uses to reflect thecost of day-to-day operations as given. Very simply, it asks howwell these factors work to generate budgets for the operatingcommands that will in fact cover the real costs to the Air Forcethat these commands impose in their day-to-day operations.

65
REFERENCES
Adams, John L., John B. Abell, and Karen Isaacson, Modeling andForecasting the Demand for Aircraft Recoverable Spare Parts,RAND, R-4211-AF/OSD, 1993.
Air Force Materiel Command, Fiscal Year 2000 Annual Report.
Air Force Materiel Command Reparable Spares Management Board(Frank Camm, chair), Final Report, Wright-Patterson Air ForceBase, Ohio, March 1998.
Bachman, Tovey C., and Karl Kruse, Forecasting Demand for WeaponSystem Items, Logistics Management Institute, McLean, VA,DL310R1, July 1994.
Baldwin, Laura H., and Glenn A. Gotz, Transfer Pricing for Air ForceDepot-Level Reparables, RAND, MR-808-AF, 1998.
“Boeing to Examine Kelly AFB Facilities at San Antonio for FutureWork,” Boeing news release 97-179 (http://www.boeing.com/news/releases/1997/news_release_970908n.html), September 8,1997.
Brauner, Marygail K., Ellen M. Pint, John R. Bondanella, Daniel A.Relles, and Paul Steinberg, Dollars and Sense: A Process Improve-ment Approach to Logistics Financial Management, RAND,MR-1131-A, 2000.
Brown, Bernice B., “The Unpredictability of Demand for AircraftSpare Parts,” RAND, internal document, 1956.

66 How Should the U.S. Air Force Depot Maintenance Activity Group Be Funded?
Camm, Frank, and H. L. Shulman, When Internal Transfer Prices andCosts Differ: How Stock Funding of Depot-Level Reparables AffectsDecision Making in the Air Force, RAND, MR-307-AF, 1993.
Cohen, I. K., John B. Abell, and T. Lippiatt, Coupling Logistics toOperations to Meet Uncertainty and the Threat (CLOUT), RAND,R-3979-AF, 1991.
Crawford, Gordon, Variability in the Demands for Aircraft SpareParts: Its Magnitude and Implications, RAND, R-3318-AF, 1988.
Feinberg, Amatzia, H. L. Shulman, L. W. Miller, and Robert S. Tripp,Supporting Expeditionary Aerospace Forces: Expanded Analysis ofLANTIRN Options, RAND, MR-1225-AF, 2001.
Gillert, Douglas J., “Closing Kelly: Three Priorities,” American ForcesInformation Service News Articles.
Hodges, James S., Modeling the Demand for Spare Parts: Estimatingthe Variance-to-Mean Ratio and Other Issues, RAND, N-2086-AF,1985.
Keating, Edward G., and Susan M. Gates, Defense Working CapitalFund Pricing Policies: Insights from the Defense Finance andAccounting Service, RAND, MR-1066-DFAS, 1999.
Pyles, Raymond A., and Hyman L. Shulman, United States Air ForceFighter Support in Operation Desert Storm, RAND, MR-468-AF,1995.
Robbert, Albert A., Susan M. Gates, and Marc N. Elliott, Outsourcingof DoD Commercial Activities: Impacts on Civil Service Employees,RAND, MR-866-OSD, 1997.
United States Department of Commerce, Bureau of EconomicAnalysis Web site (http://www.bea.doc.gov).
United States General Accounting Office, Air Force Supply Manage-ment: Analysis of Activity Group’s Financial Reports, Prices, andCash Management, GAO/AIMD/NSIAD-98-118, Washington, DC,June 1998.

References 67
United States General Accounting Office, Air Force Supply:Management Actions Create Spare Parts Shortages and OperationalProblems, GAO/NSIAD/AIMD-99-77, Washington, DC, April 1999.
United States General Accounting Office, Air Force Depot Mainten-ance: Analysis of Its Financial Operations, GAO/AIMD/NSIAD-00-38, Washington, DC, December 1999.
United States General Accounting Office, Air Force Depot Mainten-ance: Budgeting Difficulties and Operational Inefficiencies,GAO/AIMD/NSIAD-00-185, Washington, DC, August 2000.
Wallace, John M., Dale A. Kem, and Caroline Nelson, Another Look atTransfer Prices for Depot-Level Reparables, Logistics ManagementInstitute, PA602T1, McLean, VA, January 1999.
Related Documents