BTO RESEARCH NOTE How should static detectors be deployed to produce robust national population trends for British bat species? Stuart Newson

Welcome message from author
This document is posted to help you gain knowledge. Please leave a comment to let me know what you think about it! Share it to your friends and learn new things together.
Transcript

BTO RESEARCH NOTE
How should static detectors be deployed to produce robust national population trends for British bat species?Stuart Newson

INTRODUCTION There is growing use of full-spectrum bat detectors to survey bats and other taxa (Newson et al. 2015, 2017a, 2017b). These can be left outside to automatically trigger and record bats. They capture bat calls at their original frequency, and retain more detail of the calls than other detector types, making identification easier and providing an archive of recordings which may be used in future studies (e.g. of acoustically similar species). When used in conjunction with call identification software and validation, these detectors have the potential to transform large-scale bat monitoring in the UK. However, there are several questions to be answered regarding how these detectors should be best deployed.
Detectors generate a large volume of recordings per night, but the number of recordings can be highly variable depending on nightly weather conditions, local habitat, bats’ use of features in the landscape and other spatial factors, for example proximity to a roost. A future survey would need a sampling strategy that could address these issues and be capable of detecting a robust trend signal. This research note aims to answer key questions regarding the design of a large-scale static detector bat survey.
METHODSA key question for a future survey is how sampling effort should be allocated in space and time. To answer this question I perform a power analysis focussing on the ability of different survey designs to detect changes in site occupancy. I do this appreciating that, given a better understanding of bat activity and its relationship with abundance, changes in abundance would provide a more sensitive measure of change in the future. In comparison, using occurrence, a species must be lost from a site before population change is detected. I consider the power to detect a 25% decline in occurrence. This degree of range contraction would qualify a bird species for Amber-listing under Birds of Conservation Concern criteria so is an appropriate benchmark for deciding on effectiveness of different sampling schemes. Specifically, I examine how power changes with the number of sites surveyed (100, 500, 1000 and 1500 1-km squares) and number of nights of bat recording (3, 5 or 10 nights) at each site.
As bat species vary in their detection probability, I look at the full range of detection probabilities (0–1). As a guide, I consider existing estimates of detection probability for British bat species (Table 1, from Scott & Altringham 2014; Froidevaux 2016).
British bats vary in their prevalence so I also consider the full range of occupancy probabilities (0–1), representing localised to widespread species. Whilst not formal estimates of occupancy probability, I consider a likely range of values by looking at the proportion of sites recording different bat species in Norfolk and southern Scotland. For all analyses, I assume a significance level of 0.05 and aim for a power of 80% or more. The approach here is cautious in that it estimates power to detect change based on samples from a first and last year. In practice, a monitoring scheme is likely to collect data every year, which would all contribute to the estimation. R scripts for the power analyses were adapted from supplementary material in Guillera-Arroita & Lahoz-Monfort (2012).
RESULTSFigure 1 shows how the power to detect a 25% decline in range increases as detection probability and occupancy probability increase. Increasing the number of nights of recording best counteracts low detection probability, and increasing the number of sites counteracts low occupancy probability. The balance of number of sites and nights that allows a trend to be confidently detected varies among species (Table 2).
Table 1. Estimates of detection probability for UK bats from Froidevaux (2016) and Scott & Altringham (2014), and proportion of sites recording each species in southern Scotland (Newson et al. 2017b) and Norfolk (Newson et al. 2015). The proportion of sites recording each species is used here as a surrogate for occupancy probability. The values presented here will vary within species, depending on species abundance at a local scale and a range of other factors, but are presented here to guide the likely range of variation in detection probabilities for different species and range of occupancy probabilities that may be observed for localised to widespread species.
Detection probability Occurrence probability Froidevaux Scott & Altringham value used Scotland Norfolk value usedSpecies (2016) (2015)
Soprano Pipistrelle 0.94 0.97 0.96 0.90 0.95 0.93Common Pipistrelle 0.98 0.92 0.95 0.88 0.99 0.93Nathusius’ Pipistrelle 0.60 - 0.60 0.03 0.28 0.16Noctule 0.90 0.863 0.88 0.22 0.62 0.42Leisler’s Bat 0.321 0.863 0.86 0.32 0.10 0.21Serotine 0.91 0.863 0.89 - 0.36 0.36Brown Long-eared Bat 0.29 0.29 0.29 0.34 0.47 0.41Barbastelle - 0.78 0.78 - 0.40 0.40Whiskered / Brandt’s Bat 0.782 0.88 0.83 0.21 0.22 0.22Natterer’s Bat 0.782 0.44 0.61 0.51 0.34 0.43Daubenton’s Bat 0.782 - 0.78 0.41 0.23 0.32
1 Estimate appears low compared with other estimates for this and Nyctalus species and not used.2 Estimate here is for Myotis species combined.3 Estimate here is for Nyctalus and Eptesicus combined.
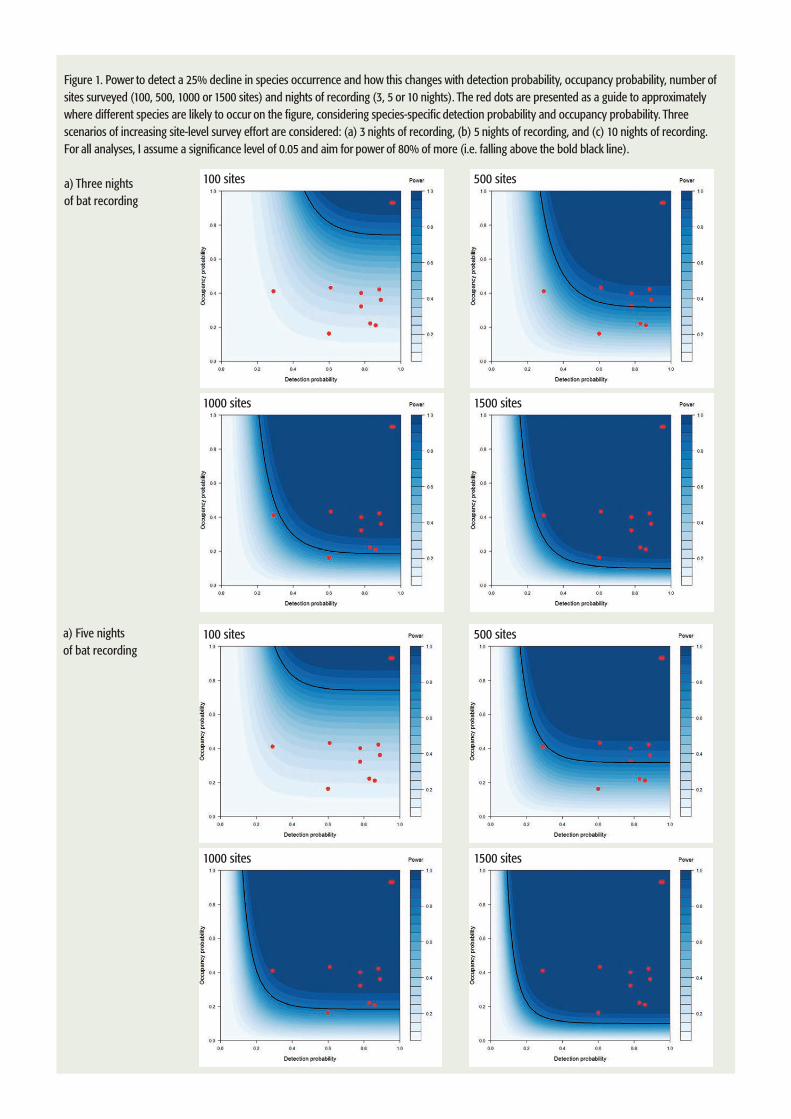
Figure 1. Power to detect a 25% decline in species occurrence and how this changes with detection probability, occupancy probability, number of sites surveyed (100, 500, 1000 or 1500 sites) and nights of recording (3, 5 or 10 nights). The red dots are presented as a guide to approximately where different species are likely to occur on the figure, considering species-specific detection probability and occupancy probability. Three scenarios of increasing site-level survey effort are considered: (a) 3 nights of recording, (b) 5 nights of recording, and (c) 10 nights of recording. For all analyses, I assume a significance level of 0.05 and aim for power of 80% of more (i.e. falling above the bold black line).
a) Three nights of bat recording
a) Five nights of bat recording
100 sites
100 sites
500 sites
500 sites
1000 sites
1000 sites
1500 sites
1500 sites

DISCUSSION AND RECOMMENDATIONS
Sampling effortTo survey the full range of species considered here, I make the following observations and recommendations:
1. A minimum of 1,500 1-km squares are surveyed every year.
2. An increase in the number of nights of bat recording (> 4 nights of recording) during a CORE recording period has the potential to increase the number of species detected at a site, and the power to detect change. This will have the greatest benefit for species occurring at low density and / or with a low detection probability. The CORE recording period would best focus on a period prior to the young becoming volant, to prevent trends reflecting annual productivity. Accounting for variation in nights of recordings in trend analyses would be straightforward by including 1 /
Figure 1. (Continued) Power to detect a 25% decline in species occurrence and how this changes with detection probability, occupancy probability, number of sites surveyed (100, 500, 1000 or 1500 sites) and nights of recording (3, 5 or 10 nights). The red dots are presented as a guide to approximately where different species are likely to occur on the figure, considering species-specific detection probability and occupancy probability. Three scenarios of increasing site-level survey effort are considered: (a) 3 nights of recording, (b) 5 nights of recording, and (c) 10 nights of recording. For all analyses, I assume a significance level of 0.05 and aim for power of 80% of more (i.e. falling above the bold black line).
a) Ten nights of bat recording
100 sites 500 sites
1000 sites 1500 sites
number of nights as an offset. However, there is a trade-off where surveying a subsequent new site once the minimum number of nights of recording has been reached, would have a greater benefit to a scheme than surveying one site with a large survey effort. Guidance should be given on this.
3. Recording outside the CORE period should be encouraged. This is a lower priority, but doing so would allow for an improved understanding of the influence of season on bats. It would also make better use of the available volunteer base and detectors if detectors are not a limiting factor. Doing this is also likely to be more interesting for the volunteer. This could be done by allowing for additional optional EARLY and LATE season recording.
Ignoring the challenges involved in the identification of Myotis bat, some species like Grey Long-eared Bat and Bechstein’s
Bat are more localised in the UK than those considered here. For these species, more intensive targeted surveys are likely to be needed than the general recommendations made above.
Sampling designThe power analysis offers recommendations for the appropriate number of sites, but there remain questions about how these should be spatially distributed. In general, surveys are most robust if data are collected according to a random or representative survey design. There are ways to stratify the survey design to maximise the use of volunteers in areas where there are more people, and so more potential volunteers. The size of sampling sites also should be considered. I recommend that:
1. The survey unit should be the 1-km square, comparable with the National Bat Monitoring Programme Field Survey, and with national monitoring schemes for other species groups.
2. A statified random survey design is used, where 1-km squares (e.g. 2% of the UK) are pre-selected at random from within regions (defined later) according to the likely volunteer base (e.g. human population density) in these areas. Incidentally, this would allow for greater survey coverage in
southern England, where there is a greater diversity of bat species. The survey could use the same regions that are currently used for the UK Breeding Bird Survey (Fig. 2), which are roughly based on counties or groups of counties. It is important to get the right size of regions. Some current administrative zones
are too small for effective coordination whilst Government Office Regions are too large for this purpose. Through such a stratified design, it would be straightforward to use a weighting in analyses to control for planned variation in volunteer uptake in different parts of the UK, whilst maximising the involvement of volunteers in areas where there are more people.
3. Whilst a random or representative survey design is recommended, and used by other comparable schemes (e.g. UK Breeding Bird Survey, Harris et al. 2017), this would limit the likely number of volunteers taking part. One option would be to encourage volunteers to select and survey a pre-selected random 1-km square where possible, but to permit some flexibility to allow other sites to be surveyed where this is not possible. Doing this potentially offers the best of both worlds, in that representative trends could be produced from the random sample of 1-km squares if needed, but that there is the potential to encourage larger-scale participation than would otherwise be possible. It may be possible to add these data at a later stage if the sample is not significantly different from a random sample, or if a post-hoc weighting is able to adequately control for observed biases. This approach would also make sense if the scheme were to use a ‘pay to take part’ funding model, where a large volunteer base, would be better able to support national bat monitoring.
Table 2. Summary of the sampling strategies that would successfully detect a 25% decline in occurrence with 80% power for the main bat species found in the United Kingdom.
Species 100 sites 500 sites 1,000 sites 1,500 sites No. visits 3 5 10 3 5 10 3 5 10 3 5 10
Soprano Pipistrelle Y Y Y Y Y Y Y Y Y Y Y Y Common Pipistrelle Y Y Y Y Y Y Y Y Y Y Y YNathusius’ Pipistrelle Y Y YNoctule Y Y Y Y Y Y Y Y YLeisler’s Bat Y Y Y Y Y YSerotine Y Y Y Y Y YBrown Long-eared Bat Y Y Y Y Y YBarbastelle Y Y Y Y Y Y YWhiskered / Brandt’s Bat Y Y Y Y Y YNatterer’s Bat Y Y Y Y Y Y Y Y YDaubenton’s Bat Y Y Y Y Y Y Y Y Y
Depl
oyin
g a
dete
ctor /
Stu
art N
ewso
n

Figure 2. Regions used for BTO surveys stratified here by human population density.

Detector placementIn contrast to the method employed for the Norfolk Bat Survey (Newson et al. 2015), where detectors are moved within the 1-km on consecutive nights, the power analysis and recommendations above are based on the assumption that the detector is deployed in the same place within the square on all nights. In many cases, it would not be practical or desirable for volunteers to position their detector randomly within a square. Indeed, enforcing this is likely to be a barrier to volunteer involvement. Guidance could be given for choosing a suitable recording location as close to the centre of a square as possible, but probably emphasis would be better placed on maximising the number and quality of recordings. Whilst these may not always be practical, I recommend that:-
1. Detectors / microphones should be deployed at least 5 feet (1.5 meters) in any direction from vegetation or other obstructions.
Newson, S. 2017. How should static detectors be deployed to produce robust national population trends for British bat species?BTO, Thetford.
REFERENCES
Guillera-Arroita, G. & Lahoz-Monfort, J.J. (2012) Designing studies to detect differences in species occupancy: power analysis under imperfect detection. Methods in Ecology and Evolution 3: 860–869.
Harris, S.J., Massimino, D., Gillings, S., Eaton, M.A., Noble, D.G., Balmer, D.E., Procter, D. & Pearce-Higgins, J.W. (2017). The Breeding Bird Survey 2016. BTO Research Report 700 British Trust for Ornithology, Thetford.
Froidevaux, J. (2016). Preliminary results of the South West Project. Report for the Bat Conservation Trust.
Newson, S.E., Bas, Y., Murray, A., Gillings, S. (2017a) Potential for coupling the monitoring of bush-crickets with established large-scale acoustic monitoring of bats. Methods in Ecology and Evolution 8: 1051–1065.
Newson, S.E., Evans, H.E. & Gillings, S. (2015) A novel citizen approach for large-scale standardised monitoring of bat activity and distribution, evaluated in eastern England. Biological Conservation 191: 38–49.
Newson, S.E., Evans, H.E., Gillings, S., Jarrett, D., Raynor, R. & Wilson, M.W. (2017b) Large-scale citizen science improves assessment of risk posed by wind farms to bats in southern Scotland. Biological Conservation 215: 61–71.
Scott, C. & Altringham, J. (2014) Developing effective methods for the systematic surveillance of bats in woodland habitats in the UK. Final report to Defra. WC1015. University of Leeds, Leeds.
2. Detectors should be placed away from lighting (e.g. a house with lights). Failure to do so is likely to reduce the diversity of species recorded, where several species avoid light.
3. Where close to water, volunteers should avoid positioning the microphone directly next to water, to avoid reflection of sound from the water’s surface.
4. Because bats will often follow linear landscape features like hedgerows or tree lines, I recommend that detectors are placed adjacent to these features where possible to maximise number of recordings.
Leisl
er’s
Bat /
Mar
k Car
mod
y

Newson, S. 2017. How should static detectors be deployed to produce robust national population trends for British bat species? BTO, Thetford.
There is growing use of full-spectrum bat detectors to survey bats and other taxa. These can be left outside to automatically trigger and record bats. They capture bat calls at their original frequency, and retain more detail of the calls than other detector types, making identification easier and providing an archive of recordings which may be used in future studies (e.g. of acoustically similar species). When used in conjunction with call identification software and validation, these detectors have the potential to transform large-scale bat monitoring in the UK. However, there are several questions to be answered regarding how these detectors should be best deployed.
Detectors generate a large volume of recordings per night, but the number of recordings can be highly variable depending on nightly weather conditions, local habitat, bats’ use of features in the landscape and other spatial factors, for example proximity to a roost. A future survey would need a sampling strategy that could address these issues and be capable of detecting a robust trend signal. This research note aims to answer key questions regarding the design of a large-scale static detector bat survey.
BTO Research Notes and Research Reports make available the latest findings on topics of research, conservation and policy interest. Much of the work published in these notes and reports also appears as peer-reviewed scientific papers.
Images: Cover shot: Owen Newman, Nature Photographers; Back cover: Rory Tallack / Stuart Newson / Stuart Newson
British Trust for Ornithology, Thetford, Norfolk, IP24 2PU. www.bto.orgRegistered Charity – Number 216652 (England & Wales), SC039193 (Scotland).
Related Documents


