University of Arkansas, Fayeeville ScholarWorks@UARK Accounting Undergraduate Honors eses Accounting 12-2015 How Relevant is the Disclosure of a CEO Pay Ratio? Addison Stanfill University of Arkansas - Main Campus Follow this and additional works at: hp://scholarworks.uark.edu/acctuht Part of the Accounting Commons , Benefits and Compensation Commons , and the Finance and Financial Management Commons is esis is brought to you for free and open access by the Accounting at ScholarWorks@UARK. It has been accepted for inclusion in Accounting Undergraduate Honors eses by an authorized administrator of ScholarWorks@UARK. For more information, please contact [email protected], [email protected]. Recommended Citation Stanfill, Addison, "How Relevant is the Disclosure of a CEO Pay Ratio?" (2015). Accounting Undergraduate Honors eses. 19. hp://scholarworks.uark.edu/acctuht/19

Welcome message from author
This document is posted to help you gain knowledge. Please leave a comment to let me know what you think about it! Share it to your friends and learn new things together.
Transcript

University of Arkansas, FayettevilleScholarWorks@UARK
Accounting Undergraduate Honors Theses Accounting
12-2015
How Relevant is the Disclosure of a CEO PayRatio?Addison StanfillUniversity of Arkansas - Main Campus
Follow this and additional works at: http://scholarworks.uark.edu/acctuht
Part of the Accounting Commons, Benefits and Compensation Commons, and the Finance andFinancial Management Commons
This Thesis is brought to you for free and open access by the Accounting at ScholarWorks@UARK. It has been accepted for inclusion in AccountingUndergraduate Honors Theses by an authorized administrator of ScholarWorks@UARK. For more information, please contact [email protected],[email protected].
Recommended CitationStanfill, Addison, "How Relevant is the Disclosure of a CEO Pay Ratio?" (2015). Accounting Undergraduate Honors Theses. 19.http://scholarworks.uark.edu/acctuht/19
1
How Relevant is the Disclosure of a CEO Pay Ratio?
Addison Stanfill, University of Arkansas
ABSTRACT
An aftershock of the so called “Great Recession” in 2008, the Dodd-Frank Wall Street Reform
and Consumer Protection Act effective July 21, 2010 aimed to increase the transparency of
public companies. Section 953(b) of this act is targeting the transparency of executive and
employee compensation by requiring the disclosure of a CEO to median employee pay ratio.
This disclosure requirement, set to affect all filings with a fiscal year beginning after January 1,
2017, was a response to the public outcry against excessive CEO compensation. Although it
does promote the transparency initiative of the Dodd-Frank Act, this disclosure may be wholly
unnecessary. Because total CEO compensation is already a required disclosure, this study is
examining the benefits and necessity of Section 953(b) by taking into account the driving force
behind the ratio and its effect on the business environment.

2
INTRODUCTION
An economy naturally undergoes periods of expansion and recession. This normal
business cycle is a consistent component of economies globally. During expansionary times,
output, employment, and inflation rise. Conversely, recessionary periods face falling output and
increasing unemployment (Romer). Although business cycles are ordinary trends, sometimes
the trends peak or pit to a greater magnitude than expected. Particularly during an excessive
pit, public dissent grows in strength pressuring politicians and businesses to reevaluate their
position and seek mediating solutions to the issues at hand. In December of 2007, the economy
underwent a downturn outside of normal conditions. Economic indicators fell beneath levels
expected during ordinary recessionary periods. This kicked off a period which ran until mid-
2009 known as the “Great Recession” (U.S Bureau of Labor Statistics). Consistent with previous
economic downturns of large magnitude, public outcry and dissent grew large. Government
and politicians were put under pressure to easing the swelling tide and provide constituents
with some relief from growing financial pain. The response came on July 21, 2010 when the
Dodd-Frank Wall Street Reform and Consumer Protection Act was passed.
The Dodd-Frank Act was the response to the “Great Recession” with the goal of
reducing the likelihood of a future recessionary period reaching such magnitude. This is widely
considered the most far reaching Wall Street reform in history specifically targeting abusive
financial practices and opaque business reporting (The White House). In conjunction with the
public disapproval of the recession, a growing number of companies began to come under fire
for their executive compensation packages. As a growing number of Americans became jobless,
3
or received reduced pay, CEO pay was growing from its already high levels. The combination of
opaque reporting and public discord with CEO pay led to the inclusion of Section 953(b) in the
Dodd-Frank Act. This section’s particular aim was to quell the popular demand that something
be done to regulate CEO pay.
CEO Pay Trends
CEO pay has been one of the hottest business topics in the recent past. Public outcry has
grown substantially over time requiring politicians to act and include the aforementioned
Section 953(b) in the Dodd-Frank Act. But why is this such a trending topic, and why do so many
people actually care?
People care about CEO pay trends, because they care about money. Every dollar going
to a CEO is a dollar not going to them or to someone else who goes to work every day just like
that CEO. And when that CEO is earning substantially more money than the average employee,
people tend to take exception. The argument is not that CEOs do not deserve to be the highest
paid employee at any given company, but rather that the CEO’s compensation is so far in excess
of average employees who are also vital contributors to the company.
Total CEO compensation has risen 937% since the late 70s to 2013 (Davis & Mishel).
Although that clearly is a large percentage, it gives you no context for how CEO pay has
progressed relative to compensation across the board. This is why the CEO to average
employee pay ratio has become an extremely popular piece of data and a vital piece of
evidence for those who speak out against excessive CEO pay. It provides a ratio describing the
amount of money made by a CEO for every dollar made by the “average” worker. As you can

4
see in the following figure, CEO’s were earning only $20 for every dollar earned by their
employees in the 1960s, and that jumped to $345 at the start of the recession (Davis & Mishel).
Furthermore, CEOs at the top 350 companies based on sales brought in on average
$16,316,000 in compensation in 2014 (Davis & Mishel). Compare that to the America’s average
salary in 2014 of $46,481 (Social Security Administration). Many have a hard time seeing the
equity in this type of pay disparity. This data helps to really put into context just how much
CEOs bring in every year, and why these trends have become a major hot button topic in the
general public. Politicians have identified the opinions of the public to take action as is their

5
duty, but maybe they should have recognized these trends or taken swifter action before it
created such a stir among the public.
CEO Pay Ratio Disclosure
Section 953(b) seeks to increase transparency in reporting and reign in CEO pay
practices to more reasonable levels by requiring the disclosure of a CEO to median employee
pay ratio in annual Securities and Exchange Commission (SEC) filings. This is similar to the ratio
used in the above discussion, except that instead of calculating an average compensation
amount, which is going to be greatly affected by several highly compensated employees, it will
use the median employee compensation which will generally be less than the “average”
employee. This particular section of the Dodd-Frank Act took over 5 years to actually be put
into effect. The SEC finally adopted this rule requiring the disclosure on August 5, 2015 after
months of deliberation and time for public comment. The disclosure will be required beginning
with companies whose fiscal year begins on or after January 1, 2017. As outlined by the SEC,
the new rule will require the following specific disclosures in annual filings:
The median of the annual total compensation of all its employees, except the CEO;
The annual total compensation of its CEO; and
The ratio of those two amounts (SEC)
The disclosure itself is highly controversial yielding strong opinions from politicians and
businesses. New Jersey Senator, Robert Menendez, the author of the disclosure, explains its
original goal of “injecting transparency, promoting fairness in Corporate America and restoring
sanity to runaway executive pay.” Senator Menendez further promotes the new rule by backing

6
its ability to be a powerful tool for investors who have the right to know the way a company
treats its “average workers” and its executives. Menendez was among many of the supporters
of this rule who were frustrated by the lack of urgency in its implementation. He states that the
“commonsense proposal never should have fallen victim to controversy (Menendez).”
Based on Senator Menendez’s remarks on the CEO pay ratio disclosure, the intent goes
beyond the transparency goal of the Dodd-Frank Act as a whole. This rule is aiming to reign in
“runaway executive pay.” Popular opinion agrees that CEO pay is extreme if not excessive, and
this leads into the broader, but related, issue of wealth distribution in America which goes
beyond the scope of this research. Up until this disclosure requirement there has been no
actual attempt at bringing CEO pay down. The hope is that the disclosure of the ratio will
publicly shame companies into either lowering executive compensation or raising regular
employee compensation (Eavis). Either of these alternatives will drop the CEO pay ratio, and
thus the intracompany wealth gaps. Companies will aim to adjust their compensation strategies
in order to avoid becoming the center of criticism and the face of wage inequality.
But contrary to Senator Menendez’s beliefs that this rule is commonsense, this rule has
controversy written all over it. Although public companies are required to file reports with the
SEC annually, they generally will not go above and beyond to provide information to users
outside of the requirements. As a point in case, during this research it was discovered that
corporations are not required to report total wages and salaries expense for the entire
company, and thus none of the companies in this research reported this data. Therefore, this
new disclosure was met with opposition by most corporations and politicians with a tendency

7
towards big business. An opposing SEC Commissioner, Daniel M. Gallagher, even called the rule
“the most useless of our Dodd-Frank mandates (Eavis).”
As of the time of writing, there is legislation in both the House and Senate aiming to repeal
Section 953(b) of the Dodd-Frank Act. Senator Mike Rounds of South Dakota is responsible for
the legislation in the Senate. Senator Rounds states that “the pay ratio rule is a waste of time,
effort and money, and the SEC is misguided in voting to adopt this duplicative, unnecessary
rule.” Rounds goes on by explaining that by repealing the disclosure rule, corporations can be
more productive without the wasted time and money (Rounds). On its face, the rule does not
seem to be so complicated and time-consuming, but the ratio is a much more difficult
calculation than it appears. The ratio which will have to be accurate, due to its inclusion in
financial statements, must take into consideration seasonal workers and wages for workers
around the world (Eavis).
Nonetheless, the disclosure requirement is happening, barring the success of the legislation
in works in both the House and Senate. Therefore businesses and investors need to be
prepared when it is time to start reporting and using the CEO pay ratio. What information will
this CEO pay ratio provide to business and to investors? As mentioned earlier, investors will use
the information as a measure in which to judge the treatment of the common employee.
Theoretically employees with higher pay are either more skilled or more motivated to perform
at a higher level. Investors will use this information to place pressure on organizations to
increase pay levels for the common employees in the hope of greater firm performance and
greater returns on their investment. Businesses on the other hand will use this disclosure to
compare compensation practices with their competitors. They will now be able to see how

8
much their competitors value their CEO relative to the common employee. The market for CEOs
is fiercely competitive, and this disclosure could actually lead to companies increasing CEO pay
to show they value their executives similarly to competitors. Whether or not the disclosure will
succeed in its intended purpose is up for debate and only time will tell if it can reach the goals
set out for it by its authors and supporters.
PROPOSITIONS
The CEO Pay Ratio is a fairly simple calculation. What is not so simple is the
aforementioned politics which engulf this controversial regulation. Something that has gone
unnoticed or unmentioned in all the debate surrounding this regulation is that total CEO
compensation is already a required disclosure. The argument that the disclosure requirement is
duplicative and unnecessary is clearly stated, but there is no backing as to why it is duplicative.
It could very likely be duplicative because the additional requirements calculating median pay
will provide very little additional information. When comparing the data on CEO compensation
and estimated median salary, it is clear that there is much greater variance in CEO
compensation. This means that CEO compensation should be the primary driver in determining
the CEO Pay Ratio. CEO compensation may be so strongly correlated with the CEO Pay Ratio
that the additional requirements requiring the disclosure of a median salary be unnecessary.
If this thought holds true, then that would mean that in addition median pay has little
influence in terms of driving CEO Pay Ratios. This disclosure which has been debated over so
vigorously may well be duplicative and unnecessary. If median pay has very little correlation
with the CEO Pay Ratio, there would be no true need behind including this disclosure assuming

9
that CEO compensation does correlate strongly with the ratio. If this were to hold true and the
disclosure requirement was actually repealed as is being currently attempted, companies can
be happy knowing that they will not have to provide the additional information in their annual
filings that they argue will come at such great expense of time and money. Additionally the
public can be happy because they can have all the information that they need already disclosed
annually. Those interested in the topic of CEO Pay Ratios should be able to simply evaluate total
CEO compensation to get the same information.
So what drives CEO compensation, and in turn, the CEO pay ratio? Could it possibly be
the size of the company based on measures such as total market capitalization? Or might it be
more financially based metrics such as price to earnings (P/E) ratio? Market capitalization has
been proven to be linked with CEO pay over time, and this can be easily noticed in the
compensation strategies of companies both currently and over time as firm size has increased
(Gabaix & Landier). This makes theoretical sense that the CEO over a higher valued firm should
be paid more than the CEO over a lower valued firm. Therefore it is predicted that firm size on
the basis of market capitalization will be strongly correlated with calculated CEO Pay Ratio.
Alternatively CEO compensation may be a related to measures of firm performance. If
firm performance drives CEO pay, and CEO pay drives the CEO Pay Ratio, then firm performance
must drive the ratio as well. A measure of firm performance is the price to earnings ratio which
measures the market value of a share of stock relative to its per-share earnings. CEOs are
almost always compensated in some way by equity in the firm. Companies in the S&P 500 are
reported to have made equity compensation over 60% of the total compensation given to
executives annually (Equilar). This equity is generally additional compensation on top of a base
10
salary for meeting performance metrics. CEOs aim for high performance metrics, such as
improving the price to earnings (P/E) ratio, because by doing so they will receive this additional
compensation in the form of equity. So as P/E ratio increases so will CEO pay, and as
mentioned above this rise in CEO compensation will drive the calculated CEO Pay Ratio.
A company’s industry may play into both the CEO’s compensation and subsequently the
ratio as well. Company pay practices tend to be heavily linked with an industry standard. CEOs
in a certain industry are likely to be compensated on a similar level to one another holding firm
size and performance equal. The reason for this is that companies compensate similarly in
order to hold on to their CEO, instead of losing them to a competitor who pays more. CEOs are
considered the top talent within a company, and by that thought they will be paid like the top
talent in order to protect against motivation for leaving the company. Within the data and the
CEO Pay Ratio there will likely not be much variation within each industry due to the fact that
the companies are constantly observing one another’s pay practices in order to maintain a level
of CEO pay that will mitigate the chances of losing this top talent. However there may still be
large variances between different industries as the threat of a CEO leaving a company to go to a
different industry is far less than that of the CEO moving within the industry. In terms of the
data set as a whole it is predicted that the range and variance will be much larger than those
found within any single industry, and much of the variance will be due to the different
industries in which the companies observed operate.
In summation of the above arguments, the following propositions were developed:

11
1. The CEO Pay Ratio is primarily driven by CEO pay. Because CEO pay is already a required
disclosure, the additional requirements for public filings is unnecessary.
2. Median pay has little influence on CEO Pay Ratios, and thus is an unnecessarily placed
burden upon companies.
3. The CEO Pay Ratio will be strongly correlated with the size of the firm measured by the
total market capitalization.
4. The CEO Pay Ratio will be strongly correlated with financial performance measures such
as the price to earnings ratio.
5. Classifying companies into broad industries will show that most of the variance in the
CEO Pay Ratio is between industries and not within each industry. It is predicted that the
variances within each industry will fall well beneath those of the data set as a whole.
METHODOLOGY
For this research, preliminary CEO Pay Ratios were calculated in accordance with SEC
requirements for companies in the Fortune 100 in 2014, the latest year of complete financial
data. These preliminary ratios are 2014 estimates of the ratio that will be required of public
companies beginning in 2017. To calculate the CEO Pay Ratio in accordance with the SEC’s
requirements, it is required to have an accurate calculation of total CEO compensation and the
median of the annual total compensation of all its employees. It is important that the CEO
compensation figure be representative of total compensation. Executives are awarded much
more in compensation than just a salary, which is often one of the lesser components of
compensation. Total compensation includes the sum of salary, stock options, bonuses, etc. that
change the financial position of the CEO.

12
Step one is gathering total CEO compensation for the companies of interest. Total CEO
compensation is readily available as it is a required annual disclosure in both the annual proxy
statement and the 10-K filing. Gathering this data involved using MergentOnline’s financial
statement accumulator database, identifying the company of interest and the executive of that
company considered to be the CEO, and recording his or her pay. Google’s CEO, Larry Page, was
excluded from the data as his total compensation for 2014 was only $1. This anomaly was
disregarded in the calculations and Google was removed from the data. All other CEO’s were
provided reasonable compensation that could be considered normal and acceptable for the
preliminary calculations.
Median employee compensation is not a required disclosure unlike CEO compensation.
This data can only be reasonably estimated based on the company and industry standards.
First, the company’s industry must be identified to estimate the type of jobs performed by the
company. Then there must be an estimate of the specific job that receives the median salary in
that company. This can be estimated through an examination of the size of the company and
the jobs that will make up a majority of their employees. Most companies will have a large
percentage of their employees performing a small percentage of the jobs. Job and industry
salary average information is available through O-net OnLine and the U.S. Bureau of Labor
Statistics respectively. If the job salary is within a reasonable range (around 20%) of the industry
average, then the estimated salary is considered acceptable. If not, then the above steps need
to be redone with the industry averages taken into consideration when identifying a new
median job. See Appendix Figure A which displays the positions and the median salaries used
13
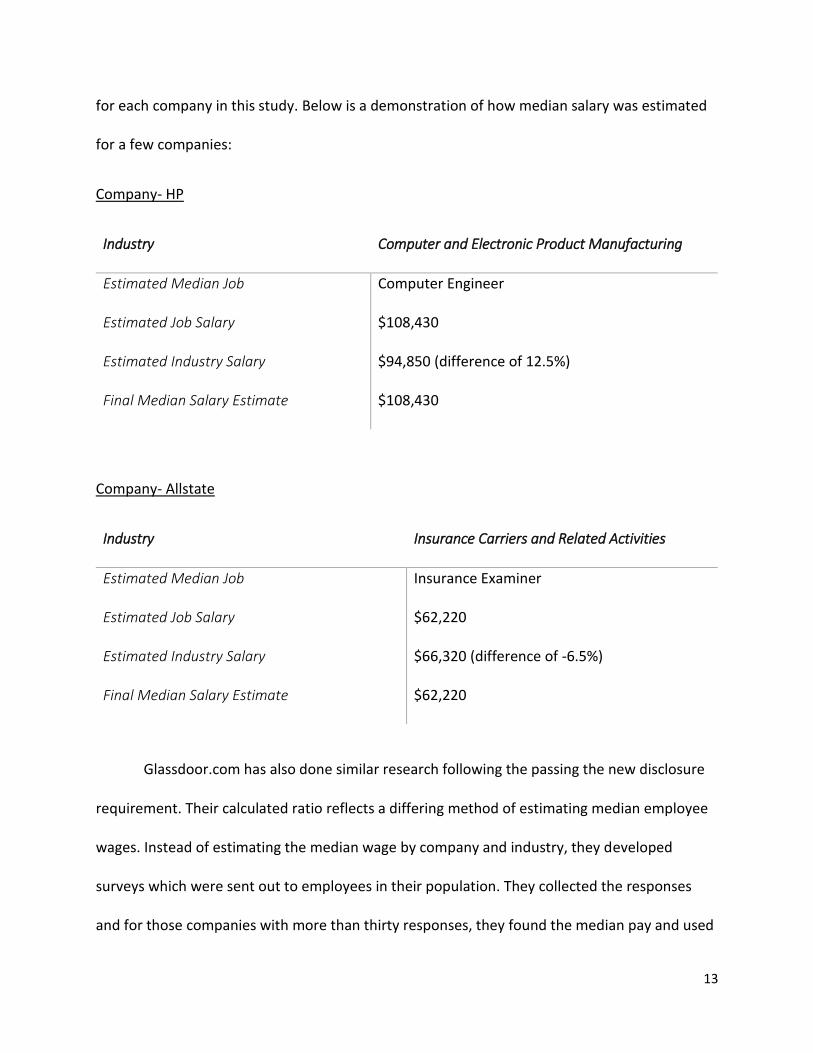
for each company in this study. Below is a demonstration of how median salary was estimated
for a few companies:
Company- HP
Industry Computer and Electronic Product Manufacturing
Estimated Median Job Computer Engineer
Estimated Job Salary $108,430
Estimated Industry Salary $94,850 (difference of 12.5%)
Final Median Salary Estimate $108,430
Company- Allstate
Industry Insurance Carriers and Related Activities
Estimated Median Job Insurance Examiner
Estimated Job Salary $62,220
Estimated Industry Salary $66,320 (difference of -6.5%)
Final Median Salary Estimate $62,220
Glassdoor.com has also done similar research following the passing the new disclosure
requirement. Their calculated ratio reflects a differing method of estimating median employee
wages. Instead of estimating the median wage by company and industry, they developed
surveys which were sent out to employees in their population. They collected the responses
and for those companies with more than thirty responses, they found the median pay and used
14
that to calculate their CEO Pay Ratio. Their CEO compensation data reflects the last reported
year, which in most cases is the companies’ fiscal 2014, that is the same data as has been
gathered for this study. With their estimated CEO Pay Ratio and the CEO compensation used,
the median wages can be backed into. The Glassdoor data is presented in the appendix in figure
E. This data will also be utilized in the analysis to provide some comparison between the results
of this research and the Glassdoor data.
With both data in hand, calculating the CEO Pay Ratio involves dividing total CEO
compensation by the estimated median compensation. All skewed or kurtotic variables were
logged to facilitate more accurate analysis. What this in turn explains is how many dollars a CEO
earns in compensation compared to how many the average employee earns. So for example,
the calculated CEO Pay Ratio of Conoco Phillips is 323. For every $1 earned at the median job in
the company, the CEO is earning $323. This is a great measure of pay distribution and
compensation strategy, but not of equity. This ratio has no way of measuring the value of the
inputs provided by the CEO and the median employee. If the CEO is actually worth 323 times
the median employee to the company then this would be considered equitable, but
determining worth is not a component of this ratio. Below is the complete data and the
preliminary estimates of CEO Pay Ratio for the population of companies for which data was
collected.

15
DATA
*CEO Pay Ratio calculation in descending order by CEO Pay Ratio
Company Name CEO Compensation Median Wages CEO Pay Ratio
CVS Health $ 32,350,733 $ 19,060 1697
Target $ 28,869,024 $ 19,060 1515
TJX $ 28,692,391 $ 21,390 1341
Coca-Cola $ 25,224,422 $ 23,610 1068
Walmart $ 19,392,608 $ 19,060 1017
Disney $ 46,497,018 $ 47,890 971
PespsiCo $ 22,485,574 $ 23,610 952
Twenty-First Century Fox $ 29,247,871 $ 36,560 800
Microsoft $ 84,589,838 $ 108,430 780
Mondelez International $ 21,039,946 $ 27,590 763
Macy's $ 16,197,220 $ 21,390 757
Johnson & Johnson $ 61,989,306 $ 85,400 726
Walgreens $ 13,654,636 $ 19,060 716
Nike $ 16,819,730 $ 23,610 712
Lockheed Martin $ 33,687,442 $ 48,430 696
Kroger $ 12,987,582 $ 19,060 681
Lowe's $ 14,279,945 $ 21,390 668
American Express $ 22,796,083 $ 34,550 660
Ford Motor $ 18,596,497 $ 28,370 655
Exxon Mobil $ 33,096,312 $ 53,160 623
Oracle $ 67,261,251 $ 108,430 620
General Electric $ 37,250,774 $ 61,580 605
Best Buy $ 12,937,294 $ 21,390 605
Caterpillar $ 17,131,448 $ 28,370 604
UPS $ 16,994,449 $ 28,370 599
Philip Morris International $ 14,124,869 $ 23,610 598
Comcast $ 32,961,056 $ 55,190 597
Boeing $ 28,861,920 $ 48,340 597
Time Warner $ 32,903,139 $ 55,190 596
GM $ 16,162,828 $ 28,370 570
Tyson Foods $ 12,173,164 $ 23,610 516
Chevron $ 25,970,417 $ 53,160 489
FedEx $ 13,807,175 $ 28,370 487
Prudential Financial $ 37,483,092 $ 78,620 477
Home Depot $ 10,171,865 $ 21,390 476
Phillips 66 $ 24,507,433 $ 53,160 461
AT&T $ 23,984,315 $ 55,190 435
Delta Air Lines $ 17,589,867 $ 42,290 416
Halliburton $ 20,560,157 $ 53,160 387
JP Morgan Chase $ 27,701,709 $ 78,620 352
Honeywell International $ 29,142,121 $ 83,060 351
Wells Fargo $ 21,426,391 $ 62,620 342
Dow Chemical $ 26,698,372 $ 79,930 334
Archer Daniels Midlands $ 9,181,378 $ 27,590 333
ConocoPhillips $ 27,575,900 $ 85,400 323
McKesson $ 24,844,555 $ 77,550 320

16
Verizon $ 17,541,509 $ 55,190 318
Merck $ 25,029,370 $ 79,930 313
Marathon Petroleum $ 16,401,255 $ 53,160 309
Morgan Stanley $ 23,270,044 $ 78,620 296
Costco $ 5,622,927 $ 19,060 295
Pfizer $ 23,283,048 $ 79,930 291
American Airlines Group $ 12,301,976 $ 42,290 291
Goldman Sachs Group $ 22,162,912 $ 78,620 282
Sears Holdings $ 5,702,364 $ 21,390 267
Safeway $ 4,993,657 $ 19,060 262
Allstate $ 15,641,385 $ 62,220 251
Bank of America Corp. $ 15,342,399 $ 62,620 245
Deere $ 20,273,296 $ 83,060 244
MetLife $ 15,163,803 $ 62,220 244
Aetna $ 15,067,322 $ 62,220 242
UnitedHealth Group $ 14,856,321 $ 62,220 239
3M $ 20,115,589 $ 85,400 236
Johnson Controls $ 19,540,681 $ 83,060 235
General Dynamics $ 19,388,084 $ 83,060 233
Cigna $ 14,461,445 $ 62,220 232
Citigroup $ 14,457,199 $ 62,620 231
HCA Holdings $ 14,625,534 $ 66,640 219
Anthem $ 13,532,549 $ 62,220 217
AIG $ 12,064,428 $ 62,220 194
HP $ 19,641,164 $ 108,430 181
DuPont $ 14,159,638 $ 83,060 170
Humana $ 10,255,401 $ 62,220 165
Express Scripts Holding $ 12,921,006 $ 79,930 162
Cardinal Health $ 12,448,618 $ 85,400 146
Intel $ 11,197,400 $ 77,550 144
Plains GP Holdings $ 7,454,118 $ 53,160 140
Apple $ 9,222,638 $ 77,550 119
AmerisourceBergen $ 9,902,985 $ 85,400 116
United Technologies $ 8,986,174 $ 83,060 108
Ingram Micro $ 8,382,223 $ 77,550 108
CHS $ 6,764,456 $ 66,640 102
Tech Data $ 7,616,942 $ 77,550 98
Cisco Systems $ 10,295,279 $ 108,430 95
Sysco $ 7,815,394 $ 85,400 92
World Fuel Services $ 7,706,999 $ 85,400 90
Enterprise Products Partners
$ 6,654,846 $ 85,400 78
Tesoro $ 1,600,000 $ 23,160 69
Amazon.com $ 1,681,840 $ 24,430 69
IBM $ 1,600,000 $ 29,910 53
Procter & Gamble $ 1,250,000 $ 23,610 53
DirecTV $ 1,700,000 $ 55,190 31
Valero Energy $ 1,250,000 $ 53,160 24
Energy Transfer Equity $ 1,275,154 $ 85,400 15
INTL FCStone $ 1,157,607 $ 78,260 15
Fannie Mae $ 750,000 $ 62,620 12
17
Freddie Mac $ 750,000 $ 62,620 12
United Continental Holdings $ 269,782 $ 42,290 6
Berkshire Hathaway $ 464,011 $ 78,620 6
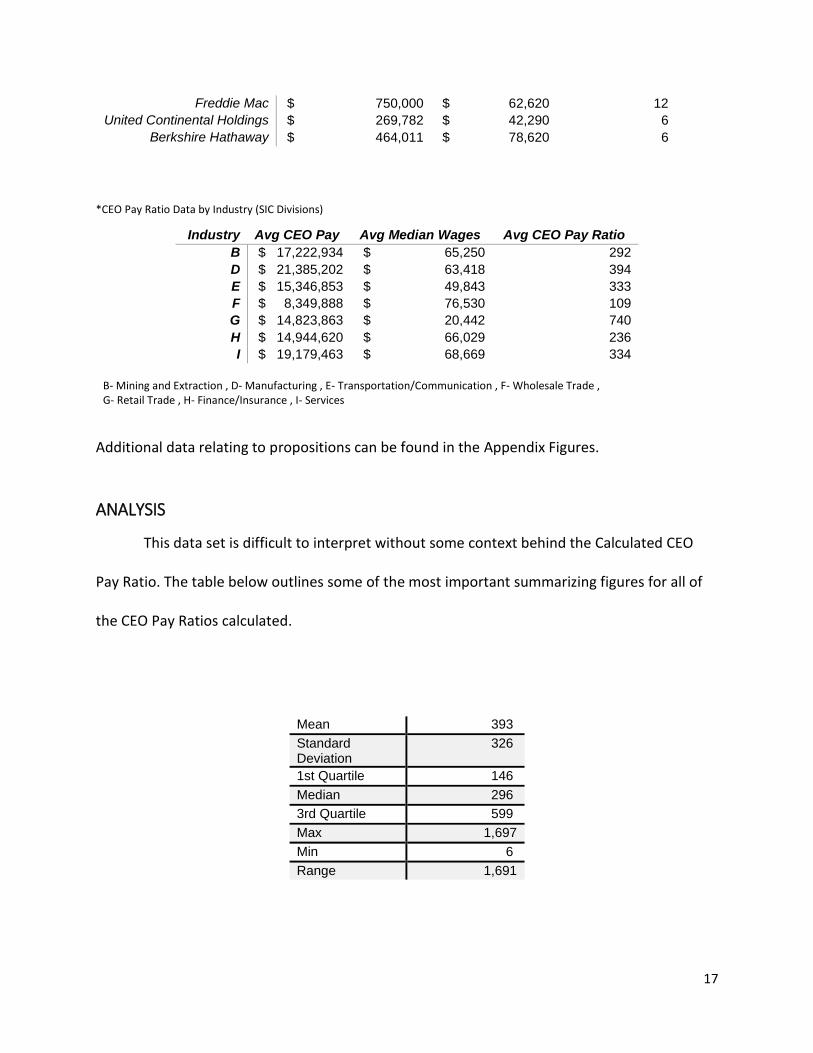
*CEO Pay Ratio Data by Industry (SIC Divisions)
Industry Avg CEO Pay Avg Median Wages Avg CEO Pay Ratio
B $ 17,222,934 $ 65,250 292
D $ 21,385,202 $ 63,418 394
E $ 15,346,853 $ 49,843 333
F $ 8,349,888 $ 76,530 109
G $ 14,823,863 $ 20,442 740
H $ 14,944,620 $ 66,029 236
I $ 19,179,463 $ 68,669 334
B- Mining and Extraction , D- Manufacturing , E- Transportation/Communication , F- Wholesale Trade , G- Retail Trade , H- Finance/Insurance , I- Services
Additional data relating to propositions can be found in the Appendix Figures.
ANALYSIS
This data set is difficult to interpret without some context behind the Calculated CEO
Pay Ratio. The table below outlines some of the most important summarizing figures for all of
the CEO Pay Ratios calculated.
Mean 393
Standard Deviation
326
1st Quartile 146
Median 296
3rd Quartile 599
Max 1,697
Min 6
Range 1,691

18
To expand upon the data in the above table, it is clear to see that even among the top
hundred companies there is extreme variation among the calculated CEO Pay Ratio. The range
of the data alone paints a picture of this polarity. The top ratio belonging to CVS Health is 283
times larger than the smallest ratio held jointly by Berkshire Hathaway and United Continental
Holdings. Further the evidence that the ratios calculated vary significantly is highlighted by the
standard deviation of the ratios. With the average ratio landing at 393, the standard deviation
of 326 exhibits the polarity of this data. The largest five ratios exceed 1,000 and seventeen
companies have ratios which do not even break 100. Below each of the aforementioned
propositions are analyzed using the data gathered and estimates made.
The calculated data points to that clear fact that companies, even those expected to be
so similar due to their size, differ greatly based on compensation strategies. Those companies
with large ratios value their CEO and other leaders exponentially more than their median
employee. Investors and proponents of this disclosure requirement will take this as a sign of
unproductive and unsatisfied workers. That may be a sign of future employment issues such as
strike or increased employee turnover which could have financial implications. On the other
hand, people opposed to the disclosure rule will contend that the high ratio is indicative of the
industry and the type of work in which the company operates. Industry’s effect on the ratio will
be examined in the following section where each of the aforementioned propositions is
analyzed.
19
Proposition 1:
Predicting CEO Pay Ratio
Model 1 Model 2 Model 3 Model 4
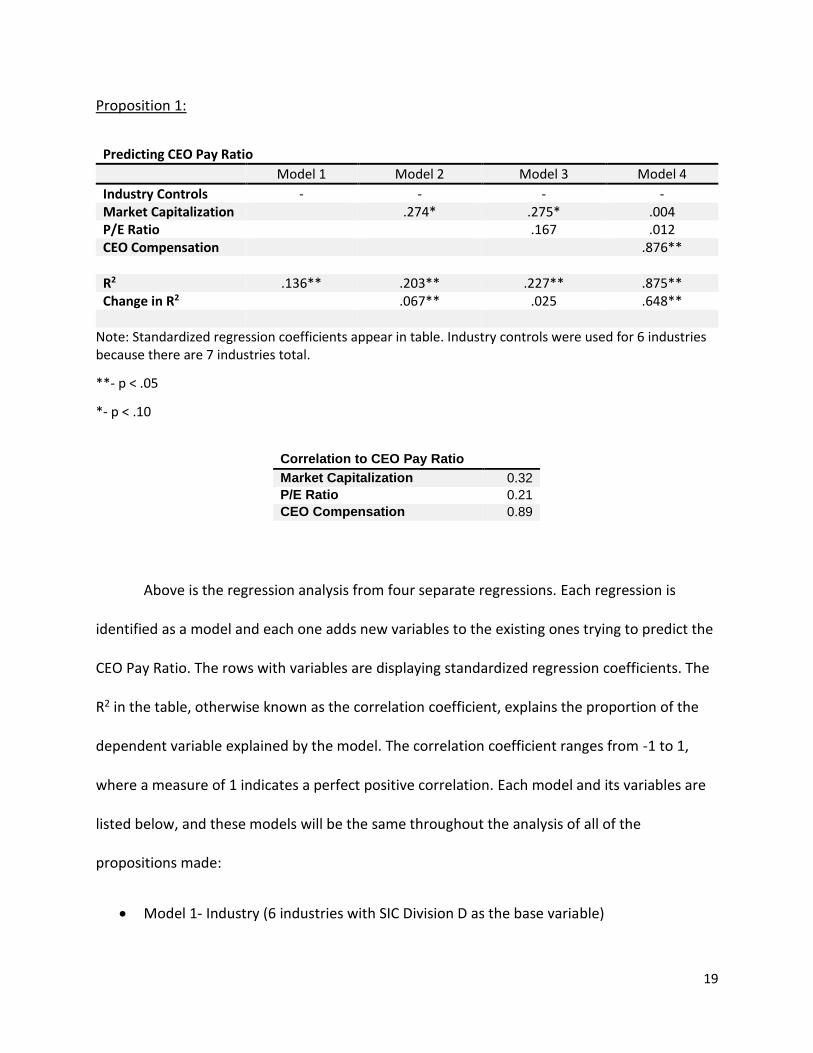
Industry Controls - - - - Market Capitalization .274* .275* .004 P/E Ratio .167 .012 CEO Compensation .876** R2 .136** .203** .227** .875** Change in R2 .067** .025 .648**
Note: Standardized regression coefficients appear in table. Industry controls were used for 6 industries because there are 7 industries total.
**- p < .05
*- p < .10
Above is the regression analysis from four separate regressions. Each regression is
identified as a model and each one adds new variables to the existing ones trying to predict the
CEO Pay Ratio. The rows with variables are displaying standardized regression coefficients. The
R2 in the table, otherwise known as the correlation coefficient, explains the proportion of the
dependent variable explained by the model. The correlation coefficient ranges from -1 to 1,
where a measure of 1 indicates a perfect positive correlation. Each model and its variables are
listed below, and these models will be the same throughout the analysis of all of the
propositions made:
Model 1- Industry (6 industries with SIC Division D as the base variable)
Correlation to CEO Pay Ratio
Market Capitalization 0.32
P/E Ratio 0.21
CEO Compensation 0.89

20
Model 2- Industry and Market Capitalization
Model 3- Industry, Market Capitalization, and P/E Ratio
Model 4- Industry, Market Capitalization, P/E Ratio, and CEO Compensation
Each model builds upon its predecessor by adding an additional variable which might help
to improve the prediction of the dependent variable, in this analysis CEO Pay Ratio. It was
predicted that CEO compensation would be the overriding driver of the CEO Pay Ratio. Based
on the data and estimates this appears to hold true. The first three models have correlation
coefficients which do not break .50 whereas the fourth model, and the only one with CEO
compensation as a variable has a R2 of .875. Further when looking at model 4, you can see that
CEO compensation is statistically significant at less than .05. CEO compensation proves again to
be a viable predictor in that as a stand-alone variable it has a correlation metric of .89. That
means that 89% of the CEO Pay Ratio can be explained solely by the CEO’s compensation.
The disclosure of additional information may very likely be unnecessary in terms of
evaluating the CEO Pay Ratio. If the already required disclosure, CEO compensation, is so highly
correlated the CEO Pay Ratio then it appears that the additional requirement to disclose
median pay may actually be providing only marginally more information. However, the
estimated CEO Pay Ratio used for this analysis was generated through estimates of the median
wages. As mentioned before, Glassdoor’s study went about a different method of coming to an
estimated median compensation. Below the same analysis will be performed using Glassdoor’s
CEO Pay Ratio as the dependent variable.
21
Predicting Glassdoor’s CEO Pay Ratio
Model 1 Model 2 Model 3 Model 4
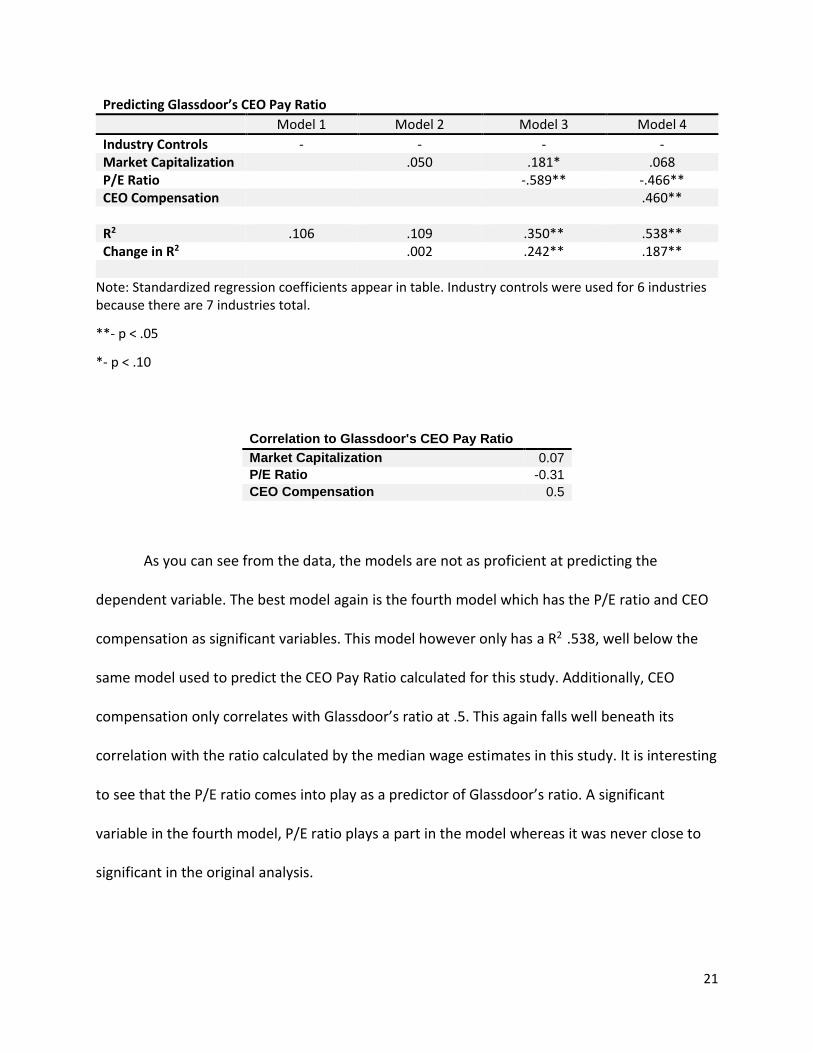
Industry Controls - - - - Market Capitalization .050 .181* .068 P/E Ratio -.589** -.466** CEO Compensation .460** R2 .106 .109 .350** .538** Change in R2 .002 .242** .187**
Note: Standardized regression coefficients appear in table. Industry controls were used for 6 industries because there are 7 industries total.
**- p < .05
*- p < .10
Correlation to Glassdoor's CEO Pay Ratio
Market Capitalization 0.07
P/E Ratio -0.31
CEO Compensation 0.5
As you can see from the data, the models are not as proficient at predicting the
dependent variable. The best model again is the fourth model which has the P/E ratio and CEO
compensation as significant variables. This model however only has a R2 .538, well below the
same model used to predict the CEO Pay Ratio calculated for this study. Additionally, CEO
compensation only correlates with Glassdoor’s ratio at .5. This again falls well beneath its
correlation with the ratio calculated by the median wage estimates in this study. It is interesting
to see that the P/E ratio comes into play as a predictor of Glassdoor’s ratio. A significant
variable in the fourth model, P/E ratio plays a part in the model whereas it was never close to
significant in the original analysis.
22
Proposition 2:
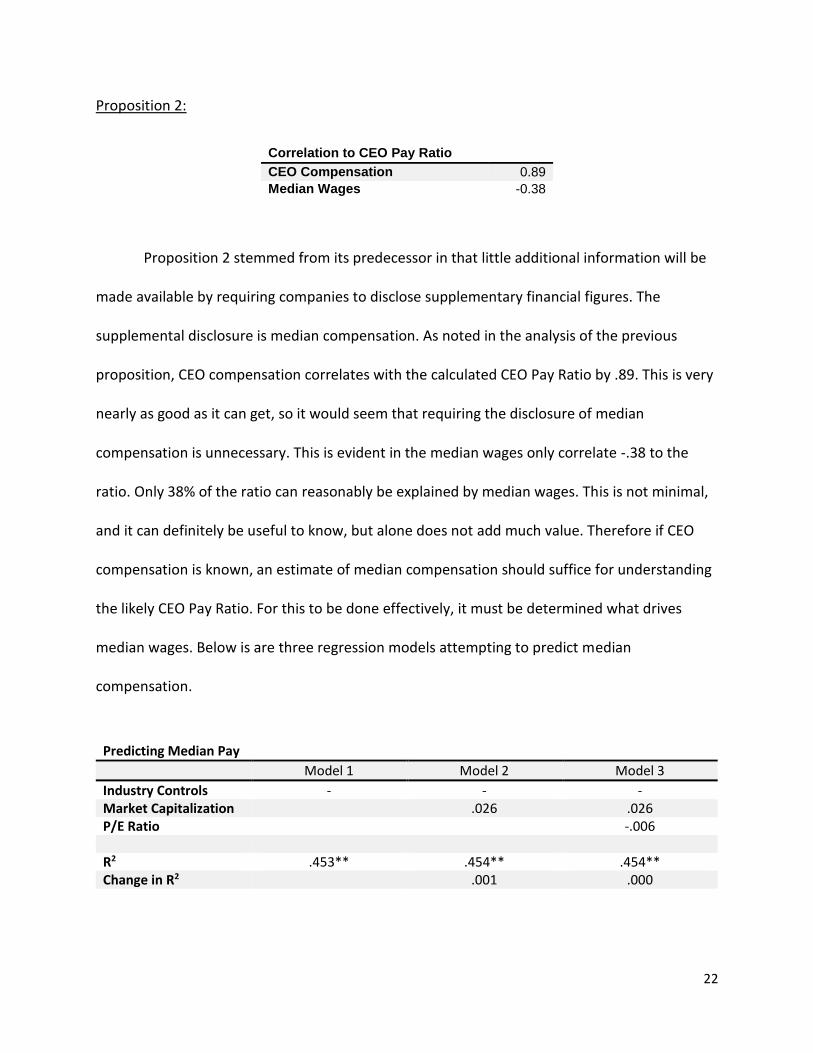
Correlation to CEO Pay Ratio
CEO Compensation 0.89
Median Wages -0.38
Proposition 2 stemmed from its predecessor in that little additional information will be
made available by requiring companies to disclose supplementary financial figures. The
supplemental disclosure is median compensation. As noted in the analysis of the previous
proposition, CEO compensation correlates with the calculated CEO Pay Ratio by .89. This is very
nearly as good as it can get, so it would seem that requiring the disclosure of median
compensation is unnecessary. This is evident in the median wages only correlate -.38 to the
ratio. Only 38% of the ratio can reasonably be explained by median wages. This is not minimal,
and it can definitely be useful to know, but alone does not add much value. Therefore if CEO
compensation is known, an estimate of median compensation should suffice for understanding
the likely CEO Pay Ratio. For this to be done effectively, it must be determined what drives
median wages. Below is are three regression models attempting to predict median
compensation.
Predicting Median Pay
Model 1 Model 2 Model 3
Industry Controls - - - Market Capitalization .026 .026 P/E Ratio -.006 R2 .453** .454** .454** Change in R2 .001 .000

23
Note: Standardized regression coefficients appear in table. Industry controls were used for 6 industries because there are 7 industries total.
**- p < .05
*- p < .10
Correlation to Median Pay
Market Capitalization -0.07
P/E Ratio -0.16
Contrary to earlier investigation, the later models with more variables are not the best
predictors of median pay. Neither the addition of market capitalization or P/E ratio improve the
correlation coefficient from the first model. Further, Model 1 has a statistically significant R2.
Model 1 is the only model that should be used to predict median wages. Therefore, the
industries as a whole are a significant variable because they are the only variable in model 1.
Through association, industry drives median wages and median wages drive the CEO Pay Ratio.
Instead of adding median wages to the list of required disclosures, users of financial
information should only have to evaluate the industry to develop a sense for the median
compensation. The industry in which a company operates in combination with CEO
compensation should provide a sufficient estimate of the CEO Pay Ratio.
Predicting Glassdoor’s Median Wage
Model 1 Model 2 Model 3
Industry Controls - - - Market Capitalization .164 .121 P/E Ratio .193 R2 .159** .184** .210** Change in R2 .025 .026
Note: Standardized regression coefficients appear in table. Industry controls were used for 6 industries because there are 7 industries total.

24
**- p < .05
*- p < .10
Correlation to Glassdoor's Median Wage
Market Capitalization 0.15
P/E Ratio 0.06
Again, with the estimate of median wages, there is the possibility of error and this is an
inherent shortcoming of this analysis. To provide further evidence that industry is the best
predictor of median compensation Glassdoor’s research is applied to the regression models.
Again model 1 is the primary model of interest. The following models do not change R2
significantly. Although it is not highly correlated with Glassdoor’s median compensation,
industry division is a significant variable in predicting the median compensation just like it was
in the previous analysis. Therefore the assumption that industry is sufficient to understanding
median compensation is strengthened.
Proposition 3:
Predicting CEO Compensation
Model 1 Model 2 Model 3
Industry Controls - - - Market Capitalization .308** .309** P/E Ratio .176 R2 .045 .129* .157* Change in R2 .084** .027
Note: Standardized regression coefficients appear in table. Industry controls were used for 6 industries because there are 7 industries total.
**- p < .05
*- p < .10

25
Correlation to CEO Compensation
Market Capitalization 0.31
P/E Ratio 0.15
Company size and CEO compensation should theoretically be correlated. The greater
the size, measured by market capitalization, the more the CEO should be compensated due to
the control of more value. So as market capitalization rises, CEO compensation should rise and
that in turn drives the CEO Pay Ratio upwards. Refer to the regression analysis from the
proposition 1 analysis to see how market capitalization directly effects the CEO Pay Ratio.
Model 2 which adds market capitalization to industry division is considered statistically
significant and has a coefficient of .308. Also, individually market capitalization correlates with
the CEO Pay Ratio by .31. Market capitalization is a significant variable in both model 2 and
model 3 after adding P/E ratio.
Model 2 which includes market capitalization is the only statistically significant model.
Thus, as previously suggested market capitalization is a substantial predictor of CEO
compensation. As firm size increases as measured by the value of the firm via market
capitalization, the CEO compensation will rise. As CEO compensation rises the CEO Pay Ratio
will rise holding all else constant. Even though CEO compensation is already a required
disclosure, it is good to get a sense for how it moves and what drives it. Effectively it should be
expected that the companies within the population of this study (2014 Fortune 100 Companies)
are the leaders in terms of CEO Pay Ratio. Being among the “top” 100 companies, should
indicate a high market capitalization even though Fortune ranks by revenues. Taking this into
consideration it is fair to assume that of all public companies, and thus those required to

26
disclose this information, the companies within this study will likely include a large percentage
of the largest 100 CEO Pay Ratios.
Proposition 4:
Similar to the above proposition, the CEO Pay Ratio should be directly correlated to the
financial performance of the firm measured by the P/E ratio. As a company improves
performance relative to prior periods and to competitors, the CEO is likely to be the beneficiary
of bonus payments through cash and stock awards. As a result the CEO Pay Ratio will rise
because it is unlikely that performance metrics have any bearing over median employee
compensation. Firstly refer to the regression analysis at the beginning of proposition 1 for
evidence of this relationship. The addition of P/E ratio as a variable comes in model 3, which
you can see has a correlation coefficient .48 which exceeds the same figure for the previous
two models. However, the model is not statistically significant and can therefore not be used to
forecast the CEO Pay Ratio. Additionally P/E ratio is not a significant variable in either model 3
or model 4, and individually only correlates with CEO Pay Ratio .21. This is a weak relationship
which does not provide much support for the proposition that P/E ratio is a significant driver in
the CEO Pay Ratio.
However, P/E ratio may be a significant variable in terms of predicting CEO pay and
would by association be a predictor for the CEO Pay Ratio. Refer to the regression analysis in
table 3 which displays models attempting to predict CEO compensation. Again P/E ratio cannot
be considered a viable element when attempting to predict CEO compensation. Model 3 has a
significance above the limit required by the confidence level. Further, P/E ratio has a .15
27
correlation with CEO compensation as an independent variable. P/E ratio is neither an
acceptable variable for use in forecasting the CEO Pay Ratio or CEO compensation. The thought
that financial performance in the way of the P/E ratio would drive CEO compensation seems to
be incorrect. CEO Pay Ratio therefore seems to be wholly unrelated to the P/E ratio.
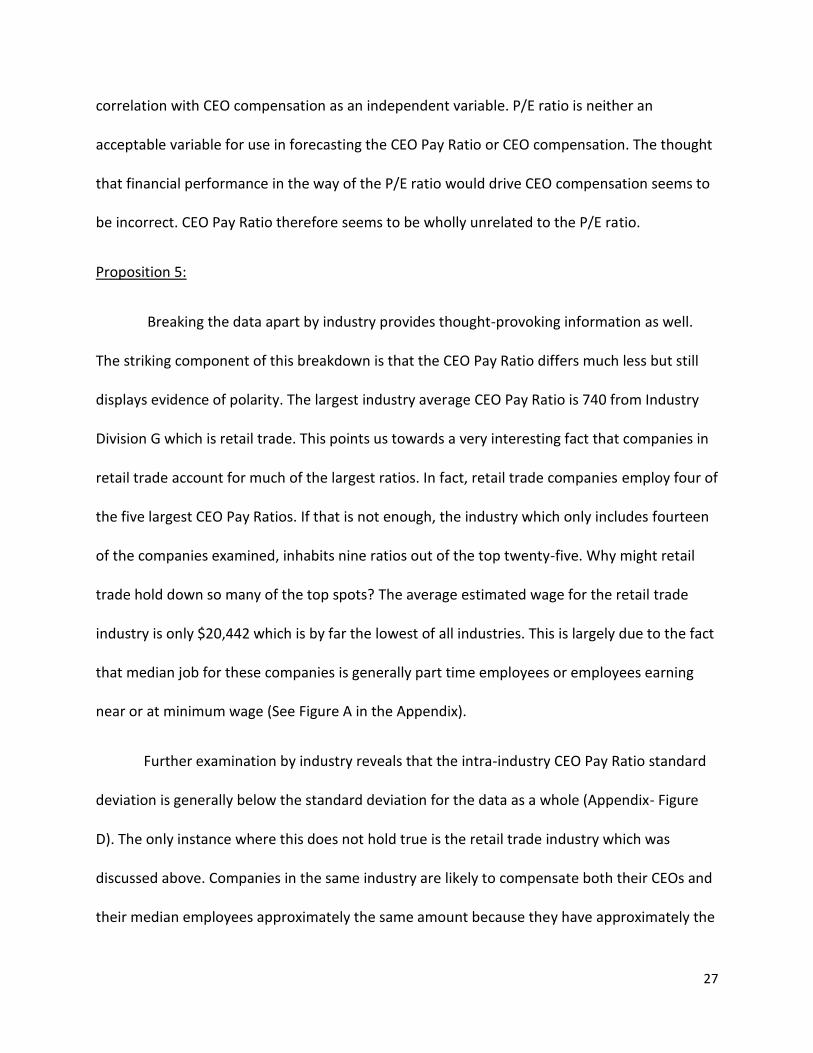
Proposition 5:
Breaking the data apart by industry provides thought-provoking information as well.
The striking component of this breakdown is that the CEO Pay Ratio differs much less but still
displays evidence of polarity. The largest industry average CEO Pay Ratio is 740 from Industry
Division G which is retail trade. This points us towards a very interesting fact that companies in
retail trade account for much of the largest ratios. In fact, retail trade companies employ four of
the five largest CEO Pay Ratios. If that is not enough, the industry which only includes fourteen
of the companies examined, inhabits nine ratios out of the top twenty-five. Why might retail
trade hold down so many of the top spots? The average estimated wage for the retail trade
industry is only $20,442 which is by far the lowest of all industries. This is largely due to the fact
that median job for these companies is generally part time employees or employees earning
near or at minimum wage (See Figure A in the Appendix).
Further examination by industry reveals that the intra-industry CEO Pay Ratio standard
deviation is generally below the standard deviation for the data as a whole (Appendix- Figure
D). The only instance where this does not hold true is the retail trade industry which was
discussed above. Companies in the same industry are likely to compensate both their CEOs and
their median employees approximately the same amount because they have approximately the
28
same skillset. Therefore, the fact that the variance within each industry is less than when
looking at the data set as a whole is expected.
The retail trade industry again seems to be the outlier with a standard deviation of 475.
CEO compensation within the industry varies widely which could explain the variation in the
CEO Pay Ratio within the industry. The total range in CEO compensation within the retail trade
industry is over $30 million but the median wages hold fairly steady with a range of only
$5,000. This leads to the large swings in CEO Pay Ratio and thus the larger than average
standard deviation. No other industry sees such movement in either CEO compensation or
median wages while the other variable holds so constant. This again goes back to the fact that
the retail trade industry employs a large number of lower income employees typically doing the
same or materially the same jobs regardless of employer. Each of the other industries includes
companies with much more diversity in terms of median job. For example, there are only three
median jobs in the retail trade industry which accounts for fourteen of the companies in the
population. That means on average that each job accounts for about five companies. However,
if you examine the transportation and communication industry you witness much more job
diversity. There are six unique jobs shared between twelve employers, and thus each job
accounts for only two companies. This same fact holds true when comparing the job diversity of
the retail trade industry to any of the industries observed. This helps explain why the retail
trade industry’s standard deviation is far different than those calculated within the other
industries. Removing it as an outlier however, it is clear to see that when looking within an
industry there is much less variation in terms of the CEO Pay Ratio than when looking at the
whole population.

29
CONCLUSION
CEO compensation is a hot topic issue across a country in which the wealth gap is
similarly so popularly discussed. The Dodd-Frank Act, passed in 2010, is finally having
regulations put into effect which will aim to change the way companies and investors think
about CEO compensation. The goal of this regulation is to motivate companies into either
decreasing CEO pay or increasing other employee pay by requiring the disclosure of a CEO to
median employee pay ratio. Corporations have countered this legislation with arguments that
the requirement is costly, duplicative, and unnecessary, and have been supported by legislators
in both houses of the US Congress. Through data and estimates gathered and analyzed for this
study, it appears as though the corporations and the supporting congress members may have a
valid argument. As described in the evaluation of proposition 1, the CEO Pay Ratio is so highly
correlated with CEO compensation that the requirement for companies to disclose additional
information will not create a material benefit for the users of financial information. If these said
users would like a more accurate approach when predicting the ratio, they may simply examine
CEO compensation and the industry in which the company operates as it was proven that
median wages were significantly predicted by the company’s industry. These two factors, that
are publicly available without the additional disclosure requirement, will provide an accurate
estimate of the CEO Pay Ratio.
Firm size was an influential variable in terms of predicting CEO compensation as
expected. Through association firm size plays into the CEO Pay Ratio. As firms naturally grow
over time, CEO Pay Ratio will likely follow as it has in the past. There is no sign of this
relationship yielding unless the public acts upon the information available to them to put a stop

30
to the exponentially growing compensation plans awarded to executives. Companies must be
guided towards lowering their CEO Pay Ratio by their consumers and their reaction to this
information.
As explained above, CEO compensation and industry are the essential drivers of the CEO
pay ratio. Therefore, placing the requirement on companies to take the time and expense to
discover and publicize their median employee expense is unnecessary. Both the supporters of
the disclosure requirement and corporations can be happy with this evaluation. Supporters of
Section 953(b) of the Dodd-Frank Act will still be able to evaluate a company’s CEO Pay Ratio
through the use of CEO compensation and industry. Corporations should be exempt from the
extra time and cost of the additional reporting of median compensation. The disclosure
requirement’s intention is essential in that CEO compensation has become excessive relative to
the regular employee, but the disclosure itself is redundant. As the aforementioned legislation
comes to the congressional floor for debate it is imperative that the regulation be evaluated
objectively and the duplicative nature of the rule is uncovered.
APPENDIX
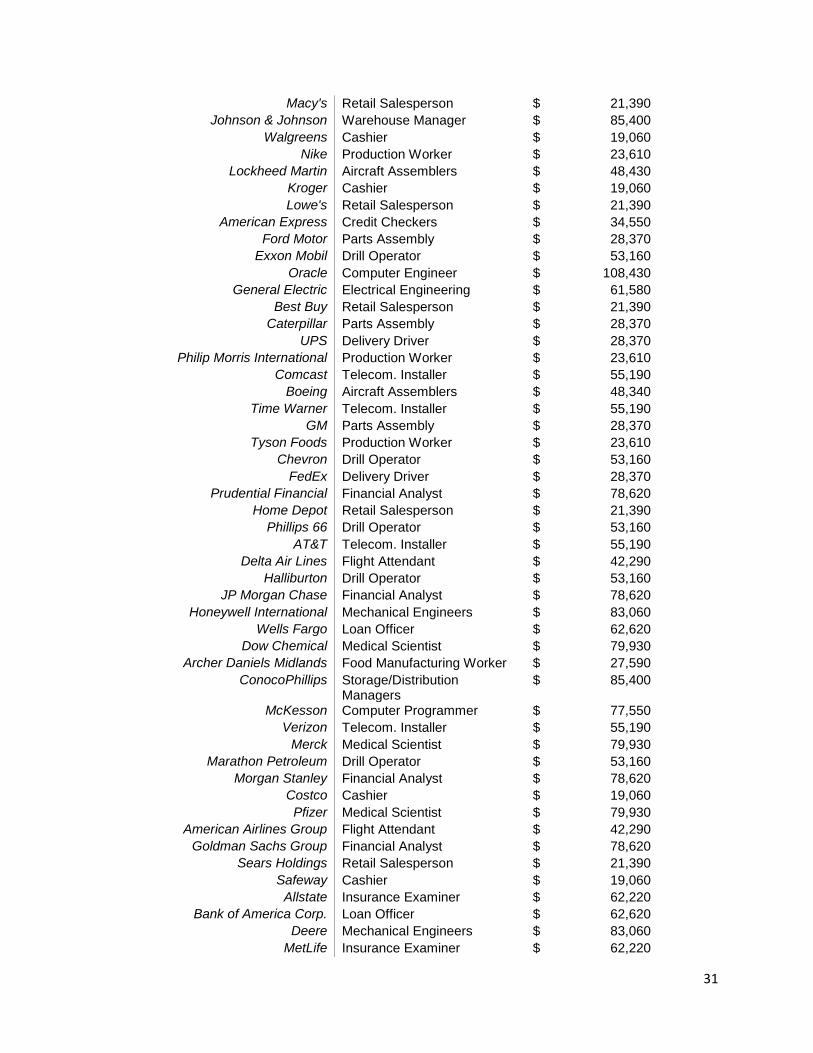
*Figure A- Median Job and Wages ranked by CEO Pay Ratio
Company Name Median Job Median Wages CVS Health Cashier $ 19,060
Target Cashier $ 19,060
TJX Retail Salesperson $ 21,390
Coca-Cola Production Worker $ 23,610
Walmart Cashier $ 19,060
Disney Advertising Sales $ 47,890
PespsiCo Production Worker $ 23,610
Twenty-First Century Fox Broadcast Technician $ 36,560
Microsoft Computer Engineer $ 108,430
Mondelez International Food Manufacturing Worker $ 27,590
31
Macy's Retail Salesperson $ 21,390
Johnson & Johnson Warehouse Manager $ 85,400
Walgreens Cashier $ 19,060
Nike Production Worker $ 23,610
Lockheed Martin Aircraft Assemblers $ 48,430
Kroger Cashier $ 19,060
Lowe's Retail Salesperson $ 21,390
American Express Credit Checkers $ 34,550
Ford Motor Parts Assembly $ 28,370
Exxon Mobil Drill Operator $ 53,160
Oracle Computer Engineer $ 108,430
General Electric Electrical Engineering $ 61,580
Best Buy Retail Salesperson $ 21,390
Caterpillar Parts Assembly $ 28,370
UPS Delivery Driver $ 28,370
Philip Morris International Production Worker $ 23,610
Comcast Telecom. Installer $ 55,190
Boeing Aircraft Assemblers $ 48,340
Time Warner Telecom. Installer $ 55,190
GM Parts Assembly $ 28,370
Tyson Foods Production Worker $ 23,610
Chevron Drill Operator $ 53,160
FedEx Delivery Driver $ 28,370
Prudential Financial Financial Analyst $ 78,620
Home Depot Retail Salesperson $ 21,390
Phillips 66 Drill Operator $ 53,160
AT&T Telecom. Installer $ 55,190
Delta Air Lines Flight Attendant $ 42,290
Halliburton Drill Operator $ 53,160
JP Morgan Chase Financial Analyst $ 78,620
Honeywell International Mechanical Engineers $ 83,060
Wells Fargo Loan Officer $ 62,620
Dow Chemical Medical Scientist $ 79,930
Archer Daniels Midlands Food Manufacturing Worker $ 27,590
ConocoPhillips Storage/Distribution Managers
$ 85,400
McKesson Computer Programmer $ 77,550
Verizon Telecom. Installer $ 55,190
Merck Medical Scientist $ 79,930
Marathon Petroleum Drill Operator $ 53,160
Morgan Stanley Financial Analyst $ 78,620
Costco Cashier $ 19,060
Pfizer Medical Scientist $ 79,930
American Airlines Group Flight Attendant $ 42,290
Goldman Sachs Group Financial Analyst $ 78,620
Sears Holdings Retail Salesperson $ 21,390
Safeway Cashier $ 19,060
Allstate Insurance Examiner $ 62,220
Bank of America Corp. Loan Officer $ 62,620
Deere Mechanical Engineers $ 83,060
MetLife Insurance Examiner $ 62,220

32
Aetna Insurance Examiner $ 62,220
UnitedHealth Group Insurance Examiner $ 62,220
3M Warehouse Manager $ 85,400
Johnson Controls Mechanical Engineers $ 83,060
General Dynamics Mechanical Engineers $ 83,060
Cigna Insurance Examiner $ 62,220
Citigroup Loan Officer $ 62,620
HCA Holdings Registered Nurse $ 66,640
Anthem Insurance Examiner $ 62,220
AIG Insurance Examiner $ 62,220
HP Computer Engineer $ 108,430
DuPont Mechanical Engineers $ 83,060
Humana Insurance Examiner $ 62,220
Express Scripts Holding Medical Scientist $ 79,930
Cardinal Health Warehouse Manager $ 85,400
Intel Computer Programmer $ 77,550
Plains GP Holdings Drill Operator $ 53,160
Apple Computer Programmer $ 77,550
AmerisourceBergen Warehouse Manager $ 85,400
United Technologies Mechanical Engineers $ 83,060
Ingram Micro Computer Programmer $ 77,550
CHS Registered Nurse $ 66,640
Tech Data Computer Programmer $ 77,550
Cisco Systems Computer Engineer $ 108,430
Sysco Warehouse Manager $ 85,400
World Fuel Services Storage/Distribution Managers
$ 85,400
Enterprise Products Partners
Storage/Distribution Managers
$ 85,400
Tesoro Production Worker $ 23,160
Amazon.com Freight Handlers $ 24,430
IBM Electrical Assembly $ 29,910
Procter & Gamble Production Worker $ 23,610
DirecTV Telecom. Installer $ 55,190
Valero Energy Drill Operator $ 53,160
Energy Transfer Equity Storage/Distribution Managers
$ 85,400
INTL FCStone Financial Analyst $ 78,260
Fannie Mae Loan Officer $ 62,620
Freddie Mac Loan Officer $ 62,620
United Continental Holdings Flight Attendant $ 42,290
Berkshire Hathaway Financial Analyst $ 78,620
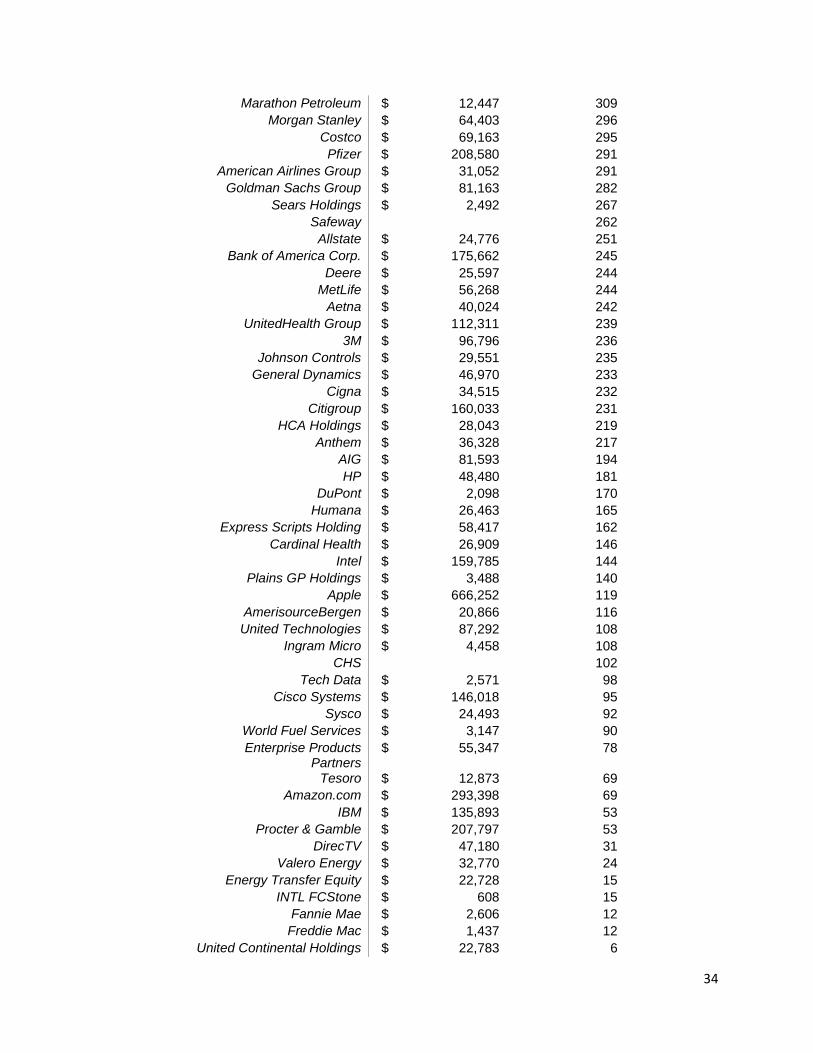
*Figure B- Size measures in descending order by CEO Pay Ratio

33
Company Name Market Cap (mil)
CEO Pay Ratio
CVS Health $ 110,089 1697
Target $ 48,502 1515
TJX $ 49,357 1341
Coca-Cola $ 182,527 1068
Walmart $ 183,508 1017
Disney $ 191,150 971
PespsiCo $ 146,558 952
Twenty-First Century Fox $ 36,201 800
Microsoft $ 434,542 780
Mondelez International $ 72,911 763
Macy's $ 16,874 757
Johnson & Johnson $ 282,062 726
Walgreens $ 92,199 716
Nike $ 87,959 712
Lockheed Martin $ 67,245 696
Kroger $ 36,796 681
Lowe's $ 68,310 668
American Express $ 72,106 660
Ford Motor $ 57,102 655
Exxon Mobil $ 344,980 623
Oracle $ 165,798 620
General Electric $ 291,989 605
Best Buy $ 12,070 605
Caterpillar $ 42,497 604
UPS $ 92,325 599
Philip Morris International $ 136,958 598
Comcast $ 132,428 597
Boeing $ 99,205 597
Time Warner $ 61,446 596
GM $ 54,326 570
Tyson Foods $ 13,501 516
Chevron $ 171,012 489
FedEx $ 44,065 487
Prudential Financial $ 37,210 477
Home Depot $ 158,766 476
Phillips 66 $ 47,503 461
AT&T $ 206,120 435
Delta Air Lines $ 39,984 416
Halliburton $ 32,846 387
JP Morgan Chase $ 237,601 352
Honeywell International $ 79,597 351
Wells Fargo $ 277,920 342
Dow Chemical $ 59,866 334
Archer Daniels Midlands $ 27,804 333
ConocoPhillips $ 65,805 323
McKesson $ 41,143 320
Verizon $ 190,749 318
Merck $ 153,957 313
34
Marathon Petroleum $ 12,447 309
Morgan Stanley $ 64,403 296
Costco $ 69,163 295
Pfizer $ 208,580 291
American Airlines Group $ 31,052 291
Goldman Sachs Group $ 81,163 282
Sears Holdings $ 2,492 267
Safeway 262
Allstate $ 24,776 251
Bank of America Corp. $ 175,662 245
Deere $ 25,597 244
MetLife $ 56,268 244
Aetna $ 40,024 242
UnitedHealth Group $ 112,311 239
3M $ 96,796 236
Johnson Controls $ 29,551 235
General Dynamics $ 46,970 233
Cigna $ 34,515 232
Citigroup $ 160,033 231
HCA Holdings $ 28,043 219
Anthem $ 36,328 217
AIG $ 81,593 194
HP $ 48,480 181
DuPont $ 2,098 170
Humana $ 26,463 165
Express Scripts Holding $ 58,417 162
Cardinal Health $ 26,909 146
Intel $ 159,785 144
Plains GP Holdings $ 3,488 140
Apple $ 666,252 119
AmerisourceBergen $ 20,866 116
United Technologies $ 87,292 108
Ingram Micro $ 4,458 108
CHS 102
Tech Data $ 2,571 98
Cisco Systems $ 146,018 95
Sysco $ 24,493 92
World Fuel Services $ 3,147 90
Enterprise Products Partners
$ 55,347 78
Tesoro $ 12,873 69
Amazon.com $ 293,398 69
IBM $ 135,893 53
Procter & Gamble $ 207,797 53
DirecTV $ 47,180 31
Valero Energy $ 32,770 24
Energy Transfer Equity $ 22,728 15
INTL FCStone $ 608 15
Fannie Mae $ 2,606 12
Freddie Mac $ 1,437 12
United Continental Holdings $ 22,783 6
35
Berkshire Hathaway $ 169,667 6
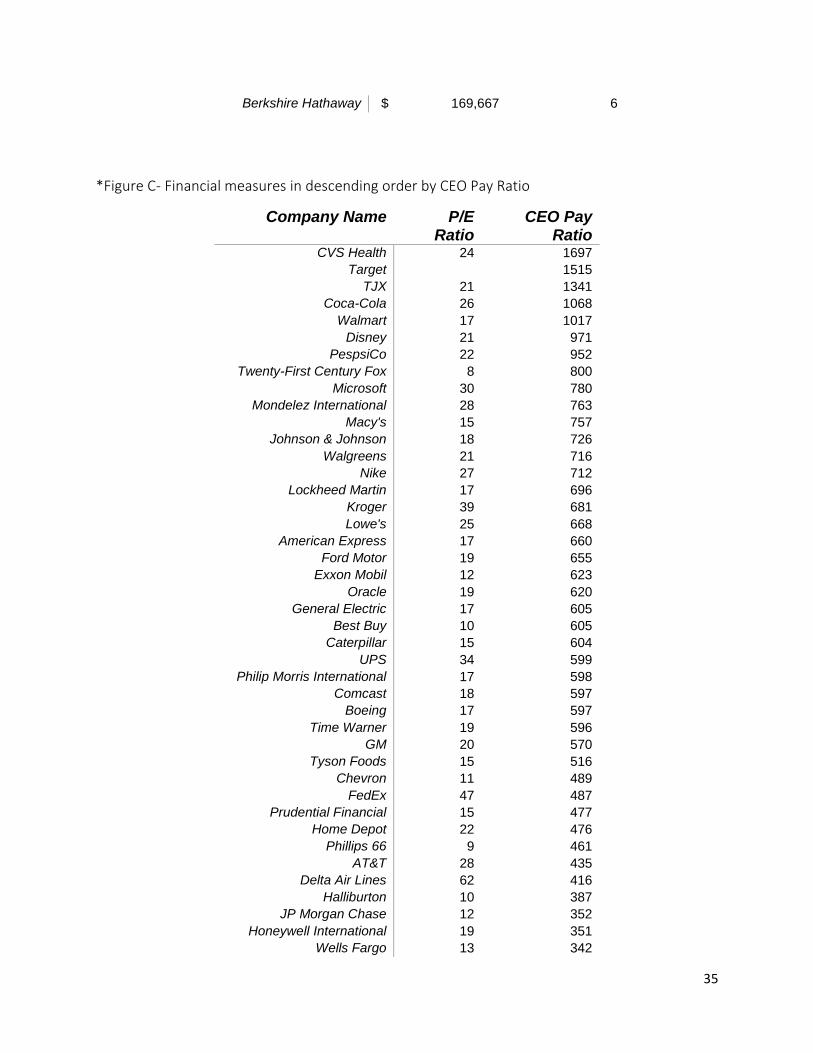
*Figure C- Financial measures in descending order by CEO Pay Ratio
Company Name P/E Ratio
CEO Pay Ratio
CVS Health 24 1697
Target 1515
TJX 21 1341
Coca-Cola 26 1068
Walmart 17 1017
Disney 21 971
PespsiCo 22 952
Twenty-First Century Fox 8 800
Microsoft 30 780
Mondelez International 28 763
Macy's 15 757
Johnson & Johnson 18 726
Walgreens 21 716
Nike 27 712
Lockheed Martin 17 696
Kroger 39 681
Lowe's 25 668
American Express 17 660
Ford Motor 19 655
Exxon Mobil 12 623
Oracle 19 620
General Electric 17 605
Best Buy 10 605
Caterpillar 15 604
UPS 34 599
Philip Morris International 17 598
Comcast 18 597
Boeing 17 597
Time Warner 19 596
GM 20 570
Tyson Foods 15 516
Chevron 11 489
FedEx 47 487
Prudential Financial 15 477
Home Depot 22 476
Phillips 66 9 461
AT&T 28 435
Delta Air Lines 62 416
Halliburton 10 387
JP Morgan Chase 12 352
Honeywell International 19 351
Wells Fargo 13 342

36
Dow Chemical 16 334
Archer Daniels Midlands 15 333
ConocoPhillips 15 323
McKesson 36 320
Verizon 19 318
Merck 14 313
Marathon Petroleum 6 309
Morgan Stanley 24 296
Costco 26 295
Pfizer 22 291
American Airlines Group 13 291
Goldman Sachs Group 11 282
Sears Holdings 267
Safeway 262
Allstate 11 251
Bank of America Corp. 47 245
Deere 10 244
MetLife 10 244
Aetna 15 242
UnitedHealth Group 17 239
3M 22 236
Johnson Controls 24 235
General Dynamics 18 233
Cigna 13 232
Citigroup 24 231
HCA Holdings 17 219
Anthem 14 217
AIG 11 194
HP 13 181
DuPont 28 170
Humana 19 165
Express Scripts Holding 32 162
Cardinal Health 23 146
Intel 16 144
Plains GP Holdings 54 140
Apple 12 119
AmerisourceBergen 63 116
United Technologies 17 108
Ingram Micro 16 108
CHS 102
Tech Data 12 98
Cisco Systems 16 95
Sysco 33 92
World Fuel Services 15 90
Enterprise Products Partners
24 78
Tesoro 11 69
Amazon.com 897 69
IBM 13 53
Procter & Gamble 31 53
DirecTV 16 31

37
Valero Energy 7 24
Energy Transfer Equity 99 15
INTL FCStone 17 15
Fannie Mae NR 12
Freddie Mac NR 12
United Continental Holdings 22 6
Berkshire Hathaway 0 6
*Figure D- Average ratio by industry and variation within each industry
Industry Avg CEO Pay Ratio Standard Deviation
B 292 214
D 394 279
E 333 215
F 109 6
G 740 475
H 236 159
I 334 276
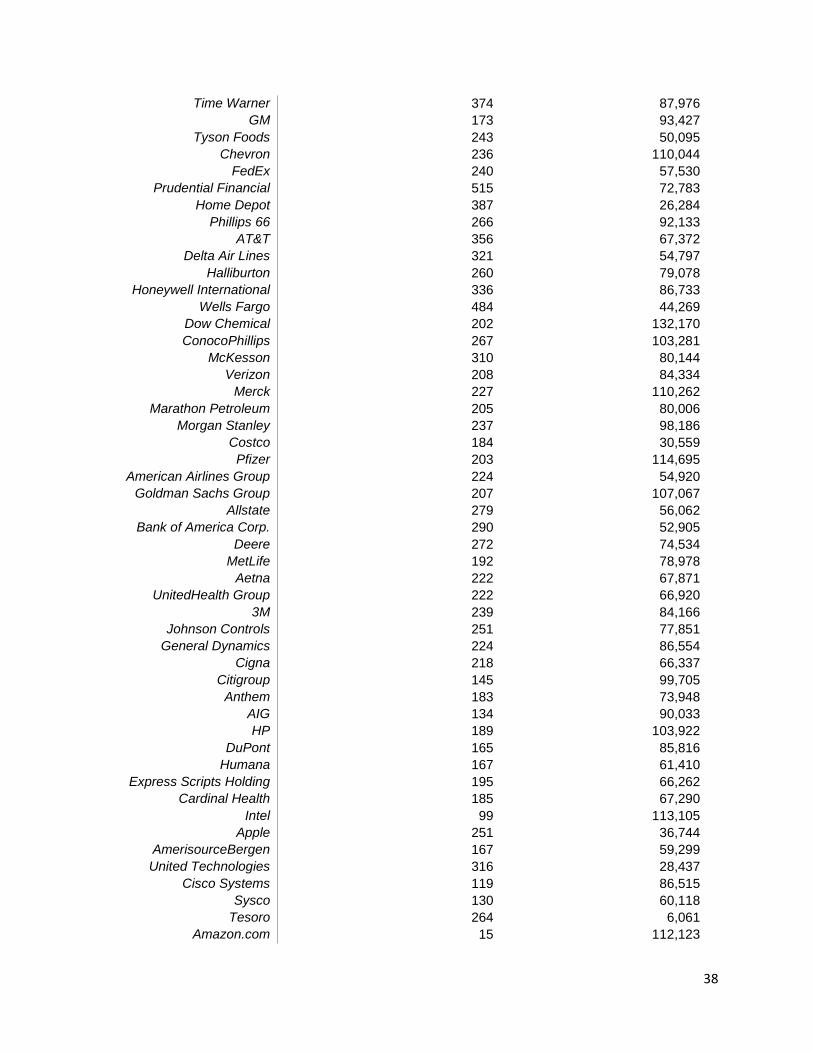
*Figure E- Glassdoor Study Data
Company Name Glassdoor CEO Pay Ratio Glassdoor Median Wage
CVS Health 1192 27,140
Target 939 30,744
TJX 501 57,270
Coca-Cola 460 54,836
Walmart 1133 17,116
Disney 587 79,211
PespsiCo 363 61,944
Microsoft 615 137,544
Mondelez International 427 49,274
Macy's 724 22,372
Johnson & Johnson 234 264,912
Walgreens 540 25,286
Nike 382 44,031
Lockheed Martin 394 85,501
Kroger 636 20,421
Lowe's 480 29,750
American Express 210 108,553
Ford Motor 207 89,838
Exxon Mobil 306 108,158
Oracle 573 117,384
General Electric 418 89,117
Best Buy 552 23,437
Caterpillar 197 86,962
UPS 533 31,885
Comcast 552 59,712
Boeing 340 84,888
38
Time Warner 374 87,976
GM 173 93,427
Tyson Foods 243 50,095
Chevron 236 110,044
FedEx 240 57,530
Prudential Financial 515 72,783
Home Depot 387 26,284
Phillips 66 266 92,133
AT&T 356 67,372
Delta Air Lines 321 54,797
Halliburton 260 79,078
Honeywell International 336 86,733
Wells Fargo 484 44,269
Dow Chemical 202 132,170
ConocoPhillips 267 103,281
McKesson 310 80,144
Verizon 208 84,334
Merck 227 110,262
Marathon Petroleum 205 80,006
Morgan Stanley 237 98,186
Costco 184 30,559
Pfizer 203 114,695
American Airlines Group 224 54,920
Goldman Sachs Group 207 107,067
Allstate 279 56,062
Bank of America Corp. 290 52,905
Deere 272 74,534
MetLife 192 78,978
Aetna 222 67,871
UnitedHealth Group 222 66,920
3M 239 84,166
Johnson Controls 251 77,851
General Dynamics 224 86,554
Cigna 218 66,337
Citigroup 145 99,705
Anthem 183 73,948
AIG 134 90,033
HP 189 103,922
DuPont 165 85,816
Humana 167 61,410
Express Scripts Holding 195 66,262
Cardinal Health 185 67,290
Intel 99 113,105
Apple 251 36,744
AmerisourceBergen 167 59,299
United Technologies 316 28,437
Cisco Systems 119 86,515
Sysco 130 60,118
Tesoro 264 6,061
Amazon.com 15 112,123

39
IBM 182 8,791
Procter & Gamble 190 6,579
Valero Energy 208 6,010
40
Sources:
"CEO Pay Strategies Report." Equilar, 2014. Web. 5 Nov. 2015.
Eavis, Peter. "SEC Approves Rule on CEO Pay Ratio." New York Times, 5 Aug. 2015. Web. 30
Sept. 2015.
Gabaix, Xavier, and Augustin Landier. "WHY HAS CEO PAY INCREASED SO MUCH?"
National Bureau of Economic Research, 1 July 2006. Web. 4 Nov. 2015.
"May 2014 National Industry-Specific Occupational Employment and Wage Estimates." U.S
Bureau of Labor Statistics, 1 May 2014. Web. 14 Aug. 2015.
"Menendez Reacts to SEC Vote Approving CEO-to-Worker Pay Ratio Rule." Bob Menedez For
New Jersey, 5 Aug. 2015. Web. 29 Sept. 2015.
Mishel, Lawrence, and Alyssa Davis. "Top CEOs Make 300 Times More than Typical Workers."
Economic Policy Institute, 21 June 2015. Web. 2 Nov. 2015.
National Average Wage Index. Social Security Administration, 2014. Web. 3 Nov. 2015.
Romer, Christina. "Business Cycles." The Concise Encyclopedia of Economics. Library of
Economics and Liberty, 2008. Web. 1 Oct. 2015.
"Rounds Reaffirms Commitment to Repeal Pay Ratio Rule." Mike Rounds United States Senator
for South Dakota, 5 Aug. 2015. Web. 1 Oct. 2015.
"SEC Adopts Rule for Pay Ratio Disclosure." U.S. Securities and Exchange Commission, 2015.
Web. 1 Oct. 2015.
"The Recession of 2007-2009." BLS Spotlight on Statistics (2012). U.S. Bureau of Labor
Statistics. Web. 18 Oct. 2015.
"Wage and Employment Summary Reports." O-Net OnLine, 2014. Web. 14 Aug. 2015.
"Wall Street Reform: The Dodd-Frank Act." Jobs & the Economy: Putting America Back to
Work. The White House. Web. 28 Sept. 2015.
Related Documents