How New Trends Are Reversing Old Assumptions Based on the Past Dowell Myers USC Sol Price School of Public Policy Preparing for California’s New Generational Future

How New Trends Are Reversing Old Assumptions Based on the Past Dowell Myers USC Sol Price School of Public Policy Preparing for California’s New Generational.
Dec 24, 2015
Welcome message from author
This document is posted to help you gain knowledge. Please leave a comment to let me know what you think about it! Share it to your friends and learn new things together.
Transcript

How New Trends Are Reversing Old Assumptions Based on the Past
Dowell Myers
USC Sol Price School of Public Policy
Preparing for California’s New Generational Future

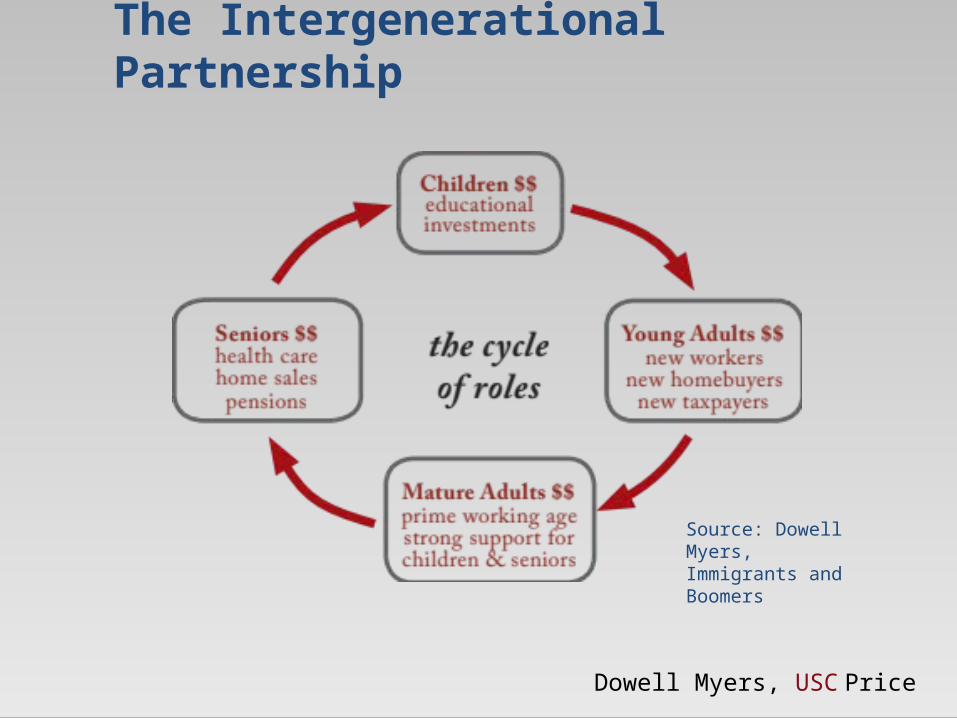
The Intergenerational Partnership
Source: Dowell Myers,Immigrants and Boomers
Dowell Myers, USC Price

Demographic Assumptions
are Core to Public Beliefs about Services and Taxation
andPriorities for California Policy
Are the Old Assumptions an Accurate Guide for the
Future?

Dowell Myers, USC Price
Reversal of Outlooks
1990 OutlookGrowth booming out
of control Runaway immigration
High fertility, too many kids
Growth coming from outside foreign lands and other states
2010 and beyond
Slow steady increase
Diminished immigration, even during good economy
Reduced fertility, and a shortage of children
Growth from native Californians: homegrown

Four Revolutions
Much Slower Population Growth
Immigration Turnaround: Foreign Born Peaked or
Declining
Generation Transformation: Declining Number of ChildrenA Soaring Senior Ratio
Homegrown Revolution:New Importance of Investing in
Children

Slower Population Growth

Observed and Expected Population GrowthIn California Each Decade from 1950-2050
Dowell Myers, USC PriceSource: US Census Bureau, CA Department of Finance, Pitkin-Myers
2012 CA Generational Projections
1950-60
1960-70
1970-80
1980-90
1990-00
2000-10
2010-20
2020-30
2030-40
2040-50
0
1,000,000
2,000,000
3,000,000
4,000,000
5,000,000
6,000,000
7,000,000
Census DOF-07 DOF 13 Pitkin-Myers CDF 12

Total Population of CaliforniaHow Much Will Growth Resurge?
1950 1960 1970 1980 1990 2000 2010 2020 2030 2040 2050 20600
10000000
20000000
30000000
40000000
50000000
60000000
DOF-07
DOF-13
Pitkin-Myers CDF 12
Census
Pitkin-Myers CDF 12
Source: US Census Bureau, CA Department of Finance, Pitkin-Myers CA Generational Projections 2012

What Year Does CaliforniaReach 50 Million Population?
• Old Expectation = 2032
• New Outlook = 2049
Source: California Department of Finance, 2007 and 2013
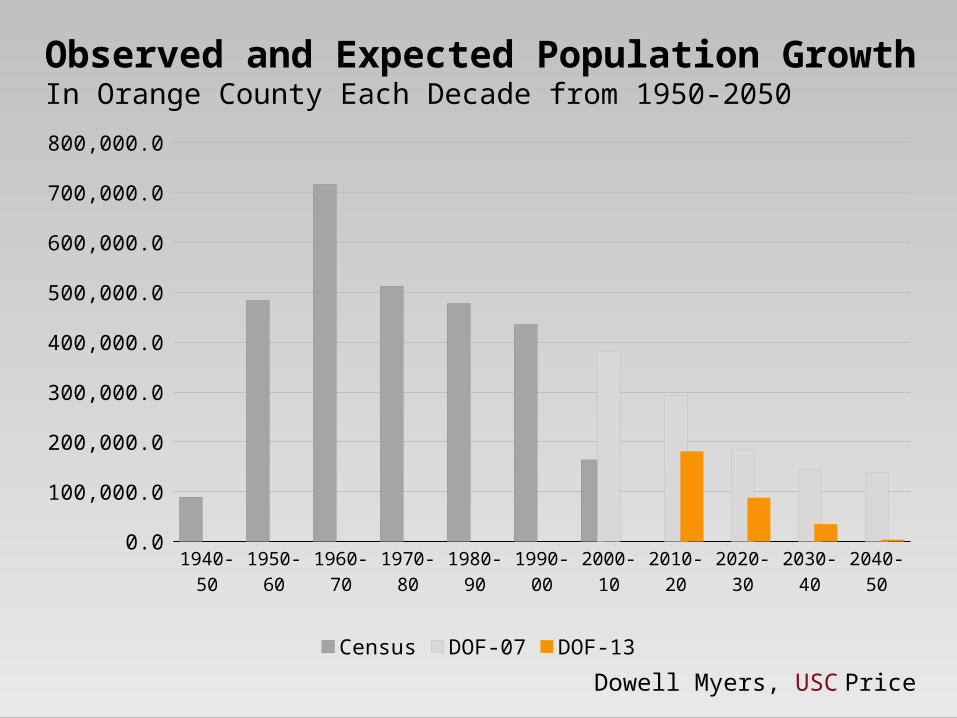
Observed and Expected Population GrowthIn Orange County Each Decade from 1950-2050
Dowell Myers, USC Price
1940-50 1950-60 1960-70 1970-80 1980-90 1990-00 2000-10 2010-20 2020-30 2030-40 2040-500.0
100,000.0
200,000.0
300,000.0
400,000.0
500,000.0
600,000.0
700,000.0
800,000.0
Census DOF-07 DOF-13

Total Population of Orange CountyHow Much Will Growth Resurge?
Dowell Myers, USC Price
1940 1950 1960 1970 1980 1990 2000 2010 2020 2030 2040 20500.0
500,000.0
1,000,000.0
1,500,000.0
2,000,000.0
2,500,000.0
3,000,000.0
3,500,000.0
4,000,000.0
4,500,000.0
Census
DOF-07
DOF-13

What Year Does Orange CountyReach 3.3 Million Population?
• Old Expectation = 2012
• New Outlook = 2032
Source: California Department of Finance, 2007 and 2013
Dowell Myers, USC Price

U.S. Population Growth by Age GroupLast 20 Years and Next 20 Years
Source: Decennial Census and 2012 Census Bureau projections
Dowell Myers, USC Price

Growth in Age Groups in Orange County
0-4
5-9
10-14
15-19
20-24
25-29
30-34
35-39
40-44
45-49
50-54
55-59
60-64
65-69
70-74
75-79
80-84
85+
-50
0
50
100
150
1990 - 2010
Th
ou
sa
nd
s
0-4
5-9
10-14
15-19
20-24
25-29
30-34
35-39
40-44
45-49
50-54
55-59
60-64
65-69
70-74
75-79
80-84
85+
-60
-20
20
60
100
2010 - 2030
Th
ou
sa
nd
s
Dowell Myers, USC Price

Immigration Turnaround
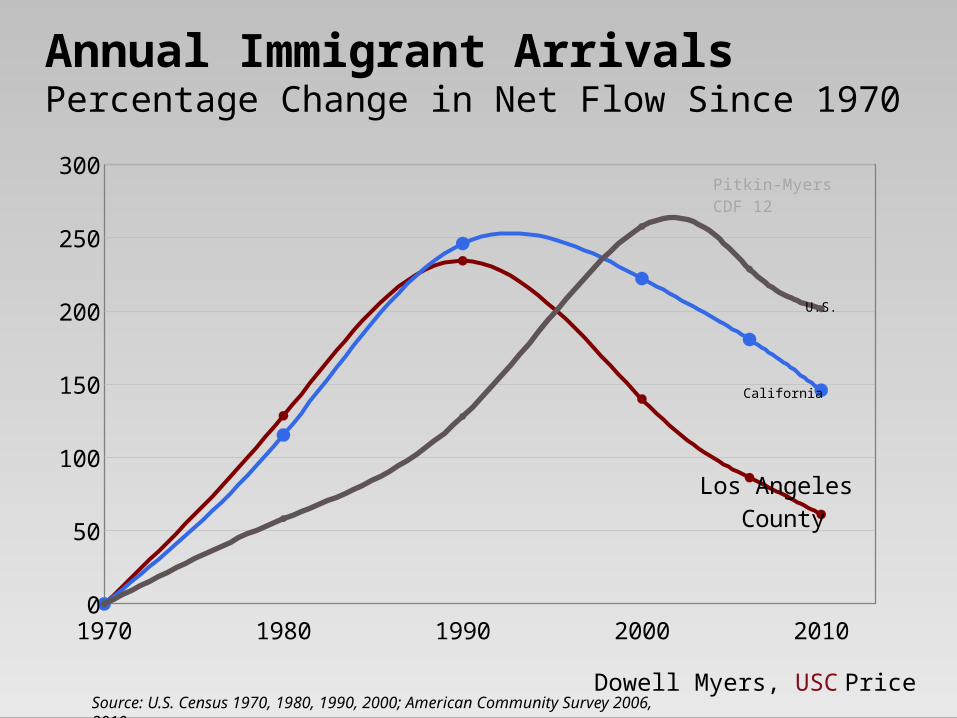
Annual Immigrant ArrivalsPercentage Change in Net Flow Since 1970
Source: U.S. Census 1970, 1980, 1990, 2000; American Community Survey 2006, 2010
Dowell Myers, USC Price
1970 1980 1990 2000 20100
50
100
150
200
250
300
Los Angeles County
California
U.S.
Pitkin-Myers CDF 12
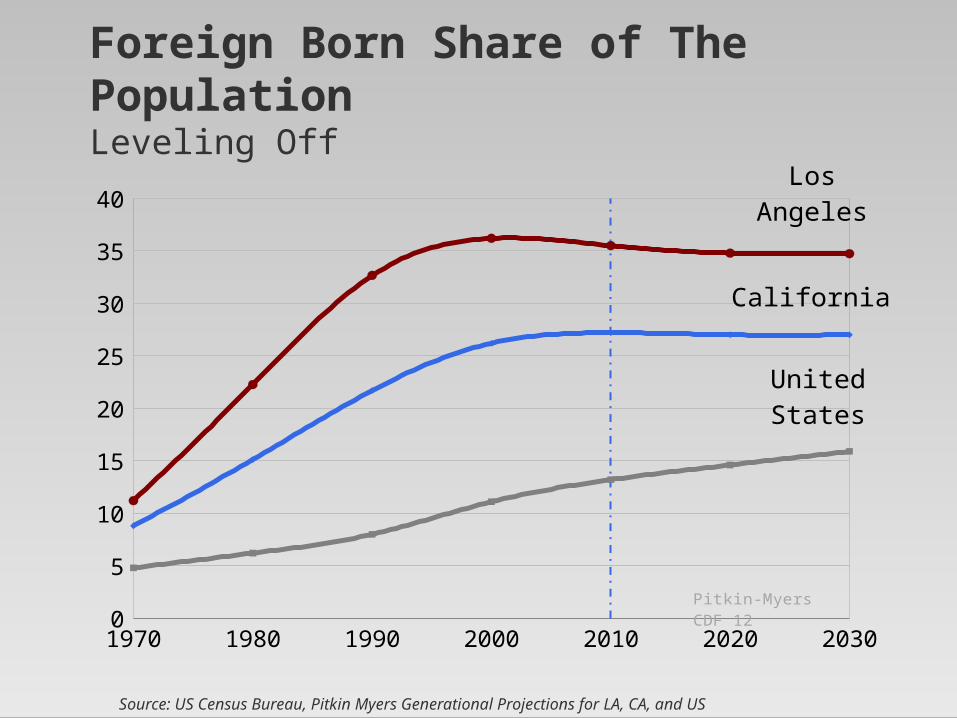
Foreign Born Share of The PopulationLeveling Off
1970 1980 1990 2000 2010 2020 20300
5
10
15
20
25
30
35
40
United States
California
Los Angeles
Pitkin-Myers CDF 12
Source: US Census Bureau, Pitkin Myers Generational Projections for LA, CA, and US

Longer Settled Immigrant Share RisesShare of All CA Foreign-born ResidentsBy Length of Time in U.S. in Years
1990 2000 2010 2020 2030 20400
10
20
30
40
50
60
70
80
90
100
30+
20-29
10-19
LT 10
Pitkin-Myers CDF 12
Source: US Census PUMS, American Community Survey, Pitkin Myers 2012 CA Generational Projections

Demographic Projection Content
Conventional Pitkin-Myers ModelAge
Gender
Race or Hispanic
Origin
Age
Gender
Race or Hispanic Origin
Native or Foreign Born
Year of Entry of Foreign
Born
Generation of Native
Born
California vs. Other Birth
State
Dowell Myers, USC Price

Dowell Myers, USC Price
Reversal of Outlooks
1990 Outlook
A revolution in outlook on immigration
Accelerated immigration
Most immigrants are recentarrivals
Immigrant share soaring and assumed unlimited
Diminished immigration, even during good economy
Most are long-settledarrivals & older
Immigrant share constant and stable for the future
2010 and Beyond

Generation Transformation
Declining Numbers of Children
Surging Numbers of Retirees
What is the Political Relation?
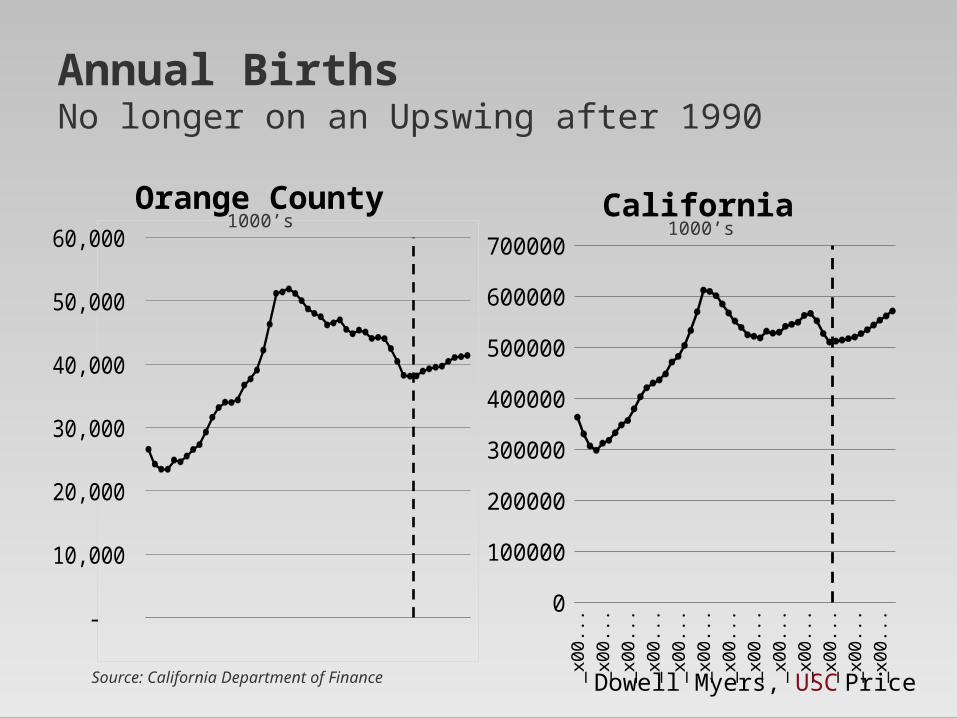
Annual BirthsNo longer on an Upswing after 1990
Orange County California
_x00
0...
_x00
0...
_x00
0...
_x00
0...
_x00
0...
_x00
0...
_x00
0...
_x00
0...
_x00
0...
_x00
0...
_x00
0...
_x00
0...
_x00
0...
_x00
0...
_x00
0...
_x00
0...
_x00
0...0
100000
200000
300000
400000
500000
600000
700000
Source: California Department of Finance Dowell Myers, USC Price
1000’s
-
10,000
20,000
30,000
40,000
50,000
60,000 1000’s

Sierra
Plumas
San Benito
Tuolumne
Mariposa
Nevada
Amador
Alameda
Modoc
San Diego
-25.0 -20.0 -15.0 -10.0 -5.0 0.0
Percentage Losses or Gains
Losses of Children Under Age 10Among Counties with Losses Greater than the State Average2000 to 2010
Dowell Myers, USC Price

Losses of Children Under Age 10Among Counties of Southern California2000 to 2010
Dowell Myers, USC Price
Los Angeles
Orange
Ventura
San Diego
CALIFORNIA
Santa Barbara
San Bernardino
Imperial
Riverside
-20.0 -10.0 0.0 10.0 20.0 30.0
Percentage Losses or Gains

Growth in Age Groups in Orange County
0-4
5-9
10-14
15-19
20-24
25-29
30-34
35-39
40-44
45-49
50-54
55-59
60-64
65-69
70-74
75-79
80-84
85+
-50
0
50
100
150
1990 - 2010
Th
ou
sa
nd
s
0-4
5-9
10-14
15-19
20-24
25-29
30-34
35-39
40-44
45-49
50-54
55-59
60-64
65-69
70-74
75-79
80-84
85+
-60-40-20020406080100
2010 - 2030
Th
ou
sa
nd
s
Dowell Myers, USC Price

Senior Ratio Soars
1980 1985 1990 1995 2000 2005 2010 2015 2020 2025 203010
15
20
25
30
35
40
45
CaliforniaLos AngelesOrangeSan BernardinoSan DiegoRiverside
Seniors (65+) per 100 Working Age (25-64)
Dowell Myers, USC Price
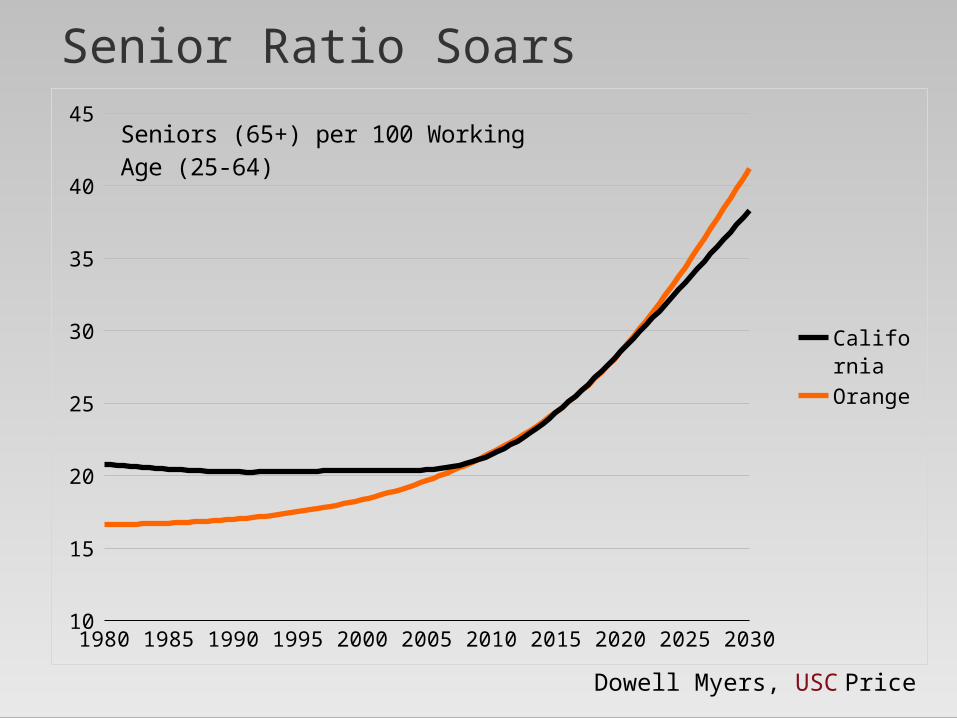
Senior Ratio Soars
1980 1985 1990 1995 2000 2005 2010 2015 2020 2025 203010
15
20
25
30
35
40
45
California
Orange
Seniors (65+) per 100 Working Age (25-64)
Dowell Myers, USC Price


Some say there is a
conflict of Old vs. Young
But others showa Partnershipwith mutual
benefits

Working togetherto solve
our biggest problems


The Intergenerational Partnership
Source: Dowell Myers,Immigrants and Boomers
Dowell Myers, USC Price

1990 OutlookHigh fertility
Too many childrenA growing tax burden
Very few elderly
2010 and beyondReduced fertility, even during good economy
A shortage of children; Not enough taxpayers and workers for the future
Baby Boomer tsunamicreates soaring senior ratioA revolution in outlook on the
generations Dowell Myers, USC Price
Reversal of Outlooks

The Homegrown Revolution
in California

Source: Author’s analysis of U.S. Census 1980-2000 and American Community Survey 2005-2008 data
Rise of a Homegrown Majority

Birthplace of Young Compared to OldCA Residents By Age and Birthplace, 2030
>10 10-17 18-24 25-34 35-44 45-54 55-64 65-74 75-84 85 +0
10
20
30
40
50
60
70
80
90
100
California Born
Foreign Born
Other US Born
Pitkin-Myers CDF 2012
Source: Pitkin-Myers 2012 CA Generational Projections Dowell Myers, USC Price

Children’s Index of Critical Importance (iCi)
• Assigned at birth, the iCi is based on the increase in the senior ratio expected at the time the child reaches age 25 (number of seniors per 100 working age).
• With growth in seniors, today’s children assume critical importance because of the added economic and social weight to be carried by the children when grown.
• A child born in 2010 in California is fully twice as important (index of 2.02) as a child who was born in 1985 (index of 1.00).
Dowell Myers, USC Price

Surging Importance of Children
Source: Dowell Myers analysis of US Census and DOF 2013 California projections
Dowell Myers, USC Price
0.00
0.40
0.80
1.20
1.60
2.00
2.40
iCi Children's Index of Critical
Importance
OrangeCali-fornia
Year of Birth

1990 OutlookGrowth coming from outside: immigrants and from inter-state
Growth is excess, too costly and unwanted
Neglect and under-investment in skill development of children
2010 and beyondGrowth from native Californians: homegrown
Too little growth to meet the needs of the economy and generational support
Children deserve nurturing for maximum productivity and future prosperity of the state
A revolution in outlook on the homegrown Dowell Myers, USC Price
Reversal of Outlooks
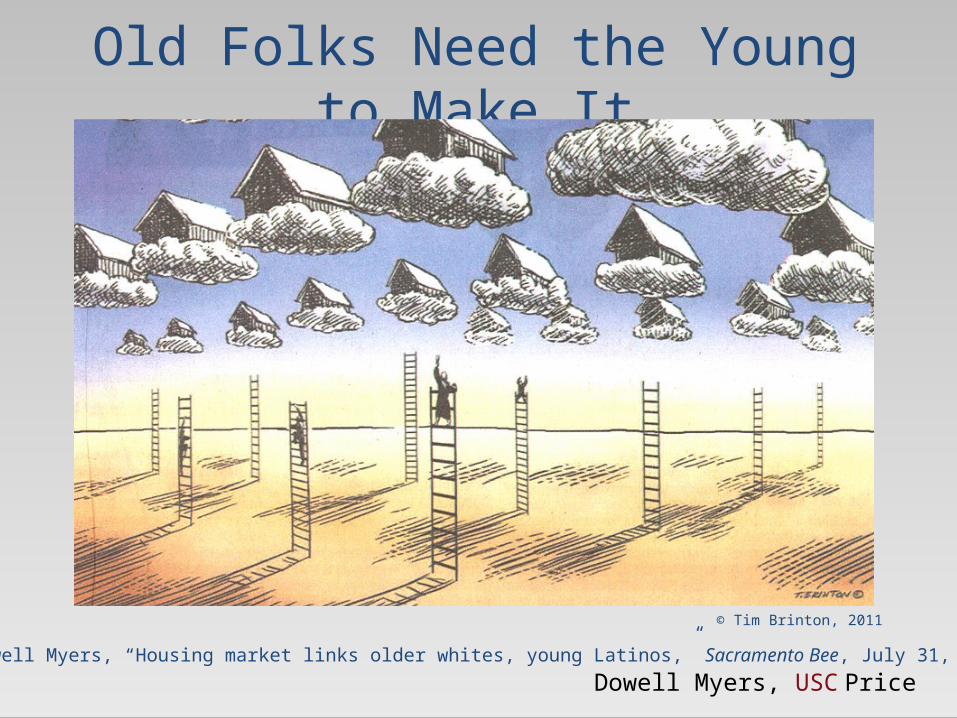
Old Folks Need the Young to Make It
Dowell Myers, “Housing market links older whites, young Latinos,” Sacramento Bee, July 31, 2011
Dowell Myers, USC Price
© Tim Brinton, 2011
The Intergenerational Partnership
Source: Dowell Myers,Immigrants and Boomers
Dowell Myers, USC Price

Conclusions• What is the most surprising
finding about the new generational future of California?
Is it the leveling off of the foreign born?
Is it the new majority of the homegrown?
Could it be the explosion of seniors?
Or is it the scarcity of children and their doubled
importance?• Maybe it’s the realization that the
generations might really be connected after all
Dowell Myers, USC Price

Thank you
More Information on
Generational projectionsCalifornia futures
Visit USC PopDynamics
Dowell Myers, USC Price

Publications Referenced in this PresentationMyers, Dowell, “California Futures: New Narratives for a Changing Society,” Boom: A Journal of California, July 2012.
Pitkin, John and Dowel Myers, “Generational Projections of the California Population: By Nativity and Year of Immigrant Arrival,” USC Population Dynamics Research Group, April 2012.
Myers, Dowell, “California's Diminishing Resource: Children,” Lucile Packard Foundation for Children’s Health, January 2013.
Myers, Dowell, “Benefits for California and Its Growing Number of Seniors of Expanded Youth Access to Higher Education,” written testimony before the Joint Committee on the Master Plan for Higher Education, California State Legislature, February 2, 2010.
Myers, Dowell, John Pitkin, and Ricardo Ramirez, “The New Homegrown Majority in California: Recognizing the New Reality of Growing Commitment to the Golden State,” Special Report, USC Population Dynamics Research Group, April 2009.
Myers, Dowell and SungHo Ryu, “Aging Baby Boomers and the Generational Housing Bubble: Foresight and Mitigation of an Epic Transition,” Journal of the American Planning Association 74, 1 (Winter 2008): 17-33. (Winner of 2008 Award for Best Article in the Journal.)
Myers, Dowell, Immigrants and Boomers: Forging a New Social Contract for the Future of America. New York: Russell Sage Foundation, 2007.
NOTE: most publications are available at http://www.usc.edu/schools/price/research/popdynamics/
Related Documents