How much visual road information is needed to drive safely and comfortably? Dick de Waard * , Frank J.J.M. Steyvers, Karel A. Brookhuis Department of Psychology, University of Groningen, Grote Kruisstraat 2/1, 9712 TS Groningen, The Netherlands Abstract The questions ‘‘how much visual information from the road is required for proper driv- ing?’’, and ‘‘how do people cope with a visually ambiguous road configuration?’’, were ex- plored in an advanced driving simulator. Sixteen young and 16 elderly drivers completed two test rides on a rural road that was divided into five sections of 2 km, at each section a road element (e.g., delineation, roadside marker) was added or removed. During the rides, performance (lateral position, speed) and heart rate were recorded continuously, and before transition to a new section drivers gave a rating on invested effort and on visibility of the (previous) road course. The experimentÕs goal was to determine whether a shift in driving behaviour could be noticed at a certain amount of visual information. The main threshold found, for both age groups, lies between roads with Ôno delineation on the road surface at allÕ and Ôa centre-lineÕ. Elderly drivers, however, appeared to need the visual aid of the centre-line to a greater extent than young drivers, and in general they drove slower and regulated their information input in this way. A visually ambiguous road situation concluded the experiment. The participants drove on a centre-lined road towards a junction where the road forked to the left and right. The left-hand road was a road without delineation but with lampposts, the right-hand road was a contin- uation of the centre-lined road without lampposts. In particular elderly drivers were confused by this situation and chose the road with lampposts more often. This finding supports the assumption that with increasing age people are more easily confused by ambiguous cues. Ó 2003 Published by Elsevier Ltd. * Corresponding author. Tel.: +31-50-363-67-61; fax: +31-50-363-67-84. E-mail address: [email protected] (D. de Waard). 0925-7535/$ - see front matter Ó 2003 Published by Elsevier Ltd. doi:10.1016/j.ssci.2003.09.002 Safety Science xxx (2003) xxx–xxx www.elsevier.com/locate/ssci ARTICLE IN PRESS

Welcome message from author
This document is posted to help you gain knowledge. Please leave a comment to let me know what you think about it! Share it to your friends and learn new things together.
Transcript
ARTICLE IN PRESS
Safety Science xxx (2003) xxx–xxx
www.elsevier.com/locate/ssci
How much visual road information is neededto drive safely and comfortably?
Dick de Waard *, Frank J.J.M. Steyvers, Karel A. Brookhuis
Department of Psychology, University of Groningen, Grote Kruisstraat 2/1,
9712 TS Groningen, The Netherlands
Abstract
The questions ‘‘how much visual information from the road is required for proper driv-
ing?’’, and ‘‘how do people cope with a visually ambiguous road configuration?’’, were ex-
plored in an advanced driving simulator.
Sixteen young and 16 elderly drivers completed two test rides on a rural road that was
divided into five sections of 2 km, at each section a road element (e.g., delineation, roadside
marker) was added or removed. During the rides, performance (lateral position, speed) and
heart rate were recorded continuously, and before transition to a new section drivers gave a
rating on invested effort and on visibility of the (previous) road course. The experiment�s goalwas to determine whether a shift in driving behaviour could be noticed at a certain amount of
visual information.
The main threshold found, for both age groups, lies between roads with �no delineation on
the road surface at all� and �a centre-line�. Elderly drivers, however, appeared to need the visual
aid of the centre-line to a greater extent than young drivers, and in general they drove slower
and regulated their information input in this way.
A visually ambiguous road situation concluded the experiment. The participants drove on a
centre-lined road towards a junction where the road forked to the left and right. The left-hand
road was a road without delineation but with lampposts, the right-hand road was a contin-
uation of the centre-lined road without lampposts. In particular elderly drivers were confused
by this situation and chose the road with lampposts more often. This finding supports the
assumption that with increasing age people are more easily confused by ambiguous cues.
� 2003 Published by Elsevier Ltd.
* Corresponding author. Tel.: +31-50-363-67-61; fax: +31-50-363-67-84.
E-mail address: [email protected] (D. de Waard).
0925-7535/$ - see front matter � 2003 Published by Elsevier Ltd.
doi:10.1016/j.ssci.2003.09.002

2 D. de Waard et al. / Safety Science xxx (2003) xxx–xxx
ARTICLE IN PRESS
1. Introduction
In order to keep a vehicle on the road clear perception of that road is obviously
crucial. The appearance of a road can be very different, not only is there a wide
variety in road layout and delineation internationally and nationally, temporary
factors as daylight also affect road perception.
With respect to delineation McKnight et al. (1998) found that lane lines with low
contrast coincide with reduced lane-keeping performance. However, only when de-lineation is hardly visible (i.e., low contrast) these effects were found. Riemersma
(1979) also found improved lane-keeping control on roads with a clear road marking
compared with roads with less clear marking. Similarly, a low contrast between road
edge and road shoulder is more difficult to perceive and can lead to steering inac-
curacy. In an effort to keep the vehicle on the road drivers can even overreact in
steering and end up on the other side of the road. Edge-lines can counteract this effect
(Steyvers and de Waard, 2000), and improve lane visibility, especially in darkness.
In general a reduced lane width leads to reduced driving speed (Yagar and VanAerde, 1983) while sign posts (Kallberg, 1993) and road markings (Tenkink, 1988;
Steyvers and de Waard, 2000) provide guidance and lead to increased driving speed.
Landwehr (1991) recommends optical posts in addition to roadside pavement
markers. Reason for this advice are results from research on visual perception during
driving (Land and Horwood, 1996) that show that drivers search for visual elements
to estimate road course in curves and beyond. Placement of these vertical elements
may improve curve tracking, but the height of these objects should be clearly above
eye-level, such as lampposts (see also Riemersma, 1979).When looking at accident data, in the US in Arizona, Taylor et al. (1972) found
that adding edge-lines to a formerly non-delineated road reduced accidents with
80%. In England, however, Willis et al. (1984) found inconclusive accident data
comparing situations before and after adding road marking. Driving speed did not
change. The authors conclude that on the basis of their study no recommendation
with respect to adding delineation or not to roads can be given. The OECD (1990)
evaluated several studies on effects of road characteristics and comes with a similar
conclusion, in some studies positive safety effects of road accidents were found, inothers more accidents are reported. With respect to type of road marking in general
the conclusion is that non-continuous lines improve speed estimation or impression
(e.g., Landwehr, 1991).
In contrast, visual elements such as delineation have also been removed in an
effort to reduce speeding by providing less guidance. In an experiment in the
Netherlands edge-lines were completely removed to reduce their guiding property.
On-road evaluation data (De Waard et al., 1995) and accident data (Steyvers, 1999)
have shown that this measure works as intended. Other perceptual countermeasuressuch as hatched centre areas have also been found to reduce driving speed by af-
fecting speed perception (Godley et al., 1999).
In general the focus of the scientific community is on information overload in
driving. Overload can result from the use of additional devices such as mobile
phones (e.g., Brookhuis et al., 1991; Goodman et al., 1999), or other distracting new
D. de Waard et al. / Safety Science xxx (2003) xxx–xxx 3
ARTICLE IN PRESS
in-car telematics (Fairclough et al., 1993; Summala et al., 1996; Lamble et al., 1999).
Increased road complexity is also a factor that has been studied (De Waard, 1991;
Richter et al., 1998; Verwey, 2000; Kantowitz and Simsek, 2001), but less is known
about the minimal visual properties a road has to have to give enough guidance to
drive safely. The road authority�s interest in this question is obviously also a matter
of efficiency; less delineation means less installation costs as well as less maintenance
costs. However, care has to be taken that the needs of all drivers are taken into
account. In an ageing society the proportion elderly drivers increases, and with in-creasing age amongst others visual acuity reduces. Decisions to remove visual cues
should take this group of drivers into account.
With respect to visibility and guidance of a road layout and appearance, the
following research questions can be asked:
• How is lane keeping affected by road appearance?
• Do drivers adapt their speed in conditions where there is less information and
guidance?• Is there a shift in behaviour after adding certain delineation or other visual infor-
mation?
• How do drivers respond to conflicting visual information?
In the present study the focus is on the road itself. In the real world there is often
other traffic that affects behaviour, but that is not studied here, only the road�s ap-pearance is changed.
2. Method
Thirty-two volunteers were recruited via local media and were paid for partici-
pation. Sixteen of them were young (25–40), 16 elderly (55–70 years). To get used to
driving the simulator participants first completed a practice session until a stable
driving level was attained. In general this took about 10 min. Personal information
on driving experience was gathered, and ECG electrodes were attached to partici-pants� chest.
The driving simulator of the Department of Psychology of the University of
Groningen was used for the experiment. The simulator was fixed based, and con-
sisted of a car (a BMW 525) with original controls linked to a Silicon Graphics
computer that recorded driver behaviour and computed the road environment. The
road environment was projected on a screen that covered 165� angle horizontal view,and 45� vertical view (for details on the simulator see Van Wolffelaar and Van
Winsum, 1995).In the simulator test rides were completed on a road in a rural environment. The
road was divided into five 2 km sections, after each section visual information in the
form of a road element was added or removed. A road element was defined as de-
lineation, roadside markers or lampposts. The appearance of the road was as fol-
lows:
4 D. de Waard et al. / Safety Science xxx (2003) xxx–xxx
ARTICLE IN PRESS
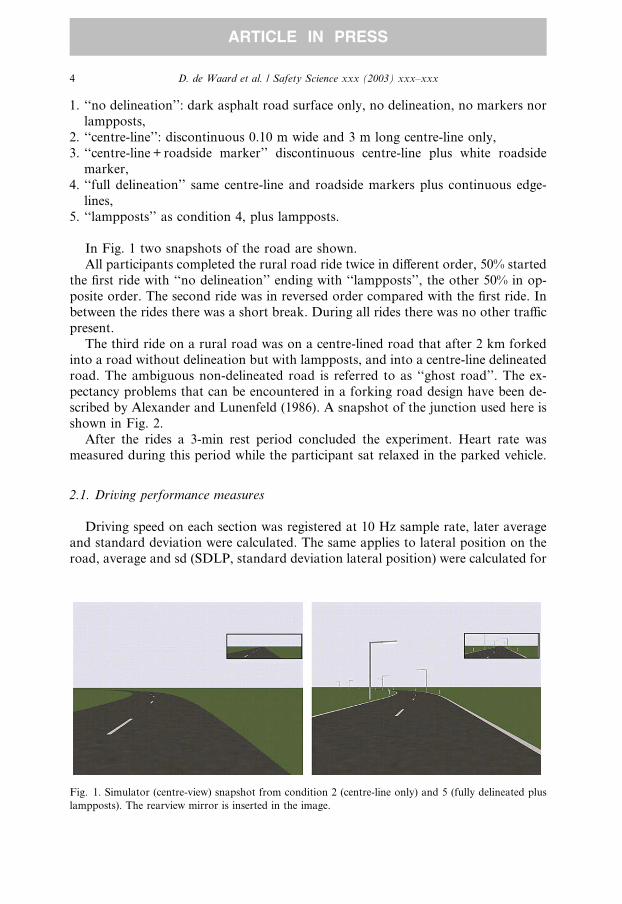
1. ‘‘no delineation’’: dark asphalt road surface only, no delineation, no markers nor
lampposts,
2. ‘‘centre-line’’: discontinuous 0.10 m wide and 3 m long centre-line only,
3. ‘‘centre-line + roadside marker’’ discontinuous centre-line plus white roadside
marker,
4. ‘‘full delineation’’ same centre-line and roadside markers plus continuous edge-
lines,
5. ‘‘lampposts’’ as condition 4, plus lampposts.
In Fig. 1 two snapshots of the road are shown.
All participants completed the rural road ride twice in different order, 50% started
the first ride with ‘‘no delineation’’ ending with ‘‘lampposts’’, the other 50% in op-
posite order. The second ride was in reversed order compared with the first ride. In
between the rides there was a short break. During all rides there was no other traffic
present.
The third ride on a rural road was on a centre-lined road that after 2 km forkedinto a road without delineation but with lampposts, and into a centre-line delineated
road. The ambiguous non-delineated road is referred to as ‘‘ghost road’’. The ex-
pectancy problems that can be encountered in a forking road design have been de-
scribed by Alexander and Lunenfeld (1986). A snapshot of the junction used here is
shown in Fig. 2.
After the rides a 3-min rest period concluded the experiment. Heart rate was
measured during this period while the participant sat relaxed in the parked vehicle.
2.1. Driving performance measures
Driving speed on each section was registered at 10 Hz sample rate, later averageand standard deviation were calculated. The same applies to lateral position on the
road, average and sd (SDLP, standard deviation lateral position) were calculated for
Fig. 1. Simulator (centre-view) snapshot from condition 2 (centre-line only) and 5 (fully delineated plus
lampposts). The rearview mirror is inserted in the image.
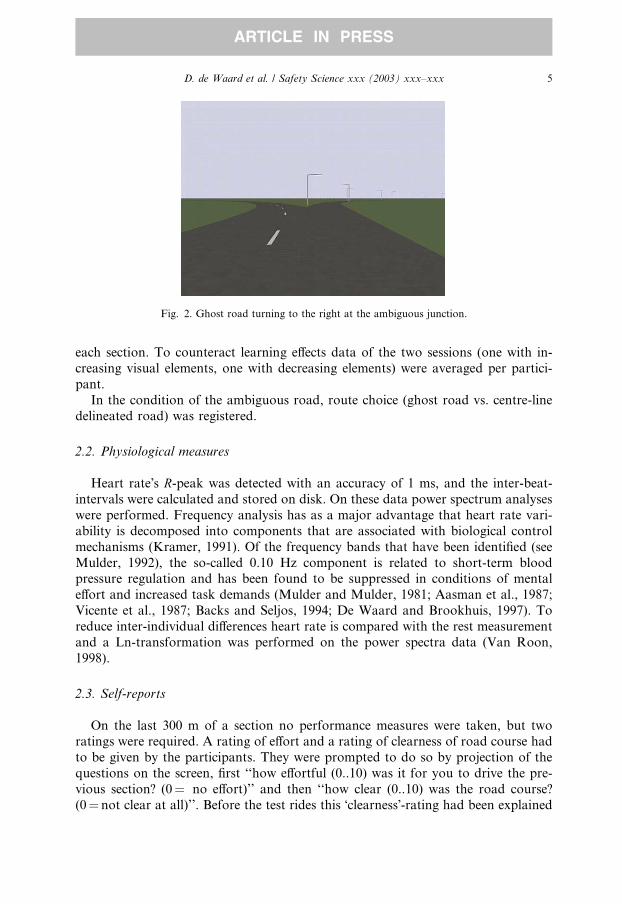
Fig. 2. Ghost road turning to the right at the ambiguous junction.
D. de Waard et al. / Safety Science xxx (2003) xxx–xxx 5
ARTICLE IN PRESS
each section. To counteract learning effects data of the two sessions (one with in-
creasing visual elements, one with decreasing elements) were averaged per partici-
pant.
In the condition of the ambiguous road, route choice (ghost road vs. centre-line
delineated road) was registered.
2.2. Physiological measures
Heart rate�s R-peak was detected with an accuracy of 1 ms, and the inter-beat-
intervals were calculated and stored on disk. On these data power spectrum analyses
were performed. Frequency analysis has as a major advantage that heart rate vari-
ability is decomposed into components that are associated with biological control
mechanisms (Kramer, 1991). Of the frequency bands that have been identified (see
Mulder, 1992), the so-called 0.10 Hz component is related to short-term bloodpressure regulation and has been found to be suppressed in conditions of mental
effort and increased task demands (Mulder and Mulder, 1981; Aasman et al., 1987;
Vicente et al., 1987; Backs and Seljos, 1994; De Waard and Brookhuis, 1997). To
reduce inter-individual differences heart rate is compared with the rest measurement
and a Ln-transformation was performed on the power spectra data (Van Roon,
1998).
2.3. Self-reports
On the last 300 m of a section no performance measures were taken, but tworatings were required. A rating of effort and a rating of clearness of road course had
to be given by the participants. They were prompted to do so by projection of the
questions on the screen, first ‘‘how effortful (0..10) was it for you to drive the pre-
vious section? (0¼ no effort)’’ and then ‘‘how clear (0..10) was the road course?
(0¼ not clear at all)’’. Before the test rides this �clearness�-rating had been explained
6 D. de Waard et al. / Safety Science xxx (2003) xxx–xxx
ARTICLE IN PRESS
as to be a judgement on the visibility of the road�s course. The score was spoken out
aloud (there was a microphone in the car) and written down by the experimenter.
2.4. Instruction
Speed instruction was varied between participants. Half of them were told that
they would be driving on a 60 km/h speed-limit road, the other half were told the
speed limit was 100 km/h. Although driving a curve at 100 km/h was possible, it wasquite fast for the radius of 200 m. Purpose was to influence response set, or cognitive
representation, in terms of road type and events that could be expected. These are
different for a 60 and 100 km/h speed-limit road. No events like e.g. farming vehicles
were added to the conditions (in fact, there was no other traffic at all), so in the end
all that was influenced were expectations. The instruction was given at the beginning,
and not repeated during the experiment.
2.5. Hypotheses
• Between one of the successive sections there is a more or less abrupt change in be-
haviour in terms of vehicle parameters, physiology, or subjective ratings. This
shift in behaviour indicates a break in critical visual road information.
• Speed instruction (response set) has an influence on this threshold, at a slower
speed (instruction) less visual information is needed to drive safely and comfort-
ably compared with driving at a higher speed.
• Elderly drivers require more or different visual information to maintain task per-formance.
• Drivers will be confused by the ambiguous road forking and 50% will choose the
ghost road. As elderly drivers benefit most from redundant information (e.g., De
Waard et al., 1999c) the conflicting information will confuse them more than
young drivers.
Statistical tests were performed using SPSS 10.0 for Windows.
3. Results
3.1. Participants
As intended, a total of 32 participants completed the test rides of which 16 were
young (11 male), and 16 elderly (10 male). Average age of the young participants was
31.1 years (sd 4.9), of the elderly 67.4 years (sd 6.0). The young had driven an av-erage total distance of 150,000 km (sd 170,000) and had held a licence for 10 years
(sd 6.3), the elderly had an average total driven distance of 800,000 (sd 1,100,000),
and had held their licence for 37.5 years (sd 7.5). Annual mileage did not differ
between the groups, 19,000 km/year (sd 19,500) for the young, and 12,500 km/year
(sd 7000) for the elderly (Mann–Whitney, Z ¼ �0:65, NS).
D. de Waard et al. / Safety Science xxx (2003) xxx–xxx 7
ARTICLE IN PRESS
The focus of tests is on the following effects: main effect of age group, main effect
of instruction (60/100 km/h), effect of road appearance (section).
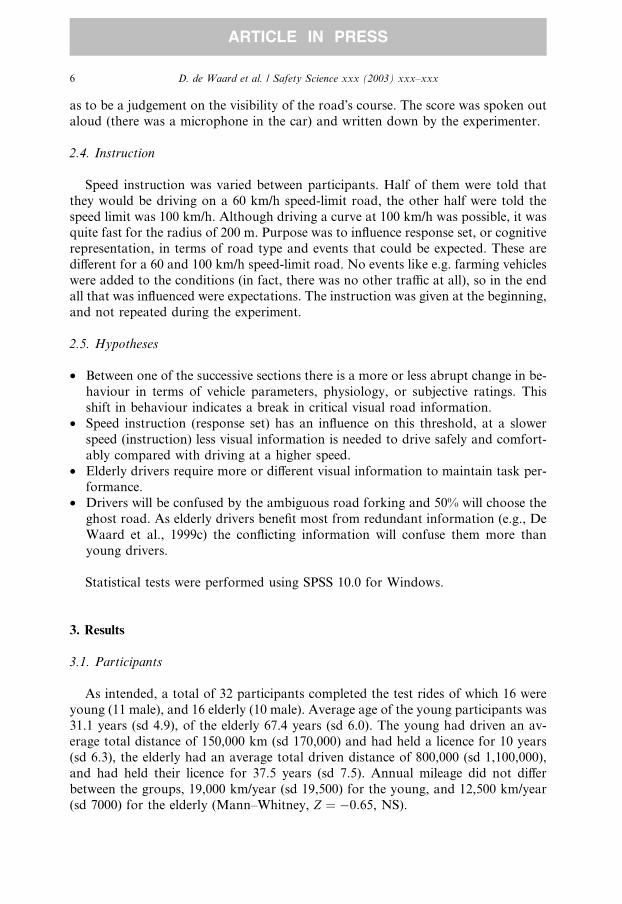
3.2. Speed
In Fig. 3 the average speed per group, instruction and section is displayed. In-
struction had a significant effect on speed choice (F ð1; 28Þ ¼ 21:1, p < 0:001). Veryclearly visible is the effect of age group (F ð1; 28Þ ¼ 7:62, p ¼ 0:010) and the inter-
action between instruction and age group (F ð1; 28Þ ¼ 5:01, p ¼ 0:033). Young
drivers drove faster, especially after the instruction that the road was a 100 km/h
speed-limit road. Linear trend analyses over road appearance was marginally sig-
nificant (F ð1; 28Þ ¼ 3:99, p ¼ 0:056). Pairwise comparisons (corrected for multiple
comparisons: least significant difference) showed that the ‘‘lamppost’’ condition
differed significantly from all other conditions, but note that drivers drove slower on
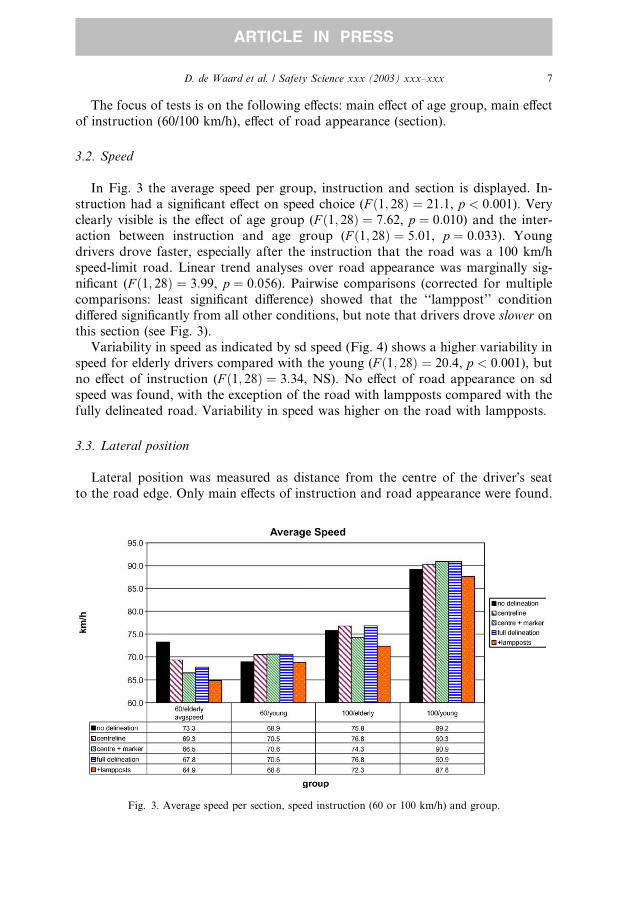
this section (see Fig. 3).Variability in speed as indicated by sd speed (Fig. 4) shows a higher variability in
speed for elderly drivers compared with the young (F ð1; 28Þ ¼ 20:4, p < 0:001), butno effect of instruction (F ð1; 28Þ ¼ 3:34, NS). No effect of road appearance on sd
speed was found, with the exception of the road with lampposts compared with the
fully delineated road. Variability in speed was higher on the road with lampposts.
3.3. Lateral position
Lateral position was measured as distance from the centre of the driver�s seat
to the road edge. Only main effects of instruction and road appearance were found.
Fig. 3. Average speed per section, speed instruction (60 or 100 km/h) and group.
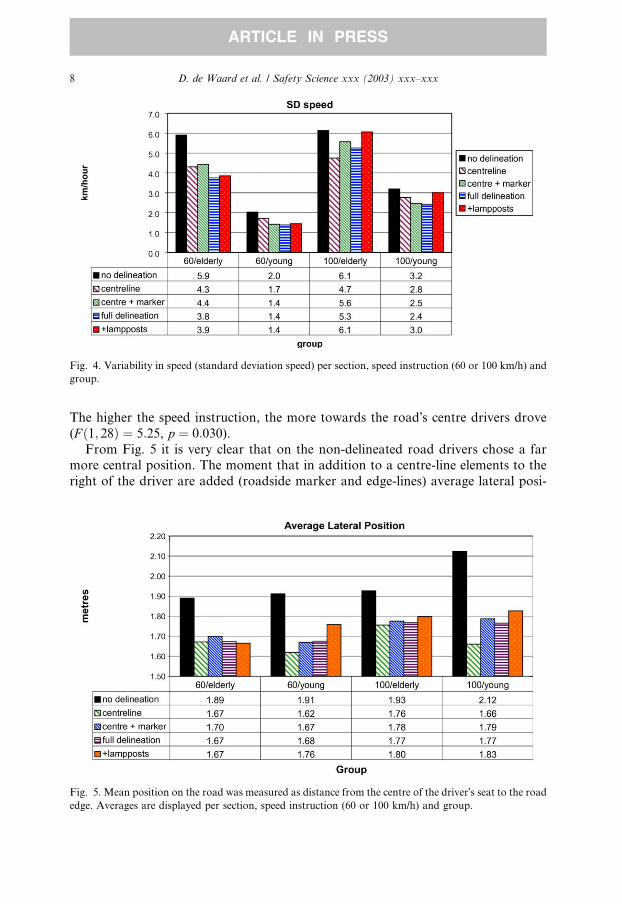
Fig. 4. Variability in speed (standard deviation speed) per section, speed instruction (60 or 100 km/h) and
group.
8 D. de Waard et al. / Safety Science xxx (2003) xxx–xxx
ARTICLE IN PRESS
The higher the speed instruction, the more towards the road�s centre drivers drove
(F ð1; 28Þ ¼ 5:25, p ¼ 0:030).From Fig. 5 it is very clear that on the non-delineated road drivers chose a far
more central position. The moment that in addition to a centre-line elements to the
right of the driver are added (roadside marker and edge-lines) average lateral posi-
Fig. 5. Mean position on the road was measured as distance from the centre of the driver�s seat to the road
edge. Averages are displayed per section, speed instruction (60 or 100 km/h) and group.
D. de Waard et al. / Safety Science xxx (2003) xxx–xxx 9
ARTICLE IN PRESS
tion is further away from the road edge compared with the centre-lined road.
Pairwise comparisons show a significant difference between all road appearance
conditions with the exception of the comparison between the centre + roadside
marker vs. completely delineated road.
SD lateral position (SDLP), a measure of vehicle swerving on the road, is not
different between groups nor is it different as a result of instruction (Fig. 6). Road
appearance, however, does have an effect on SDLP. Especially on the non-delineated
road SDLP is very high. All road appearance conditions differ from each other whencompared pairwise, again with the exception of the comparison between the cen-
tre + roadside marker vs. completely delineated road. Trend analyses on road ap-
pearance reveal a square trend (F ð1; 28Þ ¼ 31:2, p < 0:001).
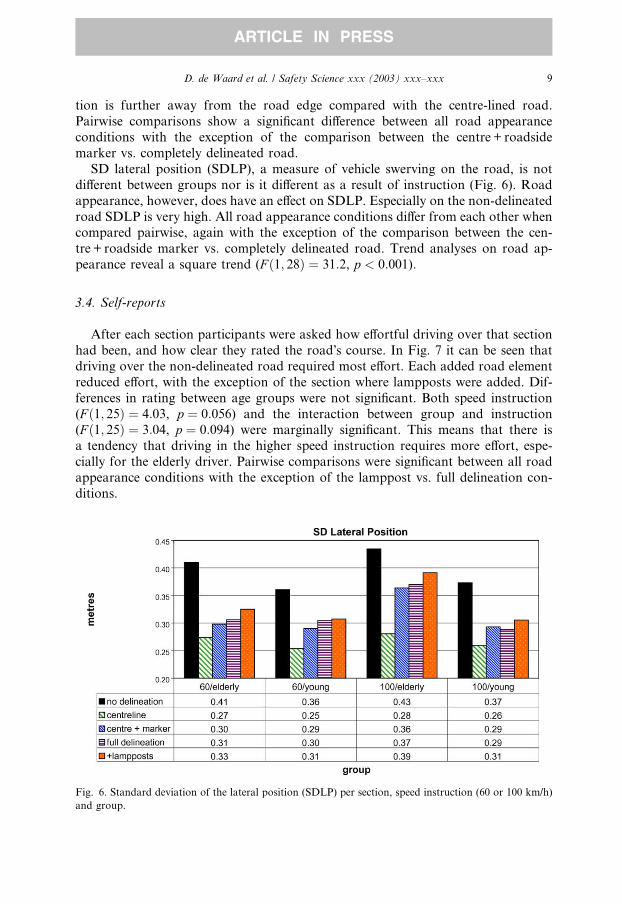
3.4. Self-reports
After each section participants were asked how effortful driving over that section
had been, and how clear they rated the road�s course. In Fig. 7 it can be seen that
driving over the non-delineated road required most effort. Each added road element
reduced effort, with the exception of the section where lampposts were added. Dif-
ferences in rating between age groups were not significant. Both speed instruction
(F ð1; 25Þ ¼ 4:03, p ¼ 0:056) and the interaction between group and instruction(F ð1; 25Þ ¼ 3:04, p ¼ 0:094) were marginally significant. This means that there is
a tendency that driving in the higher speed instruction requires more effort, espe-
cially for the elderly driver. Pairwise comparisons were significant between all road
appearance conditions with the exception of the lamppost vs. full delineation con-
ditions.
Fig. 6. Standard deviation of the lateral position (SDLP) per section, speed instruction (60 or 100 km/h)
and group.
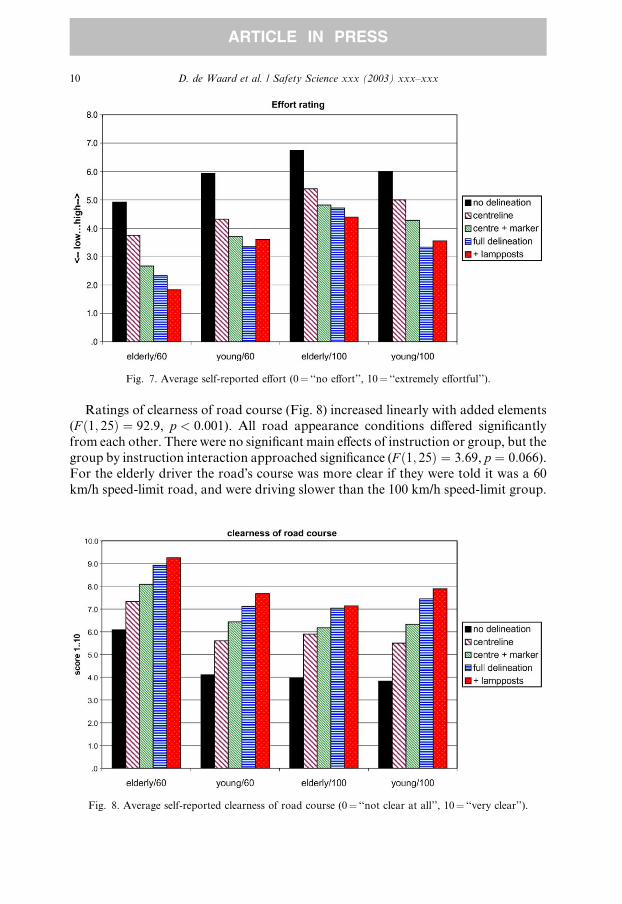
Fig. 7. Average self-reported effort (0¼ ‘‘no effort’’, 10¼ ‘‘extremely effortful’’).
10 D. de Waard et al. / Safety Science xxx (2003) xxx–xxx
ARTICLE IN PRESS
Ratings of clearness of road course (Fig. 8) increased linearly with added elements
(F ð1; 25Þ ¼ 92:9, p < 0:001). All road appearance conditions differed significantly
from each other. There were no significant main effects of instruction or group, but the
group by instruction interaction approached significance (F ð1; 25Þ ¼ 3:69, p ¼ 0:066).For the elderly driver the road�s course was more clear if they were told it was a 60
km/h speed-limit road, and were driving slower than the 100 km/h speed-limit group.
Fig. 8. Average self-reported clearness of road course (0¼ ‘‘not clear at all’’, 10¼ ‘‘very clear’’).
D. de Waard et al. / Safety Science xxx (2003) xxx–xxx 11
ARTICLE IN PRESS
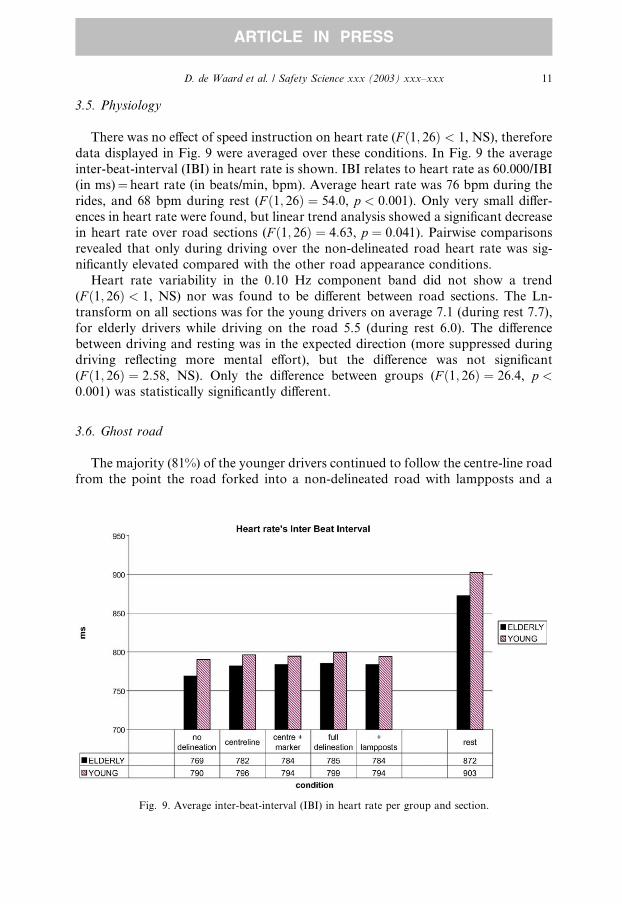
3.5. Physiology
There was no effect of speed instruction on heart rate (F ð1; 26Þ < 1, NS), therefore
data displayed in Fig. 9 were averaged over these conditions. In Fig. 9 the average
inter-beat-interval (IBI) in heart rate is shown. IBI relates to heart rate as 60.000/IBI
(in ms)¼ heart rate (in beats/min, bpm). Average heart rate was 76 bpm during the
rides, and 68 bpm during rest (F ð1; 26Þ ¼ 54:0, p < 0:001). Only very small differ-
ences in heart rate were found, but linear trend analysis showed a significant decreasein heart rate over road sections (F ð1; 26Þ ¼ 4:63, p ¼ 0:041). Pairwise comparisons
revealed that only during driving over the non-delineated road heart rate was sig-
nificantly elevated compared with the other road appearance conditions.
Heart rate variability in the 0.10 Hz component band did not show a trend
(F ð1; 26Þ < 1, NS) nor was found to be different between road sections. The Ln-
transform on all sections was for the young drivers on average 7.1 (during rest 7.7),
for elderly drivers while driving on the road 5.5 (during rest 6.0). The difference
between driving and resting was in the expected direction (more suppressed duringdriving reflecting more mental effort), but the difference was not significant
(F ð1; 26Þ ¼ 2:58, NS). Only the difference between groups (F ð1; 26Þ ¼ 26:4, p <0:001) was statistically significantly different.
3.6. Ghost road
The majority (81%) of the younger drivers continued to follow the centre-line road
from the point the road forked into a non-delineated road with lampposts and a
Fig. 9. Average inter-beat-interval (IBI) in heart rate per group and section.
12 D. de Waard et al. / Safety Science xxx (2003) xxx–xxx
ARTICLE IN PRESS
centre-line delineated road (see snapshot Fig. 2). Fifty percent of the elderly took the
non-delineated road, and 50% followed the centre-line delineated road.
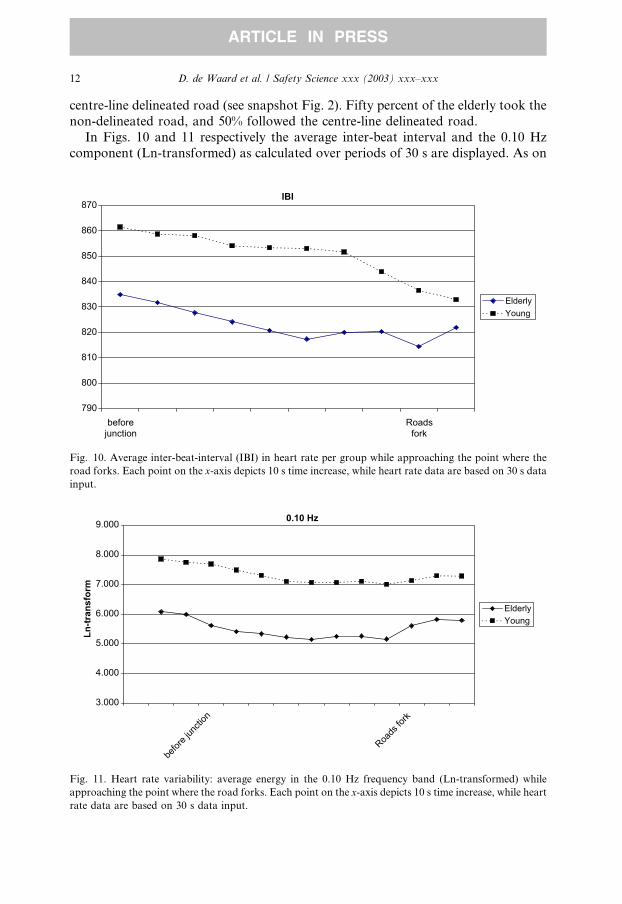
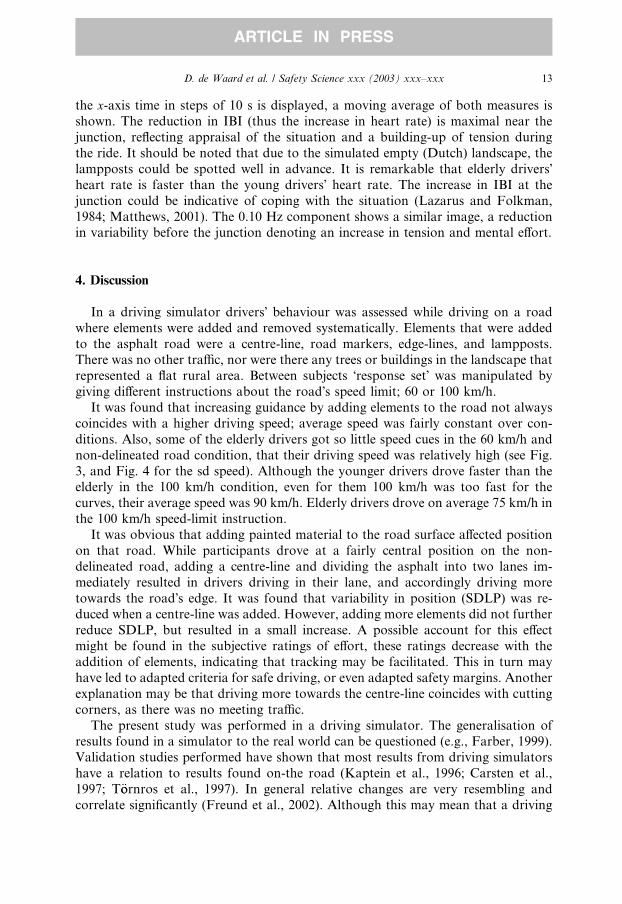
In Figs. 10 and 11 respectively the average inter-beat interval and the 0.10 Hz
component (Ln-transformed) as calculated over periods of 30 s are displayed. As on
IBI
790
800
810
820
830
840
850
860
870
beforejunction
Roadsfork
ElderlyYoung
Fig. 10. Average inter-beat-interval (IBI) in heart rate per group while approaching the point where the
road forks. Each point on the x-axis depicts 10 s time increase, while heart rate data are based on 30 s data
input.
0.10 Hz
3.000
4.000
5.000
6.000
7.000
8.000
9.000
befor
e jun
ction
Roads
fork
Ln-tr
ansf
orm
ElderlyYoung
Fig. 11. Heart rate variability: average energy in the 0.10 Hz frequency band (Ln-transformed) while
approaching the point where the road forks. Each point on the x-axis depicts 10 s time increase, while heart
rate data are based on 30 s data input.
D. de Waard et al. / Safety Science xxx (2003) xxx–xxx 13
ARTICLE IN PRESS
the x-axis time in steps of 10 s is displayed, a moving average of both measures is
shown. The reduction in IBI (thus the increase in heart rate) is maximal near the
junction, reflecting appraisal of the situation and a building-up of tension during
the ride. It should be noted that due to the simulated empty (Dutch) landscape, the
lampposts could be spotted well in advance. It is remarkable that elderly drivers�heart rate is faster than the young drivers� heart rate. The increase in IBI at the
junction could be indicative of coping with the situation (Lazarus and Folkman,
1984; Matthews, 2001). The 0.10 Hz component shows a similar image, a reductionin variability before the junction denoting an increase in tension and mental effort.
4. Discussion
In a driving simulator drivers� behaviour was assessed while driving on a road
where elements were added and removed systematically. Elements that were added
to the asphalt road were a centre-line, road markers, edge-lines, and lampposts.There was no other traffic, nor were there any trees or buildings in the landscape that
represented a flat rural area. Between subjects �response set� was manipulated by
giving different instructions about the road�s speed limit; 60 or 100 km/h.
It was found that increasing guidance by adding elements to the road not always
coincides with a higher driving speed; average speed was fairly constant over con-
ditions. Also, some of the elderly drivers got so little speed cues in the 60 km/h and
non-delineated road condition, that their driving speed was relatively high (see Fig.
3, and Fig. 4 for the sd speed). Although the younger drivers drove faster than theelderly in the 100 km/h condition, even for them 100 km/h was too fast for the
curves, their average speed was 90 km/h. Elderly drivers drove on average 75 km/h in
the 100 km/h speed-limit instruction.
It was obvious that adding painted material to the road surface affected position
on that road. While participants drove at a fairly central position on the non-
delineated road, adding a centre-line and dividing the asphalt into two lanes im-
mediately resulted in drivers driving in their lane, and accordingly driving more
towards the road�s edge. It was found that variability in position (SDLP) was re-duced when a centre-line was added. However, adding more elements did not further
reduce SDLP, but resulted in a small increase. A possible account for this effect
might be found in the subjective ratings of effort, these ratings decrease with the
addition of elements, indicating that tracking may be facilitated. This in turn may
have led to adapted criteria for safe driving, or even adapted safety margins. Another
explanation may be that driving more towards the centre-line coincides with cutting
corners, as there was no meeting traffic.
The present study was performed in a driving simulator. The generalisation ofresults found in a simulator to the real world can be questioned (e.g., Farber, 1999).
Validation studies performed have shown that most results from driving simulators
have a relation to results found on-the road (Kaptein et al., 1996; Carsten et al.,
1997; T€oornros et al., 1997). In general relative changes are very resembling and
correlate significantly (Freund et al., 2002). Although this may mean that a driving
14 D. de Waard et al. / Safety Science xxx (2003) xxx–xxx
ARTICLE IN PRESS
speed of 100 km/h in the simulator does not have to lead to exactly the same speed
on the real road, it does mean that if a decrease of e.g. 20% in speed in the simulator
is found a similar speed reduction can be expected in the real world. The relative
change is the same. Also, in the simulator similar physiological responses as one
finds in the real world have been registered (e.g., De Waard et al., 1999a,b).
Taking all measures into account, the conclusion must be that if there is a shift in
driving behaviour between two delineation conditions, it coincides with the change
from the non-delineated to the centre-line road conditions. Lateral position controlchanges, average heart rate changes, and subjective ratings change. At least some
information on the road surface seems to be required to drive constant and com-
fortably. Another remarkable condition is the road where lampposts were added.
Although drivers indicate that the road�s course is more clear, it did not lead to
reduced effort, reduced swerving (SDLP), or increased speed. Actually speed de-
creased, while variability in speed increased. After the rides it turned out that
opinion about this condition differed between participants, some disliked the pres-
ence of the lampposts very much while others appreciated the preview on the road�scourse. Driving speed differs between the two (age) groups; elderly drivers drive
slower, but they vary more in speed. Also, when they are implicitly requested to drive
faster (by being told that the road has a speed limit of 100 km/h) this leads to higher
levels of subjective effort compared with the young drivers. The fact that effects on
physiology of the different conditions were only found on average heart rate and not
on heart rate variability are likely to be related to restriction of range of sensitivity of
this measure (see, e.g., De Waard and Brookhuis, 1997).
In the ghost road scenario it was studied if and how visually distinct road elementscan affect expectations about road course. Although the ‘‘straight-on’’ centre-lined
road was not interrupted, the lampposts were visually dominantly present in a way
that that road could be perceived as the main road. Elderly drivers were more
confused than young drivers, and 50% of them took the ambiguous road.
This may be interpreted as an age-related difficulty to disentangle ambiguous
environmental cues. The interpretation of these findings can be embedded in visual
search and visual distraction research. For instance, in experiments with distracting
flanker characters, Zeef and Kok (1993) found that elderly people had more difficultyto ignore the interference from incompatible distracters. Furthermore, Zeef et al.
(1996) found that the distraction by flankers was more pronounced when the flankers
were more similar to the target (i.e., more ambiguity). This effect was largest for the
elderly.
Other studies report that elderly more than young participants are unable to sup-
press saccades to a suddenly appearing stimulus in the peripheral visual field (Nie-
uwenhuis et al., 2000), or have difficulty in switching task goals (De Jong, 2001).
Findings in this respect are related to age-induced reduction in goal generation andgoal maintenance (see for an in-depth discussion, De Jong, 2001). While these findings
came from highly artificial laboratory situations, the present study gives some support
from the more natural (although highly controlled) task situation of car driving.
The heart rate data were also quite revealing and show a building up of tension
and stress, and a relief after it was over. This relief can especially be seen in the
D. de Waard et al. / Safety Science xxx (2003) xxx–xxx 15
ARTICLE IN PRESS
elderly driver group (which was the group who took the ‘‘wrong’’ road more often).
It is important to note that visually ambiguous situations can confuse drivers, and
can lead to hesitant behaviour, perhaps even resulting in dangerous behaviour.
5. Conclusions
The main shift in behaviour with respect to critical visual information is betweenthe non-delineated and centre-line delineated roads. This is comparable to the
minimal line contrast requirements by McKnight et al. (1998). Speed instruction has
not been found to have an influence on this threshold, although older drivers drive
slower to enable processing of all information. Some visual information such as
lampposts may actually be more distracting for elderly drivers than that it helps
them, it seems preferable for them to regulate visual input by adapting their driving
speed. Elderly drivers were indeed more often confused by the ambiguous road.
Acknowledgements
This study was commissioned by the Dutch Ministry of Transport (Transporta-
tion Research Centre AVV). We would like to thank Ton van de Brink of the
Ministry, and Ipe Veling and Jolieke Mesken of Traffic Test for their contributions
to the study.
References
Aasman, J., Mulder, G., Mulder, L.J.M., 1987. Operator effort and the measurement of heart-rate
variability. Human Factors 29, 161–170.
Alexander, G.J., Lunenfeld, H., 1986. Driver expectancy in highway design and traffic operations. Report
FHWA-TO-86-1, US Department of Transportation, Washington, DC.
Backs, R.W., Seljos, K.A., 1994. Metabolic and cardiorespiratory measures of mental effort: the effects of
level of difficulty in a working memory task. International Journal of Psychophysiology 16, 57–68.
Brookhuis, K.A., De Vries, G., De Waard, D., 1991. The effects of mobile telephoning on driving
performance. Accident Analysis and Prevention 23, 309–316.
Carsten, O.M.J., Groeger, J.A., Blana, E., Jamson, A.H., 1997. Driver performance in the EPSRC driving
simulator: a validation study. Final report to EPSRC Contract No. GR/K56162, University of Leeds,
Leeds, UK.
De Jong, R., 2001. Adult age differences in goal activation and goal maintenance. European Journal of
Cognitive Psychology 13, 71–89.
De Waard, D., 1991. Driving behaviour on a high-accident-rate motorway in the Netherlands. In:
Weikert, C., Brookhuis, K.A., Ovinius, S. (Eds.), Man in Complex Systems, Proceedings of the Europe
Chapter of the Human Factors Society Annual Meeting, Work Science Bulletin 7. Work Science
Division, Department of Psychology, Lund University, Lund, Sweden, pp. 113–123.
De Waard, D., Brookhuis, K.A., 1997. On the measurement of driver mental workload. In: Rothengatter,
J.A., Carbonell Vaya, E. (Eds.), Traffic and Transport Psychology. Theory and application. Pergamon,
Oxford, pp. 161–171.
16 D. de Waard et al. / Safety Science xxx (2003) xxx–xxx
ARTICLE IN PRESS
De Waard, D., Jessurun, M., Steyvers, F.J.J.M., Raggatt, P.T.F., Brookhuis, K.A., 1995. Effect of road
layout and road environment on driving performance, drivers� physiology and road appreciation.
Ergonomics 38, 1395–1407.
De Waard, D., Van der Hulst, M., Hoedemaeker, M., Brookhuis, K.A., 1999a. Driver behavior in an
emergency situation in the automated highway system. Transportation Human Factors 1, 67–82.
De Waard, D., Van der Hulst, M., Hoedemaeker, M., Brookhuis, K.A., 1999b. Reply to comments on
‘‘Driver behavior in an emergency situation in the automated highway system’’. Transportation
Human Factors 1, 87–89.
De Waard, D., Van der Hulst, M., Brookhuis, K.A., 1999c. Elderly and young drivers� reaction to an in-
car enforcement and tutoring system. Applied Ergonomics 30, 147–157.
Fairclough, S.H., Ashby, M.C., Parkes, A.M., 1993. In-vehicle displays, visual workload and usability
evaluation. In: Gale, A.G., Brown, I.D., Haslegrave, C.M., Kruysse, H.W., Taylor, S.P. (Eds.), Vision
in Vehicles IV. North-Holland, Amsterdam, pp. 245–254.
Farber, E.I., 1999. Comments on ‘‘Driver behavior in an emergency situation in the automated highway
system’’. Transportation Human Factors 1, 83–85.
Freund, B., Gravenstein, S., Ferris, R., Shaheen, E., 2002. Evaluating driving performance of cognitively
impaired and healthy older adults: a pilot study comparing on-road testing and driving simulation.
Journal of the American Geriatrics Society 50, 1309–1310.
Godley, S.T., Fildes, B.N., Triggs, T.J., Brown, L.J., 1999. Perceptual countermeasures: experimental
research. CR 182, Australian Transport Safety Bureau, Canberra.
Goodman, M.J., Tijerina, L., Bents, F.D., Wierwille, W.W., 1999. Using cellular phones in vehicles: safe
or unsafe? Transportation Human Factors 1, 3–42.
Kallberg, V., 1993. Reflector posts––signs of danger. Transportation Research Record 1403, 57–66.
Kantowitz, B.H., Simsek, O., 2001. Secondary-task measures of driver workload. In: Hancock, P.A.,
Desmond, P.A. (Eds.), Stress, Workload and Fatigue. Lawrence Erlbaum Associates, Mahwah, NJ,
USA, pp. 395–408.
Kaptein, N.A., Theeuwes, J., Van der Horst, A.R.A., 1996. Driving simulator validity: some
considerations. Transportation Research Record 1550, 30–36.
Kramer, A.F., 1991. Physiological metrics of mental workload: a review of recent progress. In: Damos,
D.L. (Ed.), Multiple-Task Performance. Taylor & Francis, London, pp. 279–328.
Lamble, D., Kauranen, T., Laakso, M., Summala, H., 1999. Cognitive load and detection thresholds in
car following situations: safety implications for using (cellular) telephones while driving. Accident
Analysis and Prevention 31, 617–623.
Land, M., Horwood, J., 1996. The relation between head and eye movements during driving. In: Gale,
A.G., Brown, I.D., Haslegrave, C.M., Taylor, S.P. (Eds.), Vision in Vehicles V. Elsevier, Amsterdam,
The Netherlands, pp. 153–160.
Landwehr, K., 1991. Optical guidance revisited. In: Gale, A.G., Brown, I.D., Haslegrave, C.M.,
Moorhead, I., Taylor, S.P. (Eds.), Vision in Vehicles III. Elsevier, Amsterdam, The Netherlands, pp.
187–194.
Lazarus, R.S., Folkman, S., 1984. Stress, Appraisal, and Coping. Springer, New York.
Matthews, G., 2001. A transactional model of driver stress. In: Hancock, P.A., Desmond, P.A. (Eds.),
Stress, Workload and Fatigue. Lawrence Erlbaum Associates, Mahwah, NJ, USA, pp. 133–163.
McKnight, A.S., McKnight, A.J., Tippetts, A.S., 1998. The effect of lane line width and contrast upon
lanekeeping. Accident Analysis and Prevention 30, 617–624.
Mulder, L.J.M., 1992. Measurement and analysis methods of heart rate and respiration for use in applied
environments. Biological Psychology 34, 205–236.
Mulder, G., Mulder, L.J.M., 1981. Information processing and cardiovascular control. Psychophysiology
18, 392–402.
Nieuwenhuis, S., Ridderinkhof, K.R., De Jong, R., Kok, A., Van der Molen, M., 2000. Inhibitory
inefficiency and failures of intention activation: age-related decline in the control of saccadic eye
movements. Psychology and Aging 15, 635–647.
OECD, 1990. Behavioural adaptations to changes in the road transport system. Organisation for
Economic Co-operation and Development, Paris, France.
D. de Waard et al. / Safety Science xxx (2003) xxx–xxx 17
ARTICLE IN PRESS
Richter, P., Wagner, T., Heger, R., Weise, G., 1998. Psychophysiological analysis of mental load during
driving on rural roads––a quasi-experimental field study. Ergonomics 41, 593–609.
Riemersma, J.B.J., 1979. The perception of deviations from a straight course. Report IZF-1979-C6, TNO
Human Factors, Soesterberg, The Netherlands.
Steyvers, F.J.J.M., 1999. Increasing safety by removing visual cues––a contradiction? In: Gale, A.E.,
Brown, I.D., Haslegrave, C.M., Taylor, S.P. (Eds.), Vision in Vehicles VII. Elsevier, Amsterdam, pp.
301–310.
Steyvers, F.J.J.M., de Waard, D., 2000. Road-edge delineation in rural areas: effects on driving behaviour.
Ergonomics 43, 223–238.
Summala, H., Nieminen, T., Punto, M., 1996. Maintaining lane position with peripheral vision during in-
vehicle tasks. Human Factors 38, 442–451.
Taylor, J.I., McGee, H.W., Sequin, E.L., Hostetter, R.S., 1972. Roadway delineation systems. National
cooperative highway research program report 130, Highway Research Board, Washington, DC.
Tenkink, E., 1988. Determinanten van rijsnelheid [Determinants of driving speed]. Report IZF-1988-C3,
TNO Human Factors, Soesterberg, The Netherlands.
T€oornros, J., Harms, L., Alm, H., 1997. The VTI driving simulator validation studies. Report VTI s€aartryck
279, VTI, Link€ooping, Sweden.
Van Roon, A.M., 1998. Short-term cardiovascular effects of mental tasks. Physiology, experiments and
computer simulation. Ph.D. Thesis, University of Groningen. Groningen, The Netherlands.
Van Wolffelaar, P.C., Van Winsum, W., 1995. Traffic simulation and driving simulation––an integrated
approach. In: Proceedings of the Driving Simulator Conference (DSC �95). Teknea, Toulouse, France.Verwey, W.B., 2000. On-line driver workload estimation. Effects of road situation and age on secondary
task measures. Ergonomics 43, 187–209.
Vicente, K.J., Thornton, D.C., Moray, N., 1987. Spectral analysis of sinus arrhythmia: a measure of
mental effort. Human Factors 29, 171–182.
Willis, P.A., Scott, P.P., Barnes, J.W., 1984. Road edgelining and accidents: an experiment in South–West
England. TRRL Report 1117, Transport and Road Research Laboratory, Crowthorn, Berkshire, UK.
Yagar, S., Van Aerde, M., 1983. Geometric and environmental effects on speeds on 2-lane rural roads.
Transportation Research Record 17A (4), 315.
Zeef, E.J., Kok, A., 1993. Age-related differences in the timing of stimulus and response processes during
visual selective attention: performance and psychophysiological analysis. Psychophysiology 30, 138–
151.
Zeef, E.J., Sonke, C.J., Kok, A., Buiten, M.M., Kenemans, J.L., 1996. Perceptual factors affecting age-
related differences in focused attention: performance and psychophysiological analysis. Psychophy-
siology 33, 555–565.
Related Documents