HOW MUCH DO SMALL OLD AGE PENSIONS AND WIDOWS’ PENSIONS HELP THE POOR IN INDIA? An ex-post evaluation of the National Social Assistance Programme and implications for its planned reform Christopher Garroway September 2013 DEVELOPMENT PAPERS 1306 South and South-West Asia Oce ESCAP SOUTH AND SOUTH-WEST ASIA OFFICE

Welcome message from author
This document is posted to help you gain knowledge. Please leave a comment to let me know what you think about it! Share it to your friends and learn new things together.
Transcript
HOW MUCH DO SMALL OLD AGE PENSIONSAND WIDOWS’ PENSIONS HELP THE POOR IN INDIA?
An ex-post evaluation of the National Social Assistance Programme and implications for its planned reform
Christopher GarrowaySeptember 2013
DEVELO
PMEN
T PAPERS 1306
South and South-West Asia O!ce
ESCAP
SOUTH AND SOUTH-WEST ASIA
OFFICE


How much do small old age pensions and widow’s pensions help the poor in India?
An ex-post evaluation of the National Social Assistance Programme and implications for its planned reform
Christopher Garroway1
ABSTRACT
The National Social Assistance Programme consists of five social assistance transfers, which form the core of India’s fledgling minimum social protection floor. These transfers have been scaled up over the last decade and further steps will soon be taken towards their universalization with exclusion criteria. This paper provides a rigorous evaluation of two of the NSAP schemes, the old age pension and the widow’s pension. Using the 2005 Indian Human Development Survey data’s detailed information on household income and consumption expenditure, the paper measures the impact of the two pensions on household’s incomes, consumption and poverty status, using the propensity score matching estimator. The pensions are found to vary in their effectiveness given the wide diversity of recipients across income quintiles, spatial location, and social group. The widow’s pension is shown to reduce poverty among recipients by about 2.7 percentage points. Government attempts to target the pensions to poor households have been ineffective, and steps towards universalization may in fact improve the pensions’ effectiveness.
1 The author is an economist with the United Nations ESCAP South and South-West Asia Office in New Delhi, India. The views expressed in this paper are those of the author and should not necessarily be considered as reflecting the views or carrying the endorsement of the United Nations of any of its Member States. This paper describes current research in progress by the author and is aimed to elicit comments and to further debate. All mistakes remain the responsibility of the author. Author’s email address is [email protected] and mailing address is First Floor, APCTT Building, C-2 Qutab Institutional Area, New Delhi, 110016, INDIA. This paper was originally prepared for the India Human Development Survey User Conference organized by National Council for Applied Economic Research and University of Maryland in New Delhi, India in June 2013. The author is grateful to valuable comments received from conference participants, in particular John Blomquist, Sonalde Desai, Rinku Murgai, Johannes Urpelainen, and Reeve Vanneman.

Table of Contents I. Introduction: A fledgling minimum social protection floor in India .................................. 7
II. Historical background of social assistance in India and the NSAP ..................................... 8
III. Data and Methods: The Indian Human Development Survey and the propensity score matching estimator ............................................................................................................. 10
IV. Analysis and discussion of results: The widow’s pension reduces poverty .................. 16
V. Conclusions .................................................................................................................. 25
References .......................................................................................................................... 27


7
The king shall enforce the laws of discipline among members of a family, slaves and persons mortgaged.
He shall maintain, at state expense, children, the old, and destitute, those suffering from adversity, childless women and the children of destitute women. The village elders shall act as trustees of temple property and the inheritance of minors (till they come of age).
Kautilya’s Arthashastra, 2.1.25-261
I. Introduction: A fledgling minimum social protection floor in India India’s social protection system is currently undergoing an important series of changes commensurate with the country’s recent growth and poverty reduction experience. As growth has slowed somewhat following the global financial crisis, Government and other observers have increasingly begun to realize the important role that social policy can play in building a strong and resilient economy. For example, the well-known Mahatma Gandhi National Rural Guarantee Act (MGNGREGA) has been shown to not only provide a safety net for workers who can’t find work elsewhere, but has also been shown to have significant impacts on rural wages beyond the program, as well as on the propensity of rural inhabitants to migrate looking for work. (Imbert and Papp, 2012; Dutta, Murgai, Ravallion and van der Walle, 2012) Many of Government’s other flagship schemes have also been scaled up, and increasingly Government is taking steps to unify the many disparate social schemes into a coherent nationwide framework. These efforts harness modern technologies and aim to deliver social protection more efficiently and with an eye on improving the countries human and physical capital. The Aadhaar universal identification number scheme is a key recent government initiative at improving the targeted uptake of a wide variety of schemes by making eligibility requirements subject to a single universal database for social protection schemes. Taken together, these recent advances hint at the increasingly comprehensive nature of social protection systems in India, in line with international standards on what constitute a minimum social protection floor. (Srivastava, forthcoming) Overall, the country is enjoying increased understanding of the role social policy can play and the importance of universalizing access by citizens to various social development schemes.
India’s National Social Assistance Programme (NSAP) is an important central government scheme which is perhaps less well-known than the well-publicized MGNREGA employment guarantee or the Aadhaar smart card/universal ID. It is however an equally important pillar of India’s nascent minimum social protection floor. NSAP encompasses a series of welfare measures whose stated objective is to provide public assistance to people living in poverty in case of old age, sickness, widowhood, disability or death of a family member. Unlike MGNREGA, which is a statutory livelihood security scheme mandated by law, NSAP is not governed by legislation. Instead, it is a government initiative aimed at fulfilling India’s obligations to its citizens under the Indian constitution’s directive principles. The NSAP was first instituted in August 1995 and has since expanded and undergone a number of changes in how it is implemented. The program initially focused solely on an old-age pension, a widow’s pension, and a death benefit. Over the years it has been expanded to include disability benefits and motherhood benefits, and the amounts awarded under the various pensions, while still fairly small in size, have
1 As translated in L.N. Rangarajan’s 1992 [1987} edition, p. 156.
8
increased over time, as well. Overall the amounts that the Central government apportions to the scheme consequently have increased as well. In March 2013, a Task Force convened by the Ministry of Rural Development presented its report, entitled “Proposal for Comprehensive National Assistance Programme,” which discusses the importance of the scheme. The report recommends that, given its importance for securing livelihoods of people living in deprivation, Government ought to scale up the NSAP both in terms of coverage and in terms of the amount of benefits received. While the NSAP is targeted to poor households, the Proposal (Government of India, 2013) also recommends taking steps towards universalization of some aspects of the program (a.k.a. “universalization with some exclusion criteria”) to ensure that it reaches more of the people it intends to help.
Although centrally financed, the NSAP’s implementation and amount of benefits, as well as presumably its impact, varies from state to state. The Programme is currently implemented through transfers of central funds to state governments who administer the schemes, determine eligibility, and deliver the various transfers to recipients. State governments are also asked to match or even to more than double the token amounts allocated by the Centre for each pension payment. The general consensus among Indian public policy analysts, supported by anecdotal evidence, is that the pension schemes are more effective in Southern states, such as Tamil Nadu, Kerala, Karnataka, and Andhra Pradesh, where government pensions have a longer history and tend to be perceived more positively.
This paper is one of the first attempts to quantify in a rigourous manner the impacts that the NSAP programme has had on the livelihoods of Indians living in poverty. It presents new evidence about the effectiveness of the program, but also suggests further steps for research on how scaling up the NSAP can best deliver quality social protection in India that both prevents households from falling into poverty, but which also promotes households out of poverty as well. In Section 2 we examine the details of the programme, recount important background information about NSAP and social assistance in general in India, and describe government plans to scale up the program and make it a centerpiece of India’s minimum social protection floor. Section 3 describes the data used for this analysis, which includes the 2005 Indian Human Development Survey, and explains the econometric methods used to empirically assess the effectiveness of the program, namely the propensity score matching estimator. Section 4 presents the analysis and discusses the results of the empirical estimation of the effects of treatment on the treated. Section 5 concludes.
II. Historical background of social assistance in India and the NSAP Social assistance has long been a public policy concern in India. The obligation of the state to maintain the most vulnerable segments of society was first recorded In the 3nd century BC by the famous Kautilya (also known as Chanakya), a semi-legendary advisor to Chandragupta Maurya, first emperor to unite the entire subcontinent politically. In his authoritative treatise on government, the Arthashastra, Kautilya describes how state expenses should be used to take care of those who are less fortunate, specifically “children, the old, and destitute, those suffering from adversity, childless women and the children of destitute women.” (Kautilya, 1992[1987]). Since 1950, the directive principles of the Indian constitution have called on the state “to secure a social order for the promotion of welfare of the people”. Article 41

9
requires the state to provide public assistance to its citizens in case of unemployment, old age, sickness, disability or “other cases of undeserved want”:
The State shall, within the limits of its economic capacity and development, make effective provision for securing the right to work, to education and to public assistance in cases of unemployment, old age, sickness and disablement, and in other cases of undeserved want.
Article 41, Constitution of India
Interestingly, this directive principle, originally written in 1949, coincides closely with current international notions of a “minimum social protection floor,” which in the aftermath of the 2008-9 financial crisis have gained endorsement by the United Nations and its various agencies, including the ILO and the WHO. In the aftermath of the global financial crisis, it is increasingly acknowledged that social protection programs play more than simply a protection role by helping preventing people from falling into poverty or exclusion. In fact, it is increasingly recognized that social protection schemes also play a valuable promotion role, helping strengthen human capital in the country, improve productivity, and reduce damaging social costs. Social protection’s instrumental value is thereby gaining in prominence, and countries like India are scaling up certain key social protection programmes, like NSAP, accordingly.
There is a widespread literature evaluating the poverty reduction potential of old age pensions and widow’s pensions in large developing countries, including Case and Deaton (1998) and Duflos (2002) who have looked at old age pensions in South Africa, or Kassouf and de Oliveira (2012) and Barrientos et al on Brazil. Sinha and Yoong (2009) have looked at cash transfers in India. Ajwad (2007), Dutta, Howes, and Murgai (2010), and World Bank (2011) have looked specifically at pensions in India. Very little work otherwise has been done on Indian pensions. This is due to a variety of reasons. First, the NSAP has only been around at the Central level since the mid-1990s and has only been scaled up in the recent half-decade or so. Secondly, some of the populations targeted by the scheme, such as elderly persons, are not considered among the most vulnerable populations in the country, given other pressing social problems like widespread informal and vulnerable employment. Aging is not an issue of great immediate concern to India compared with other developed and developing countries. In fact, India’s biggest population-related concern is rather the so-called “demographic bulge” of young people who are entering the labor force currently and will continue to expand the active population well into the 2030s. If sufficient employment opportunities aren’t found for this significant bulge of workers, then India will squander its opportunity to realize the so-called “demographic dividend” which many other countries enjoyed during their development process.
Given the current plans to scale up the NSAP, the scheme’s successes and failings can provide important insights on a number of crucial issues that the expanding Indian social protection system needs to address. One major concern is the ongoing debate on the effectiveness of various types of ration cards, and the so-called BPL census (Drèze and Khera, 2009), as a means to identify and target eligible households for various social programmes. Another issue is the degree to which cash, rather than in-kind, transfers can prevent households falling into poverty and help promote them out of poverty. Finally, as Government considers scaling up India’s pensions, it is important to have quantitative

10
measures of how effective a poverty reduction tool they are, and how their potential expansion might help or hinder social policy objectives.
III. Data and Methods: The Indian Human Development Survey and the propensity score matching estimator Measuring the impact of the National Social Assistance Programme’s as a livelihood security mechanism requires a nationally representative household survey with detailed data on household living standards. This means both data on income including transfers such as pension receipts, etc, but also data on consumption expenditure and poverty status, as well as detailed demographic data and other relevant eligibility criteria. The most common and well documented household survey data used for measuring household welfare in India is the National Sample Survey, which has been used extensively to measure the impact of other livelihood security programs, such as MGNREGA. However, to evaluate the National Social Assistance Programme, which aims at supporting household incomes, the NSS is not the preferred choice, as it doesn’t have detailed household income data on pension receipts. Despite a smaller sample size than the NSS, the Indian Human Development Survey (Desai, et al., 2009) has detailed household income data, including income received from pension programs like NSAP. The IHDS was conducted in its current form in 20052 and is in the public domain. A new round of the IHDS data covering 2011-12 is expected to be released next year.
In the IHDS sample of 215,754 individuals, 3239 individuals receive some kind of cash transfer from government, or NGOs. The vast majority of these transfers are through the five National Social Assistance Programme schemes, which count 2966 individual recipients from 2600 households in the sample alone, more than 1.4% of the entire sample of individuals and 6.3% of all households. The survey does provide data on specific transfers corresponding directly with all five NSAP schemes, as shown in Table 1. Nonetheless given the limited sample size and the survey date, the survey also presents some problems for conducting a comprehensive assessment of the NSAP. The present analysis will thus focus mainly on the two most widely reported pension benefits in the survey—the old age pension and the widow’s pension, given their widespread nature.
The old age pension was received by 1,520 individuals in the survey compared with 16,483 individuals who were over the age of 59 years. Indeed, national eligibility in 2005 was actually 65, but some states by that time were already giving the pension to individuals aged 60 and older, so we compare with elderly persons in the larger age group so as to build a comparable control group. Indeed more than 25% of recipients are actually younger than 60 according to the IHDS data, reflecting variation both in individual state policies, but also variation in implementation of the existing policies.
The widow’s pension was received by 772 individuals in the survey compared with 7255 individuals whom also were identified as widows in the survey, but who did not receive the pension. Eligibility for the widow pensions in 2005 actually required that widows be at least 40 years old to receive the
2 Some of the rural households surveyed in the 2005 IHDS were also interviewed for the 1993 Human Development Profile of India conducted by the National Council for Applied Economic Research, so some limited panel analysis can be conducted using the two surveys.

11
pensions. This is actually one of the key eligibility criteria for NSAP that the new March 2013 proposal aims to relax. The Ministry of Rural Development currently proposes that eligibility be extended not only to widows of all ages, but also to all female heads of household. At the time of the 2005 survey, eligibility was technically limited to widows at least 40 years old and older in most states. However, 11.55% of the recipients of the widow pension in the survey actually were less than 40 years old due to differences in state specific age requirements and implementation issues. Figures 1A and 1B show the age distribution of the recipients of the two pensions.
Table 1. Mean annual benefit amounts (Rs) for NSAP schemes vary by state*, 2005
Old age pension Widow's pension
Maternity benefit
Disability benefit Annapurna
Mean S.E. Mean S.E. Mean S.E. Mean S.E. Mean S.E. Jammu & Kashmir 1363 368 1667 398
3600 .
Himachal Pradesh 2302 31 2252 33 1000 . 2151 118 1019 19 Uttarakhand 1369 84 1329 63 500 . 250 .
Punjab 1421 97 1503 191
1997 386 100 . Haryana 2134 53 2517 111 500 . 2672 277
Delhi 1957 303 1350 743
100 0 Uttar Pradesh 1657 150 1525 166 478 14 1333 106 679 74 Bihar 956 80 821 123 500 0 710 158 306 41 Jharkhand 1778 649 1200 0 500 0 1200 . 813 150 Rajasthan 2189 134 2001 135
2077 240 1529 128
Chhattisgarh 1759 28 1632 109 402 51 1351 379 567 129 Madhya Pradesh 1655 67 1528 96 200 . 1688 112
Northeast 1294 158 1293 200 500 0
950 0 Assam 1146 248
700 .
West Bengal 1109 94 1921 411
6000 . 301 105 Orissa 1217 10 1228 28 467 25 1003 127 1428 172 Gujarat 2031 389 2151 470
655 181
Maharashtra, Goa 2716 293 2720 388 212 36 2620 415 268 46 Andhra Pradesh 1612 216 1082 218 504 42 633 202 528 88 Karnataka 1063 43 1006 45 700 273 1279 111 659 180 Kerala 985 102 1471 205
879 180 511 171
Tamil Nadu 2186 117 2292 148 2817 1056 1908 640 260 70 N observations 1520 772 116 165 457
*As shown in the table, some states were combined for ease of calculation.
12
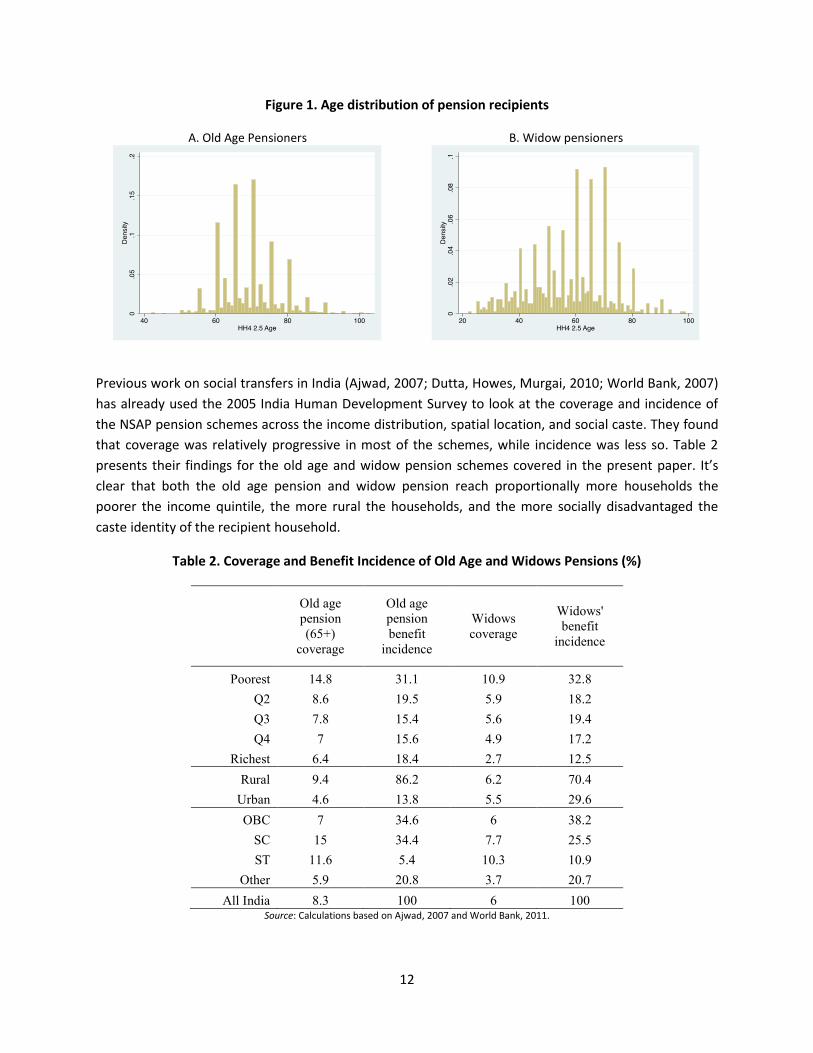
Figure 1. Age distribution of pension recipients
A. Old Age Pensioners B. Widow pensioners
Previous work on social transfers in India (Ajwad, 2007; Dutta, Howes, Murgai, 2010; World Bank, 2007) has already used the 2005 India Human Development Survey to look at the coverage and incidence of the NSAP pension schemes across the income distribution, spatial location, and social caste. They found that coverage was relatively progressive in most of the schemes, while incidence was less so. Table 2 presents their findings for the old age and widow pension schemes covered in the present paper. It’s clear that both the old age pension and widow pension reach proportionally more households the poorer the income quintile, the more rural the households, and the more socially disadvantaged the caste identity of the recipient household.
Table 2. Coverage and Benefit Incidence of Old Age and Widows Pensions (%)
Old age pension (65+)
coverage
Old age pension benefit
incidence
Widows coverage
Widows' benefit
incidence
Poorest 14.8 31.1 10.9 32.8 Q2 8.6 19.5 5.9 18.2 Q3 7.8 15.4 5.6 19.4 Q4 7 15.6 4.9 17.2
Richest 6.4 18.4 2.7 12.5 Rural 9.4 86.2 6.2 70.4
Urban 4.6 13.8 5.5 29.6 OBC 7 34.6 6 38.2
SC 15 34.4 7.7 25.5 ST 11.6 5.4 10.3 10.9
Other 5.9 20.8 3.7 20.7 All India 8.3 100 6 100
Source: Calculations based on Ajwad, 2007 and World Bank, 2011.

13
The benefit incidence of the schemes was less progressive however, particularly with respect to the old age pension. As shown in Table 2, although the poorest quintile receives nearly one-third of total old age benefits, the richest quintile receives more than the middle three quintiles, i.e. nearly one-fifth of total old age benefits. In terms of incidence across social caste, the situation is even more regressive for the old age pension, with the largest amount of benefits received by other backward castes, rather than scheduled castes or scheduled tribes. High caste recipients of the old age pension receive more than one-fifth of benefits. The widow’s pension is more progressive than the old age pension, but again more of the widows pension benefits go to high caste individuals than tribals, for example. This uneven distribution of benefits suggests that the targeting of the scheme may not be effective in identifying the poorest of the vulnerable groups..
To examine these issues and explore how effective the NSAP is in providing livelihood security to the vulnerable populations it aims to help, this paper uses the IHDS’s household income and consumption expenditure data. The outcomes of interest used to measure household livelihoods are total household income, income per capita, consumption expenditure per capita and poverty status. In the IHDS data, poverty status is measured by an indicator set equal to one if the individual’s household consumption expenditure per capita is below the state-specific poverty line.
Figure 2. Change in consumption expenditure per capita and household incomes due to all National
Social Assistance Programme transfers % change between pre-transfer and post-transfer consumption expenditure per capita and household income
A. Consumption expenditure per capita
Full sample
B. Household income per capita Full sample
14
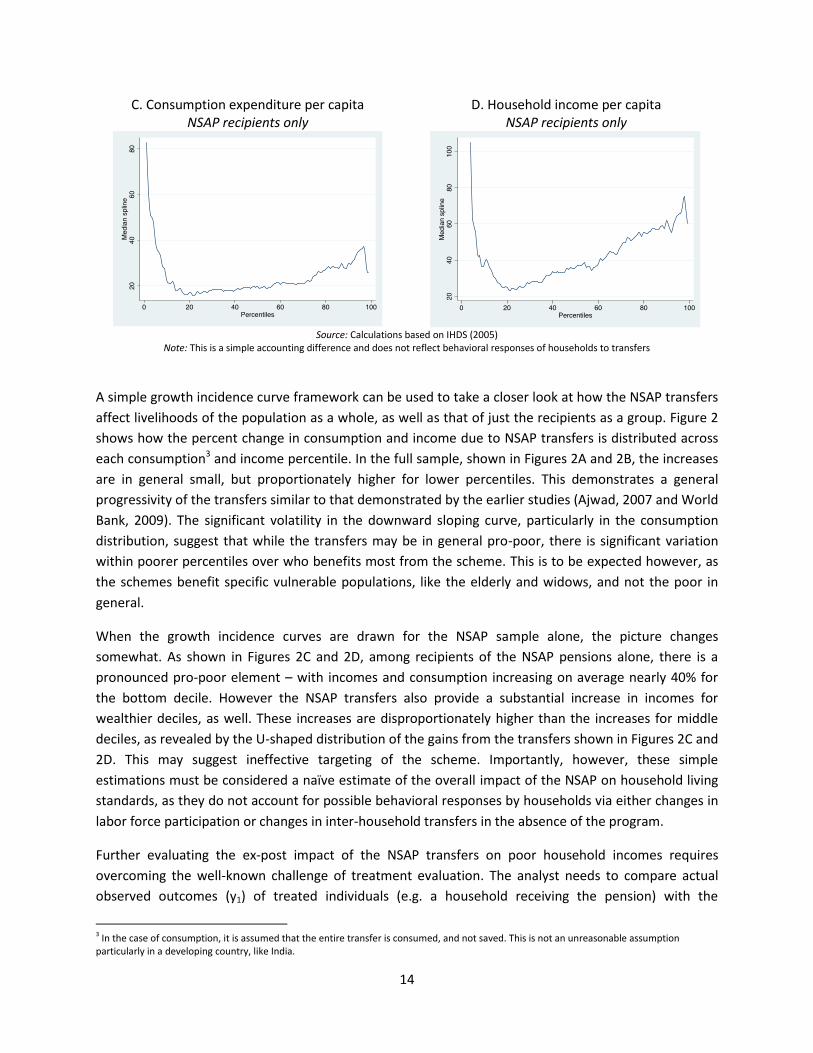
C. Consumption expenditure per capita NSAP recipients only
D. Household income per capita NSAP recipients only
Source: Calculations based on IHDS (2005)
Note: This is a simple accounting difference and does not reflect behavioral responses of households to transfers
A simple growth incidence curve framework can be used to take a closer look at how the NSAP transfers affect livelihoods of the population as a whole, as well as that of just the recipients as a group. Figure 2 shows how the percent change in consumption and income due to NSAP transfers is distributed across each consumption3 and income percentile. In the full sample, shown in Figures 2A and 2B, the increases are in general small, but proportionately higher for lower percentiles. This demonstrates a general progressivity of the transfers similar to that demonstrated by the earlier studies (Ajwad, 2007 and World Bank, 2009). The significant volatility in the downward sloping curve, particularly in the consumption distribution, suggest that while the transfers may be in general pro-poor, there is significant variation within poorer percentiles over who benefits most from the scheme. This is to be expected however, as the schemes benefit specific vulnerable populations, like the elderly and widows, and not the poor in general.
When the growth incidence curves are drawn for the NSAP sample alone, the picture changes somewhat. As shown in Figures 2C and 2D, among recipients of the NSAP pensions alone, there is a pronounced pro-poor element – with incomes and consumption increasing on average nearly 40% for the bottom decile. However the NSAP transfers also provide a substantial increase in incomes for wealthier deciles, as well. These increases are disproportionately higher than the increases for middle deciles, as revealed by the U-shaped distribution of the gains from the transfers shown in Figures 2C and 2D. This may suggest ineffective targeting of the scheme. Importantly, however, these simple estimations must be considered a naïve estimate of the overall impact of the NSAP on household living standards, as they do not account for possible behavioral responses by households via either changes in labor force participation or changes in inter-household transfers in the absence of the program.
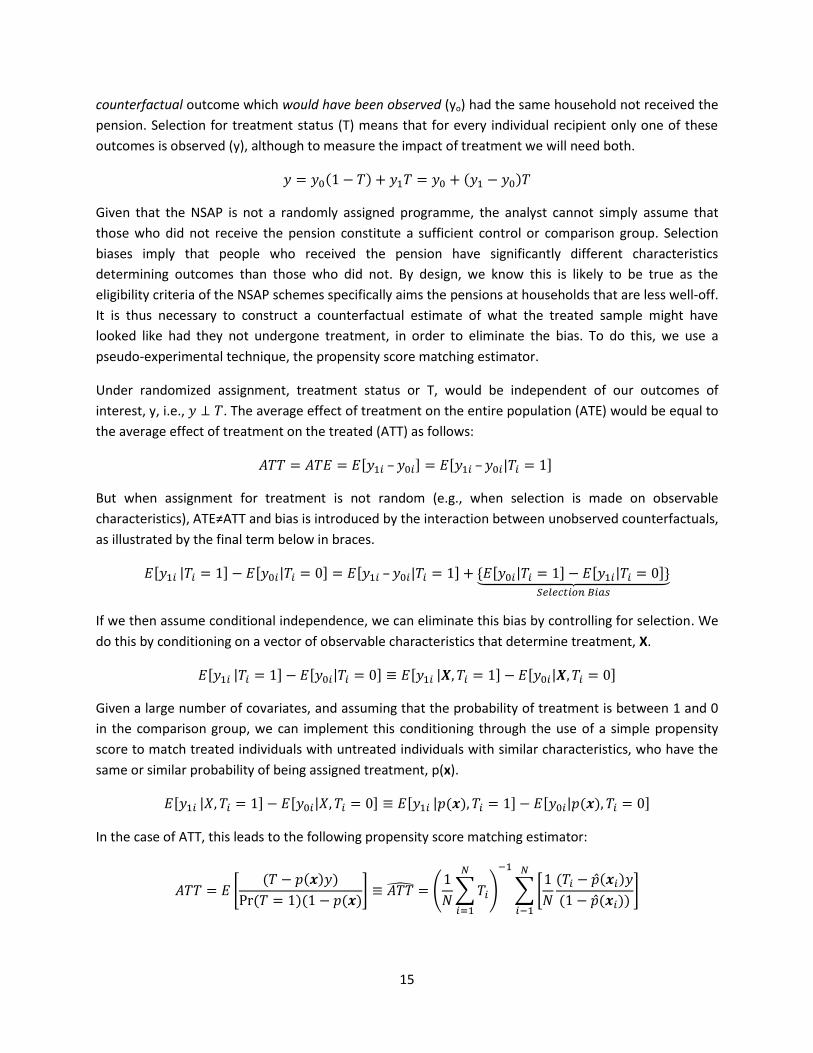
Further evaluating the ex-post impact of the NSAP transfers on poor household incomes requires overcoming the well-known challenge of treatment evaluation. The analyst needs to compare actual observed outcomes (y1) of treated individuals (e.g. a household receiving the pension) with the
3 In the case of consumption, it is assumed that the entire transfer is consumed, and not saved. This is not an unreasonable assumption particularly in a developing country, like India.
15
counterfactual outcome which would have been observed (yo) had the same household not received the pension. Selection for treatment status (T) means that for every individual recipient only one of these outcomes is observed (y), although to measure the impact of treatment we will need both.
𝑦 = 𝑦 (1 − 𝑇) + 𝑦 𝑇 = 𝑦 + (𝑦 − 𝑦 )𝑇
Given that the NSAP is not a randomly assigned programme, the analyst cannot simply assume that those who did not receive the pension constitute a sufficient control or comparison group. Selection biases imply that people who received the pension have significantly different characteristics determining outcomes than those who did not. By design, we know this is likely to be true as the eligibility criteria of the NSAP schemes specifically aims the pensions at households that are less well-off. It is thus necessary to construct a counterfactual estimate of what the treated sample might have looked like had they not undergone treatment, in order to eliminate the bias. To do this, we use a pseudo-experimental technique, the propensity score matching estimator.
Under randomized assignment, treatment status or T, would be independent of our outcomes of interest, y, i.e., 𝑦 ⊥ 𝑇. The average effect of treatment on the entire population (ATE) would be equal to the average effect of treatment on the treated (ATT) as follows:
𝐴𝑇𝑇 = 𝐴𝑇𝐸 = 𝐸[𝑦 – 𝑦 ] = 𝐸[𝑦 – 𝑦 |𝑇 = 1]
But when assignment for treatment is not random (e.g., when selection is made on observable characteristics), ATE≠ATT and bias is introduced by the interaction between unobserved counterfactuals, as illustrated by the final term below in braces.
𝐸[𝑦 |𝑇 = 1] − 𝐸[𝑦 |𝑇 = 0] = 𝐸[𝑦 – 𝑦 |𝑇 = 1] + {𝐸[𝑦 |𝑇 = 1] − 𝐸[𝑦 |𝑇 = 0]}
If we then assume conditional independence, we can eliminate this bias by controlling for selection. We do this by conditioning on a vector of observable characteristics that determine treatment, X.
𝐸[𝑦 |𝑇 = 1] − 𝐸[𝑦 |𝑇 = 0] ≡ 𝐸[𝑦 |𝑿, 𝑇 = 1] − 𝐸[𝑦 |𝑿, 𝑇 = 0]
Given a large number of covariates, and assuming that the probability of treatment is between 1 and 0 in the comparison group, we can implement this conditioning through the use of a simple propensity score to match treated individuals with untreated individuals with similar characteristics, who have the same or similar probability of being assigned treatment, p(x).
𝐸[𝑦 |𝑋, 𝑇 = 1] − 𝐸[𝑦 |𝑋, 𝑇 = 0] ≡ 𝐸[𝑦 |𝑝(𝒙), 𝑇 = 1] − 𝐸[𝑦 |𝑝(𝒙), 𝑇 = 0]
In the case of ATT, this leads to the following propensity score matching estimator:
𝐴𝑇𝑇 = 𝐸(𝑇 − 𝑝(𝒙)𝑦)
Pr (𝑇 = 1)(1 − 𝑝(𝒙) ≡ 𝐴𝑇𝑇 =1𝑁 𝑇
1𝑁(𝑇 − �̂�(𝒙 )𝑦(1 − �̂�(𝒙 ))

16
Where 𝑁 ∑ 𝑇 is a consistent estimator of Pr[T=1], the true probability of treatment, and the estimated probability of being treated conditional on observables �̂�(𝒙 ) is estimated using a standard binary response model, i.e. a probit or logit regression. ATT thus compares mean outcomes for individuals who in reality received treatment to the estimated mean outcomes if these same individuals had instead received the control. Consequently, the ATE will compare the estimated mean outcome if the entire potentially eligible population had received treatment to the estimated mean outcome if entire potentially eligible population were in the control group.
Intuitively, a vector of covariates was selected from the IHDS data and tested to determine probability of being treated for each potentially eligible elderly person and widow. Then each treated individual was matched (using replacement) with a potentially eligible individual (or several individuals) with similar probability of treatment. The treated group was then compared with the specially constructed comparison sample to give an unbiased estimate of the average effect of the pension transfer on pension transfer recipients, the ATT. To estimate the ATE the comparison sample is widened to include for each untreated individual a matched treated individual as well, and the average difference is taken over the entire population of potentially eligible, not just the treated. In this way, the ATE gives us some idea of the potential impact of the program on the entire targeted population as a whole.
IV. Analysis and discussion of results: The widow’s pension reduces poverty To model participation in the old age and widows pensions, a binary indicator equaling one for pension participation and zero for all other potentially eligible non participants was regressed on a vector of household and individual characteristics from the IHDS data. This permitted estimation of the probability of treatment for all potentially eligible individuals conditional on characteristics observed in the survey. This analysis was conducted independently both for all elderly and all widows. The selected covariates thus aim to model not the ideal targeting envisioned by the programme design, but the actual process that determined participation, in reality.
Indeed, targeting of the NSAP old age and widows pensions relies on an imperfect identification process to determine whether an elderly person or widow is suitably disadvantaged in order to deserve a pension. In principle, possession of a ration card is needed to obtain a pension. Ration card eligibility itself looks at a variety of individual characteristics to determine eligibility. Households having a certain set of given characteristics are deemed eligible for one of several ration cards, which can be used for access to various social benefits. The main method for identifying these characteristics has been the so-called “Below Poverty Line” or BPL census4. This is a census conducted nationally by the Ministry of Rural Development, which seeks to identify poor households by a number of inclusion and exclusion 4 While the official poverty lines in India used by the Planning Commission are drawn based on caloric norms associated with consumption expenditures for a given basket of goods, the BPL census actually includes a much broader group of characteristics, including type of dwelling, ownership of certain durable goods, caste status, etc. In principal, the rationale for this broader approach is that the BPL cards, more than the poverty lines themselves, should take a very broad view of who is poor in order not to exclude deserving households.

17
characteristics. At first, NSAP did not use the BPL census data/ ration card system, however in 2003 following the last BPL census it was recommended that these ration cards be used as a proxy for eligibility for the NSAP program.
Table 3. Descriptive statistics of Old Age pension sample Mean values or share of population as applicable
Old age pension
recipients
Other elderly
Non-elderly
Number of adults in HH 3.41 3.80 3.23 Urban residence 0.15 0.31 0.34
Highest education in HH 5.96 8.35 7.81 Household asset index 10.97 12.93 12.37
Landowners 0.43 0.53 0.45 HH receives remittances 0.05 0.07 0.04
HH has flush toilet 0.16 0.28 0.25 Dalit 0.31 0.17 0.20
Adivasi 0.08 0.06 0.08 Muslim 0.04 0.10 0.13
Sikh or Jain 0.02 0.02 0.02 Christian 0.02 0.02 0.01
Has BPL card 0.41 0.30 0.31 Has APL card 0.45 0.57 0.51
Has Antodaya card 0.06 0.02 0.02 Female 0.55 0.49 0.49
Completed years of schooling 1.03 2.92 4.85 Any work? 0.34 0.40 0.42
Families bond together to solve local problems 0.68 0.57 0.58
Feels life is getting better 0.38 0.50 0.50 Uses PDS 0.53 0.69 0.64
Confidence in panchayat 0.81 0.80 0.79 Confidence in state gov't 0.73 0.76 0.76
Has medical professional in social network 0.28 0.36 0.32
Has school official in social network 0.32 0.44 0.41 Has gov't official in social network 0.29 0.37 0.35
Women listen to radio 0.34 0.53 0.52 Women read newspaper 0.21 2.42 0.74
Women watch TV 0.89 3.73 1.59 Friend or family is panchayat official 0.11 0.10 0.11
Belongs to a youth club 0.04 0.06 0.05 Belong to union/business org. 0.03 0.05 0.05
Belongs to self-help group 0.10 0.10 0.09 Belongs to credit/savings group 0.08 0.07 0.07
Belongs to religious org. 0.09 0.16 0.15 Belongs to caste association 0.09 0.14 0.13 Belongs to Mahila Mandal 0.08 0.07 0.07
Voted in 2004 election 0.91 0.91 0.90 Member of NGO 0.01 0.02 0.02
Attends public meetings 0.31 0.30 0.30 N observations 1495 15996 194320

18
Table 4. Descriptive Statistics of Widow’s pension sample Mean values or share of population as applicable
Widow's pension
recipients
Other widows Non-widows
Number of adults in HH 2.72 3.16 3.28 Urban residence 0.25 0.35 0.34
Highest education in HH 5.61 7.58 7.86 Household asset index 9.67 12.34 12.42
Time family has been in this place 79.97 75.86 72.83 Landowners 0.45 0.44 0.46
HH receives remittances 0.04 0.07 0.05 School fees paid by government 0.12 0.10 0.12
Engages in wage labour 0.47 0.30 0.30 HH has flush toilet 0.16 0.27 0.25
Dalit 0.28 0.20 0.20 Adivasi 0.10 0.07 0.08 Muslim 0.07 0.10 0.13
Sikh or Jain 0.01 0.02 0.02 Christian 0.01 0.02 0.01
Has BPL card 0.45 0.34 0.31 Has APL card 0.36 0.49 0.52
Has Antodaya card 0.09 0.03 0.02 Completed years of schooling 1.05 1.73 4.80
Any work 0.51 0.33 0.42 Families bond together to solve
local problems 0.58 0.59 0.58
Feels life is getting better 0.37 0.46 0.51 Uses PDS 0.75 0.68 0.64
Confidence in panchayat 0.36 0.33 0.34 Confidence in state gov't 0.76 0.76 0.76
Has medical professional in social network 0.24 0.32 0.33
Has school official in social network 0.34 0.40 0.42
Has gov't official in social network 0.24 0.34 0.35 Women listen to radio 0.38 0.49 0.52
Women read newspaper 0.22 0.45 0.88 Women watch TV 0.87 1.17 1.77
Friend or family is panchayat official 0.11 0.11 0.13
Belongs to a youth club 0.05 0.06 0.05 Belong to union/business org. 0.04 0.06 0.05
Belongs to self-help group 0.15 0.11 0.09 Belongs to credit/savings group 0.05 0.08 0.07
Belongs to religious org. 0.09 0.14 0.15 Belongs to caste association 0.11 0.13 0.14 Belongs to Mahila Mandal 0.11 0.08 0.07
Voted in 2004 election 0.91 0.91 0.90 Member of NGO 0.01 0.02 0.02
Attends public meetings 0.33 0.26 0.30 N observations 764 7364 203683

19
In practice, using the ration card as a proxy for NSAP eligibility is problematic. The problems of the ration card and their procurement are well known. The process of obtaining a ration card is susceptible to elite capture and corruption, and also may implicitly exclude deserving populations through the complexity of the process (Drèze and Khera, 2009). Potential beneficiaries may have to bribe officials or use social connections to obtain a card. The most deprived populations may lack the capacity to provide the documentation needed to register for their card, and will thus be excluded from schemes for which they might otherwise be eligible.
Possession of a ration card thus featured among the covariates selected for the logit regressions, but many other household and individual characteristics were used as well. The mean values for the selected variables are shown in Tables 3 and 4 for pension recipients, potentially eligible non-recipients, and the rest of the population. Selected characteristics included measures of household size, geographic location, and the nature of household and individual assets. A number of covariates measured household and individual economic welfare. These included education status, employment status, a household asset index based on durable goods ownership, whether a household receives remittances, is a landowner, has a flush toilet, benefits from school fees paid by the government, or uses the public distribution system subsidized food program. Social identity characteristics were also used, including religion and caste.
Importantly, a number of covariates were also selected that measure households’ social capital. The IHDS data contains very detailed sociological questions related to how households participate in community life. These include measures of the extent of the household’s social network, membership in different types of organizations and clubs, and confidence in various local, state, and national institutions. In addition there are measures of participation behavior – whether household members vote, attend public meetings, consume media, etc. These social capital variables are useful because they offer insight into how the households access community and state services. As described above, given the imperfect targeting mechanism implicit in the BPL census and ration card procurement practices, an individual with higher levels of social capital may have an easier time gaining access to the NSAP pension. This could be due to legitimate reasons, such as better awareness of social services, but also could be due to less savory circumstances, including corrupt practices. Importantly, as shown in Tables 3 and 4, some of these social capital variables vary sizably between participants and potentially eligible non-participants, suggesting that greater levels of social capital do indeed influence participation in the pension programmes.
An additional set of covariates used in the regressions, but not summarized in Table 3 and Table 4 were binary indicators for the various Indian states. As shown in the previous section in Table 1, the amount and coverage of the pensions differ significantly across states. This is because different states implement the centrally-sponsored program differently, but also may be due to different social contexts in how social programs are accessed in different states, particularly among socially excluded households.
The regression results for a logistic regression on the two samples are provided in Table 5. Table 5 confirms the significance of many of the determinants of probability of old age and widow pension receipt described above. As expected, possession of a BPL or Antodaya ration card significantly
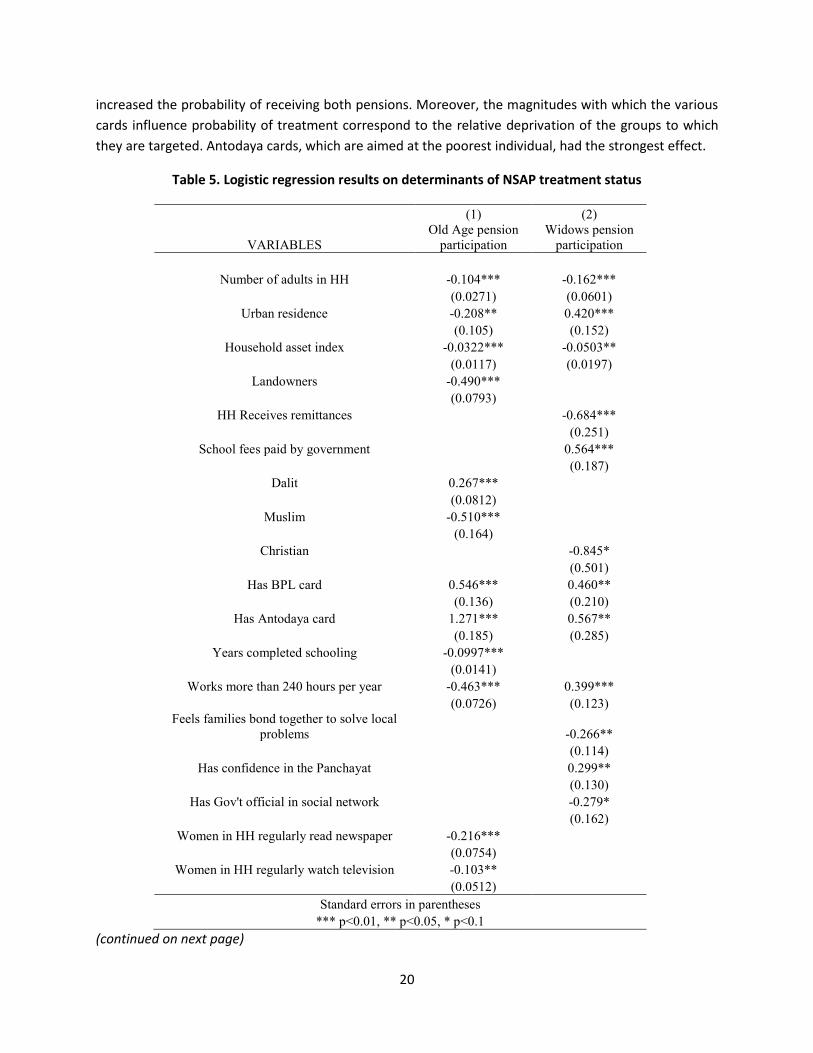
20
increased the probability of receiving both pensions. Moreover, the magnitudes with which the various cards influence probability of treatment correspond to the relative deprivation of the groups to which they are targeted. Antodaya cards, which are aimed at the poorest individual, had the strongest effect.
Table 5. Logistic regression results on determinants of NSAP treatment status
(1) (2)
VARIABLES Old Age pension
participation Widows pension
participation
Number of adults in HH -0.104*** -0.162***
(0.0271) (0.0601)
Urban residence -0.208** 0.420***
(0.105) (0.152)
Household asset index -0.0322*** -0.0503**
(0.0117) (0.0197)
Landowners -0.490***
(0.0793)
HH Receives remittances
-0.684***
(0.251)
School fees paid by government
0.564***
(0.187)
Dalit 0.267***
(0.0812)
Muslim -0.510***
(0.164)
Christian
-0.845*
(0.501)
Has BPL card 0.546*** 0.460**
(0.136) (0.210)
Has Antodaya card 1.271*** 0.567**
(0.185) (0.285)
Years completed schooling -0.0997***
(0.0141)
Works more than 240 hours per year -0.463*** 0.399***
(0.0726) (0.123)
Feels families bond together to solve local problems
-0.266**
(0.114)
Has confidence in the Panchayat
0.299**
(0.130)
Has Gov't official in social network
-0.279*
(0.162)
Women in HH regularly read newspaper -0.216***
(0.0754)
Women in HH regularly watch television -0.103**
(0.0512)
Standard errors in parentheses *** p<0.01, ** p<0.05, * p<0.1
(continued on next page)

21
Table 5. Logistic regression results (continued from previous page)
(1) (2) VARIABLES Old Age Pension Widows pension
Someone close to/ from HH is panchayat official 0.233**
(0.107) Someone in HH belongs to youth club 0.345**
(0.169)
Someone in HH is member of caste association -0.238*
(0.126) Someone in HH is member of Mahila Mandal 0.286** 0.390*
(0.129) (0.229)
Someone in HH member of NGO -0.922*** -0.932*
(0.331) (0.541)
Someone in HH took part in public meeting 0.181** 0.286*
(0.0783) (0.151)
Himachal Pradesh 1.782*** 3.055***
(0.609) (0.521)
Uttarkhand
1.484**
(0.613)
Punjab 2.390*** 1.279**
(0.606) (0.575)
Haryana 4.640*** 2.846***
(0.598) (0.526)
Delhi NCR 1.419**
(0.711)
Rajasthan 1.044*
(0.605)
Chhattisgarh 1.244**
(0.619)
Northeastern states 2.531***
(0.625)
Orissa 1.925*** 2.112***
(0.600) (0.510)
Andhra Pradesh 1.626***
(0.603)
Karnataka
1.304***
(0.502)
Kerala 1.098*
(0.622)
Constant -2.692*** -2.568***
(0.626) (0.587)
Observations 16,557 7,420 Pseudo R-squared 0.284 0.164
Standard errors in parentheses *** p<0.01, ** p<0.05, * p<0.1
Note: Only significant coefficients in the logit regression are reported above. State coefficients are relative to Jammu & Kashmir. Other variables included in the regression are available from the author by request

22
Most of the demographic variables and the variables capturing economic welfare have the expected sign. Higher levels of economic welfare tend to decrease probability of participation, as one would expect. Membership in disadvantaged groups, doesn’t necessarily increase participation in the pensions, however. Dalits are more likely to participate in the old age pension, but Muslims are less likely, for example. Being an Adivasi has no significant impact on pension participation, as well.
Interestingly, the effect of employment status on participation differed markedly between the two pensions. Having more than 240 hours of work in the year decreased the probability of receiving the old age pension, presumably because older people who don’t work are more likely to be in need of the pension. But working actually increased the probability of receiving the widow’s pension! This is likely due to the fact that many widows may in fact be in a more precarious situation than many older people. Thus needier widows may actually need to work in addition to receiving their pension.
Similarly, urban residents were less likely to receive the old age pension, but more likely to receive the widow’s pension. The higher likelihood of urban widows to receive the pension requires further explanation to determine whether it is due to demand or supply factors. On the one hand, it is conceivable that rural widows may be more likely to live with extended family thereby precluding their need for a pension. On the other hand, it may be the case that rural widows may be more isolated and excluded, and therefore aren’t receiving the pensions that otherwise would be due to them.
Some of the social capital variables were found to significantly lower probability of receiving a pension. Households that felt the community worked together to solve problems, those with government officials in the social network, and those who were members of an NGO actually had significantly lower probability of receiving a widow’s pension. Similarly, households where women read and watched television regularly, as well as households who were members of caste associations and NGOs also had significantly lower likelihood to receive the pension. In many cases, these variables may actually be proxies for greater household wealth, which would reduce the demand and eligibility for a pension.
Other social capital variables were found to facilitate pension participation. These included confidence in the panchayat, close friends or family in the panchayat, membership in youth clubs, membership in a Mahila Mandal women’s association, and participation in a public meeting. These variables are capturing social determinants of how the pension schemes and their eligibility criteria are put into practice in different communities. In fact, if the sample is further broken down by state, the set of these variables found to be significant differs state to state. Those results have not been reported here however, given the smaller sample sizes and the limited representativeness of the IHDS at the state-level.
Given the results of the two separate regressions, probabilities of pension participation could be estimated for all elderly persons and all widows, using the vector of estimated coefficients and observed characteristics of the individuals in both samples. These probabilities were then used to match a suitable comparison group to the treatment group for both samples. The matching algorithm matched observations in the treatment group (pension recipients) to the four “nearest neighbors” with the closest propensity scores in the control group (potentially eligible non-recipients). The weighted average
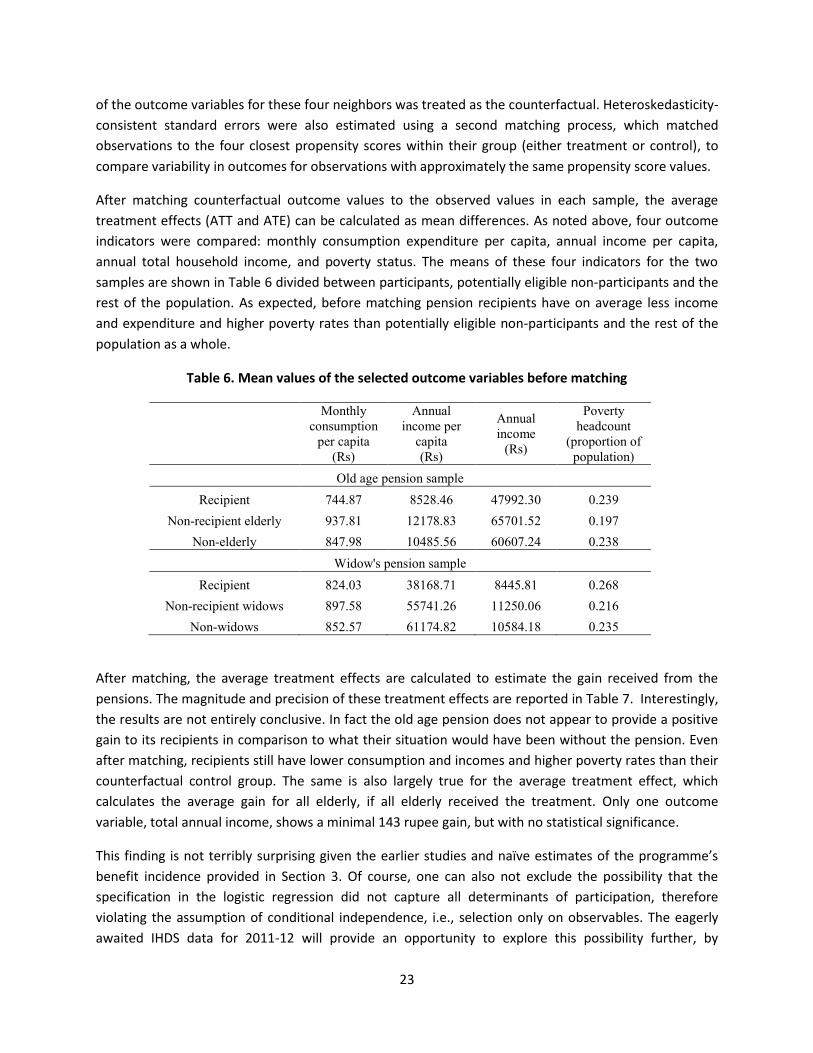
23
of the outcome variables for these four neighbors was treated as the counterfactual. Heteroskedasticity-consistent standard errors were also estimated using a second matching process, which matched observations to the four closest propensity scores within their group (either treatment or control), to compare variability in outcomes for observations with approximately the same propensity score values.
After matching counterfactual outcome values to the observed values in each sample, the average treatment effects (ATT and ATE) can be calculated as mean differences. As noted above, four outcome indicators were compared: monthly consumption expenditure per capita, annual income per capita, annual total household income, and poverty status. The means of these four indicators for the two samples are shown in Table 6 divided between participants, potentially eligible non-participants and the rest of the population. As expected, before matching pension recipients have on average less income and expenditure and higher poverty rates than potentially eligible non-participants and the rest of the population as a whole.
Table 6. Mean values of the selected outcome variables before matching
Monthly consumption
per capita (Rs)
Annual income per
capita (Rs)
Annual income
(Rs)
Poverty headcount
(proportion of population)
Old age pension sample Recipient 744.87 8528.46 47992.30 0.239
Non-recipient elderly 937.81 12178.83 65701.52 0.197 Non-elderly 847.98 10485.56 60607.24 0.238
Widow's pension sample Recipient 824.03 38168.71 8445.81 0.268
Non-recipient widows 897.58 55741.26 11250.06 0.216 Non-widows 852.57 61174.82 10584.18 0.235
After matching, the average treatment effects are calculated to estimate the gain received from the pensions. The magnitude and precision of these treatment effects are reported in Table 7. Interestingly, the results are not entirely conclusive. In fact the old age pension does not appear to provide a positive gain to its recipients in comparison to what their situation would have been without the pension. Even after matching, recipients still have lower consumption and incomes and higher poverty rates than their counterfactual control group. The same is also largely true for the average treatment effect, which calculates the average gain for all elderly, if all elderly received the treatment. Only one outcome variable, total annual income, shows a minimal 143 rupee gain, but with no statistical significance.
This finding is not terribly surprising given the earlier studies and naïve estimates of the programme’s benefit incidence provided in Section 3. Of course, one can also not exclude the possibility that the specification in the logistic regression did not capture all determinants of participation, therefore violating the assumption of conditional independence, i.e., selection only on observables. The eagerly awaited IHDS data for 2011-12 will provide an opportunity to explore this possibility further, by

24
permitting a difference-in-difference approach to evaluating the old age pensions, which does not require assuming selection only on observables.
Table 6. Average treatment effects of old age and widow pensions on recipient household consumption expenditure per capita (Rs), income per capita (Rs), total household income (Rs) and
poverty headcount (share of population)
Average treatment effect on the treated (ATT)
Average treatment effect (ATE)
N observations
Coefficient
Robust standard
error
t-statistic Coefficient
Robust standard
error
t-statistic
Old Age Pension Monthly
consumption per capita
-142.61 22.67 -6.29 -42.91 35.8 1.2 16557
Annual income per capita -1924.069 354.04 -5.43 -1030 540.92 -1.91 16557
Annual income -9076.26 2285.93 -3.97 143.67 3073.59 0.05 16557
Poverty headcount 0.0185 0.0156 1.18 0.044 0.0255 1.72 16557
Widow's Pension Monthly
consumption per capita
-89.63 39.56 -2.27 72.1 33.04 2.18 7420
Annual income per capita -1955.6 967.98 -2.02 623.74 862.71 0.72 7420
Annual income -8223.48 2525.63 -3.26 3545.518 3507.822 1.01 7420
Poverty headcount -0.0268 0.024 -1.12 -0.0358 0.0138 -2.6 7420
The findings for the widow’s pension are more encouraging. The average treatment effect on pension recipients (ATT) is also negative for the consumption and income measures. But the effect on poverty rates for pension recipients does however show a decline in poverty, indicating that while consumption among recipients as a whole may not have increased on average, it did for consumption among poor recipients. Poverty is estimated to decline 2.68 percentage points among pension recipients due to the widow’s pension. The significance of this finding however is rather weak with a t-statistic of only -1.12. The average treatment effects on both recipients and potentially eligible non-recipients as a whole (i.e. ATE) are much more encouraging. Monthly consumption expenditure goes up by more than 70 rupees, constituting an 8% gain. This finding is also statistically significant at the 5% level. The increase of 635 rupees per capita and 3507 rupees total in average household incomes is less plausible however, given the lower levels of statistical significance implied by the estimate. These income gains are of an almost implausible size, since the average widow’s pension amount calculated from the data only amounts to just above 1500 rupees annually. The decline in poverty for all widows of approximately 3.6 percentage
25
points is more plausible, however, as it is linked to the consumption gain, and is statistically significant with a t-statistic of 2.6.
It is interesting that in both pension samples the ATE gains were more positive than the ATT gains. This may be telling in and of itself. Conceptually, the ATE suggests what the pension might give if it were extended to all elderly and all widows. This of course ignores disincentive effects, but as mentioned above given the small size of the pensions they are likely to be small. So if the ATE estimates can be considered indicative of how the pensions might impact on the target populations as a whole, they offer a rough clue as to what universalization, or “universalization with some exclusion criteria” might look like. In particular, given the significant results for the widow’s pension’s impact on consumption and poverty, this offers positive evidence in support of scaling up the pension, as Government plans to do.
V. Conclusions The results presented in this paper demonstrate ex post that in 2005 the widow’s pension, which today makes up part of the National Social Assistance Programme, was a partially effective instrument for significantly improving the livelihoods of the households who received it. The widow’s pension was shown to reduce poverty around 2.7 percentage points among recipients. Furthermore, estimates suggest that if all widows received the pension it would reduce poverty among widows by 3.6 percentage points and increase consumption on average 70 rupees per capita among widows. These gains point to the important role that the Old Age Pension Scheme and the Widow Pension Scheme, as well as the broader National Social Assistance Programme as a whole, can play in protecting vulnerable populations in India, with a relatively small cash layout.
Nonetheless, this evaluation showed no significant impact on household incomes, and suggests that targeting problems with the NSAP are very real. First of all, the incidence of the benefits from the programmes indicate that there are regressive elements at work in the targeting mechanism of the NSAP, particularly the old age pension. Given planned increases in the benefits for the programs, and gradual relaxation of the eligibility criteria towards universalization of the widow’s pension, it remains an open question whether increased outlays for the NSAP will be captured by non-poor or will lead to further expansions in coverage to the people whom the programme aims to benefit. It is encouraging that planned steps towards greater universalization based on the March 2013 Task Force proposals are aimed primarily at the widow’s pension, which we have shown to be the more effective pension by this evaluation.
Future research into the role that social assistance transfers can play in an Indian minimum social protection floor should aim to simulate ex-ante how the reforms highlighted in the March 2013 Proposal for a Comprehensive National Social Assistance Programme (Government of India, 2013) will affect the populations, which the NSAP aims to help. This will entail looking at the cost-benefit tradeoffs of the move towards greater universalization, particularly in the planned expansion of eligibility for the widow’s pension to all single women, but will also require some examination of the possible impacts which increased pension receipt and coverage may have on household labor supply decisions and occupational choice behaviour. As was shown by the conflicting effects that employment status had on
26
probability of receiving the widow’s pension versus the old age pension, pension receipts are intricately tied together with household labor market behavior, and their interaction with labor market decisions needs to be further explored in the Indian context. Currently the relatively small size of NSAP transfers make them unlikely to have strong impacts on occupational choice behaviors of household members, but as they expand in size and scope the prospect for broader impacts on the labour market may increase, particularly in light of the expansion of other social protection programmes and their consequent labor market effects.
27
References Ajwad, Mohamed Ihsan (2007) “Performance of Social Safety Net Programs in Uttar Pradesh” Policy Research
Working Paper 714, The World Bank, Washington, DC.
Case and Deaton (1998) "Large Cash Transfers to the Elderly in South Africa," Economic Journal, Royal Economic Society, vol. 108(450), pages 1330-61, September.
Desai, Sonalde, Amaresh Dubey, B.L. Joshi, Mitali Sen, Abusaleh Shariff, and Reeve Vanneman. (2009) India Human Development Survey (IHDS) [Computer file]. ICPSR22626-v2. Universityof Maryland and National Council of Applied Economic Research, New Delhi [producers], 2007. Ann Arbor, MI: Inter-university Consortium for Political and Social Research [distributor], 30 June 2009.
Drèze and Khera (2009), “The BPL Census and a Possible Alternative”, Economic and Political Weekly, Vol - XLV No. 09, February 27, 2010.
Duflo, Esther, (2003) "Grandmothers and Granddaughters: Old-Age Pensions and Intrahousehold Allocation in South Africa," World Bank Economic Review, Vol. 17, no. 1, (June 2003): 1-25
Dutta, Puja, Stephen Howes, and Ranku Murgai (2010) "Small but effective: India’s targeted unconditional cash transfers,” ASARC Working Paper 2010/18, Australian National University.
Dutta, Puja & Murgai, Rinku & Ravallion., Martin & van de Walle, Dominique (2012). "Does India's employment guarantee scheme guarantee employment ?. Policy Research Working Paper 6003, The World Bank, Washington, DC.
Government of India (2012) Annual Report 2011-12, Ministry for Rural Development, New Delhi, India.
Government of India (2013) Proposal for Comprehensive National Social Assistance Programme – Report of the Task Force, Ministry for Rural Development, New Delhi, India
Clément Imbert & John Papp (2012) "Equilibrium Distributional Impacts of Government. Employment Programs: Evidence from India's Employment Guarantee," PSE Working Papers, Paris School of Economics, Paris, France.
Kassouf and de Oliveira (2012) “Impact Evaluation of the Brazilian Pension Program Beneficio de Prestaçao Continuada (BPC) on Family Welfare” International Policy Centre for Inclusive Growth
Kannan and Brennan, editors (2013) The Long Road to Social Security, Oxford University Press, New Delhi
Kautilya (1992[1987]), The Arthashastra, translated by L. N. Rangarajan, New Delhi: Penguin Books India.
Khera, Reetika, editor (2011) The Battle for Employment Guarantee in India, Oxford University Press.
Murgai, Rinku, Salman Zaidi, Arindam Nandi, and Juan Munoz. “Do Public Funds Reach the Destitute? Assessment of Leakages and Targeting of Social Pension Programs in Karnataka” draft manuscript.
Sinha and Yoong (2009) "Long-Term Financial Incentives and Investment in Daughters: Evidence From Conditional Cash Transfers In North India," Policy Research Working Papers Series 4860, World Bank, Washington, DC
Srivastava, Ravi. (forthcoming) A Social Protection Floor for India, draft manuscript of forthcoming UN employment and social protection task team report.
World Bank (2011) Social Protection for a Changing India, Vol. 1, Washington, DC.
Related Documents