How it works – Step 1: The data Pre 16 weeks Campaign 2 weeks Post 12 weeks Nielsen DME have access to volume weekly sales data (from actual transactions)
Dec 16, 2015
Welcome message from author
This document is posted to help you gain knowledge. Please leave a comment to let me know what you think about it! Share it to your friends and learn new things together.
Transcript

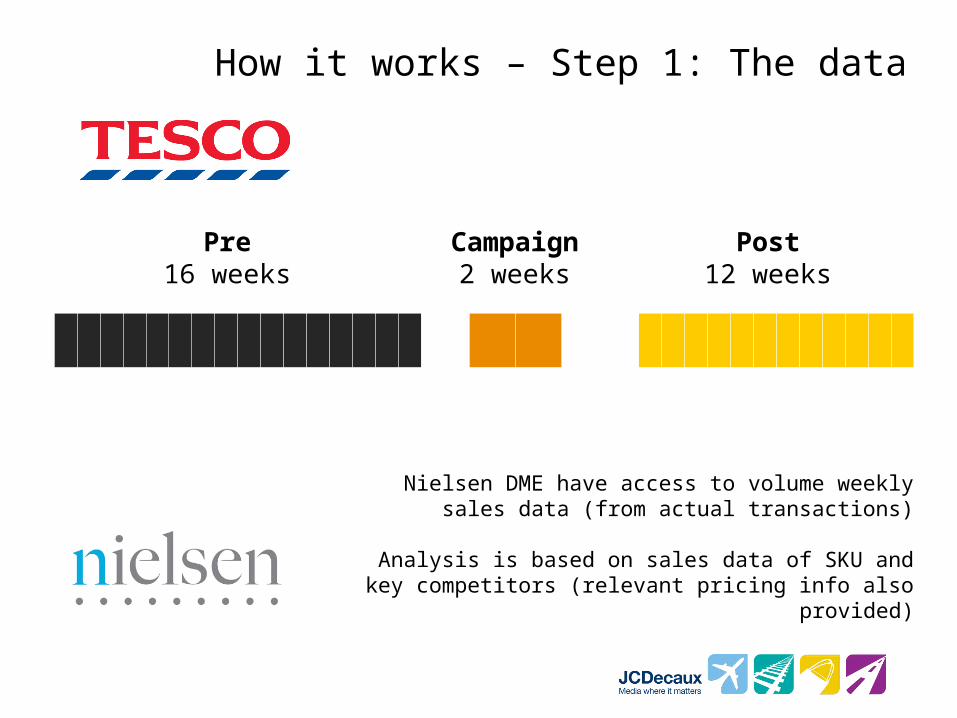
How it works – Step 1: The data
Pre16 weeks
Campaign2 weeks
Post12 weeks
Nielsen DME have access to volume weekly sales data (from actual transactions)
Analysis is based on sales data of SKU and key competitors (relevant pricing info also provided)
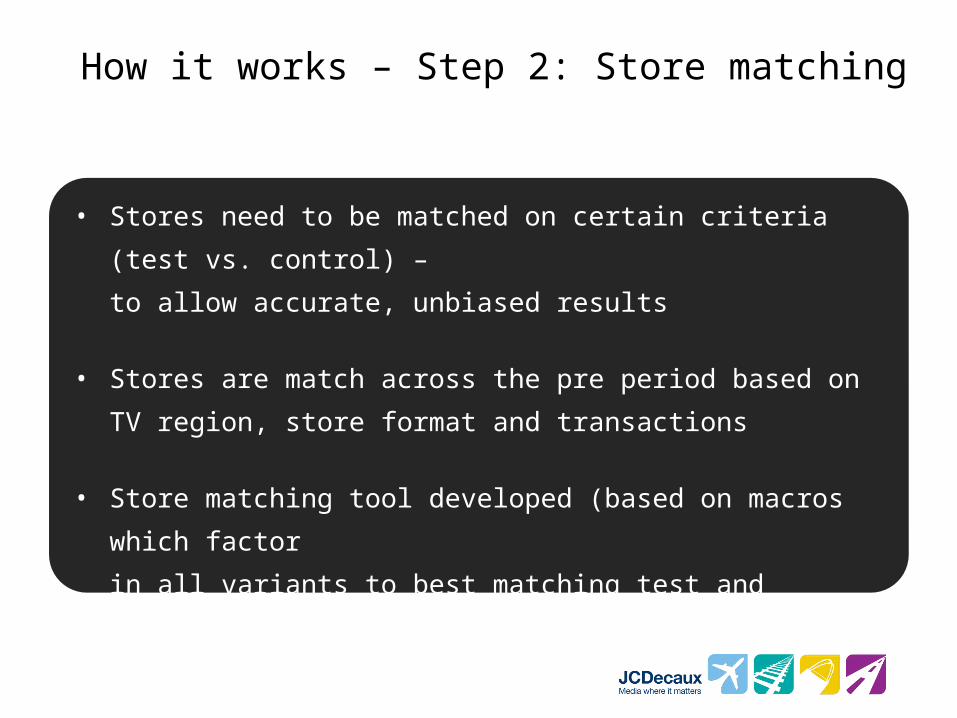
How it works – Step 2: Store matching
• Stores need to be matched on certain criteria (test vs.
control) –
to allow accurate, unbiased results
• Stores are match across the pre period based on TV
region, store format and transactions
• Store matching tool developed (based on macros which
factor
in all variants to best matching test and control stores)
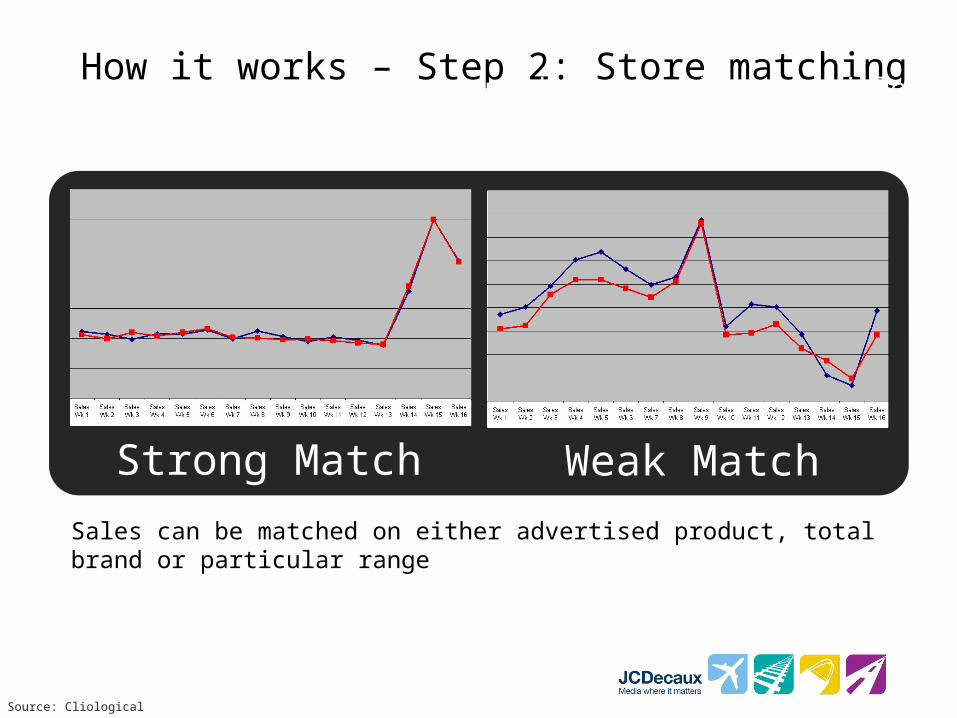
How it works – Step 2: Store matching
Strong Match Weak Match
Source: Cliological
Sales across the pre period must be as equal as possible across the 2 sets of stores
Sales can be matched on either advertised product, total brand or particular range

Across the accurately matched stores sales are then analysed during and after the campaign
Any difference in sales (index) between the test and control stores can be confidently attributed to the presence of OOH proximity
(So long as the matching in the pre period is accurate)
80
100
120
140
160
180
200
15 16 17 18 19Week
Sa
les
Up
lift
Ind
ex
Sales Uplift Index (Test) Sales Uplift Index (Control)
Control Index* = 140
Test Index* = 160
+14%
*Index = average weekly unit sales during vs. average weekly unit sales pre
How it works – Step 3: Calculating the Results

The following summary slides are of the Tesco POS Category Norms. These illustrate the average sales uplift of stores with POS advertising (test) compared to stores without (control). The slides demonstrate the average sales uplift for during & post campaign, along with the average sales uplift by week. These uplifts are based on an average of all the case studies within the specific Category.

Alcohol NORM
22%
13%
Pre During Post
Source: Tesco
Based on 12 Tesco Alcohol Case Studies

Baby Products NORM
24%
7%
Pre During Post
Source: Tesco
Based on 3 Tesco Baby Products Case Studies
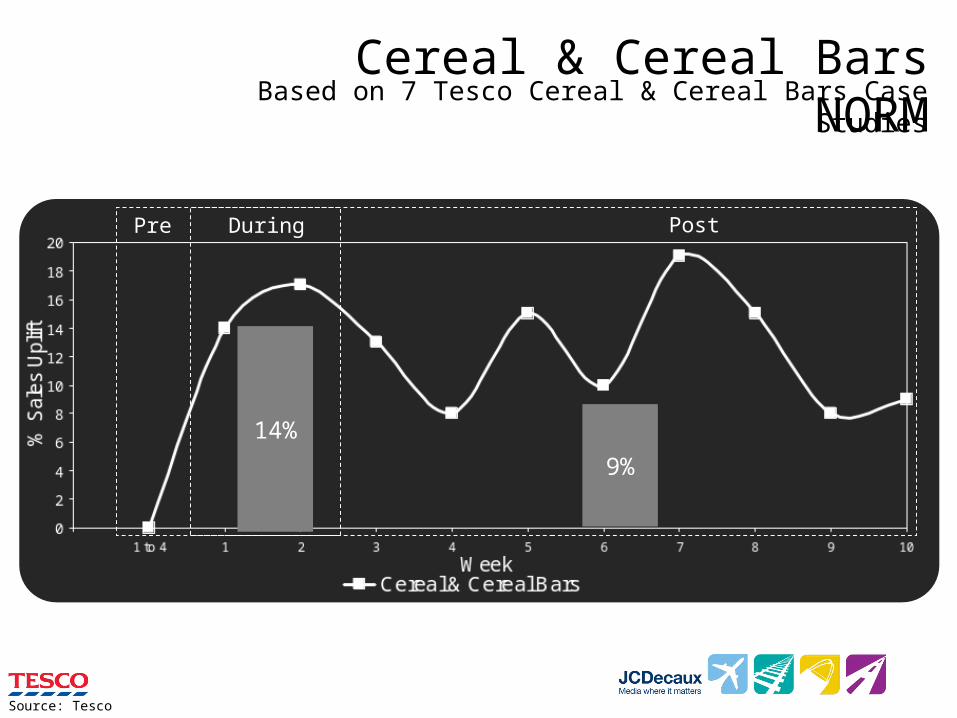
Cereal & Cereal Bars NORM
14%
9%
Pre During Post
Source: Tesco
Based on 7 Tesco Cereal & Cereal Bars Case Studies
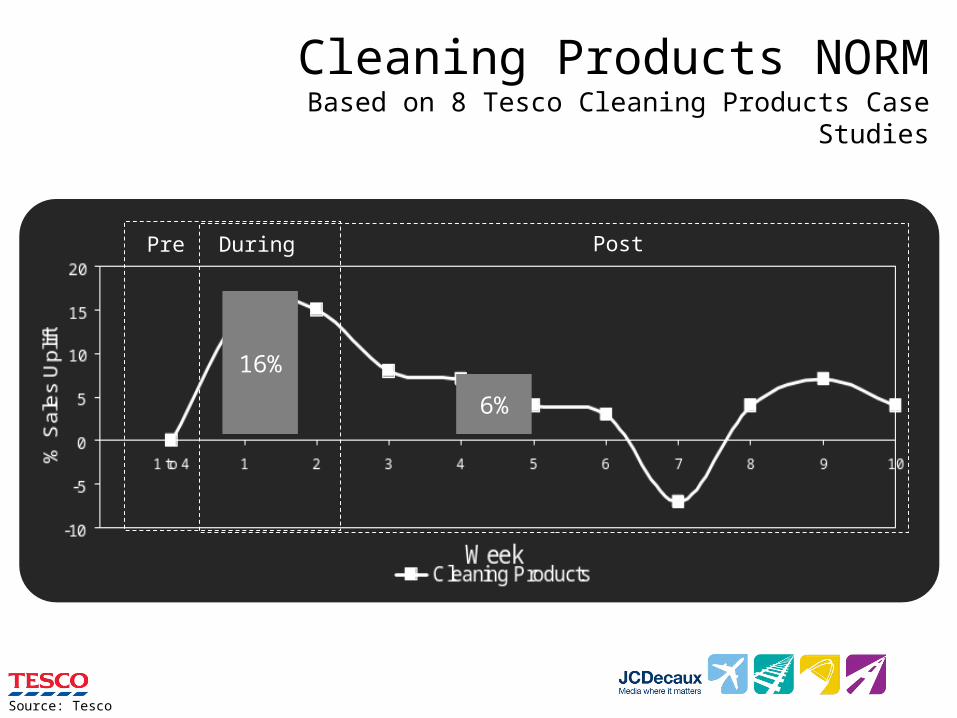
Cleaning Products NORM
16%
6%
Pre During Post
Source: Tesco
Based on 8 Tesco Cleaning Products Case Studies
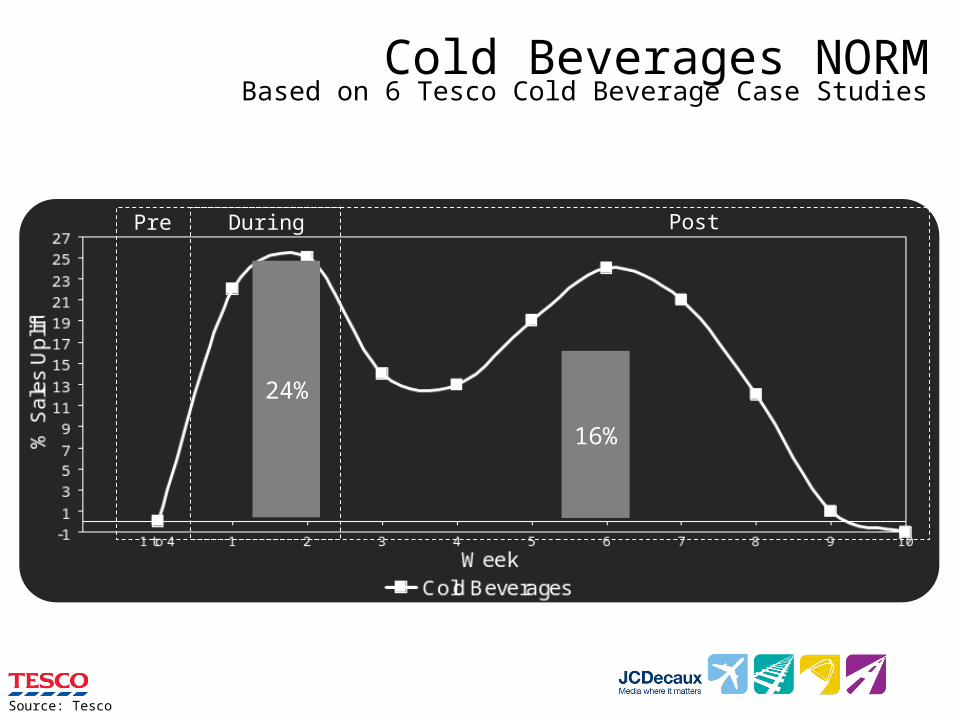
Cold Beverages NORM
24%
16%
Pre During Post
Source: Tesco
Based on 6 Tesco Cold Beverage Case Studies

Confectionary Products NORM
21%
12%
Pre During Post
Source: Tesco
Based on 16 Tesco confectionary Case Studies

Convenience Products NORM
10%7%
Pre During Post
Source: Tesco
Based on 29 Tesco convenience Products Case Studies

DVD or CD Products NORM
16%
7%
Pre During Post
Source: Tesco
Based on 7 Tesco DVDs or CD Case Studies

Hot Beverage products NORM
14% 13%
Pre During Post
Source: Tesco
Based on 3 Tesco Hot beverage Products Case Studies

Meat Products NORM
13%
6%
Pre During Post
Source: Tesco
Based on 4 Tesco Meat Products Case Studies

Paraphernalia & Financial Products NORM
29%14%
Pre During Post
Source: Tesco
Based on 4 Tesco Paraphernalia & Financial Products Case Studies
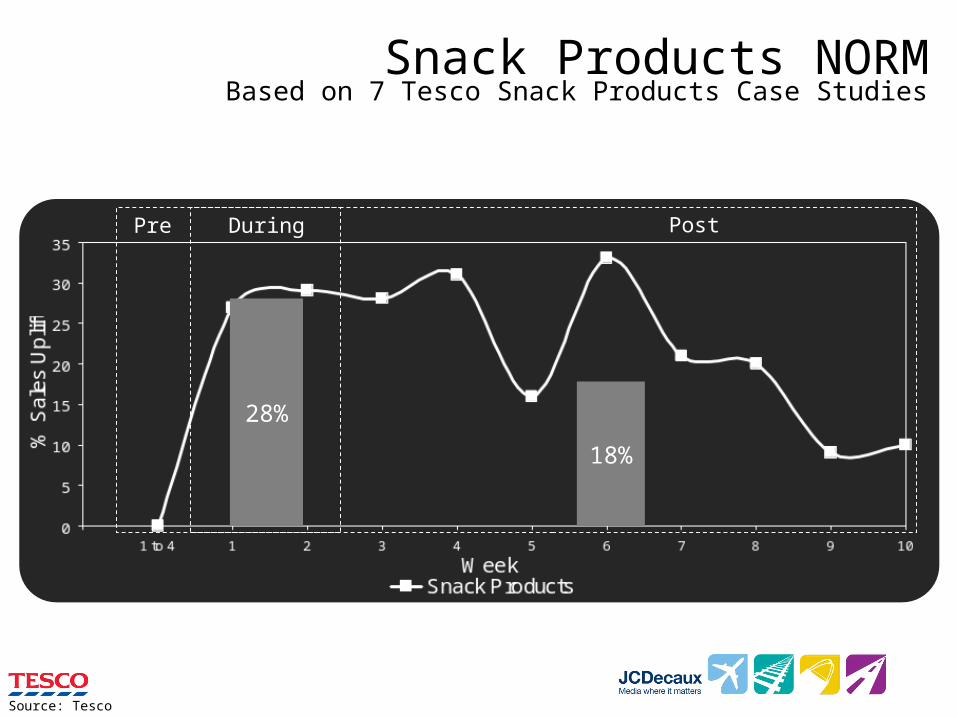
Snack Products NORM
28%
18%
Pre During Post
Source: Tesco
Based on 7 Tesco Snack Products Case Studies
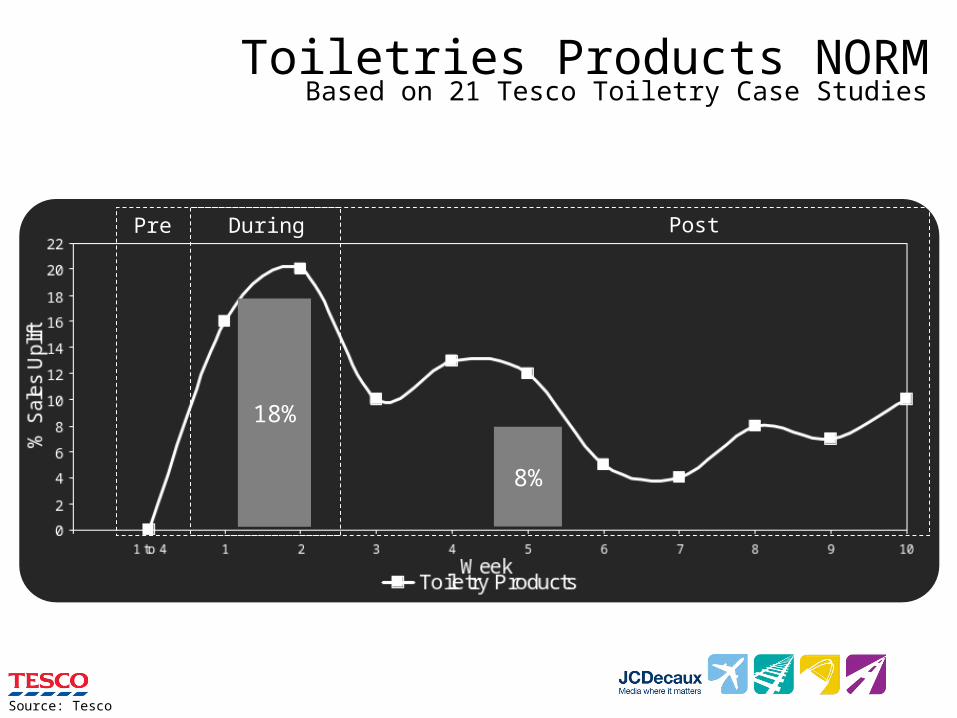
Toiletries Products NORM
18%
8%
Pre During Post
Source: Tesco
Based on 21 Tesco Toiletry Case Studies

Dairy Products NORM
14%
8%
Pre During Post
Source: Tesco
Based on 30 Tesco Dairy Products Case Studies
Related Documents