How Is My Portfolio Doing ... And What Should I Do About it? A Framework for Assessing Investment Performance January 2011 Highlights • This is IMPORTANT! Monitoring your portfolio is an essential part of being a successful in- vestor. • A thorough performance assessment involves looking at your total portfolio in the context of the markets. • Once a year is enough. • Annualized rates of return over the long term are your best yardstick. • Patience is required. Recent performance alone is not a reason to make changes.

Welcome message from author
This document is posted to help you gain knowledge. Please leave a comment to let me know what you think about it! Share it to your friends and learn new things together.
Transcript
How Is My Portfolio Doing ... And What Should I Do About it?
A Framework for Assessing Investment Performance
January 2011
Highlights
• This is IMPORTANT! Monitoring your portfolio is an essential part of being a successful in-vestor.
• A thorough performance assessment involves looking at your total portfolio in the context of the markets.
• Once a year is enough.• Annualized rates of return over the long term
are your best yardstick. • Patience is required. Recent performance
alone is not a reason to make changes.

Table of Contents
Steadyhand Investment Funds is an independent no-load mutual fund company that offers a straightforward
lineup of low-fee funds directly to investors. The firm has an experienced management team and clear investment
philosophy rooted in the belief that concentrated, non-benchmark oriented portfolios are the key to index-beating
returns. Steadyhand’s only business is managing money for individual investors and it offers practical advice on
building and monitoring portfolios.
www.steadyhand.com
1-888-888-3147
1747 West 3rd Avenue, Vancouver, B.C., V6J 1K7
We want to thank the clients and industry professionals who generously gave their time in providing feedback on
this report.
Introduction 1
Numbers 3
Context 6
Analysis 8
Success 12
Action 14
Takeaways 17
Appendix 18
First published on January 20, 2011, by Steadyhand Investment Funds Inc.

IntroductionThis is important!
Do you know how your portfolio is doing?
If you open your quarterly statement and have more
money than the previous quarter, do you feel good?
And vice versa, if the market value has dropped, do you
grumble?
A few years ago, we met with a prospective client who
thought her advisor had done well for her in the previous
five years, but was letting her down in the current year –
her portfolio was down 3%. After assessing the
situation, we discovered that her portfolio was actually
holding up well in the current year relative to a weak
market. In previous years, however, it had performed
poorly – the return didn’t nearly reflect the strength of
the markets. This example speaks to how muddy the
area of performance measurement is and how little effort
investors make in answering the question – How am I
doing?
There are reasons for this. Assessing performance
takes time and is tough to do. There are many factors
to consider, the necessary data is difficult to obtain and
the conclusions don’t always match up with how you
feel. In addition, the wealth management industry
doesn’t help matters. Its lack of effort in providing
useful information borders on negligence.
This is Important!The challenges that go with conducting a proper
assessment don’t change the fact that it’s extremely
important. Monitoring your portfolio is a key element
of being a successful investor.
It’s important because the “Am I up or down this
quarter?” approach doesn’t work. The time frame is
inappropriate - short-term results are as close to
random as you can get - and there is no context to it.
As the story above reveals, a portfolio may be down and
yet have performed well and vice versa.
If you haven’t analyzed your past decisions, it’s more
likely your future ones will be sub-optimal.
WhenWe suggest doing a thorough performance review
once a year. It’s better than doing partial assessments
multiple times a year.
In our experience, investors monitor their portfolios too
closely. Reviewing returns daily, weekly or even monthly
is too frequent. Investing is a long-term endeavour and
strategies take time to play out. Looking at the
numbers often may induce action when none is
required. And it can be damaging to your mental health
(see Box A).
Steadyhand Investment Funds 1
Bad for your mental health
Looking at a portfolio too often can be
depressing, not because the results are poor,
although they will be from time to time, but
because it’s been shown that we beat ourselves
up about bad news 2-2½ times more than we
celebrate good news.1 In other words, being
down has more impact on our frame of mind
than being up.
Over 1-year periods, the stock market is up
74% of the time (S&P/TSX Composite Index),
but on a daily basis it’s up only 54% of the
time.2 As you can see, the psychological math
doesn’t work:
(54 % x 1.0) - (46% x 2.5) = Bad mood!
1 Nassim Nicholas Taleb. Fooled by Randomness. Texere, 2001, Page 57
2Morningstar. 2010 Risk and Reward - It’s About Time.
A
A Practical ApproachThis paper provides a usable, common-sense
framework for investors to assess their investment
performance. We’ve tried to capture 90% of what’s
important. In other words, practical over perfect.
Our approach recognizes that a performance
assessment is hard enough to do without layering on
more nuance. It also takes into account the limited time
and resources most investors have, and the fact that
every situation is different.
We acknowledge that there are more rigorous analyses
that can be done. For instance, it would be ideal to
make comparisons after factoring in taxes and inflation,
although it would make the process considerably more
difficult. There are more detailed attribution and ratio
analyses that compare returns, volatility and added-
value, but again, these extra variables add to the
complexity of the task.
What our approach will do is:
• Reinforce the importance of having an investment
plan.
• Require that you look at your portfolio as a whole.
• Necessitate that you have all the facts before making
judgments.
• Lead to a better understanding of how your portfolio
works.
• Allow you to intelligently speak to your advisor or
portfolio manager about performance.
• Help you address your biggest potential weakness –
impatience.
• And hopefully, make you a better investor.
Five StepsOur approach to performance assessment follows five
steps:
1. Numbers – Gathering the facts
2. Context – The market environment
3. Analysis – How am I doing?
4. Success – Factors impacting future returns
5. Actions – Now what?
Steadyhand Investment Funds 2
NumbersGathering the facts
To determine how you’re doing, you first need the facts.
It’s important to look at all your investments at one
time. There are two reasons for this, one practical and
one analytical. The practical one is that it’s more
efficient, especially if you have a number of providers.
There is considerable repetition across quarterly reports,
which makes for unnecessary reading. For instance,
after you’ve read one commentary and know what’s
going on in the bond and stock markets, you can skim
or skip the other market reviews.
The second reason is more important. It relates to the
fact that it’s the overall results you’re interested in.
Yes, the returns of your total portfolio. If you review your
investments on a piecemeal basis, it’s too easy to get
focused on one particular holding, trend or personality –
obsessing over a gold stock or poorly performing
mutual fund – that has minimal impact on the overall
return. You want to keep an eye on the trees, but not
lose sight of the forest.
So gather all the data in one place before you sit down
to do your work. The more providers you have, the
more necessary it is.
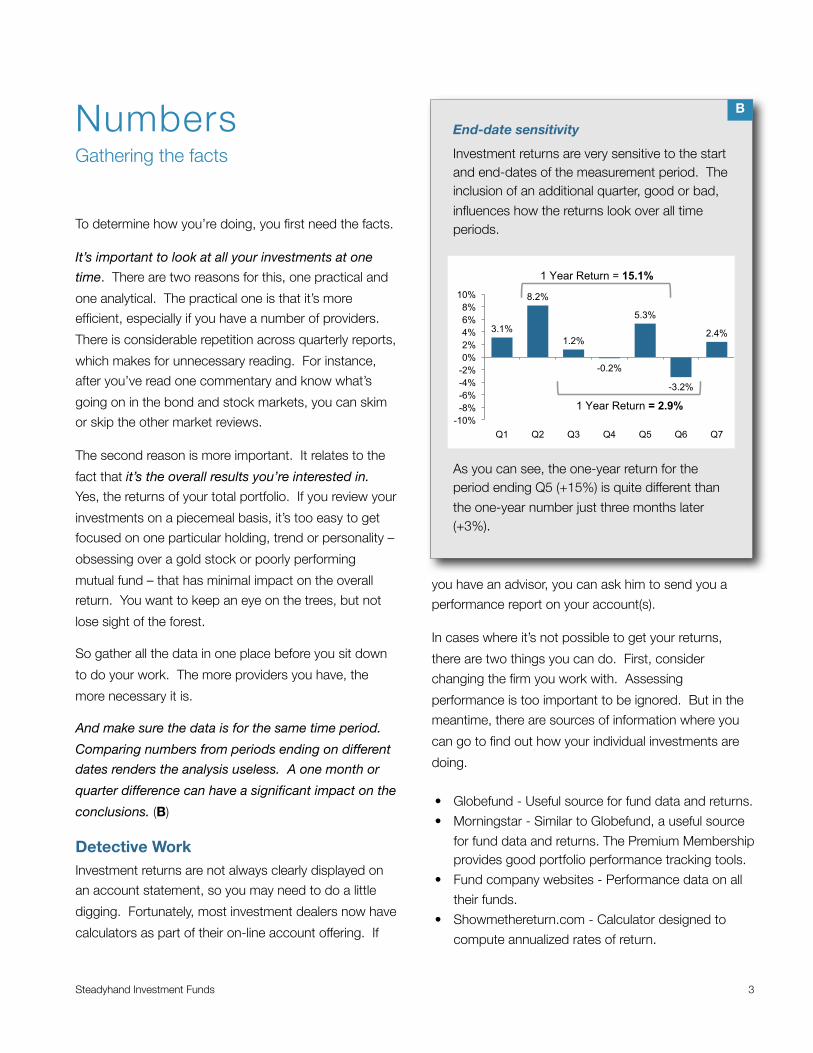
And make sure the data is for the same time period.
Comparing numbers from periods ending on different
dates renders the analysis useless. A one month or
quarter difference can have a significant impact on the
conclusions. (B)
Detective WorkInvestment returns are not always clearly displayed on
an account statement, so you may need to do a little
digging. Fortunately, most investment dealers now have
calculators as part of their on-line account offering. If
you have an advisor, you can ask him to send you a
performance report on your account(s).
In cases where it’s not possible to get your returns,
there are two things you can do. First, consider
changing the firm you work with. Assessing
performance is too important to be ignored. But in the
meantime, there are sources of information where you
can go to find out how your individual investments are
doing.
Steadyhand Investment Funds 3
End-date sensitivity
Investment returns are very sensitive to the start and end-dates of the measurement period. The inclusion of an additional quarter, good or bad,
influences how the returns look over all time periods.
As you can see, the one-year return for the period ending Q5 (+15%) is quite different than
the one-year number just three months later (+3%).
B
• Globefund - Useful source for fund data and returns.
• Morningstar - Similar to Globefund, a useful source
for fund data and returns. The Premium Membership provides good portfolio performance tracking tools.
• Fund company websites - Performance data on all
their funds.
• Showmethereturn.com - Calculator designed to
compute annualized rates of return.
3.1%
8.2%
1.2%
-0.2%
5.3%
-3.2%
2.4%
-10%
-8%
-6%
-4%
-2%
0%
2%
4%
6%
8%
10%
Q1 Q2 Q3 Q4 Q5 Q6 Q7
1 Year Return = 15.1%
1 Year Return = 2.9%
Annualized Rate of ReturnShow me the money! We all want to know how many
dollars we’ve earned, but that number doesn’t properly
take into account how much we’ve invested and for
how long. Annualized rates of return, the percentage
return earned per year on your invested capital,
factors in the size of your account and length of time
it’s been invested. It includes all forms of income
including interest, dividends and market appreciation.
For example, the return on a stock is made up of the
dividends received and the price appreciation (or
depreciation) over the time period. If it traded at $10 on
January 1st, paid a $0.50 dividend at the end of the
year and closed the year at $11, the return would be
15%.
(($11.00 – 10.00 + 0.50) / 10)) x 100 = 15%
Similar to individual securities, the annualized rates of
return for mutual funds and other pooled products
include distributions made during the period as well
as the gain (loss) related to changes in the unit price.
Calculating a rate of return is simple when there have
been no cash flows during the period (purchases or
sales). When there are flows, as well as dividends or
other distributions, it’s more difficult. In this case, you
may need to call on your dealer for help or find a
performance calculator.
The Ontario Securities Commission has a basic
performance calculator on its website -
http://www.getsmarteraboutmoney.ca/tools-and-
calculators/understanding-your-account-statement/
accountstatement/calculator/default_b.asp
It’s important to note that all returns should be net of
fees. You can’t spend pre-fee earnings.
Time Frame Short-term predictions of stock prices, or asset class
returns, are nothing more than speculation. You might
as well roll the dice or throw a dart, as the outcomes are
entirely random. There are too many factors at play to
suggest otherwise.
But predictions about asset class returns become more
reliable over longer time periods. Will bonds earn 3%
this year? It’s hard to say. But given current yields of
2-4%, it’s relatively certain that returns over the next 10
years will be in that neighbourhood. Will stocks beat
bonds this year? We have no idea. But over a longer
time frame, we can say Yes with some confidence.
It’s the same when assessing investment returns. The
most recent quarter, or other short period, is of limited
value in indicating how you’re doing. (Note: That’s not
to say that short-term swings aren’t useful data points.
A significant change to your portfolio’s value may mean
there are opportunities to do some buying at lower
prices, raise cash for future needs when prices are up,
or just do some routine re-balancing).
So when you’re assessing the results of an investment
plan, the correct time frame is one where the elements
of luck and randomness has been filtered out of the
data, and the numbers are a truer indication of skill. It’s
a time period described by the most over-used words in
financial literature – ‘long term’.
What does long term mean? There is no precise
definition. Investing is an endeavour that spans many
years and is done to offset liabilities that are in the
distant future (i.e. providing a paycheque in retirement).
Long term means at least 5 years, and ideally even
longer.
The best solution to the time frame question, in our
opinion, is to analyze your investment returns in two
ways.
First, look at the annualized rates of return for the
overall portfolio, and individual components, over
periods of 3, 5 and 10 years. The longer-term
numbers are the best indicator of how you’re doing.
Steadyhand Investment Funds 4
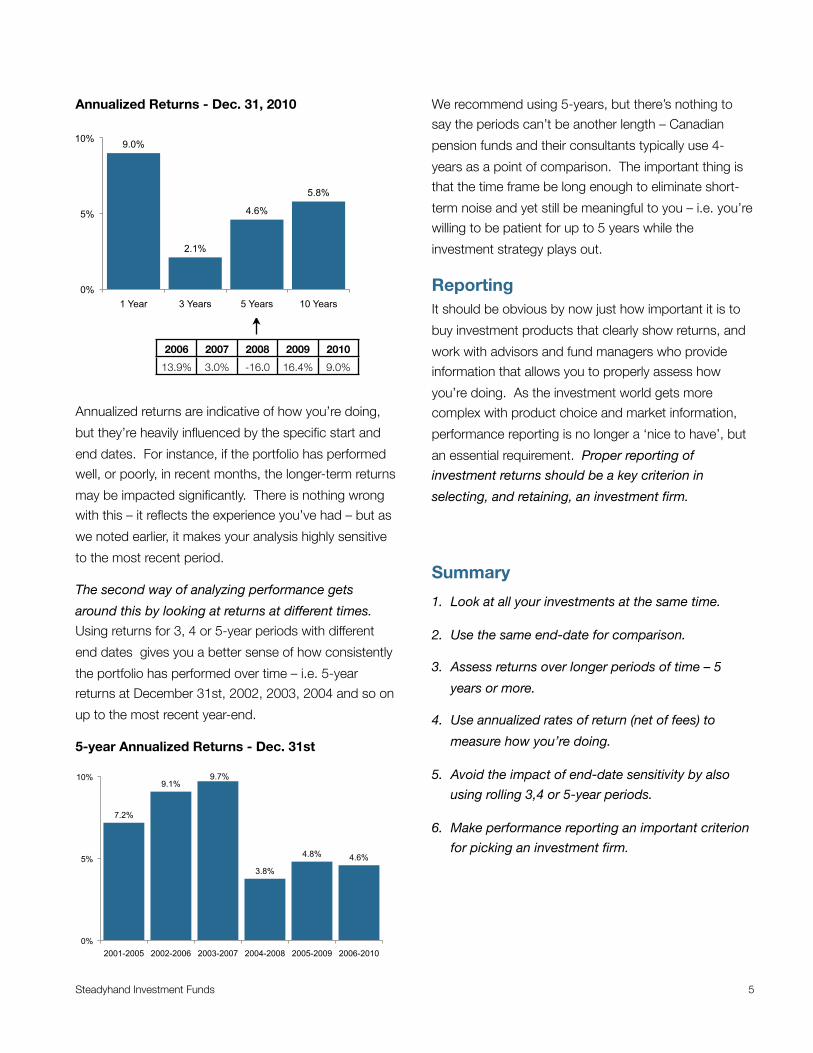
Annualized Returns - Dec. 31, 2010
Annualized returns are indicative of how you’re doing,
but they’re heavily influenced by the specific start and
end dates. For instance, if the portfolio has performed
well, or poorly, in recent months, the longer-term returns
may be impacted significantly. There is nothing wrong
with this – it reflects the experience you’ve had – but as
we noted earlier, it makes your analysis highly sensitive
to the most recent period.
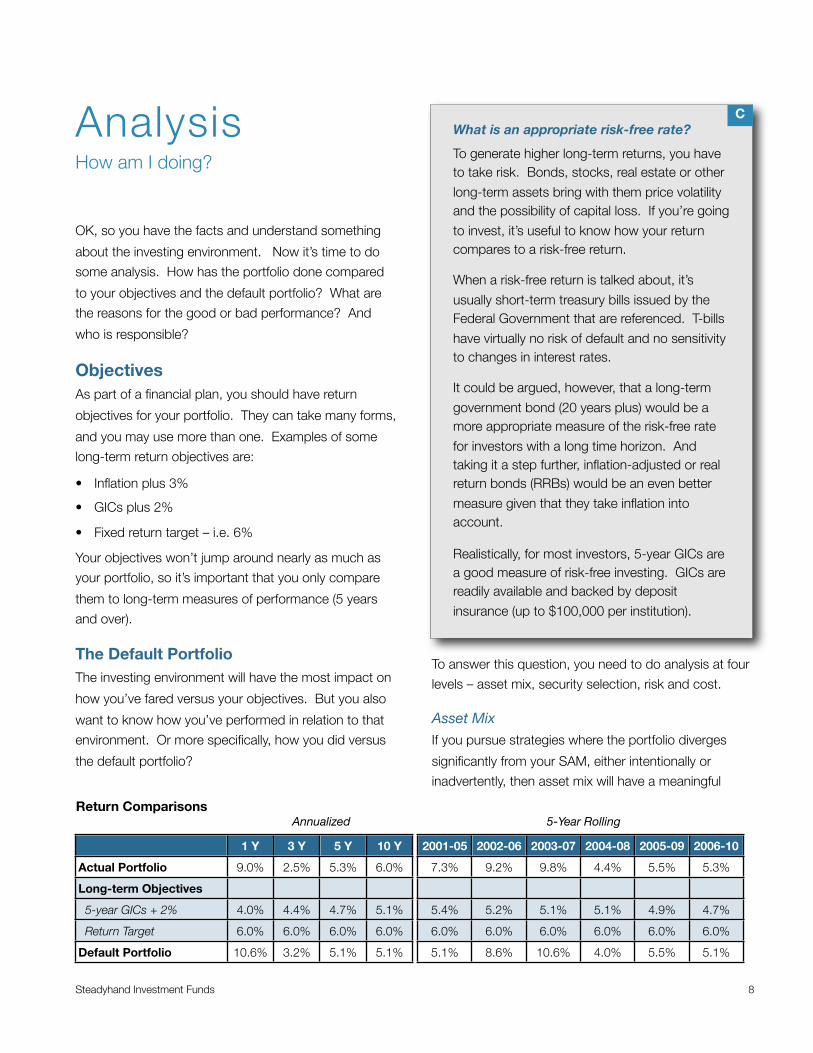
The second way of analyzing performance gets
around this by looking at returns at different times.
Using returns for 3, 4 or 5-year periods with different
end dates gives you a better sense of how consistently
the portfolio has performed over time – i.e. 5-year
returns at December 31st, 2002, 2003, 2004 and so on
up to the most recent year-end.
5-year Annualized Returns - Dec. 31st
We recommend using 5-years, but there’s nothing to
say the periods can’t be another length – Canadian
pension funds and their consultants typically use 4-
years as a point of comparison. The important thing is
that the time frame be long enough to eliminate short-
term noise and yet still be meaningful to you – i.e. you’re
willing to be patient for up to 5 years while the
investment strategy plays out.
ReportingIt should be obvious by now just how important it is to
buy investment products that clearly show returns, and
work with advisors and fund managers who provide
information that allows you to properly assess how
you’re doing. As the investment world gets more
complex with product choice and market information,
performance reporting is no longer a ‘nice to have’, but
an essential requirement. Proper reporting of
investment returns should be a key criterion in
selecting, and retaining, an investment firm.
Summary
1. Look at all your investments at the same time.
2. Use the same end-date for comparison.
3. Assess returns over longer periods of time – 5
years or more.
4. Use annualized rates of return (net of fees) to
measure how you’re doing.
5. Avoid the impact of end-date sensitivity by also
using rolling 3,4 or 5-year periods.
6. Make performance reporting an important criterion
for picking an investment firm.
Steadyhand Investment Funds 5
2006 2007 2008 2009 2010
13.9% 3.0% -16.0 16.4% 9.0%
9.0%
2.1%
4.6%
5.8%
0%
5%
10%
1 Year 3 Years 5 Years 10 Years
7.2%
9.1% 9.7%
3.8%
4.8% 4.6%
0%
5%
10%
2001-2005 2002-2006 2003-2007 2004-2008 2005-2009 2006-2010

ContextThe market environment
Capital markets are very dynamic. They can move
significantly in short periods of time, with some
securities going up in price and others dropping.
Therefore, you need to know what the investing
environment was like for your type of portfolio, so you
can carry out an ‘apples to apples’ comparison.
One of the biggest mistakes investors make is
comparing their portfolio, or a portion of it, to something
they’ve seen in the newspaper or heard in the locker
room. It’s a mistake because the objectives of their
conservative balanced portfolio, as an example, could
be totally different than the ‘play money’ a golf partner
has with his broker. Too often, investors let a story
about oranges influence how they view their apples.
All of that to say, you need to gather information about
the overall market and put it in a form that best reflects
the composition of your own portfolio.
Market DataAll quarterly reports will have information on what the
capital markets have done over the previous quarter.
This gives you an understanding of what’s been driving
the markets, but it isn’t a big factor in your analysis. It’s
more important to get your hands on asset class returns
for longer periods (see the table below). The report(s)
you receive will likely have annualized returns for each
category. If not, there are many good sources of this
information on the internet (see the list on page 3).
Default Portfolio To be successful, you need to have a plan. It’s an
overused axiom, but it’s true. A key part of your plan is
the strategic asset mix (SAM), which is the mix of
investments that has the best chance of achieving your
goals. It’s an educated guess, designed to find the right
balance between return, volatility and income.
For example, a young investor with a long investment
horizon should be oriented towards stocks, which are
more volatile in the short term, but provide higher
returns over the long term. Her mix might be 20%
bonds, 40% Canadian stocks and 40% foreign stocks.
An investor with a shorter time frame should have a
larger portion of his mix in more stable bonds (i.e. 50%
bonds, 25% Canadian stocks and 25% foreign stocks).
Without a SAM, you can’t do any meaningful
performance comparisons. It’s the starting point for
calculating the returns of a default portfolio, or what’s
commonly referred to as a benchmark.
Your default portfolio most accurately reflects the
investment environment that’s relevant to you. It can
Steadyhand Investment Funds 6
Annualized Returns - Dec. 31, 2010
Asset Class Index 1 Y 3 Y 5 Y 10 Y
Cash DEX 91 Day T-Bill 0.5% 1.5% 2.6% 2.8%
Bonds DEX Universe Bond 6.7% 6.2% 5.3% 6.3%
Canadian stocks S&P/TSX Composite 17.6% 2.1% 6.5% 6.6%
U.S. stocks S&P 500 ($Cdn) 9.5% -2.7% -0.9% -2.6%
International stocks MSCI EAFE ($Cdn) 2.5% -6.9% -0.7% -0.6%

be constructed by multiplying the returns of the asset
classes in the SAM by their proportions. For example:
Calculating a Default Portfolio Return
Note: The table above assumes no changes to the SAM and has not been re-balanced over the period. Ideally, the default portfolio should be calculated at a regular interval (quarterly or annually) and cumulated to create a longer-term index. This allows for changes to the SAM and serves to automatically re-balance the mix. In the table at the bottom of the page, we provide a Default Portfolio Calculator.
To make the default portfolio representative of the real
world, you may consider factoring fees and
commissions into the calculation. By subtracting 0.5%
from the annual return, it will more accurately reflect the
cost of managing an index-like portfolio, which is what
your default portfolio is. (Note: You might be able to do
it slightly cheaper, particularly if you’re a large investor,
but most people end up paying more than 0.5% to build
and maintain a basic indexed portfolio.)
It’s important to note that your SAM, and the resulting
default portfolio, shouldn’t change much from year to
year, even though the mix of your actual portfolio will
bounce around with the markets. They will evolve
over time due to inevitability of aging, but major shifts
should only be done as a result of changes to your life
circumstances, not in reaction to recent market
moves.
Summary
1. Understand the context in which your portfolio is
operating so you can make an apples-to-apples
comparison.
2. To best represent the market environment,
calculate the returns for a default portfolio based
on your strategic asset mix.
3. Only change your objectives and default portfolio
when there’s been a significant change to your
circumstances.
Steadyhand Investment Funds 7
SAM Index % 5 Yr Return
Bonds DEX Universe 30.0% x 5.3% = 1.6%
Cdn stocks S&P/TSX Comp 35.0% x 6.5% = 2.3%
U.S. stocks S&P 500 ($Cdn) 17.5% x -0.9% = -0.2%
Intl. stocks MSCI EAFE ($Cdn) 17.5% x -0.7% = -0.1%
Default portfolio return 3.6%
Estimated annual fee -0.5%
Default portfolio return (fee adjusted) 3.1%
Default Portfolio Calculator - Dec. 31, 2010
Asset Mix Annualized Rate of ReturnAnnualized Rate of ReturnAnnualized Rate of ReturnAnnualized Rate of Return
Bonds / Equities 1 Y 3 Y 5 Y 10 Y
80% / 20% 8.1% 5.4% 5.4% 6.1%
70% / 30% 8.7% 5.0% 5.4% 5.9%
60% / 40% 9.4% 4.4% 5.3% 5.6%
50% / 50% 10.0% 3.9% 5.2% 5.4%
40% / 60% 10.7% 3.2% 5.1% 5.1%
30% / 70% 11.3% 2.5% 4.9% 4.8%
20% / 80% 12.0% 1.7% 4.6% 4.4%
Calculator notes:• Equities: 60% Canada (S&P/TSX Composite Index); 40% foreign (MSCI World Index)• Bonds: DEX Universe Bond Index• Re-balancing: for periods over 1-year, each portfolio is re-balanced annually - e.g. an 80% bonds / 20% equities mix is reset to 80 / 20 at the
beginning of each year• Returns do not include fees
AnalysisHow am I doing?
OK, so you have the facts and understand something
about the investing environment. Now it’s time to do
some analysis. How has the portfolio done compared
to your objectives and the default portfolio? What are
the reasons for the good or bad performance? And
who is responsible?
ObjectivesAs part of a financial plan, you should have return
objectives for your portfolio. They can take many forms,
and you may use more than one. Examples of some
long-term return objectives are:
• Inflation plus 3%
• GICs plus 2%
• Fixed return target – i.e. 6%
Your objectives won’t jump around nearly as much as
your portfolio, so it’s important that you only compare
them to long-term measures of performance (5 years
and over).
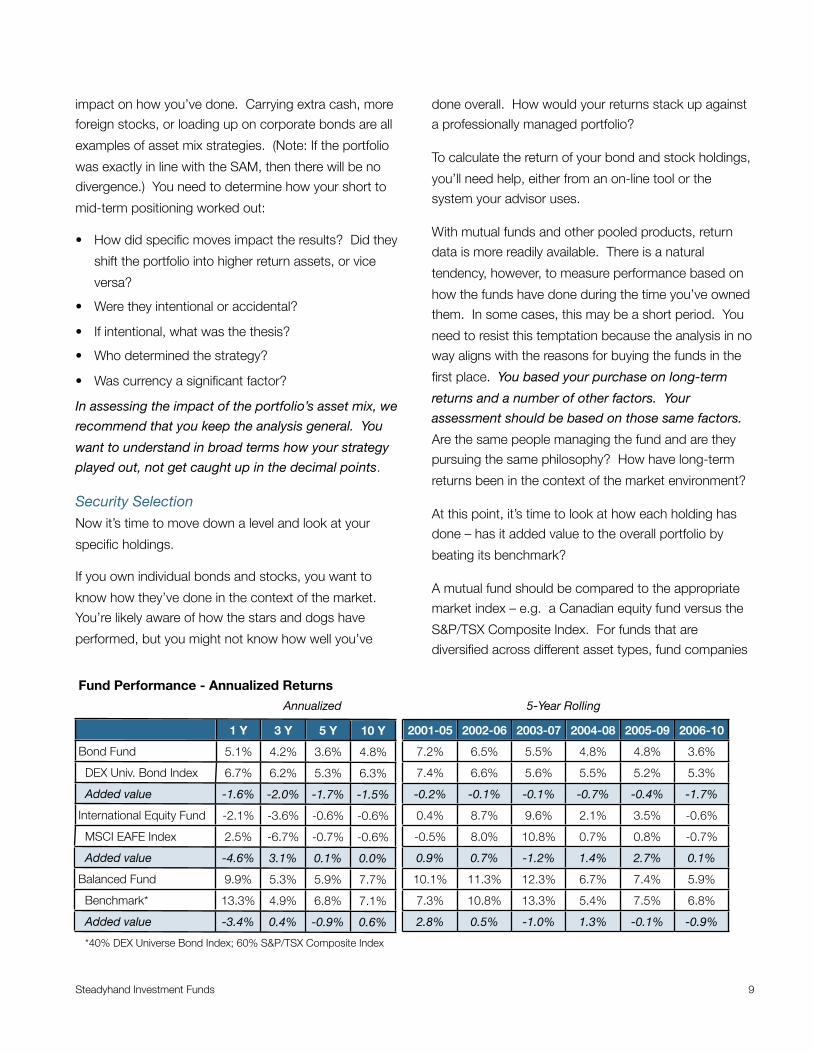
The Default PortfolioThe investing environment will have the most impact on
how you’ve fared versus your objectives. But you also
want to know how you’ve performed in relation to that
environment. Or more specifically, how you did versus
the default portfolio?
To answer this question, you need to do analysis at four
levels – asset mix, security selection, risk and cost.
Asset MixIf you pursue strategies where the portfolio diverges
significantly from your SAM, either intentionally or
inadvertently, then asset mix will have a meaningful
Steadyhand Investment Funds 8
1 Y 3 Y 5 Y 10 Y
Actual Portfolio 9.0% 2.5% 5.3% 6.0%
Long-term Objectives
5-year GICs + 2% 4.0% 4.4% 4.7% 5.1%
Return Target 6.0% 6.0% 6.0% 6.0%
Default Portfolio 10.6% 3.2% 5.1% 5.1%
What is an appropriate risk-free rate?
To generate higher long-term returns, you have to take risk. Bonds, stocks, real estate or other
long-term assets bring with them price volatility and the possibility of capital loss. If you’re going
to invest, it’s useful to know how your return compares to a risk-free return.
When a risk-free return is talked about, it’s
usually short-term treasury bills issued by the Federal Government that are referenced. T-bills
have virtually no risk of default and no sensitivity to changes in interest rates.
It could be argued, however, that a long-term
government bond (20 years plus) would be a more appropriate measure of the risk-free rate
for investors with a long time horizon. And taking it a step further, inflation-adjusted or real return bonds (RRBs) would be an even better
measure given that they take inflation into account.
Realistically, for most investors, 5-year GICs are a good measure of risk-free investing. GICs are readily available and backed by deposit
insurance (up to $100,000 per institution).
C
Return Comparisons Annualized 5-Year Rolling
2001-05 2002-06 2003-07 2004-08 2005-09 2006-10
7.3% 9.2% 9.8% 4.4% 5.5% 5.3%
5.4% 5.2% 5.1% 5.1% 4.9% 4.7%
6.0% 6.0% 6.0% 6.0% 6.0% 6.0%
5.1% 8.6% 10.6% 4.0% 5.5% 5.1%
impact on how you’ve done. Carrying extra cash, more
foreign stocks, or loading up on corporate bonds are all
examples of asset mix strategies. (Note: If the portfolio
was exactly in line with the SAM, then there will be no
divergence.) You need to determine how your short to
mid-term positioning worked out:
• How did specific moves impact the results? Did they
shift the portfolio into higher return assets, or vice
versa?
• Were they intentional or accidental?
• If intentional, what was the thesis?
• Who determined the strategy?
• Was currency a significant factor?
In assessing the impact of the portfolio’s asset mix, we
recommend that you keep the analysis general. You
want to understand in broad terms how your strategy
played out, not get caught up in the decimal points.
Security SelectionNow it’s time to move down a level and look at your
specific holdings.
If you own individual bonds and stocks, you want to
know how they’ve done in the context of the market.
You’re likely aware of how the stars and dogs have
performed, but you might not know how well you’ve
done overall. How would your returns stack up against
a professionally managed portfolio?
To calculate the return of your bond and stock holdings,
you’ll need help, either from an on-line tool or the
system your advisor uses.
With mutual funds and other pooled products, return
data is more readily available. There is a natural
tendency, however, to measure performance based on
how the funds have done during the time you’ve owned
them. In some cases, this may be a short period. You
need to resist this temptation because the analysis in no
way aligns with the reasons for buying the funds in the
first place. You based your purchase on long-term
returns and a number of other factors. Your
assessment should be based on those same factors.
Are the same people managing the fund and are they
pursuing the same philosophy? How have long-term
returns been in the context of the market environment?
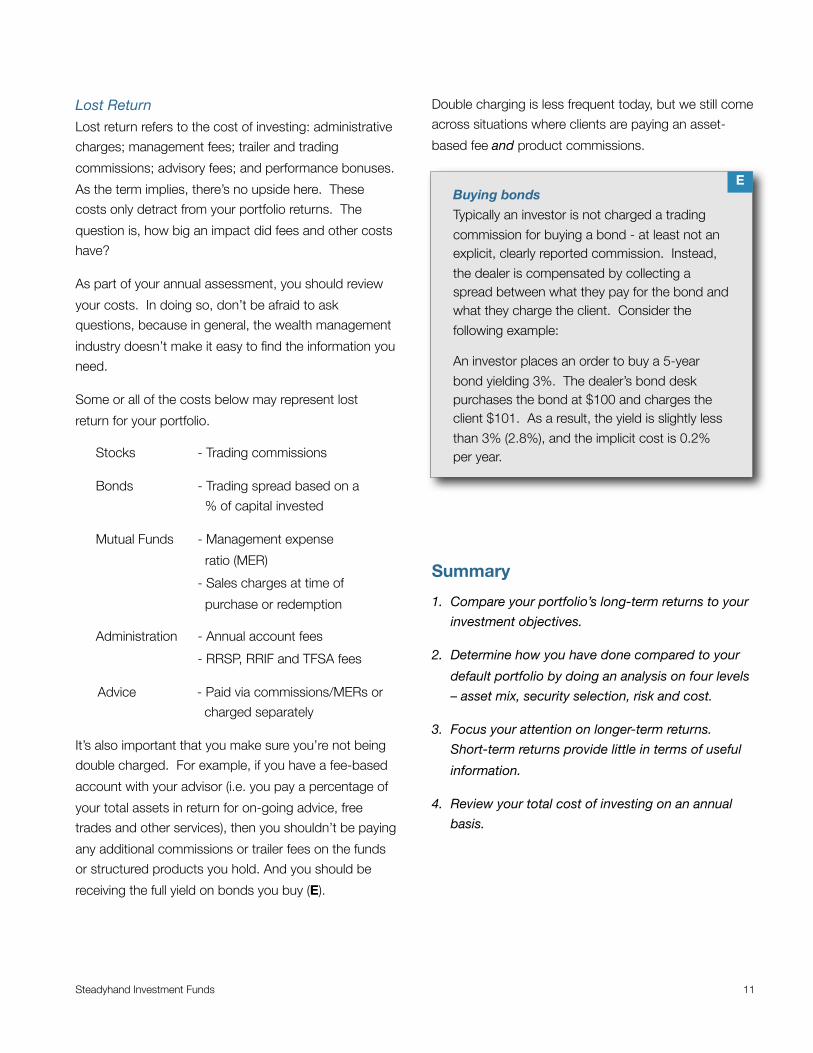
At this point, it’s time to look at how each holding has
done – has it added value to the overall portfolio by
beating its benchmark?
A mutual fund should be compared to the appropriate
market index – e.g. a Canadian equity fund versus the
S&P/TSX Composite Index. For funds that are
diversified across different asset types, fund companies
Steadyhand Investment Funds 9
1 Y 3 Y 5 Y 10 Y
Bond Fund 5.1% 4.2% 3.6% 4.8%
DEX Univ. Bond Index 6.7% 6.2% 5.3% 6.3%
Added value -1.6% -2.0% -1.7% -1.5%
International Equity Fund -2.1% -3.6% -0.6% -0.6%
MSCI EAFE Index 2.5% -6.7% -0.7% -0.6%
Added value -4.6% 3.1% 0.1% 0.0%
Balanced Fund 9.9% 5.3% 5.9% 7.7%
Benchmark* 13.3% 4.9% 6.8% 7.1%
Added value -3.4% 0.4% -0.9% 0.6%
Fund Performance - Annualized Returns
Annualized 5-Year Rolling
2001-05 2002-06 2003-07 2004-08 2005-09 2006-10
7.2% 6.5% 5.5% 4.8% 4.8% 3.6%
7.4% 6.6% 5.6% 5.5% 5.2% 5.3%
-0.2% -0.1% -0.1% -0.7% -0.4% -1.7%
0.4% 8.7% 9.6% 2.1% 3.5% -0.6%
-0.5% 8.0% 10.8% 0.7% 0.8% -0.7%
0.9% 0.7% -1.2% 1.4% 2.7% 0.1%
10.1% 11.3% 12.3% 6.7% 7.4% 5.9%
7.3% 10.8% 13.3% 5.4% 7.5% 6.8%
2.8% 0.5% -1.0% 1.3% -0.1% -0.9%
*40% DEX Universe Bond Index; 60% S&P/TSX Composite Index

are required to provide benchmark returns for that
reflect the corresponding asset mix.
Clearly, what you’re looking for is returns that are in
excess of the benchmark over the long-term. How far
a fund diverges from its benchmark depends on the
time frame, how volatile the asset class is and how
actively the manager is trying to beat the benchmark.
• Time frame: In the near team, you should expect
funds to perform quite differently from their
benchmarks. Over longer periods of time, the gap
will narrow. In this regard, it is useful to look at fund
and benchmark returns over rolling 5-year periods to
filter out some of the short-term variability.
• Asset class: In stable, lower return asset categories
(i.e. fixed income), the gap should be small for all
time periods. For equity funds, expect significant
differences.
• Fund manager: The divergence will depend on how
your manager positions the fund. Those who are
pursuing returns well in excess of their benchmark
will be significantly out of line during short time
periods. As the saying goes, “if you want to beat the
index, you have to look different than the index”.
Funds that are designed to closely track the
benchmark, however, will diverge less. At the
extreme, there are exchange-traded funds (ETFs)
that are designed to match an index. The gap
between these index funds and their benchmarks
should be narrow and explained mostly by the fee.
From the table on page 9, you can see that the Bond
Fund has not performed well over any period. It should
be sold. While the International Fund has lagged behind
the overall market in recent years, it’s long-term record
is sound. Likewise, the Balanced Fund has trailed its
benchmark recently, but has a record of adding value.
Risk
Not all 6% returns are the same. The path you take to
get there can be very different – steady growth, volatile
ups and downs and everything in between.
In theory, you shouldn’t care how bumpy the path is, but
in reality, it does impact how you manage your portfolio.
Volatility causes stress, requires more patience and
fortitude, and is more likely to lead to inappropriate or ill-
timed decisions.
A thorough discussion of risk and volatility is beyond the
scope of this report. Suffice to say that you should be
cognizant of how each investment achieves its return.
They should complement your other investments and fit
with your psychological makeup. There’s a place for
volatile investments in a diversified portfolio if you have
the stomach for them (D).
Different Roads to 6%
Steadyhand Investment Funds 10
Which are riskier - GICs or stocks?
How risky an investment is depends on what
the goals of the portfolio are. When an investor knows she will need cash from the portfolio
within the next 12–18 months, owning stocks is risky. They bounce around in the short term and could easily be down just when the money is
needed.
For younger investors who have over ten years
until retirement, holding a GIC is the risky strategy. Stocks will generate higher returns over long periods. For these investors, weak
markets are a gift, as they provide an opportunity to buy securities at reduced prices.
D
$100
$110
$120
$130
$140
$150
$160
$170
$180
$190
Dec-01 Dec-03 Dec-05 Dec-07 Dec-09
Lost ReturnLost return refers to the cost of investing: administrative
charges; management fees; trailer and trading
commissions; advisory fees; and performance bonuses.
As the term implies, there’s no upside here. These
costs only detract from your portfolio returns. The
question is, how big an impact did fees and other costs
have?
As part of your annual assessment, you should review
your costs. In doing so, don’t be afraid to ask
questions, because in general, the wealth management
industry doesn’t make it easy to find the information you
need.
Some or all of the costs below may represent lost
return for your portfolio.
Stocks - Trading commissions
Bonds - Trading spread based on a
% of capital invested
Mutual Funds - Management expense
ratio (MER)
- Sales charges at time of
purchase or redemption
Administration - Annual account fees
- RRSP, RRIF and TFSA fees
Advice - Paid via commissions/MERs or
charged separately
It’s also important that you make sure you’re not being
double charged. For example, if you have a fee-based
account with your advisor (i.e. you pay a percentage of
your total assets in return for on-going advice, free
trades and other services), then you shouldn’t be paying
any additional commissions or trailer fees on the funds
or structured products you hold. And you should be
receiving the full yield on bonds you buy (E).
Double charging is less frequent today, but we still come
across situations where clients are paying an asset-
based fee and product commissions.
Summary
1. Compare your portfolio’s long-term returns to your
investment objectives.
2. Determine how you have done compared to your
default portfolio by doing an analysis on four levels
– asset mix, security selection, risk and cost.
3. Focus your attention on longer-term returns.
Short-term returns provide little in terms of useful
information.
4. Review your total cost of investing on an annual
basis.
Steadyhand Investment Funds 11
Buying bonds
Typically an investor is not charged a trading
commission for buying a bond - at least not an explicit, clearly reported commission. Instead,
the dealer is compensated by collecting a spread between what they pay for the bond and what they charge the client. Consider the
following example:
An investor places an order to buy a 5-year
bond yielding 3%. The dealer’s bond desk purchases the bond at $100 and charges the client $101. As a result, the yield is slightly less
than 3% (2.8%), and the implicit cost is 0.2% per year.
E
SuccessFactors impacting future returns
When you’re looking at how you’re doing, it’s OK to
celebrate good results for a moment, or cry over spilt
milk, but then it’s time to move on. At the end of the
day, you don’t generate attractive returns by looking in
the rear-view mirror. A key part of your performance
review is assessing how the past is likely to impact the
future.
Into the FutureIf a stock, mutual fund or entire asset class has done
well, or poorly, what does it say about the potential for
future returns? It’s counterintuitive, but good returns
over the last 1-3 years often presage lower future
returns, just as periods of poor results can set up a
good run in the other direction.
Do laggards in the portfolio represent un-sprouted
seeds? The definitive answer is, “Sometimes”. It’s
important to understand why a holding is lagging and
how long it has persisted. If the underperformer looks a
lot like the kind of asset you like to buy – for instance,
undervalued, out-of-favour stocks – then they’re seeds.
It may be time to plant more.
Similarly, it’s important to understand why something
has done well. There is a natural tendency to deal with
the dogs and leave the stars alone (F).
Bonds are an example of what we’re talking about.
They have generated excellent returns over the last 30
years and have been especially popular lately. But by
understanding why bonds have done so well, you are in
a better position to assess how they’ll do in the future.
Since the early 1980’s, interest rates have steadily
dropped, going from the high teens to low single digits.
With every step down, bond prices went up and
investment returns were enhanced. The investor not
only collected the regular interest payments, but also
saw the capital value of the bonds increase.
Can bonds achieve the same kind of returns over the
next decade or more? The answer is No. The on-going
income level is now a modest 2-4% and there is much
less room for interest rate declines, and thus additional
price appreciation. Indeed, if interest rates rise, the
current yield will be offset by price depreciation.
As the saying goes, past performance is not an
indicator of future performance. That’s correct, but it
can tip you off to where the opportunities are and aren’t.
Beyond Past Performance – The Other
Three P’sTo assess the potential for future returns, it’s
necessary to revisit the reasons why you made an
investment in the first place. Beyond performance,
you need to assess the people, philosophy and
process of your money manager(s).
Steadyhand Investment Funds 12
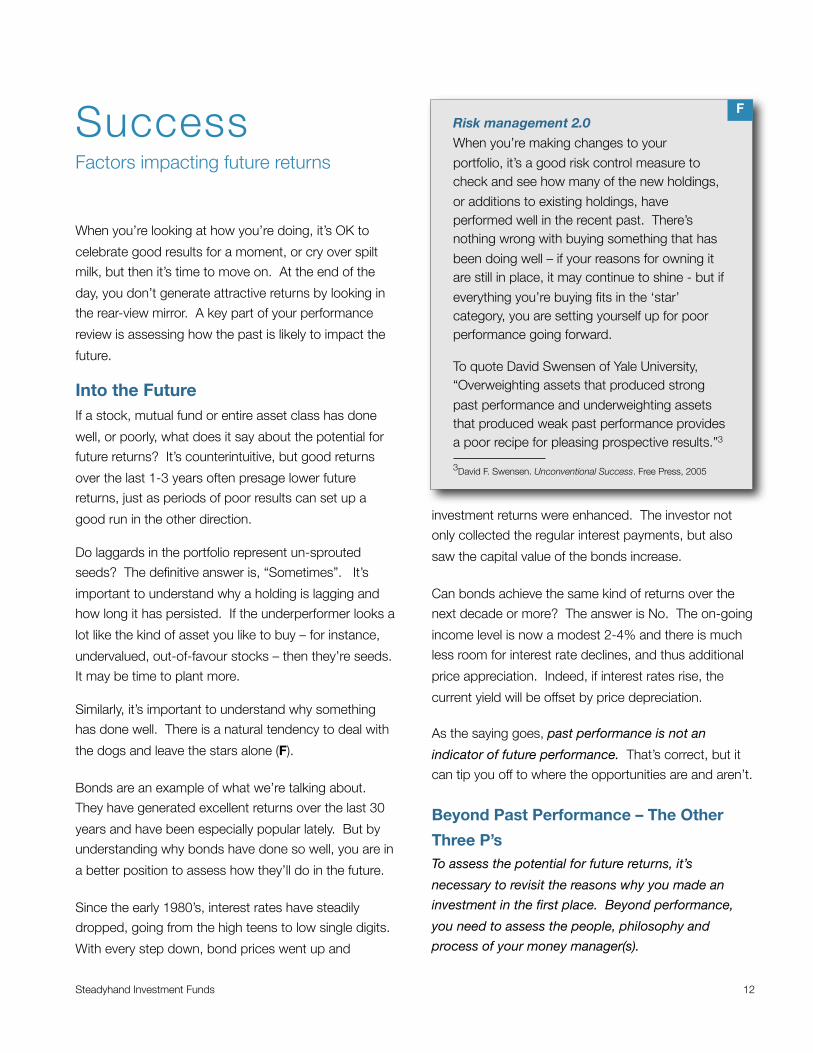
Risk management 2.0
When you’re making changes to your
portfolio, it’s a good risk control measure to check and see how many of the new holdings,
or additions to existing holdings, have performed well in the recent past. There’s nothing wrong with buying something that has
been doing well – if your reasons for owning it are still in place, it may continue to shine - but if
everything you’re buying fits in the ‘star’ category, you are setting yourself up for poor performance going forward.
To quote David Swensen of Yale University, “Overweighting assets that produced strong
past performance and underweighting assets that produced weak past performance provides a poor recipe for pleasing prospective results.”3
3David F. Swensen. Unconventional Success. Free Press, 2005
F
People – It’s important that the professionals you
trusted with your money are still there. If your advisor
has left, does his replacement fit the bill? If you bought
a mutual fund because of the manager, is she still
running it?
Philosophy and Process – This is the softer side of the
analysis. You hired your advisor or fund manager
because of their approach. Has the philosophy and
process changed from when you picked them? Do the
funds still have the same objectives? Are your ‘active’
managers being truly active, or just mirroring the index?
Security and manager selection is beyond the scope of
this report, but whatever the process you used for
buying a security, it’s important that you measure results
on the same basis. Buying for long-term reasons and
selling for short-term ones will produce unsatisfactory
returns. Indeed, short-term trading in professionally-
managed funds doesn’t make sense. You’ve hired the
manager to make the trades and adjustments for you.
With regard to underperforming funds, however, there
will be opportunities to enhance your returns. When
your analysis suggests that your mistake was in the
timing of the purchase, and not the capability of the
fund manager, then additional purchases may be
advisable.
Summary
1. Analyze the past to help position the portfolio for
the future.
2. Use the same criteria you used to purchase an
investment to evaluate it’s potential for future
returns (people, philosophy, process and long-term
performance).
3. Assess the winners as vigorously as the losers.
4. Regular re-balancing is a good risk management
tool - you’re buying assets that have
underperformed and lightening up on the best
performers. And importantly, it’s less subject to
emotion.
Steadyhand Investment Funds 13
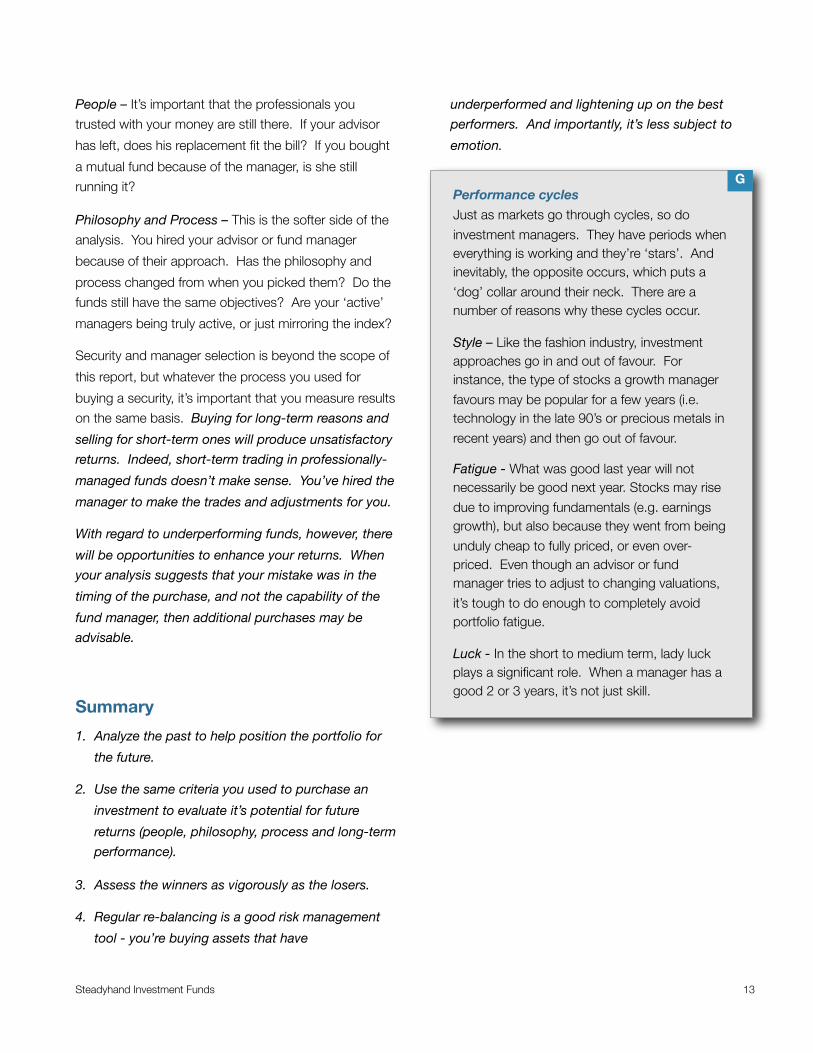
Performance cycles
Just as markets go through cycles, so do
investment managers. They have periods when everything is working and they’re ‘stars’. And inevitably, the opposite occurs, which puts a
‘dog’ collar around their neck. There are a number of reasons why these cycles occur.
Style – Like the fashion industry, investment approaches go in and out of favour. For instance, the type of stocks a growth manager
favours may be popular for a few years (i.e. technology in the late 90’s or precious metals in
recent years) and then go out of favour.
Fatigue - What was good last year will not necessarily be good next year. Stocks may rise
due to improving fundamentals (e.g. earnings growth), but also because they went from being
unduly cheap to fully priced, or even over-priced. Even though an advisor or fund manager tries to adjust to changing valuations,
it’s tough to do enough to completely avoid portfolio fatigue.
Luck - In the short to medium term, lady luck plays a significant role. When a manager has a good 2 or 3 years, it’s not just skill.
G
ActionNow what?
“Wall Street makes its money on activity. You make your
money on inactivity.” - Warren Buffett
When you come to the end of a performance
assessment, there will likely be some adjustments to
make. But as Mr. Buffett suggests, your bias should be
towards inaction. If you are working from a strategic
asset mix (SAM), have selected your investments for the
right reasons, and are managing your costs, there may
be very little to do.
The question is, do the things uncovered in the analysis
require you to take action? And more to the point, how
much under/over performance should you tolerate and
for how long?
Again, there are no easy answers to these questions.
How much underperformance depends to a large extent
on how aggressive your strategy is. If you’re seeking
returns well in excess of your default portfolio, there will
be short to medium-length periods (1-3 years) when
you’re well behind your targets (and vice versa of
course).
As for the duration, it’s important to recognize that the
biggest mistake investors make is being impatient.
They don’t give strategies enough time to play out and
as a result, trade too much and make too many
changes.
The best way to address these unanswerable questions
is to differentiate between situations that clearly require
action and ones that deserve more time.
Immediate Action Required• Consistently poor performance - If a fund has not
met its objective over longer periods and the rolling
5-year returns give you no reason for hope, then it’s
time to sell.
• Re-balancing – Not all of your holdings will perform
the same, so it’s likely that some re-balancing will be
necessary to get back to where you want your asset
mix to be.
• Change of key personnel – When a person you’ve
entrusted your assets with leaves or is removed from
his post, you need to reassess your position. In a
well constructed portfolio, which owns 5-8 funds,
there is no room for a manager who doesn’t fit. Too
often investors buy a fund because of a manager,
but don’t sell it when they leave.
• Changes to investment philosophy – Similarly, a
change of investment approach or objective requires
that you go back to square one (e.g. a growth fund
is converted to a dividend fund).
• Performance inconsistent with the mandate –
Investment returns are unpredictable, but over time
you have an expectation for how an asset should
perform. If a fund produces returns quite different
from what you expect – e.g. more volatile or too
much like the market indices – then it’s time to look
for an appropriate exit point.
• Inactive ‘active’ manager – You pay a premium fee
to have your money actively managed. If the
manager is doing little more than replicating the
index, then it’s time to move on.
• Excessive fees in general.
Patience Needed• Short-term pain – Recent performance alone is not
a reason to make changes to your portfolio.
• Experience and long-term track record – It makes
sense to give an advisor or manager more time if
they’ve proven their skill over a long period. Even
the best long-term records have bad years
imbedded in them. Patience in this case assumes,
of course, that the managers are doing the same
Steadyhand Investment Funds 14

things they were when the record and reputation
were established.
• Understanding the reasons – When
underperformance results from a definitive strategy
that hasn’t worked out yet, and it’s one that still
makes sense, then it pays to be patient.
• Aggressive managers – If your advisor or fund
manager is striving to generate returns well in excess
of the market, then you have to expect that returns
will deviate meaningfully from the benchmark. In
fact, it will be the rule, not the exception. If a fund
can go up 40% in a year, then by definition, it has the
potential to decline significantly as well.
• Extreme trends – There will be periods in a market
cycle when a particular type of security is dominating
(e.g. tech in the late 90’s; precious metals in 2010).
While you hold some of whatever it is, the
combination of a diversified asset mix and regular re-
balancing will likely prevent you from holding enough
to keep up with the overall market. The trend may
go on for a year or two, but in these circumstances,
patience is usually rewarded when the high flyers
come back to earth.
• Inappropriate securities – There will also be times
when these trends are driven by securities that are
inappropriate for your portfolio. For instance, when
highly speculative stocks are the place to be, you
may intentionally own little or nothing in this category.
• Income securities – Conservative portfolios, that
have been built to provide steady income, will
bounce around with changes in interest rates and
the stock market. This is particularly true of higher
yielding securities like corporate or emerging market
bonds, preferred shares, REITs, dividend-paying
stocks and structured products. If you still have
confidence in their ability to pay regular dividends or
distributions, then you need to focus on the income
generation as opposed to their price fluctuations.
• Asset classes – If it’s an overall asset class that’s
lagging (e.g. U.S. stocks), as opposed to a manager,
fund or individual security, you truly need to take a
long-term view. We’d go so far as say you need
infinite patience when the asset type is a component
of your SAM. It’s impossible to know when one part
of the portfolio will lead or lag (that’s why you’re
diversified) and trends can go to extremes and
extend over frustratingly long periods. For example,
U.S. stocks decisively beat Canadian stocks during
the decade of the 1990’s and just when investors
had given up on the home-grown market, the tables
turned.
You may be disappointed there aren’t always definitive
conclusions that come out of your analysis. The reality
is, assessing investment performance is more art than
science. At times, nothing will be black and white, just
grey. But the process will ensure that you don’t miss
the obvious and will highlight areas that require your
attention.
Steadyhand Investment Funds 15
Relative versus absolute returns
Should you compare your returns to a benchmark (default portfolio) or a secure
investment like a GIC? This dichotomy is often referred to as relative returns (in excess of the
benchmark) versus absolute returns (above the risk-free rate).
In a perfect world, investors want market-like
returns (relative) when everything is going up and more stable returns (absolute) when
markets are weak. In managing your portfolio, however, you need to make a choice. You can’t use one benchmark for one environment and
another for a different environment. And certainly, it would be unfair to hold an advisor or
portfolio manager to an ever-changing standard.
In the long run (more than 5 years), an investor can achieve success on both levels, but in the
nearer term, it shouldn’t be expected.
H
Looking in Both Directions This paper clearly has a bias towards ferreting out
poorly performing assets, which is natural. But you
must remember that returns are symmetrical. Markets
trend higher over time, but the ups and downs are
surprisingly even along the way. Extraordinarily good
results are often followed by less satisfactory periods.
Unfortunately, our behaviors are asymmetric – we focus
on the problems and only react to poor performance.
If you’ve done an objective, dispassionate assessment
of how you’re doing, some of your changes should
relate to situations where the asset(s) is performing
well. Factors that require immediate action can come
on both sides of the ledger (e.g. personnel changes or
excessive valuation).
Summary
1. One of the biggest mistakes investors make is
being impatient. Recent performance alone is not
a reason to make changes to your portfolio.
2. There will be discoveries in the performance review
that require immediate attention. They include:
consistently poor performance, the portfolio being
out of balance with your strategic asset mix;
personnel or philosophy changes at your
managers; and excessive fees.
3. In other situations, patience will be the operative
word - underperformance from an experienced
manager; strategies that need more time to play
out; and distortions due to extreme trends in the
market.
4. A thorough performance review is symmetrical.
You should assess the holdings that are doing well,
just as you do the underperformers. You may need
to make adjustments on both sides of the ledger.
Steadyhand Investment Funds 16
Takeaways
This is important. Monitoring your portfolio is an
essential part of being a successful investor. It’s not
enough to say, “My portfolio is up, I’m OK” or, “I’m
down, time for a change”.
Once a year is enough. We recommend doing a
thorough performance review of your overall portfolio
once a year.
Long term, long term, long term. Short-term results
(less than 3 years) are essentially random and not a
good gauge of skill or strategy. Annualized returns (after
fees) over 3, 5 and 10 years are a good gauge of how
you’re doing. It’s also advisable to look at 5-year
periods using different end dates.
It’s the market. The bond and stock markets have the
most significant impact on your results. By calculating
returns for a default portfolio based on your strategic
asset mix, you’ll get a better understanding of the
environment your portfolio is operating in and how you
should be doing.
Measure your portfolio using the same factors you
used to build it. This means assessing people,
philosophy, process and long-term performance –
criteria that are indicative of skill and potential for future
returns. It makes little sense to buy a security based on
long-term factors, and then assess it, and perhaps sell
it, based on short-term results.
All parts of your portfolio won’t do well at the same
time. That’s what diversification is all about. If your
strategies are in all sync, then you’re not properly
diversified.
Satisfactory long-term returns will include extended
periods when your portfolio is declining. For equity-
oriented portfolios, the declines may extend over a
number of quarters and amount to a significant loss.
Fortunately, the opposite will be true as well.
An investment that goes up 40% has the potential to
decline significantly too. In reviewing your portfolio,
you need to resist the natural tendency to focus only on
the poor performing assets. It’s not complete to do an
‘asymmetrical’ analysis of a ‘symmetrical’ world.
Guaranteed lost return. A key part of any performance
review is an accounting of the costs associated with
managing your portfolio. Fees and commissions are an
unavoidable cause of lost return, so they need to be
managed carefully.
Look to the future. After a thorough review of past
performance, it’s time to take a look ahead. Your
assessment gives you a better understanding of how
your portfolio works and what’s important going
forward.
Patience required. There may be a need to make
adjustments after the review, but your bias should be
towards inactivity. Investors’ biggest downfall is their
propensity to make changes based on short-term
factors and emotion.
Steadyhand Investment Funds 17
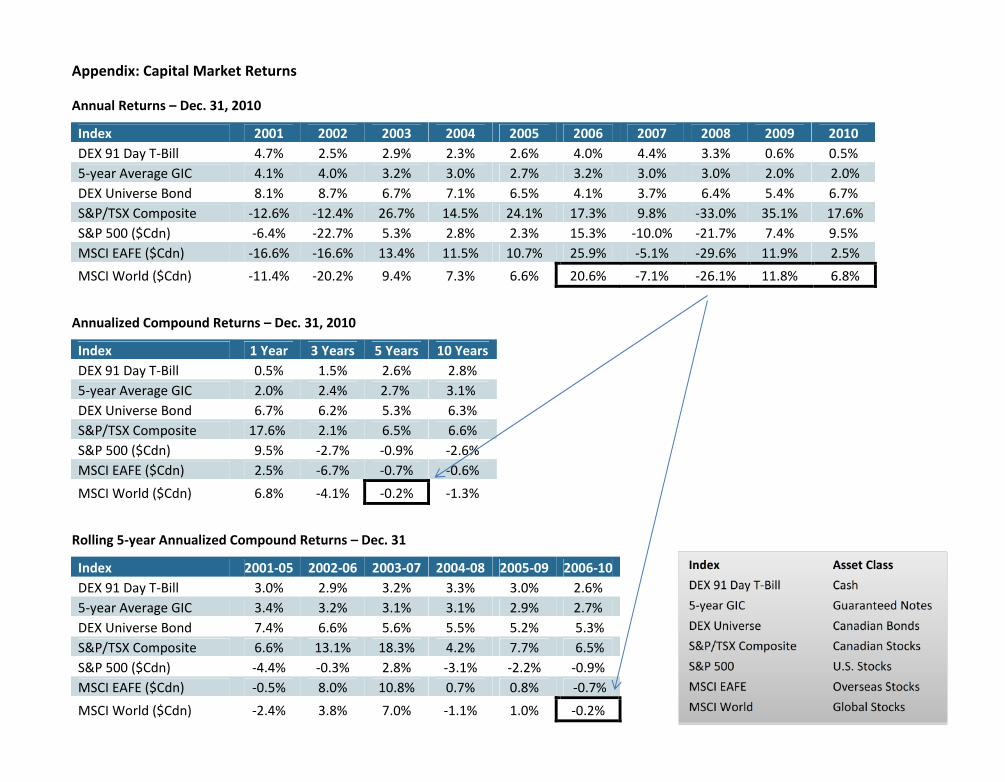
Appendix: Capital Market Returns
Annual Returns – Dec. 31, 2010
Index 2001 2002 2003 2004 2005 2006 2007 2008 2009 2010DEX 91 Day T-Bill 4.7% 2.5% 2.9% 2.3% 2.6% 4.0% 4.4% 3.3% 0.6% 0.5%5-year Average GIC 4.1% 4.0% 3.2% 3.0% 2.7% 3.2% 3.0% 3.0% 2.0% 2.0%DEX Universe Bond 8.1% 8.7% 6.7% 7.1% 6.5% 4.1% 3.7% 6.4% 5.4% 6.7%S&P/TSX Composite -12.6% -12.4% 26.7% 14.5% 24.1% 17.3% 9.8% -33.0% 35.1% 17.6%S&P 500 ($Cdn) -6.4% -22.7% 5.3% 2.8% 2.3% 15.3% -10.0% -21.7% 7.4% 9.5%MSCI EAFE ($Cdn) -16.6% -16.6% 13.4% 11.5% 10.7% 25.9% -5.1% -29.6% 11.9% 2.5%MSCI World ($Cdn) -11.4% -20.2% 9.4% 7.3% 6.6% 20.6% -7.1% -26.1% 11.8% 6.8%
Annualized Compound Returns – Dec. 31, 2010
Index 1 Year 3 Years 5 Years 10 YearsDEX 91 Day T-Bill 0.5% 1.5% 2.6% 2.8%5-year Average GIC 2.0% 2.4% 2.7% 3.1%DEX Universe Bond 6.7% 6.2% 5.3% 6.3%S&P/TSX Composite 17.6% 2.1% 6.5% 6.6%S&P 500 ($Cdn) 9.5% -2.7% -0.9% -2.6%MSCI EAFE ($Cdn) 2.5% -6.7% -0.7% -0.6%MSCI World ($Cdn) 6.8% -4.1% -0.2% -1.3%
Rolling 5-year Annualized Compound Returns – Dec. 31
Index 2001-05 2002-06 2003-07 2004-08 2005-09 2006-10DEX 91 Day T-Bill 3.0% 2.9% 3.2% 3.3% 3.0% 2.6%5-year Average GIC 3.4% 3.2% 3.1% 3.1% 2.9% 2.7%DEX Universe Bond 7.4% 6.6% 5.6% 5.5% 5.2% 5.3%S&P/TSX Composite 6.6% 13.1% 18.3% 4.2% 7.7% 6.5%S&P 500 ($Cdn) -4.4% -0.3% 2.8% -3.1% -2.2% -0.9%MSCI EAFE ($Cdn) -0.5% 8.0% 10.8% 0.7% 0.8% -0.7%MSCI World ($Cdn) -2.4% 3.8% 7.0% -1.1% 1.0% -0.2%
Index Asset ClassDEX 91 Day T-Bill Cash5-year GIC Guaranteed NotesDEX Universe Canadian BondsS&P/TSX Composite Canadian StocksS&P 500 U.S. StocksMSCI EAFE Overseas StocksMSCI World Global Stocks
Related Documents