How Global Is The Cryptocurrency Market? Gina C. Pieters Trinity University, Economics Department, San Antonio, Texas, USA University of Cambridge, Judge Business School—Cambridge Centre for Alternative Finance, UK Abstract Despite the size and global reach of crypto-markets we dont know how much individual countries have invested in cryptos (market exposure), what share of the market individual countries account for (market power), or how those two measures are related. Movements originating in high market power countries will impact high exposure countries, representing a new channel for financial contagion. This paper constructs multiple estimates of exposure and power, using purchases by state-issued currencies and including adjustments to account for the purchase of cryptocurrencies by other cryptocurrencies. All measures find that the market is highly concentrated in just three currencies—the US dollar, the South Korean Won, and the Japanese Yen account for over 90% of all crypto transactions. Market expo- sure and market power cannot be explained by economic size, income, financial openness, domestic stock market size, or internet access. This analysis also reveals that a country’s Bitcoin market share is not representative of a country’s crypto-market share: a warning for regulators or researchers focused exclusively on Bitcoin markets. Keywords: Bitcoin; Cryptocurrencies; International Asset Market. JEL Codes: E50, F20, F33, G15 Email address: [email protected] ( Gina C. Pieters)

Welcome message from author
This document is posted to help you gain knowledge. Please leave a comment to let me know what you think about it! Share it to your friends and learn new things together.
Transcript

How Global Is The Cryptocurrency Market?
Gina C. Pieters
Trinity University, Economics Department, San Antonio, Texas, USAUniversity of Cambridge, Judge Business School—Cambridge Centre for Alternative Finance, UK
Abstract
Despite the size and global reach of crypto-markets we dont know how much individualcountries have invested in cryptos (market exposure), what share of the market individualcountries account for (market power), or how those two measures are related. Movementsoriginating in high market power countries will impact high exposure countries, representinga new channel for financial contagion. This paper constructs multiple estimates of exposureand power, using purchases by state-issued currencies and including adjustments to accountfor the purchase of cryptocurrencies by other cryptocurrencies. All measures find that themarket is highly concentrated in just three currencies—the US dollar, the South KoreanWon, and the Japanese Yen account for over 90% of all crypto transactions. Market expo-sure and market power cannot be explained by economic size, income, financial openness,domestic stock market size, or internet access. This analysis also reveals that a country’sBitcoin market share is not representative of a country’s crypto-market share: a warning forregulators or researchers focused exclusively on Bitcoin markets.
Keywords: Bitcoin; Cryptocurrencies; International Asset Market.JEL Codes: E50, F20, F33, G15
Email address: [email protected] ( Gina C. Pieters)

1. Introduction
The FSB’s initial assessment is that crypto-assets do not pose risks to globalfinancial stability at this time. This is in part because they are small relativeto the financial system. Even at their recent peak, their combined global marketvalue was less than 1% of global GDP. In comparison, just prior to the globalfinancial crisis, the notational value of credit default swaps was 100% of globalGDP.
—Excerpt from Financial Stability Board (FSB) Chair’s Letter to to G20March 13, 2018. Emphasis added.
The crypto-market—comprised of cryptocurrencies, cryptotokens, and cryptoassets—is a
completely digital, online market that has the potential to financially connect economies
around the world: If you have access to the internet, you have access to the crypto-market.
Relative to the global financial market however, the crypto-market is small: measured in
the Billions, instead of Trillions. This has led to an assessment, encapsulated in the FSB
statement provided above, that the crypto-market does not pose risk to global financial
stability. Consequently, this requires countries to engage in country-specific regulations as
there is no perceived need to engage in a collaborative, global effort. This is problematic
as effective regulation cannot occur at a country-level. The promise of the decentralized
ledger technology upon which the crypto-market is based is that centralized agents —such
as financial intermediaries who are the usual focus of financial regulations—are no longer
necessary.
Even if the crypto-market does not pose a threat a global financial stability it does
not necessary follow that it does not pose a threat to the financial stability of individual
countries. This paper is the first to attempt to examine whether all countries equally exposed
to the crypto-market, or whether the crypto-market exposure (relative to the country’s
financial market) varies across countries. I also examine whether the crypto-market exposure
correlates with crypto-market power: If one country is highly exposed, but also wields a lot
of power the financial threat posed by the crypto-market is a domestic one, not one of global
financial contagion.
2

I consider multiple measures based on share of national currency transactions in the
crypto-market, including an implicit currency exposure measure that replaces all crypto-to-
crypto purchases with their underlying fiat components.1 Regardless of measure, over 90%
of all fiat transactions are conducted in just three currencies2—the South Korean Won, the
US dollar, and the Japanese Yen—suggesting that these three currencies have significant
market power in the crypto-economy.
I compare fiat purchases of cryptos to the size of the originating country’s stock market.
The results differ widely, with the crypto-market size varying from less than 1% to over 70%
of the national stock market, with Korea, Poland, and India found to be the most exposed
economies. I find no relationship between crypto-market exposure and crypto-market power,
which suggests cryptos present a new channel for financial contagion where financial volatility
from a powerful economy could disproportionately impact more exposed economies. Neither
market power nor exposure also cannot be explained by an economy’s size, income, financial
openness, or internet access.
Hileman and Rauchs (2017b) examined the distribution of only Bitcoin purchases, and
found that Bitcoin trades are dominated by four currencies: the US dollar, the Chinese Yuan,
the Euro and the Japanese Yen. Since the time of their study, Bitcoin has come to account
for less than half of crypto-market. My paper is the first to document that the distribution
of currencies across the crypto-market is different from that of the Bitcoin-market. This
implies that, contrary to expectation, some links between economies and the crypto-market
are stronger (or weaker) than Bitcoin purchases would suggest.
In Section 2 I describe my data set: the daily transaction data from 151 exchanges for
the top 50 cryptos, while in Section 3 I construct and contrast different measures of market
shares. In Section 4 I compare measures of market power and market exposure. In Section
1For example: Suppose the US dollar is used to purchase Bitcoin, which is then used to purchaseEthereum. The Ethereum is implicitly purchased by US dollars, but this would not show in the dataset.
2I will use the term “currencies” to refer to recognized national monies, such as the US dollar, or JapaneseYen.
3

?? I show that fiat investment in the crypto-markets do not correspond to economy size,
income, or financial openness. Section 7 concludes.
2. Data
2.1. Collection
I collected the 24 hour transaction volume (measured in USD) for the fifty largest cryptos
as measured by market capitalization from CoinMarketCap3 for Saturday, December 16,
2017. The data, shown in its original form in Figure 1, contains information on the total
24-hour transaction volume for each pairing on each exchange. All volumes are measured in
USD dollars to ensure comparability. This data identifies 26 fiat currencies and 560 cryptos
that traded across 151 exchanges for the top fifty cryptos.
2.2. Off-Chain and On-Chain Transactions
By construction, this data set does not report any transactions that do not occur on ex-
changes (for example, direct wallet-to-wallet transactions), however it does capture off-chain
transactions that occur on exchanges. Off-chain transactions are transactions that are not
reported to the decentralized ledger (the blockchain), and are instead merely recorded on
the exchange’s books. Off-chaining is employed by exchanges for transactions that occur be-
tween parties registered on the exchange to reduce transactions costs and increase transaction
speed. The website blockchain.info4 reports the transaction information from the Bitcoin
blockchain, and reports that on December 16, 2017 Bitcoin’s total on-chain transaction vol-
ume was 262,598 Bitcoins. In contrast, CoinMarketCap recorded a transaction volume on
exchanges of approximately 808,042 Bitcoins. This shows that the off-chain transactions
dwarf the number of non-exchange transactions, and that focusing exclusively on data from
exchanges does not result in a significant information loss for Bitcoin. I will assume that
3http://www.coinmarketcap.com4https://blockchain.info/ It reports only the quantity of bitcoins exchanged between two wallets, it does
not report what was received in return.
4

Figure 1: Sample of Data Source
Note: Screen capture from www.coinmarketcap.com showing the raw format of the data. For each crypto (Bitcoin in the
example), Coinmarketcap reports 24-hour trade volume of pairs in each market. In the screenshot, the largest share of Bitcoin
trades, 6.30%, occurred on exchange Bitfinex in which Bitcoin were traded for $796,043,000 US dollars over the course of
24-hours.
this pattern is sufficiently true for the other 49 cryptos as well, so that exchange transaction
data reflects the majority of crypto-transactions.
2.3. Summary
Table 1 summarizes the age, market capitalization, and the the 24-hour transaction
volume of the selected cryptos, and provides the full name associated with their code ab-
breviation. While the initial selection criteria required that the cryptos be one of the fifty
largest by market capitalization (out of the 1,373 cryptos recorded as existing), the result-
ing selection varies greatly in age and transaction volume. Some are less than a month old
(GNT), while others are over five years old (BCN). Some have amongst the highest daily
transaction volume in the crypto market (BTC), while others are not in the top 10% (VERI).
5

Some cryptos are sold on over 100 exchanges (LTC), while others trade on only 2 (BNB).
Some are only sold on exchanges where no fiat currencies are accepted (KMD), while others
(BTC) are sold on over 50 exchanges that accept fiat currency.5
The total daily transaction value—including both fiat and crypto trades—is $29 billion
dollars. This is approximately one quarter of the $115 billion dollar traded daily on USA
stock markets.6 Table 2 summarizes top 20 of the 587 currencies and cryptos used as a
medium of exchange to purchase the fifty cryptos. Table 2 provides implicit evidence that
part of Bitcoin’s value comes from its high degree of convertibility: it is the only medium of
exchange, out of the 587 in the data set, that can be exchanged for all the top cryptos in the
market. The second highest convertibility comes from Ethereum, which can be exchanged
for only 42 of the top 50 cryptos, and the third is Tether, which can be exchanged for 35.
Interestingly, the volume of transactions and the variety of crypto’s a medium of exchange
can purchase is not strictly related. ADA has a higher transaction volume than DASH, but
ADA is used to buy only 3 cryptos while DASH is used to purchase 11.
Bitcoin is the most popular exchange medium. The next most popular medium, and the
most popular fiat currency, is the USA dollar, which is used to purchase 31 out of the fifty
cryptos. Two Asian currencies, the South Korean Won and the Japanese Yen, are the third
and fourth, though their combined volume is less than that of the US dollar. The fifth most
used purchasing vehicle is a crypto known as US Dollar Tether (USDT). In theory, each
USDT is backed by a US dollar held in reserve by the company Tether Limited.
3. Market Share
3.1. Construction
There is no precedent for measuring the share of a currency in the crypto-market. In
part, this question is difficult because it requires a decision on whether to include crypto-to-
5I will use implicit currency exposure to control for this difference in direct fiat access.6Imputed by dividing the total value of 2016 USA stock trades according World Bank by 365 days.
6

Table 1: Summary of the Top Fifty Crypto
Market Capitalization 24-Hour Volume ExchangesAbbreviation Full Name Launch Date Rank USD Millions Rank USD Millions Total FiatADA Cardano Sep 29, 2017 7 9,507 10 465.85 4 1ARDR Ardor Jan 1, 2018 28 921 61 16.57 8 1ARK Ark Mar 21, 2017 38 473 78 12.42 7 2BCC BitConnect Jul 23, 2017 16 2,167 51 30.02 9 1BCH Bitcoin Cash Aug 1, 2017 3 30,135 7 1,057.27 97 41BCN Bytecoin Jul 4, 2012 31 652 96 8.96 3 0BNB Binance Coin Jul 14, 2017 41 439 31 47.94 2 0BTC Bitcoin Jan 3, 2009 1 324,300 1 15,639.73 94 55BTG Bitcoin Gold Nov 12, 2017 11 4,886 22 141 33 16BTS BitShares Jul 19, 2014 25 1,105 25 93.934 15 0DASH Dash Jan 18, 2014 8 7,082 18 171.47 71 27DCR Decred Feb 8, 2016 35 533 136 6.12 7 1DOGE Dogecoin Dec 6, 2013 32 638 23 13 44 8EMC2 Einsteinium Mar 1, 2014 42 414 34 41.08 3 0EOS EOS Jun 26, 2017 12 4,667 9 549.85 33 7ETC Ethereum Classic Jul 30, 2015 14 3,423 6 1142.45 50 14ETH Ethereum Oct 25, 2016 2 66,470 2 2089.92 97 39GBYTE Byteball Bytes Dec 25, 2016 46 374 40 38.29 3 0GNT Golem Dec 20, 2017 50 333 100 7.40 15 1HSR Hshare Jul 5, 2017 27 999 26 105.16 19 3KMD Komodo Sep 14, 2016 39 473 66 14.27 5 0LSK Lisk Jul 24, 2016 23 1,226 33 45.89 19 6LTC Litecoin Oct 7, 2011 5 16,101 5 1,300.63 119 48MIOTA IOTA Nov 27, 2016 6 10,155 13 288.02 8 3MONA MonaCoin Jan 1, 2014 29 791 69 20.18 11 3NEO NEO Oct 1, 2016 15 3,152 21 157.97 24 7NXT Nxt Nov 24, 2013 30 681 30 65.97 14 3OMG OmiseGO Jun 23, 2017 20 1,434 12 30 30 7PIVX PIVX Jan 29, 2016 48 341 123 5.87 10 3PPT Populous Jun 24, 2017 19 1,981 114 6.01 5 0QASH QASH Nov 8, 2017 45 385 42 39.77 8 2QTUM Qtum Mar 17, 2017 18 2,143 8 751.38 32 7REP Augur Oct 5, 2016 40 461 64 15.91 16 4SALT SALT Aug 15, 2017 37 506 54 22.11 5 0SC Siacoin Jun 7, 2015 44 387 90 14.5 6 0SNT Status Jun 17, 2015 43 411 27 77.22 15 0STEEM Steem Mar 24, 2016 36 525 120 5.55 5 0STRAT Stratis Aug 9, 2016 26 1,055 39 38.55 14 5TRON/TRX TRON Sep 9, 2017 17 2,146 11 419.57 12 1USDT Tether May 1, 2014 24 1,126 3 1,642.93 24 5VERI Veritaseum May 26, 2017 34 542 183 1.82 4 0VTC Vertcoin Jan 10, 2014 49 335 60 17.72 9 2WAVES Waves May 31, 2016 21 1,343 29 69.37 21 8XEM NEM Mar 31, 2015 9 5,881 24 96.93 18 5XLM Stellar Lumen Jul 31, 2014 13 3,754 14 210.55 20 5XMR Monero Apr 28, 2014 10 5,022 19 159.87 31 11XRB RaiBlocks Oct 4, 2015 47 351 115 6.28 4 1XRP Ripple Dec 20, 2012 4 29,174 4 1,390.58 60 29XVG Verge Sep 9, 2014 33 577 15 246.23 10 2ZEC ZCash Oct 28, 2016 22 1,323 20 155.40 47 16Total 553,302 29.402.84 151 94
Note: Market Capitalization is USD price multiplied by the quantity of coins in circulation, and is obtained from CoinMarket-
Cap. The 24-Hour transaction volume is also measured in USD and obtained from CoinMarketCap. A large market cap does
not correspond to large transaction volume (DCR), or vice verce (USDT). The cryptos have a mixture of ages: some are less
than a month old (GNT), while others are almost five years old (XRP). Exchanges-Total is the number of exchanges where
transactions in the indicated crypto occur, while Exchanges-Fiat is the number of exchanges that trade the crypto on which
fiat transactions have occurred.
7
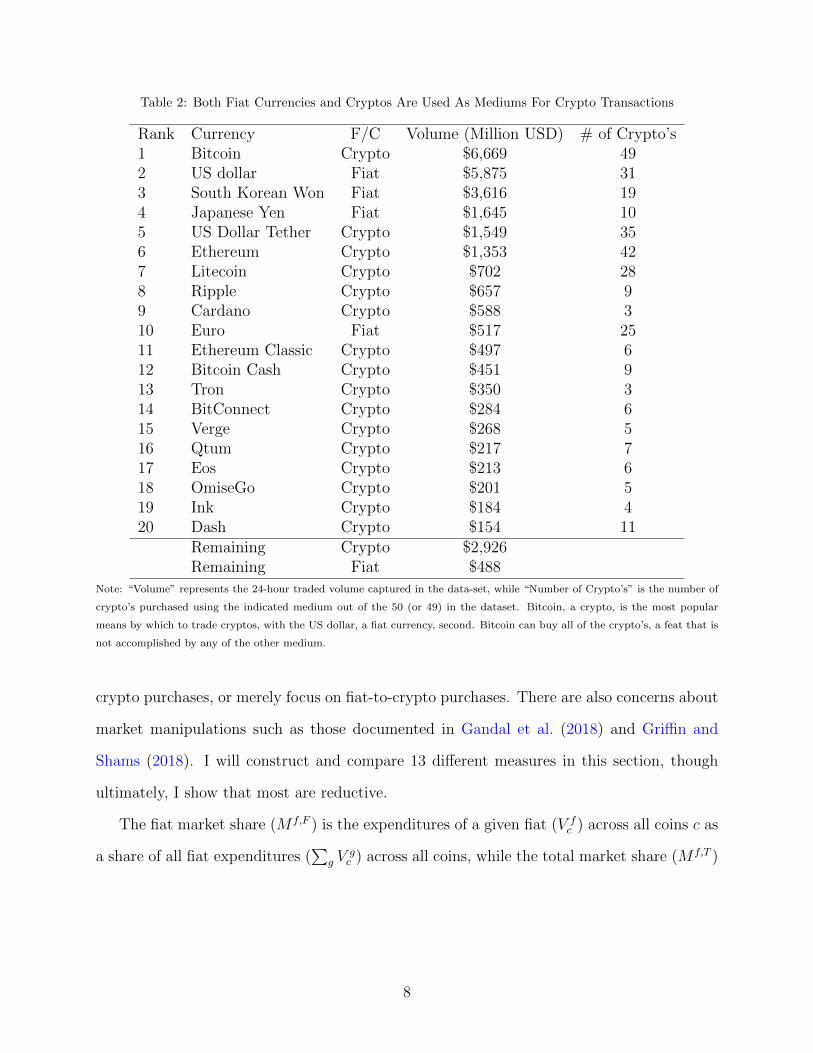
Table 2: Both Fiat Currencies and Cryptos Are Used As Mediums For Crypto Transactions
Rank Currency F/C Volume (Million USD) # of Crypto’s1 Bitcoin Crypto $6,669 492 US dollar Fiat $5,875 313 South Korean Won Fiat $3,616 194 Japanese Yen Fiat $1,645 105 US Dollar Tether Crypto $1,549 356 Ethereum Crypto $1,353 427 Litecoin Crypto $702 288 Ripple Crypto $657 99 Cardano Crypto $588 310 Euro Fiat $517 2511 Ethereum Classic Crypto $497 612 Bitcoin Cash Crypto $451 913 Tron Crypto $350 314 BitConnect Crypto $284 615 Verge Crypto $268 516 Qtum Crypto $217 717 Eos Crypto $213 618 OmiseGo Crypto $201 519 Ink Crypto $184 420 Dash Crypto $154 11
Remaining Crypto $2,926Remaining Fiat $488
Note: “Volume” represents the 24-hour traded volume captured in the data-set, while “Number of Crypto’s” is the number of
crypto’s purchased using the indicated medium out of the 50 (or 49) in the dataset. Bitcoin, a crypto, is the most popular
means by which to trade cryptos, with the US dollar, a fiat currency, second. Bitcoin can buy all of the crypto’s, a feat that is
not accomplished by any of the other medium.
crypto purchases, or merely focus on fiat-to-crypto purchases. There are also concerns about
market manipulations such as those documented in Gandal et al. (2018) and Griffin and
Shams (2018). I will construct and compare 13 different measures in this section, though
ultimately, I show that most are reductive.
The fiat market share (M f,F ) is the expenditures of a given fiat (V fc ) across all coins c as
a share of all fiat expenditures (∑
g Vgc ) across all coins, while the total market share (M f,T )
8

uses all fiat and crypto (V dc ) expenditures.
M f,F =
∑c V
fc∑
c
∑g V
gc
(1)
M f,T =
∑c V
fc∑
c
(∑g V
gc +
∑d V
dc
)The purchase share (P f,F ) differs from the market share in the denominator value. Pur-
chase share uses only the market transaction value of cryptos purchased by the considered
fiat, not the the entire market of cryptos.
P f,F =
∑c V
fc∑
c|V fc >0
∑g V
gc
(2)
P f,T =
∑c V
fc∑
c|V fc >0
(∑g V
gc +
∑d V
dc
)The denominator associated with the Purchase Share will always be less than or equal
to that of the equivalent Market Share, so the purchase share of any given fiat will always
be greater than or equal to that of its market share (P f,F ≥M f,F and P f,T > M f,T ).
Suppose ExampleFiat (EF) purchases $100 of Crypto1 (C1), $200 of Crypto2 (C2), and
$0 of Crypto 3 (C3), while the total fiat purchases of Crypto1, Crypto2, and Crypto3 is
$500 each. The Market Share of Example Fiat is MEF,F = $100+$200+$0$500+$500+$500
= 0.20, while the
Purchase Share is PEF,F = $100+$200$500+$500
= 0.30.
I also use measures that reflect the diffusion of a currency across cryptos. The fiat share of
a currency for a given crypto (Sf,Fc ) is the USD denominated value of a given fiat currency’s
(f) purchase of the crypto (c) as a share all USD denominated fiat purchases (g) of that
crypto:
Sf,Fc =
V fc∑g V
gc
(3)
Sf,Tc =
V fc∑
g Vgc +
∑d V
dc
(4)
9

Fiat shares reveal the distribution of a fiat currency across the crypto-market. If all
cryptos are location-identical, the fiat share should be statistically similar across all cryptos
and indistinguishable from the market share, Sf,Fc = M f,F . If some cryptos are excluded
from certain markets, then it should still be the case that Sf,Fc = P f,F . The three crypto
shares of ExampleFiat in the prior example is SEF,FC1 = 100
500= 0.20, SEF,F
C2 = 200500
= 0.40,
SEF,FC3 = 0
500= 0.00. I will consider both the average and median fiat share as a potential
measure of market share.
While it is difficult for government to ban crypto purchases, it may be harder to obtain
some cryptos than others. A way around this is to purchase an easily accessible crypto, for
example Bitcoin, and then use that to purchase the desired crypto. I accommodate this
issue by calculating the implicit currency exposure for each crypto-fiat pair.7 This process
continues iteratively until all purchases by cryptos are replaced by their underlying fiat
components.
Under implicit currency exposure all fiats purchase some amount of all cryptos because
Bitcoin purchases all cryptos. Even if a fiat doesn’t purchase Bitcoin directly, the crypto(s)
it does purchase will have some exposure to Bitcoin, which then links the fiat to all other
cryptos. Because of this, the market share and the purchase share under implied currency
exposure has the same value. I will also consider the mean and the median of the fiat,
total, and implicit shares across all cryptos as a different measure of a currency’s role in the
crypto-market.
7Suppose that another crypto, ExampleCoin, is purchased only by Bitcoin. That crypto then inherits26.99% implicit exposure to the USD via the original Bitcoin purchases, assuming the same compositionof purchasers. While this is a strong assumption, there is no empirical evidence that would allow a morerefined analysis. It is highly probable that this behavior is more likely to be undertaken by highly regulatedcurrencies, such as the USD, or by fiats associated with countries using capital controls or exchange ratemanipulation (Pieters (2016)). Suppose ExampleCoin is 10% of the transaction share of another crypto,AnotherCoin. AnotherCoin would then inherent 2.699% (0.10x26.999%) exposure to the US dollar, in toaddition to whatever direct US dollar exposure AnotherCoin already contained.
10

Figure 2: Eight Different Measures of Crypto-Share
Note: N=19. Visualization of the eight different measures of shares, removing the outliers of USA, KRW, JPY, CNH+CNY
and EUR. The various measures of market shares are closely related to each other, with correlation coeffients between 0.98 and
1.00 for all except the Average Total Share (second column)
3.2. Comparing Different Measures of Market Share
The previous section described the eleven different market shares constructed: fiat market
share (M f,F ), aggregate market share (M f,T ), fiat purchase share (P f,F ), total purchase share
(P f,T ), the mean and median of the fiat share of fiat transactions (Sfc , F ), the mean and
median of the fiat share of total transactions (Sf,Tc ), the mean and the median of the implicit
share, and the implicit aggregate market share.
The median of both the fiat and total market shares are zero. Figure 2 contrasts the
remaining eight measures, excluding the outliers of USA, KRW, JPY, China (CNY+CNY),
and EUR. Except for the average total market share (Sf,Tc , second column), all measures are
clearly strongly related to each other in the graph. Their correlations coefficients all fall in
the range of 0.98 and 1.00 and for the purpose of the paper any could be used.
11
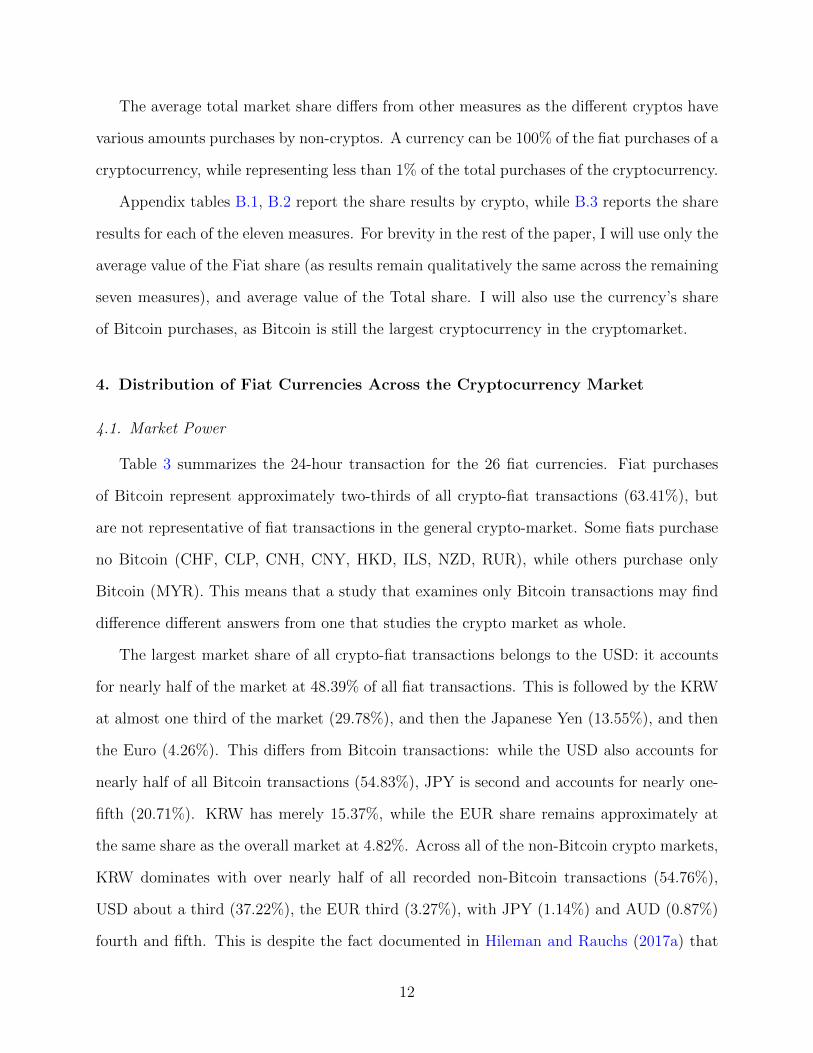
The average total market share differs from other measures as the different cryptos have
various amounts purchases by non-cryptos. A currency can be 100% of the fiat purchases of a
cryptocurrency, while representing less than 1% of the total purchases of the cryptocurrency.
Appendix tables B.1, B.2 report the share results by crypto, while B.3 reports the share
results for each of the eleven measures. For brevity in the rest of the paper, I will use only the
average value of the Fiat share (as results remain qualitatively the same across the remaining
seven measures), and average value of the Total share. I will also use the currency’s share
of Bitcoin purchases, as Bitcoin is still the largest cryptocurrency in the cryptomarket.
4. Distribution of Fiat Currencies Across the Cryptocurrency Market
4.1. Market Power
Table 3 summarizes the 24-hour transaction for the 26 fiat currencies. Fiat purchases
of Bitcoin represent approximately two-thirds of all crypto-fiat transactions (63.41%), but
are not representative of fiat transactions in the general crypto-market. Some fiats purchase
no Bitcoin (CHF, CLP, CNH, CNY, HKD, ILS, NZD, RUR), while others purchase only
Bitcoin (MYR). This means that a study that examines only Bitcoin transactions may find
difference different answers from one that studies the crypto market as whole.
The largest market share of all crypto-fiat transactions belongs to the USD: it accounts
for nearly half of the market at 48.39% of all fiat transactions. This is followed by the KRW
at almost one third of the market (29.78%), and then the Japanese Yen (13.55%), and then
the Euro (4.26%). This differs from Bitcoin transactions: while the USD also accounts for
nearly half of all Bitcoin transactions (54.83%), JPY is second and accounts for nearly one-
fifth (20.71%). KRW has merely 15.37%, while the EUR share remains approximately at
the same share as the overall market at 4.82%. Across all of the non-Bitcoin crypto markets,
KRW dominates with over nearly half of all recorded non-Bitcoin transactions (54.76%),
USD about a third (37.22%), the EUR third (3.27%), with JPY (1.14%) and AUD (0.87%)
fourth and fifth. This is despite the fact documented in Hileman and Rauchs (2017a) that
12

Table 3: Daily Crypto-market Transaction Share
Transactions (Mil. USD) Market Share (%)Name Bitcoin Crypto BTC Crypto Total Share
AUD Australian Dollar 42.68 81.50 0.55 0.67 0.36BRL Brazilian Real 25.86 30.79 0.34 0.25 0.01CAD Canadian Dollar 24.12 33.30 0.31 0.27 0.02CHF Swiss Franc - 0.36 - 0.00 0.00CLP Chilean Peso - 0.20 - 0.00 0.00CNH+CNY Offshore+Onshore Chinese Yuan - 7.34 - 0.06 0.02EUR Euro 371.46 516.76 4.82 4.26 0.60GBP British Pound 54.05 62.07 0.70 0.51 0.02HKD Hong Kong Dollar - 0.46 - 0.00 0.00IDR Indonesian Rupiah 16.78 43.68 0.22 0.36 0.23ILS Israeli New Shekel - 0.31 - 0.00 0.00INR Indian Rupee 6.13 18.26 0.08 0.15 0.02JPY Japanese Yen 1,594.73 1,645.44 20.71 13.55 1.98KRW South Korean Won 1,183.43 3,616.19 15.37 29.78 7.05MXN Mexican Peso 8.81 12.69 0.11 0.10 0.01MYR Malaysian Ringgit 3.80 3.80 0.05 0.03 0.00NZD New Zealand Dollar - 0.02 - 0.00 0.00PLN Polish Zloty 38.56 46.59 0.50 0.38 0.11RUB+RUR Russian Ruble 27.41 36.01 0.00 0.30 0.05SGD Singapore Dollar 3.68 6.38 0.05 0.05 0.01THB Thai Baht 12.29 27.82 0.16 0.23 0.07TRY Turkish Lira 41.25 52.64 0.54 0.43 0.05USD US Dollar 4,221.88 5,875.25 54.83 48.39 19.98ZAR South African Rand 22.69 24.11 0.29 0.20 0.01
Total 7,699.65 12,141.99
Note: Transaction values are in Millions of USD. The next three columns are the share of all transactions value that the
indicated currency represents: for only (fiat-based) Bitcoin transactions (BTC), the fiat crypto market (Crypto), and the total
crypto market.
54% of all new DLT ventures (ventures that create new cryptos) originate in North America,
with only 19% starting in the Asia-Pacific.
Noticeably, while all currencies within this study engage in the cryptomarket, three—
USD, KRW, and JPY—account for over 90% of fiat trades. The number of cryptocurrencies
purchased by a fiat currency does not correspond to the the market share of the fiat currency:
fiat’s used to purchase more cryptocurrencies do not necessarily have a larger market share.
4.2. Market Exposure
Table 1 showed that there were differences in exchange access to cryptos: some crypto’s
have very few purchases in fiat currencies. Table 2 revealed that there is a large variation
13

in convertibility between the various medium of exchanges and the top 50 cryptos. Table
3 summarizes the share of currencies within the crypto-market, a measure of their market
power.
In this section I will measure the market exposure of the various fiats, using two different
measures. One measure considers the diversification of the currency: a currency that invests
in only one crypto is potentially more exposed to fluctuations than one that invests in many.
The second measure considers the amount invested in the cryptocurrency market relative to
a standard, risky market accessible to retail investors: the country’s stock market.
Table 4: Transaction Shares in Crypto-market and Stock Markets (%)
Power (Share of Spending, %) Exposure
BTC Fiat-Share Total-Share Stocks # of Crypto BitcoinCrypto
(%) HHI Crypto ($)Stock ($)
(%)
AUD 0.55 0.67 0.36 0.96 7 52.37 0.32 3.74BRL 0.34 0.25 0.01 0.68 7 84.00 0.71 2.00CAD 0.31 0.27 0.02 1.39 4 72.42 0.54 1.05CHF - 0.00 0.00 1.01 1 − 1.00 0.02CLP - 0.00 0.00 0.03 1 − 1.00 0.31CNH+CNY - 0.06 0.02 22.04 6 − 0.80 0.01EUR 4.82 4.26 0.60 7.46 25 71.88 0.52 3.08GBP 0.70 0.51 0.02 2.84 10 87.08 0.77 0.96HKD - 0.00 0.00 1.63 2 − 0.95 0.01IDR 0.22 0.36 0.23 0.11 10 38.43 0.19 17.63ILS - 0.00 0.00 0.06 2 − 0.86 0.22INR 0.08 0.15 0.02 0.95 5 33.60 0.29 0.84JPY 20.71 13.55 1.98 6.30 10 96.92 0.94 11.48KRW 15.37 29.78 7.05 1.93 19 32.73 0.15 82.45MXN 0.11 0.10 0.01 0.13 3 69.73 0.52 4.14MYR 0.05 0.03 0.00 0.12 1 − 1.00 1.41NZD - 0.00 0.00 0.01 1 − 1.00 0.08PLN 0.50 0.38 0.11 0.05 10 82.82 0.69 37.26RUR+RUB 0.36 0.30 0.05 0.17 14 83.67 0.70 9.42SGD 0.05 0.05 0.01 0.23 5 57.68 0.47 1.24THB 0.16 0.23 0.07 0.39 10 44.15 0.27 3.12TRY 0.54 0.43 0.05 0.34 5 78.37 0.62 6.82USD 54.83 48.39 19.98 50.68 31 71.86 0.52 5.10ZAR 0.29 0.20 0.01 0.48 7 94.09 0.88 2.19
Note: Stock market data for EUR and GBP is 2014. # of Crypto is the number of cryptos the indicated fiat currency purchases
directly. BitcoinCrypto
calculated the indicated ratio: it is the share of the currency’s purchases in the cypto-market that are used to
purchase Bitcoin. This varies from 0% (or 32.73% if some Bitcoins are purchased) to 100%. The Normalized Herfindahl Index
ranges from 0 (unconcentrated) to 1 (concentrated) and is calculated using direct fiat purchases.Crypto ($)Stock ($)
compares the daily
value of crypto transactions to the daily value of transactions in the stock market of the indicated currency’s country.
14

4.2.1. Diversification
Table 4 shows that among fiat currencies, the US dollar (USD) has the highest convert-
ibility: it is used for direct fiat purchases of 31 of the 50 cryptos, the Euro (EUR) 25 cryptos,
and third is the South Korean Won (KRW) at 19 cryptos.
The importance of Bitcoin within each countries portfolio differs widely: Among fiat
currencies that purchase both Bitcoin and other cryptos, the relative importance of Bitcoin
varies from 32.73% (KRW) to 96.92% (JPY). Some currencies are primarily being used to
buy only Bitcoin.
To better measure diversification across the basket of cryptocurrency options, I calculate
the normalized Herfindahl Index (HHI). The Herfindahl Index can therefore be thought
of as combining the information regarding the number of cryptocurrencies purchased, and
the relative transaction value of the cryptocurrencies purchased. The HHI ranges from 0
(unconcentrated) to 1 (completely concentrated in 1 cryptocurrency) and is calculated as
HHIf =
∑Nc=1 s
f2
c − 1N
1− 1N
(5)
where sfc is the share of the cryptocurrency is the fiat currency transactions, sfc = V fc∑
c Vfc
,
and N = 50. Most fiats are highly concentrated (HHI > 0.25). The exceptions are the
moderately concentrated IDR (0.19) and KRW (0.15). This result is partially driven by
both countries that having a relatively low share of transactions in Bitcoin (38.43% and
32.73% respectively) though a low share of Bitcoin expenditures is not sufficient: both also
buy several other cryptos. For example, INR has a similar share of transactions in Bitcoin
(38.43%), but buys only 4 other cryptocurrencies and therefore has an HHI of 0.29.
All three exposure measures show that most countries are relatively undiversified with
the cryptomarket, with the possible exceptions of Korea (KRW), Indonesia (IDR), USA
(USD), and Europe (EUR) depending on the measure used.
15

4.2.2. Relative to stock market
I compare stock market transactions in the country of each fiat currency in Table 4.
Specifically, I use the USD-equivalent value of 2016 stocks transactions.8 A country’s stock
market represents a standard risky financial instrument; if individuals are purchasing cryptos
as a high-risk, high-reward investment strategy the relative sizes of countries stock market
should be correlated with the crypto market. Additionally, the stock market can be accessed
by both domestic and foreign individuals so, to the extent that a country’s crypto shares
may be inflated due to external agents, the stock market share should be also increased.
For most countries, their share of the stock market is larger than their share of crypto
market, with only six exceptions: IDR, JPY, KRW, PLN, RUR+RUB and TRY.9 I examine
the ratio of daily cryptocurrency spending to that of daily stock market transactions. For
many countries this value of small: crypto transactions are equal to only 5% of the US stock
market transactions. There are, however, exceptions. Of the exceptions, Korea is one of
the most obvious as its cryptocurrency transactions are equal to over 82% of its daily stock
market transactions. This represents a large share of financial flows into a poorly regulated
and understood market, relative to the formal (or officially counted) financial flows.
5. Crypto-Market Power and Exposure
Figure 3 contrasts three measures of market power (Bitcoin market share, fiat market
share, and total market share) and three measures of market exposure (the share of bitcoin
in the crypto transactions, the Herfindahl index, and the size of the crypto market relative
to the stock market). The USD, KRW, JPY and EUR removed from analysis as section 4
has already shown that they are outliers.
Countries that have a lot of power in the Bitcoin market (as measured by market share)
have a weakly positive correlation with Bitcoin exposure (a correlation coefficient of 0.54
8Stock trade valued is obtained from the World Bank, current USD value. Code: CM.MKT.TRAD.CD9Some have suggested that Chinese individuals are using Korean markets to access cryptos, while others
suggest that Korea is in a crypto-craze.
16

Figure 3: Market Power and Market Exposure
Note: N=20, removed the outliers of USA, KRW, JPY, and EUR. Visualization of Power (Market Share) and Exposure (size
of crypto transactions relative to stock market transactions) in Table 4.
with a significance level of 0.06). Otherwise, Bitcoin market share does not correlate with
any measure of market exposure. This implies that policy makers cannot use the Bitcoin
market to determine whether their country is vulnerable to the cryptocurrency market.
Countries that have a high fiat (or total) market share tend to be more diversified, as
measured by the Herfindahl index (a correlation coefficient of -0.54 with a significance level
of 0.01) implying that they are more robust to swings in cryptocurrency markets. However,
they are also weakly more likely to have higher exposure when comparing crypto transaction
volume to stocks (a correlation coefficient of 0.45 with a significance level of 0.05), which
implies that a larger share of financial wealth is engaged in the cryptocurrency market.10
10It should be noted that these correlation coefficients are all sampled from a small sample size of only 20countries.
17
Therefore, countries that have invested heavily in the crypto-market relative to their
domestic stock market (high exposure) may feel volatility from the crypto-market more
keenly than those who are less invested, but they are also more diversely invested which
provides some protection from a cryptocurrency-specific downswing. On one hand, cryptos
represent a diversification asset (Bouri et al. (2017)), so this represents a reduction in home-
biased investment. On the other, the crypto market is dominated by only three economies
so that an economic crisis in one can generate contagion in the crypto-market which could
then spread to the exposed economies.
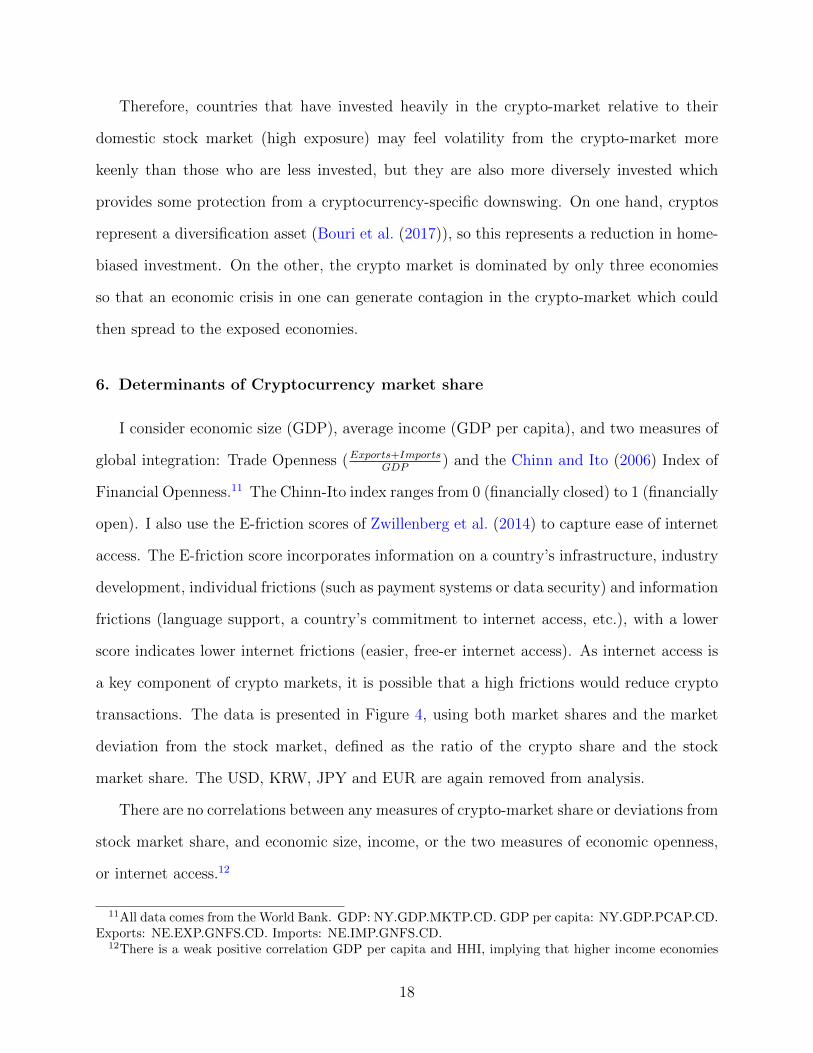
6. Determinants of Cryptocurrency market share
I consider economic size (GDP), average income (GDP per capita), and two measures of
global integration: Trade Openness (Exports+ImportsGDP
) and the Chinn and Ito (2006) Index of
Financial Openness.11 The Chinn-Ito index ranges from 0 (financially closed) to 1 (financially
open). I also use the E-friction scores of Zwillenberg et al. (2014) to capture ease of internet
access. The E-friction score incorporates information on a country’s infrastructure, industry
development, individual frictions (such as payment systems or data security) and information
frictions (language support, a country’s commitment to internet access, etc.), with a lower
score indicates lower internet frictions (easier, free-er internet access). As internet access is
a key component of crypto markets, it is possible that a high frictions would reduce crypto
transactions. The data is presented in Figure 4, using both market shares and the market
deviation from the stock market, defined as the ratio of the crypto share and the stock
market share. The USD, KRW, JPY and EUR are again removed from analysis.
There are no correlations between any measures of crypto-market share or deviations from
stock market share, and economic size, income, or the two measures of economic openness,
or internet access.12
11All data comes from the World Bank. GDP: NY.GDP.MKTP.CD. GDP per capita: NY.GDP.PCAP.CD.Exports: NE.EXP.GNFS.CD. Imports: NE.IMP.GNFS.CD.
12There is a weak positive correlation GDP per capita and HHI, implying that higher income economies
18

Figure 4: Market Share And Economic Measures
Note: N=20. Comparison of market share and five economic properties, removing the outliers of USA, KRW, JPY, CNH+CNY
and EUR.
are more likely to diversify. Small sample warning applies.
19
7. Conclusion
Much like the internet that came before it, cryptos promise an increased linkage between
economies. This paper has established that the fiat purchases of Bitcoin are not a good
representation crypto market share, and introduced three different measures to accommo-
date the increasingly fragmented nature of the market when gauging market share: Direct,
Purchase, and Implicit. The different measures affect the ranking for mid-rank fiats that
have have concentrated purchasing in a few cryptos, and can increase or decrease the market
share of each fiat.
All three measures reveal that while these digital financial instruments have the potential
to link economies and increase financial flows, just three currencies—the KRW, USD, and
JPY—account for over 90% of crypto transactions, with the top four—KRW, USD, JPY,
and EUR—accounting for over nearly 95%. The size of these transactions do not follow the
relative sizes of the stock markets associated with these fiats, nor can this concentration
be explained by by the relative economic size, income, or openness of the economy. Some
currencies with large exposures to the crypto-market which may lead to an benefit from this
new digital economy by reducing home-bias and increasing diversification, or it may lead a
detrimental effect due to a new avenue of financial contagion that is much harder to shut
down using standard economic policy tools.
20

References
Bouri, E., Molnar, P., Azzi, G., Roubaud, D., Hagfors, L. I., March 2017. On the hedge and
safe haven properties of Bitcoin: Is it really more of a diversifier? Journal of Appliled
Economics 49 (50), 5063–5073.
Chinn, M. D., Ito, H., October 2006. What Matters for Financial Development? Capital
Controls, Institutions, and Interactions. Journal of Development Economics 81 (1), 163–
192.
Gandal, N., Hamrick, J. T., Moore, T., Oberman, T., 2018. Price manipulation in the Bitcoin
ecosystem. Journal of Monetary Economics 95, 86 – 96.
Griffin, J. M., Shams, A., June 2018. Is bitcoin really un-tethered. SSRN.
Hileman, G., Rauchs, M., September 2017a. Global blockchain benchmarking study. Cam-
bridge Center for Alternative Finance. Available at https://ssrn.com/abstract=3040224.
Hileman, G., Rauchs, M., April 2017b. Global cryptocurrency bench-
marking study. Cambridge Center for Alternative Finance. Available at
https://dx.doi.org/10.2139/ssrn.2965436.
Pieters, G. C., October 2016. Bitcoin reveals exchange rates and detects capital controls..
Available at SSRN, https://dx.doi.org/10.2139/ssrn.2714921.
Zwillenberg, P., Field, D., Dean, D., 2014. The Connected World: Greasing the Wheels of
The Internet Economy. The Boston Consulting Group.
21

Appendix A. Example
Table A.5 represents an fictional, illustrative example of trades and how they would be
reported in the data collected on CoinMarketCap. F1 and F2 represent two state-issued fiat
currencies (for example, US Dollar and Euro), while C1, C2, and C3 represent 3 cryptos
(BTC, ETH, and XRP). In the underlying data, $100 of F1 is used to purchase C1, while
$250 of C1 is sold for F1. This level of distinction is not available in the reported data, which
only reveals that $350 (=$100+$250) has moved between F1 and C1. Notice that the total
value of transactions in the economy is $1140.
Table A.5: Example of the relationship between underlying market and reported CoinMarketCap data
Underlying DataF1 → C1: $100C1 → F1: $250F2 → C1: $150C1 → F2: $190F1 → C2: $210C2 → F1: $50C1 → C2: $70C2 → C1: $30C2 → C3: $30C3 → C2: $60
Reported Data}F1 ↔ C1: $350}F2 ↔ C1: $340}F1 ↔ C2: $260}C1 ↔ C2: $100}C2 ↔ C3: $90
An example of the underlying trades contrasted with the transaction data reported by coinmarketcap. F1 and F2 represent two
state-issued fiat currencies (for example, US Dollar and Euro), while C1, C2, and C3 represent 3 cryptos (for example, BTC,
ETH, and XRP). The reported data does not allow for distinction between a transfer in or out of a fiat.
The values of the data in Table A.5 is summarized in Table A.6. Notice that the summed
value of all the rows or columns in the table is $1330: greater than the true value of trans-
actions in the economy ($1140). This is because crypto-to-crypto transactions are counted
twice: for example, the $100 transaction between C1 and C2 is listed for both C1 and C2.
Table A.7 calculates the direct and implicit market shares: the two shares in which
only fiat currency purchases are in the denominator. F1 accounts for $350 transactions for
C1, F2 accounts for $340, accordingly, F1 has a 51% state-issued fiat market share in C1
($350/($350+$260)), while F2 has a 49% market share. Whether the Direct or Purchase
22

Table A.6: Market Distribution
F1 F2 C1 C2 C3 TotalC1 $350 $340 - $100 $0 $790C2 $260 $0 $100 - $90 $450C3 $0 $0 $0 $90 - $90Total $610 $340 $100 $190 $90 $1330
Market Share approach is used makes no difference for the market share calculated for an
individual crypto, but it does matter when trying to measure crypto market share overall.
When calculating the F2’s direct market share in the aggregate market, the Direct definition
yields $340/$950=36%. However, calculating this market share using the Purchase definition
yields $340/$690=49%. For F1, there is no difference in the two methods as it purchases all
the cryptos that are also bought with fiat.
Table A.7: Direct and Purchase Market Shares (%)
F1 F2 HerfindahlC1 50.7 49.3 0.500C2 100 0.00 1.000C3 - - 0.000TotalDirect 64.2 35.8Purchase 64.2 49.3Herfindahl 1.26 0.24
Table A.8 repeats the exercise of Table A.7 using total market value, instead of only fiat
transactions. Unsurprisingly, each market share is lower when also allowing crypto-crypto
transaction values than when solely considering fiat-crypto transactions. The values for the
Herfindahl index also fall for the same reason.
Finally, Table A.9 constructs the implied market share of each fiat currency: In this case
the transactions between C1 and C2, and the transactions between C2 and C3. For Crypto
C3, 100% of all transactions are with C2. One unit of C2 is 58% F1, 0% F2, 22% C1, and
23

Table A.8: Share of Total Market (%)
F1 F2 HerfindahlC1 44.3 43.0 0.381C2 57.8 0.00 0.334C3 - - 0.000TotalDirect 42.4 23.6Purchase 42.4 43.0Herfindahl 0.530 0.185
20% C3. Using this within the definition of C3 yields
C3 = 0F1 + 0F2 + 0C1 + 1C2 + 0C3 (A.1)
C3 = 0F1 + 0F2 + 0C1 + 1 (0.58F1 + 0F2 + 0.22C1 + 0.20C3) (A.2)
C3 = 0.58F1 + 0F2 + 0.22C1 + 0.20C3 (A.3)
C3 = 0.725F1 + 0.275C1 (A.4)
This therefore reduces C3 to a function of F1 and C1. This can in turn be substituted into
the definition of C2 to find that
C2 = 0.58F1 + 0.22C1 + 0.20C3 (A.5)
C2 = 0.58F1 + 0.22C1 + 0.20(0.725F1 + 0.275C1) (A.6)
C2 = 0.58F1 + 0.22C1 + 0.145F1 + 0.055C1 (A.7)
C2 = 0.725F1 + 0.275C1 (A.8)
Unsurprisingly—given that C3 is only purchased by C2—C2 and c3 has the same composi-
24

tion. Finally, solving C1 yields
C1 = 0.44F1 + 0.43F2 + 0C1 + 0.13C2 + 0C3 (A.9)
C1 = 0.44F1 + 0.43F2 + 0.13(0.725F1 + 0.275C1) (A.10)
C1 = 0.44F1 + 0.43F2 + 0.09F1 + 0.04C1 (A.11)
C1 = 0.55F1 + 0.45F2 (A.12)
Substituting this back into C2 yields that
C2 = 0.725F1 + 0.275(0.55F1 + 0.45F2) (A.13)
C2 = 0.88F1 + 0.12F2 (A.14)
With the same expression for C3. This can now be used on the values in Table A.6 to find
the Implied Market Distribution in Levels (show in Table A.9)
Table A.9: Implied Market Distribution
F1 F2 TotalC1 $436 $353 $790C2 $394 $55 $450C3 $79 $11 $90Total $909 $420 $1330
This can in turn be used to calculate the Implied Market Share, shown in Table A.10.
Table A.10: Implied Share of Total Market (%)
F1 F2 HerfindahlC1 55.2 44.8 0.505C2 87.7 12.3 0.784C3 87.7 12.3 0.784TotalShare 68.4 24.0Herfindahl 1.842 0.231
25
Appendix B. Tables And Figures
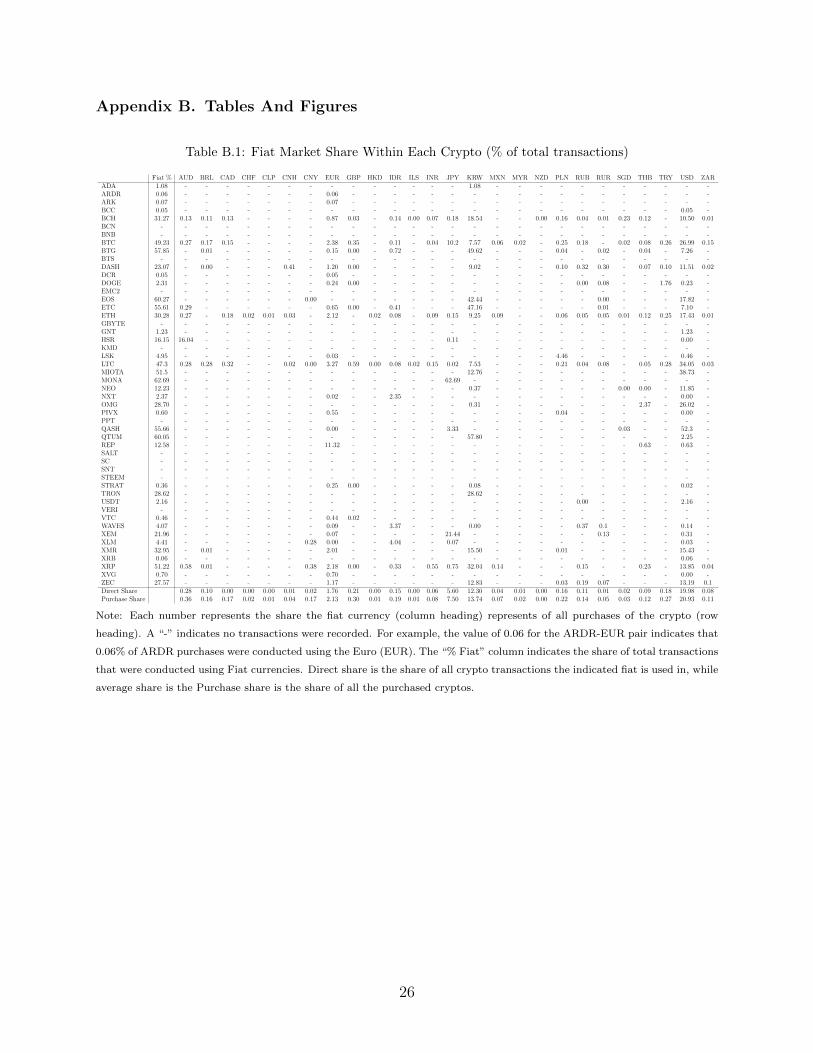
Table B.1: Fiat Market Share Within Each Crypto (% of total transactions)
Fiat % AUD BRL CAD CHF CLP CNH CNY EUR GBP HKD IDR ILS INR JPY KRW MXN MYR NZD PLN RUB RUR SGD THB TRY USD ZARADA 1.08 - - - - - - - - - - - - - - 1.08 - - - - - - - - - - -ARDR 0.06 - - - - - - - 0.06 - - - - - - - - - - - - - - - - - -ARK 0.07 - - - - - - - 0.07 - - - - - - - - - - - - - - - - - -BCC 0.05 - - - - - - - - - - - - - - - - - - - - - - - - 0.05 -BCH 31.27 0.13 0.11 0.13 - - - - 0.87 0.03 - 0.14 0.00 0.07 0.18 18.54 - - 0.00 0.16 0.04 0.01 0.23 0.12 - 10.50 0.01BCN - - - - - - - - - - - - - - - - - - - - - - - - - - -BNB - - - - - - - - - - - - - - - - - - - - - - - - - - -BTC 49.23 0.27 0.17 0.15 - - - - 2.38 0.35 - 0.11 - 0.04 10.2 7.57 0.06 0.02 - 0.25 0.18 - 0.02 0.08 0.26 26.99 0.15BTG 57.85 - 0.01 - - - - - 0.15 0.00 - 0.72 - - - 49.62 - - - 0.04 - 0.02 - 0.04 - 7.26 -BTS - - - - - - - - - - - - - - - - - - - - - - - - - - -DASH 23.07 - 0.00 - - - 0.41 - 1.20 0.00 - - - - - 9.02 - - - 0.10 0.32 0.30 - 0.07 0.10 11.51 0.02DCR 0.05 - - - - - - - 0.05 - - - - - - - - - - - - - - - - - -DOGE 2.31 - - - - - - - 0.24 0.00 - - - - - - - - - - 0.00 0.08 - - 1.76 0.23 -EMC2 - - - - - - - - - - - - - - - - - - - - - - - - - - -EOS 60.27 - - - - - - 0.00 - - - - - - - 42.44 - - - - - 0.00 - - - 17.82 -ETC 55.61 0.29 - - - - - - 0.65 0.00 - 0.41 - - - 47.16 - - - - - 0.01 - - - 7.10 -ETH 30.28 0.27 - 0.18 0.02 0.01 0.03 - 2.12 - 0.02 0.08 - 0.09 0.15 9.25 0.09 - - 0.06 0.05 0.05 0.01 0.12 0.25 17.43 0.01GBYTE - - - - - - - - - - - - - - - - - - - - - - - - - - -GNT 1.23 - - - - - - - - - - - - - - - - - - - - - - - - 1.23 -HSR 16.15 16.04 - - - - - - - - - - - - 0.11 - - - - - - - - - - 0.00 -KMD - - - - - - - - - - - - - - - - - - - - - - - - - - -LSK 4.95 - - - - - - - 0.03 - - - - - - - - - - 4.46 - - - - - 0.46 -LTC 47.3 0.28 0.28 0.32 - - 0.02 0.00 3.27 0.59 0.00 0.08 0.02 0.15 0.02 7.53 - - - 0.21 0.04 0.08 - 0.05 0.28 34.05 0.03MIOTA 51.5 - - - - - - - - - - - - - - 12.76 - - - - - - - - - 38.73 -MONA 62.69 - - - - - - - - - - - - - 62.69 - - - - - - - - - - - -NEO 12.23 - - - - - - - - - - - - - - 0.37 - - - - - - 0.00 0.00 - 11.85 -NXT 2.37 - - - - - - - 0.02 - - 2.35 - - - - - - - - - - - - - 0.00 -OMG 28.70 - - - - - - - - - - - - - - 0.31 - - - - - - - 2.37 - 26.02 -PIVX 0.60 - - - - - - - 0.55 - - - - - - - - - - 0.04 - - - - - 0.00 -PPT - - - - - - - - - - - - - - - - - - - - - - - - - - -QASH 55.66 - - - - - - - 0.00 - - - - - 3.33 - - - - - - - 0.03 - - 52.3 -QTUM 60.05 - - - - - - - - - - - - - - 57.80 - - - - - - - - - 2.25 -REP 12.58 - - - - - - - 11.32 - - - - - - - - - - - - - - 0.63 - 0.63 -SALT - - - - - - - - - - - - - - - - - - - - - - - - - - -SC - - - - - - - - - - - - - - - - - - - - - - - - - - -SNT - - - - - - - - - - - - - - - - - - - - - - - - - - -STEEM - - - - - - - - - - - - - - - - - - - - - - - - - - -STRAT 0.36 - - - - - - - 0.25 0.00 - - - - - 0.08 - - - - - - - - - 0.02 -TRON 28.62 - - - - - - - - - - - - - - 28.62 - - - - - - - - - - -USDT 2.16 - - - - - - - - - - - - - - - - - - - 0.00 - - - - 2.16 -VERI - - - - - - - - - - - - - - - - - - - - - - - - - - -VTC 0.46 - - - - - - - 0.44 0.02 - - - - - - - - - - - - - - - - -WAVES 4.07 - - - - - - - 0.09 - - 3.37 - - - 0.00 - - - - 0.37 0.1 - - - 0.14 -XEM 21.96 - - - - - - - 0.07 - - - - - 21.44 - - - - - - 0.13 - - - 0.31 -XLM 4.41 - - - - - - 0.28 0.00 - - 4.04 - - 0.07 - - - - - - - - - - 0.03 -XMR 32.95 - 0.01 - - - - - 2.01 - - - - - - 15.50 - - - 0.01 - - - - - 15.43 -XRB 0.06 - - - - - - - - - - - - - - - - - - - - - - - - 0.06 -XRP 51.22 0.58 0.01 - - - - 0.38 2.18 0.00 - 0.33 - 0.55 0.75 32.04 0.14 - - - 0.15 - - 0.23 - 13.85 0.04XVG 0.70 - - - - - - - 0.70 - - - - - - - - - - - - - - - - 0.00 -ZEC 27.57 - - - - - - - 1.17 - - - - - - 12.83 - - - 0.03 0.19 0.07 - - - 13.19 0.1Direct Share 0.28 0.10 0.00 0.00 0.00 0.01 0.02 1.76 0.21 0.00 0.15 0.00 0.06 5.60 12.30 0.04 0.01 0.00 0.16 0.11 0.01 0.02 0.09 0.18 19.98 0.08Purchase Share 0.36 0.16 0.17 0.02 0.01 0.04 0.17 2.13 0.30 0.01 0.19 0.01 0.08 7.50 13.74 0.07 0.02 0.00 0.22 0.14 0.05 0.03 0.12 0.27 20.93 0.11
Note: Each number represents the share the fiat currency (column heading) represents of all purchases of the crypto (row
heading). A “-” indicates no transactions were recorded. For example, the value of 0.06 for the ARDR-EUR pair indicates that
0.06% of ARDR purchases were conducted using the Euro (EUR). The “% Fiat” column indicates the share of total transactions
that were conducted using Fiat currencies. Direct share is the share of all crypto transactions the indicated fiat is used in, while
average share is the Purchase share is the share of all the purchased cryptos.
26

Table B.2: Implicit Fiat Share Within Each Crypto
Total % AUD BRL CAD CHF CLP CNH CNY EUR GBP HKD IDR ILS INR JPY KRW MXN MYR NZD PLN RUB RUR SGD THB TRY USD ZARADA 83.90 0.59 0.24 0.25 0.00 0.00 0.01 0.03 3.87 0.50 0.00 0.28 0.00 0.11 13.69 19.13 0.09 0.03 0.00 0.37 0.26 0.02 0.04 0.18 0.41 43.60 0.20ARDR 83.90 0.59 0.24 0.25 0.00 0.00 0.01 0.03 3.87 0.50 0.00 0.28 0.00 0.11 13.69 19.13 0.09 0.03 0.00 0.37 0.26 0.02 0.04 0.18 0.41 43.60 0.20ARK 83.90 0.59 0.24 0.25 0.00 0.00 0.01 0.03 3.87 0.50 0.00 0.28 0.00 0.11 13.69 19.13 0.09 0.03 0.00 0.37 0.26 0.02 0.04 0.18 0.41 43.60 0.20BCC 83.90 0.59 0.24 0.25 0.00 0.00 0.01 0.03 3.87 0.50 0.00 0.28 0.00 0.11 13.69 19.13 0.09 0.03 0.00 0.37 0.26 0.02 0.04 0.18 0.41 43.60 0.20BCH 83.90 0.59 0.24 0.25 0.00 0.00 0.01 0.03 3.87 0.50 0.00 0.28 0.00 0.11 13.69 19.13 0.09 0.03 0.00 0.37 0.26 0.02 0.04 0.18 0.41 43.60 0.20BCN 83.90 0.59 0.24 0.25 0.00 0.00 0.01 0.03 3.87 0.50 0.00 0.28 0.00 0.11 13.69 19.13 0.09 0.03 0.00 0.37 0.26 0.02 0.04 0.18 0.41 43.60 0.20BNB 59.43 0.42 0.16 0.18 0.00 0.00 0.01 0.02 2.77 0.34 0.00 0.21 0.00 0.08 9.04 13.64 0.07 0.02 0.00 0.25 0.18 0.02 0.03 0.13 0.30 31.43 0.13BTC 84.30 0.56 0.25 0.25 0.00 0.00 0.01 0.02 3.92 0.51 0.00 0.28 0.00 0.10 14.27 18.51 0.09 0.03 0.00 0.38 0.27 0.02 0.04 0.18 0.42 43.97 0.21BTG 93.19 0.25 0.11 0.11 0.00 0.00 0.00 0.01 1.78 0.21 0.00 0.84 0.00 0.05 5.74 57.69 0.04 0.01 0.00 0.19 0.11 0.02 0.02 0.12 0.18 25.63 0.08BTS 70.31 0.51 0.20 0.21 0.00 0.00 0.01 0.02 3.25 0.40 0.00 0.24 0.00 0.09 11.06 16.48 0.08 0.03 0.00 0.30 0.21 0.02 0.03 0.16 0.35 36.49 0.16DASH 87.54 0.45 0.18 0.20 0.00 0.00 0.42 0.02 4.20 0.38 0.00 0.22 0.00 0.08 10.38 23.73 0.07 0.02 0.00 0.38 0.52 0.32 0.03 0.21 0.43 45.11 0.17DCR 84.31 0.56 0.25 0.25 0.00 0.00 0.01 0.02 3.97 0.51 0.00 0.28 0.00 0.10 14.26 18.50 0.09 0.03 0.00 0.38 0.27 0.02 0.04 0.18 0.42 43.95 0.21DOGE 80.69 0.53 0.23 0.24 0.00 0.00 0.01 0.02 3.88 0.48 0.00 0.26 0.00 0.10 13.10 17.37 0.09 0.03 0.00 0.35 0.25 0.09 0.04 0.17 2.15 41.11 0.19EMC2 84.31 0.56 0.25 0.25 0.00 0.00 0.01 0.02 3.92 0.51 0.00 0.28 0.00 0.10 14.26 18.51 0.09 0.03 0.00 0.38 0.27 0.02 0.04 0.18 0.42 43.98 0.21EOS 93.25 0.24 0.09 0.10 0.00 0.00 0.01 0.01 1.55 0.18 0.00 0.11 0.00 0.05 5.00 50.29 0.04 0.01 0.00 0.14 0.10 0.01 0.02 0.08 0.17 34.99 0.07ETC 92.64 0.56 0.10 0.11 0.00 0.00 0.00 0.01 2.35 0.21 0.00 0.54 0.00 0.05 5.81 55.88 0.04 0.01 0.00 0.16 0.11 0.02 0.02 0.08 0.18 26.29 0.08ETH 79.85 0.66 0.13 0.32 0.02 0.01 0.03 0.02 4.30 0.27 0.02 0.26 0.00 0.15 7.65 21.71 0.14 0.02 0.00 0.26 0.19 0.06 0.04 0.24 0.48 42.73 0.12GBYTE 84.30 0.56 0.25 0.25 0.00 0.00 0.01 0.02 3.92 0.51 0.00 0.28 0.00 0.10 14.27 18.51 0.09 0.03 0.00 0.38 0.27 0.02 0.04 0.18 0.42 43.97 0.21GNT 83.83 0.57 0.23 0.26 0.00 0.00 0.01 0.02 3.91 0.47 0.00 0.28 0.00 0.11 13.10 18.85 0.10 0.03 0.00 0.36 0.25 0.02 0.04 0.19 0.42 44.41 0.19HSR 85.62 16.59 0.19 0.21 0.00 0.00 0.01 0.02 3.18 0.38 0.00 0.23 0.00 0.10 10.35 17.18 0.08 0.02 0.00 0.28 0.20 0.02 0.03 0.16 0.34 35.87 0.15KMD 84.25 0.56 0.25 0.25 0.00 0.00 0.01 0.02 3.92 0.51 0.00 0.28 0.00 0.10 14.18 18.55 0.10 0.03 0.00 0.38 0.27 0.02 0.04 0.18 0.42 43.96 0.20LSK 85.02 0.53 0.23 0.24 0.00 0.00 0.01 0.02 3.75 0.48 0.00 0.27 0.00 0.10 13.49 17.63 0.09 0.03 0.00 4.82 0.25 0.02 0.04 0.17 0.40 42.24 0.19LTC 91.04 0.60 0.41 0.45 0.00 0.00 0.02 0.01 5.28 0.85 0.00 0.23 0.02 0.21 6.92 17.82 0.05 0.02 0.00 0.40 0.17 0.09 0.02 0.15 0.50 56.70 0.13MIOTA 91.91 0.28 0.11 0.13 0.00 0.00 0.01 0.01 1.93 0.23 0.00 0.14 0.00 0.05 6.29 22.04 0.05 0.02 0.00 0.17 0.12 0.01 0.02 0.09 0.21 59.90 0.09MONA 92.69 0.20 0.09 0.09 0.00 0.00 0.00 0.01 1.39 0.18 0.00 0.10 0.00 0.04 67.77 6.59 0.03 0.01 0.00 0.14 0.09 0.01 0.02 0.06 0.15 15.64 0.07NEO 85.12 0.52 0.20 0.22 0.00 0.00 0.01 0.02 3.40 0.42 0.00 0.25 0.00 0.10 11.61 17.15 0.08 0.03 0.00 0.32 0.22 0.02 0.04 0.16 0.37 49.82 0.17NXT 84.43 0.56 0.24 0.25 0.00 0.00 0.01 0.02 3.82 0.49 0.00 2.63 0.00 0.10 13.62 18.35 0.09 0.03 0.00 0.36 0.26 0.02 0.04 0.18 0.41 42.74 0.20OMG 88.21 0.43 0.17 0.18 0.00 0.00 0.01 0.02 2.77 0.34 0.00 0.20 0.00 0.08 9.33 14.19 0.07 0.02 0.00 0.25 0.18 0.02 0.03 2.51 0.30 56.98 0.14PIVX 84.40 0.55 0.25 0.25 0.00 0.00 0.01 0.02 4.45 0.51 0.00 0.28 0.00 0.00 14.18 18.40 0.09 0.03 0.00 0.42 0.26 0.02 0.04 0.18 0.42 43.72 0.20PPT 81.78 0.62 0.18 0.29 0.01 0.01 0.02 0.02 4.14 0.38 0.01 0.27 0.00 0.13 10.51 20.33 0.12 0.02 0.00 0.31 0.23 0.04 0.04 0.22 0.46 43.26 0.16QASH 92.26 0.27 0.09 0.12 0.00 0.00 0.01 0.01 1.77 0.19 0.00 0.12 0.00 0.05 8.52 8.88 0.05 0.01 0.00 0.15 0.11 0.01 0.04 0.09 0.19 71.49 0.08QTUM 87.16 0.20 0.08 0.08 0.00 0.00 0.00 0.01 1.25 0.16 0.00 0.09 0.00 0.04 4.24 64.18 0.03 0.01 0.00 0.12 0.08 0.01 0.01 0.06 0.13 16.32 0.06REP 85.43 0.54 0.20 0.22 0.00 0.00 0.01 0.02 14.71 0.41 0.00 0.25 0.00 0.10 11.20 17.29 0.09 0.03 0.00 0.31 0.22 0.02 0.04 0.80 0.36 38.45 0.16SALT 83.48 0.58 0.23 0.26 0.00 0.00 0.01 0.02 3.98 0.47 0.01 0.28 0.00 0.11 13.05 19.13 0.10 0.03 0.00 0.36 0.25 0.02 0.04 0.19 0.43 43.71 0.19SC 84.19 0.56 0.25 0.25 0.00 0.00 0.01 0.02 3.93 0.50 0.00 0.28 0.00 0.10 14.10 18.59 0.10 0.03 0.00 0.38 0.26 0.02 0.04 0.18 0.42 43.94 0.20SNT 83.49 0.57 0.23 0.26 0.00 0.00 0.01 0.02 3.95 0.48 0.00 0.28 0.00 0.11 13.32 18.98 0.10 0.03 0.00 0.36 0.26 0.02 0.04 0.19 0.43 43.65 0.19STEEM 84.02 0.56 0.25 0.25 0.00 0.00 0.01 0.02 3.91 0.51 0.00 0.28 0.00 0.10 14.16 18.49 0.09 0.03 0.00 0.38 0.27 0.02 0.04 0.18 0.42 43.83 0.20STRAT 84.24 0.56 0.24 0.25 0.00 0.00 0.01 0.02 4.16 0.51 0.00 0.28 0.00 0.11 13.98 18.71 0.10 0.03 0.00 0.37 0.26 0.02 0.04 0.18 0.42 43.77 0.20TRON 88.09 0.42 0.16 0.19 0.00 0.00 0.01 0.02 2.86 0.33 0.00 0.20 0.00 0.08 9.10 42.39 0.08 0.02 0.00 0.25 0.18 0.02 0.03 0.14 0.31 31.18 0.13USDT 81.15 0.82 0.20 0.23 0.00 0.00 0.01 0.04 3.48 0.41 0.00 0.27 0.00 0.12 9.93 23.27 0.08 0.02 0.00 0.29 0.21 0.03 0.03 0.21 0.35 40.95 0.15VERI 80.61 0.65 0.15 0.30 0.02 0.01 0.03 0.02 4.24 0.31 0.02 0.27 0.00 0.14 8.74 21.23 0.13 0.02 0.00 0.28 0.21 0.05 0.04 0.23 0.47 42.92 0.13VTC 84.43 0.55 0.25 0.25 0.00 0.00 0.01 0.02 4.35 0.52 0.00 0.28 0.00 0.10 14.21 18.44 0.09 0.03 0.00 0.38 0.27 0.02 0.04 0.18 0.42 43.79 0.20WAVES 83.51 0.53 0.23 0.24 0.00 0.00 0.01 0.02 3.79 0.48 0.00 3.64 0.00 0.10 13.29 17.57 0.09 0.03 0.00 0.36 0.62 0.12 0.04 0.17 0.40 41.58 0.19XEM 87.69 0.44 0.19 0.20 0.00 0.00 0.01 0.02 3.14 0.39 0.00 0.22 0.00 0.08 32.42 14.54 0.07 0.03 0.00 0.29 0.21 0.15 0.03 0.14 0.33 34.61 0.16XLM 84.70 0.55 0.23 0.24 0.00 0.00 0.01 0.30 3.73 0.47 0.00 4.31 0.00 0.10 13.19 18.19 0.09 0.03 0.00 0.35 0.25 0.02 0.04 0.18 0.40 41.81 0.19XMR 89.26 0.39 0.17 0.17 0.00 0.00 0.01 0.02 4.63 0.34 0.00 0.19 0.00 0.07 9.20 28.20 0.06 0.02 0.00 0.26 0.17 0.01 0.03 0.12 0.28 44.79 0.13XRB 78.00 0.56 0.24 0.24 0.00 0.00 0.01 0.00 3.61 0.49 0.00 0.27 0.00 0.07 13.60 15.98 0.09 0.04 0.00 0.36 0.25 0.02 0.04 0.16 0.41 41.35 0.20XRP 91.56 0.86 0.12 0.12 0.00 0.00 0.00 0.39 4.03 0.24 0.00 0.47 0.00 0.60 7.25 41.30 0.20 0.03 0.00 0.18 0.28 0.01 0.02 0.32 0.20 34.82 0.13XVG 84.43 0.56 0.24 0.25 0.00 0.00 0.01 0.02 4.61 0.50 0.00 0.28 0.00 0.10 13.97 18.51 0.10 0.03 0.00 0.37 0.26 0.02 0.04 0.18 0.42 43.72 0.20ZEC 88.43 0.43 0.17 0.18 0.00 0.00 0.01 0.02 3.99 0.36 0.00 0.21 0.00 0.08 9.92 26.68 0.07 0.02 0.00 0.29 0.38 0.08 0.03 0.13 0.30 44.82 0.24Implicit Share 0.74 0.26 0.28 0.00 0.00 0.02 0.05 4.40 0.53 0.00 0.39 0.00 0.15 13.85 28.01 0.11 0.03 0.00 0.39 0.28 0.03 0.04 0.24 0.40 49.53 0.20
Note: Each number represents the implicit share of the fiat currency (column heading) based all purchases of the crypto (row
heading). For example, the value of 0.59 for the ADA-AUD pair indicates that 0.59% of ADA could be traced back to AUD.
The “Total %” column indicates the share of transactions that could be accounted for within the crypto. Implicit share is the
fiat share of crypto transactions.
27

Table B.3: Eleven Measures of Crypto-Market Share
Fiat Market (%) Total Market (%) Implicit Share (%)Number BTC Purchase Mean Median Agg. Mean Median Mean Median Agg.
AUD 7 0.55 0.77 2.07 0.00 0.67 0.36 0.00 0.84 0.56 0.74BRL 7 0.34 0.32 0.03 0.00 0.25 0.01 0.00 0.20 0.23 0.26CAD 4 0.31 0.36 0.04 0.00 0.27 0.02 0.00 0.22 0.24 0.28CHF 1 - 0.06 0.00 0.00 0.00 0.00 0.00 0.00 0.00 0.00CLP 1 - 0.03 0.00 0.00 0.00 0.00 0.00 0.00 0.00 0.00CNH 3 - 0.12 0.04 0.00 0.01 0.01 0.00 0.02 0.01 0.02CNY 4 - 0.35 0.14 0.00 0.05 0.01 0.00 0.03 0.02 0.06EUR 25 4.82 4.74 16.11 0.00 4.26 0.60 0.00 3.78 3.87 4.40GBP 10 0.70 0.61 0.13 0.00 0.51 0.02 0.00 0.42 0.47 0.53HKD 2 - 0.04 0.00 0.00 0.00 0.00 0.0 0.00 0.00 0.00IDR 10 0.22 0.41 5.54 0.00 0.36 0.23 0.00 0.00 0.00 0.30ILS 2 - 0.03 0.00 0.00 0.00 0.00 0.00 0.00 0.00 0.00INR 5 0.08 0.18 0.04 0.00 0.15 0.02 0.00 0.11 0.10 0.15JPY 10 20.71 16.34 4.58 0.00 13.55 1.98 0.00 12.91 13.41 13.85KRW 19 15.37 30.10 18.10 0.00 29.78 7.05 0.00 22.46 18.57 28.01MXN 3 0.11 0.14 0.01 0.00 0.10 0.01 0.00 0.09 0.09 0.11MYR 1 0.05 0.05 0.00 0.00 0.03 0.00 0.00 0.03 0.03 0.03NZD 1 - 0.01 0.00 0.00 0.00 0.00 0.00 0.00 0.00 0.00PLN 10 0.50 0.49 1.99 0.00 0.38 0.11 0.00 0.40 0.36 0.39RUB 10 0.36 0.32 0.25 0.00 0.27 0.03 0.00 0.24 0.25 0.28RUR 11 - 0.12 0.17 0.00 0.03 0.02 0.00 0.03 0.02 0.03SGD 5 0.05 0.07 0.02 0.00 0.05 0.01 0.00 0.04 0.04 0.04THB 10 0.16 0.27 0.30 0.00 0.23 0.07 0.00 0.23 0.18 0.24TRY 5 0.54 0.59 1.57 0.00 0.43 0.05 0.00 0.40 0.41 0.40USD 31 54.83 48.94 24.84 2.45 48.39 6.23 0.04 41.76 43.60 49.53ZAR 7 0.29 0.24 0.02 0.00 0.20 0.01 0.00 0.17 0.19 0.20
Note: Share information from Table ?? and Table B.2. Rank indicates the largest (1) to smallest (26) market share by each
transaction share.
28
Related Documents