Welcome message from author
This document is posted to help you gain knowledge. Please leave a comment to let me know what you think about it! Share it to your friends and learn new things together.
Transcript

How equitable are Healthy
Cities? Just action on the
social determinants of health
Fran Baum
Southgate Institute for Health, Society and Equity
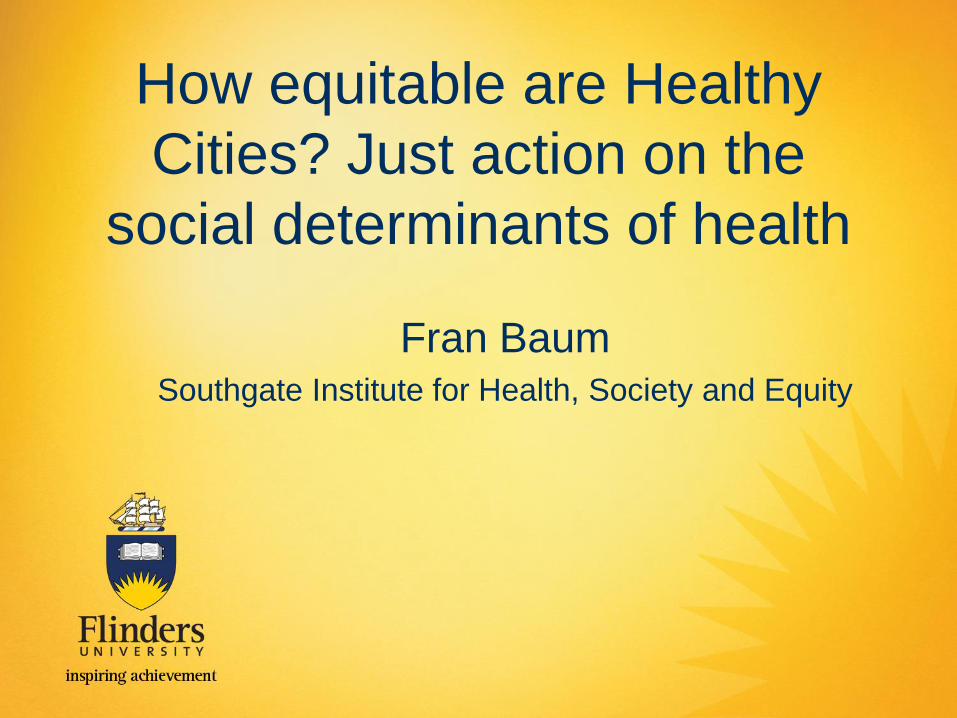
1987

Vision Building cities and communities of
peace where all citizens live in harmony,
committed to sustainable development,
respectful of diversity, reaching for the
highest possible quality of life and
equitable distribution of health,
by promoting and protecting health in all
settings.
How well has the Healthy Cities
Movement done in addressing
equitable distribution of health?
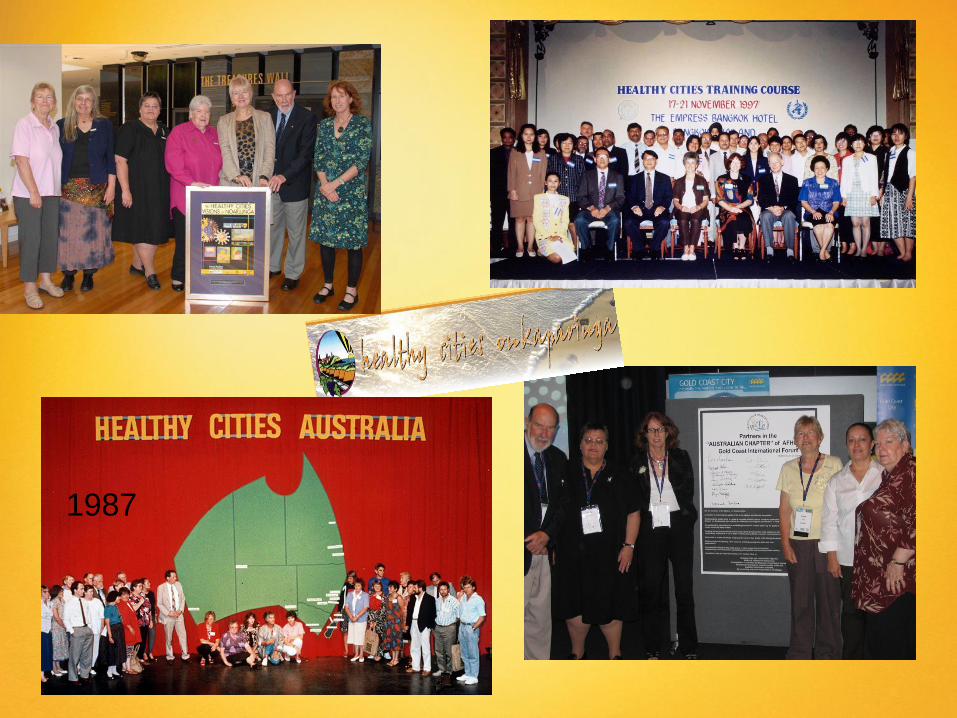
Healthy Cities face inter-related crises
Ecological and climate
crisis – increasing
disasters
Financial
crisis
austerity
politics
Social crisis – isolation, loneliness,
declining social capital. Lack of
community and solidarity, Terrorism,
fundamentalism
Health – inequities,
chronic disease, mental
illness, emerging
infectious diseases
Unfair global
economic and political
system:
• Growing inequities
• Excess wealth for
some
• Over-consumption
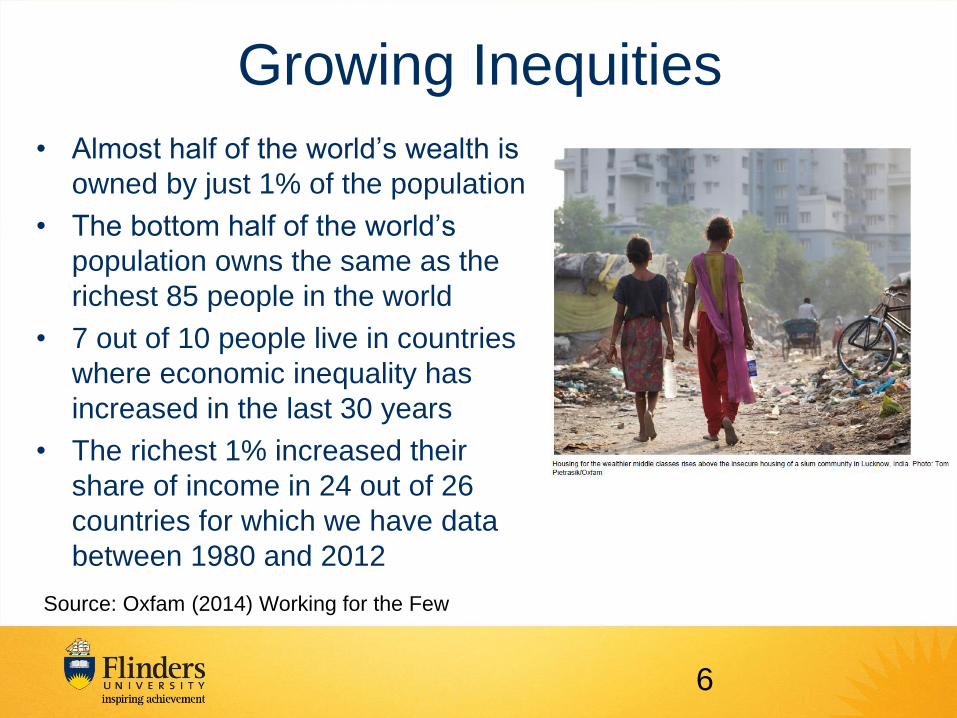
Growing Inequities
• Almost half of the world’s wealth is
owned by just 1% of the population
• The bottom half of the world’s
population owns the same as the
richest 85 people in the world
• 7 out of 10 people live in countries
where economic inequality has
increased in the last 30 years
• The richest 1% increased their
share of income in 24 out of 26
countries for which we have data
between 1980 and 2012
Source: Oxfam (2014) Working for the Few
6
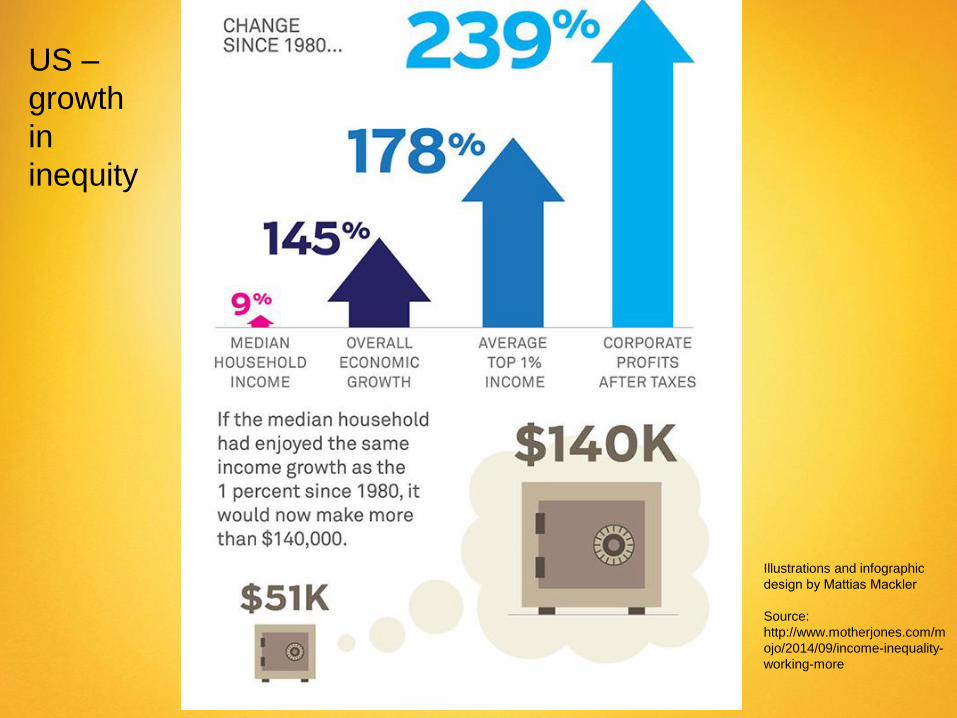
Illustrations and infographic
design by Mattias Mackler
Source:
http://www.motherjones.com/m
ojo/2014/09/income-inequality-
working-more
US –
growth
in
inequity
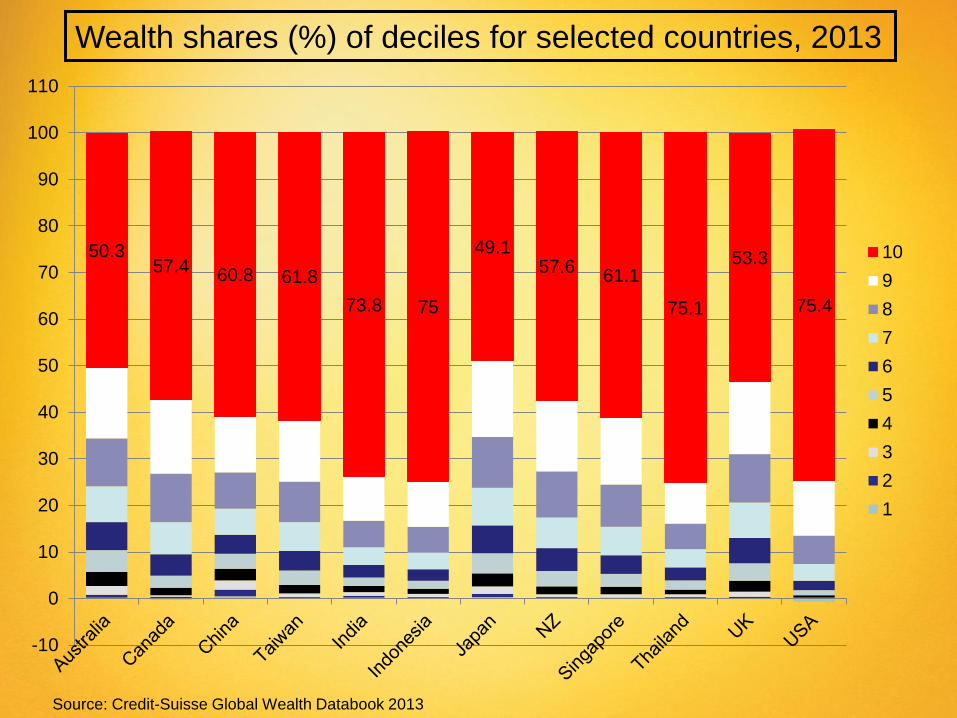
50.3 57.4
60.8 61.8
73.8 75
49.1 57.6
61.1
75.1
53.3
75.4
-10
0
10
20
30
40
50
60
70
80
90
100
110
10
9
8
7
6
5
4
3
2
1
Wealth shares (%) of deciles for selected countries, 2013
Source: Credit-Suisse Global Wealth Databook 2013
0%
2%
4%
6%
8%
10%
12%
14%
16%
18%
20%
22%
24%
1910 1920 1930 1940 1950 1960 1970 1980 1990 2000 2010
Sh
are
of to
p p
erc
en
tile
in t
ota
l in
co
me
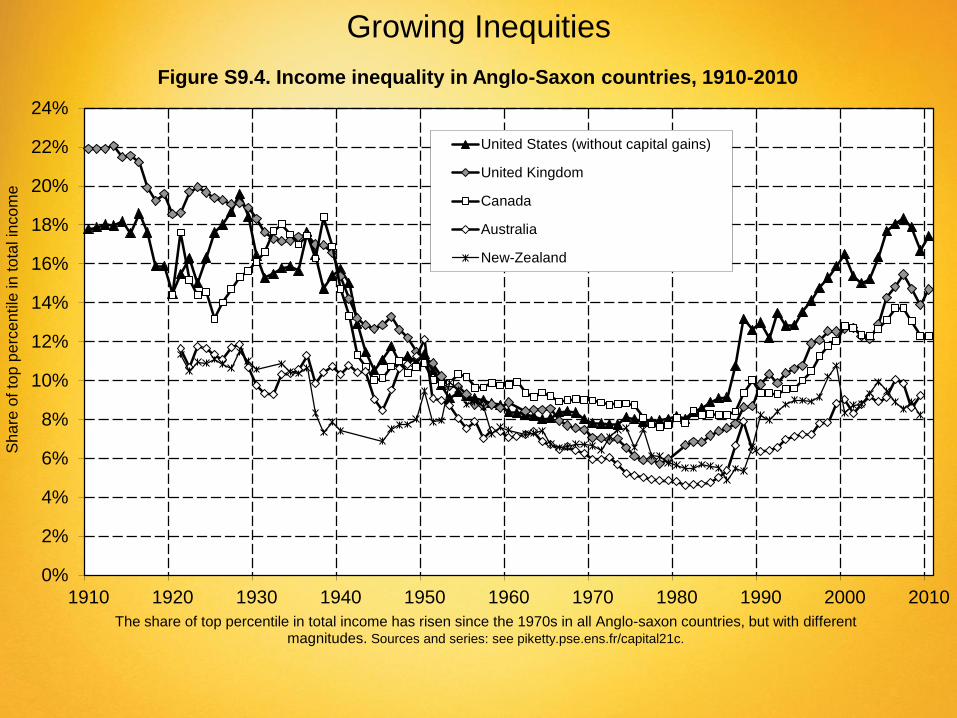
The share of top percentile in total income has risen since the 1970s in all Anglo-saxon countries, but with different magnitudes. Sources and series: see piketty.pse.ens.fr/capital21c.
Figure S9.4. Income inequality in Anglo-Saxon countries, 1910-2010
United States (without capital gains)
United Kingdom
Canada
Australia
New-Zealand
Growing Inequities
0%
2%
4%
6%
8%
10%
12%
14%
16%
18%
20%
22%
24%
26%
28%
1910 1920 1930 1940 1950 1960 1970 1980 1990 2000 2010
Sh
are
of to
p p
erc
en
tile
in t
ota
l in
co
me
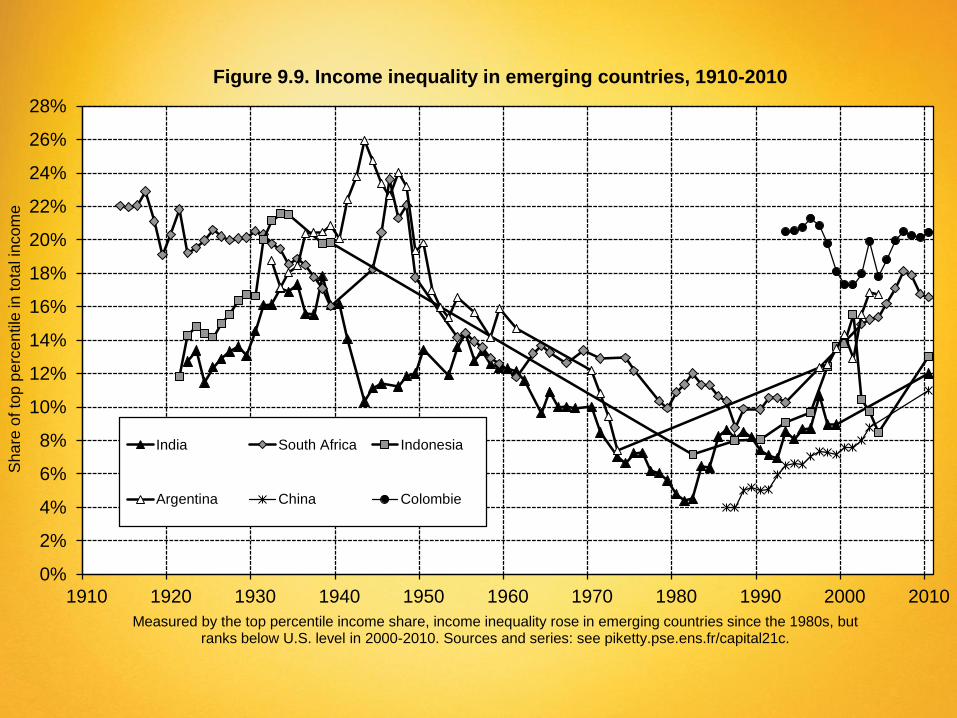
Measured by the top percentile income share, income inequality rose in emerging countries since the 1980s, but ranks below U.S. level in 2000-2010. Sources and series: see piketty.pse.ens.fr/capital21c.
Figure 9.9. Income inequality in emerging countries, 1910-2010
India South Africa Indonesia
Argentina China Colombie

0
10
20
30
40
5% 10% 25% 50% 75% 90% 95%
2010 2012
Household
income by
percentile
in 2010
and 2012
(‘000 yuan)
Source: China
Family Panel
Studies
Source: National
Bureau of
Statistics
China’s Gini
Coefficient

Economic inequities
translate into health
inequities – as a gradient
across society – not just
an issue of the “the
disadvantaged”
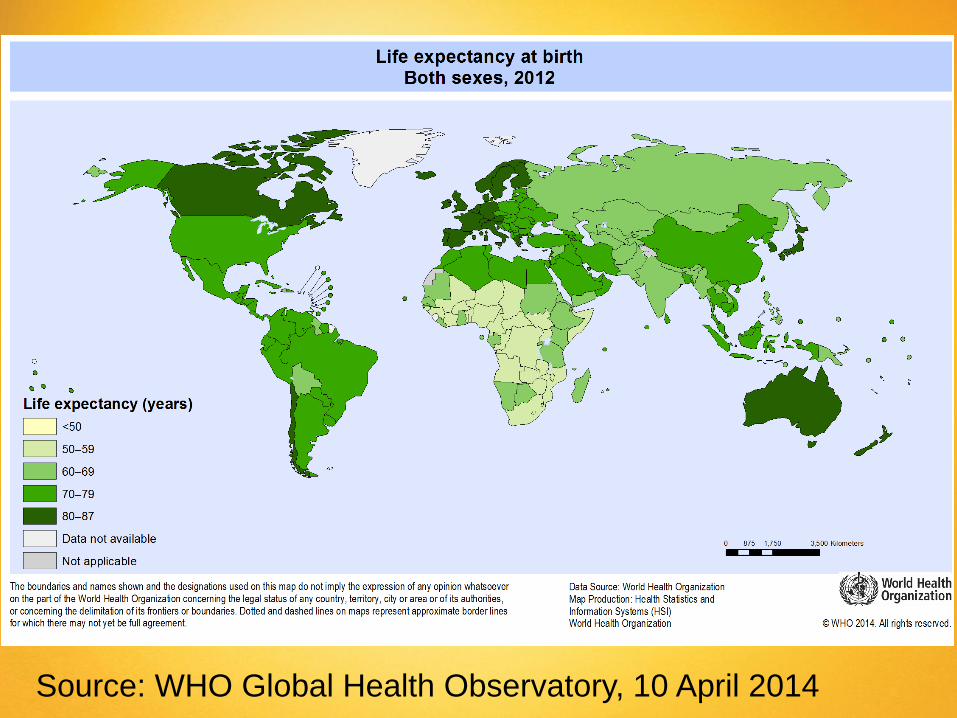
Source: WHO Global Health Observatory, 10 April 2014

Inequalities between Countries: Survival to age 65, 2012
HDI Rank
(2014)
Country Female % cohort
Male
% cohort
1 Norway 92 88
2 Australia 93 88
5 US 88 81
7 New Zealand 91 87
14 UK 91 86
15 Hong Kong,
China (SAR)
94 89
17 Japan 94 87
44 Cuba 89 83
62 Malaysia 87 77
89 Thailand 84 71
91 China 86 81
108 Indonesia 79 71
121 Vietnam 88 72
Source:
World Bank,
World
Development
Indicators
(WDI)
database
2014
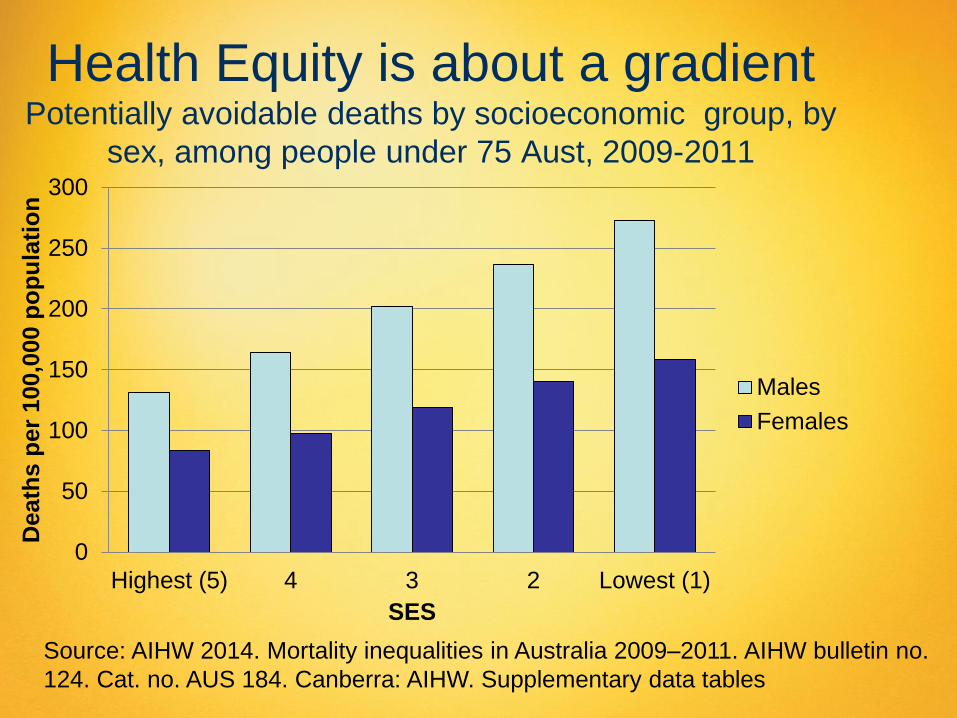
Health Equity is about a gradient Potentially avoidable deaths by socioeconomic group, by
sex, among people under 75 Aust, 2009-2011
0
50
100
150
200
250
300
Highest (5) 4 3 2 Lowest (1)
Death
s p
er
100,0
00 p
op
ula
tio
n
SES
Males
Females
Source: AIHW 2014. Mortality inequalities in Australia 2009–2011. AIHW bulletin no.
124. Cat. no. AUS 184. Canberra: AIHW. Supplementary data tables
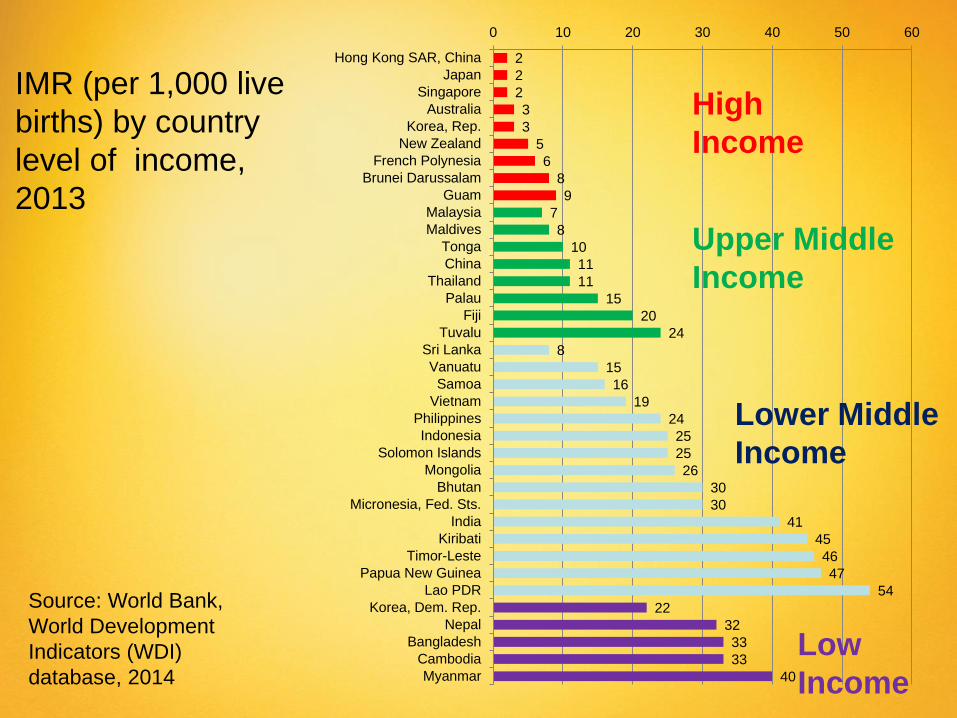
IMR (per 1,000 live
births) by country
level of income,
2013
Source: World Bank,
World Development
Indicators (WDI)
database, 2014
2
2
2
3
3
5
6
8
9
7
8
10
11
11
15
20
24
8
15
16
19
24
25
25
26
30
30
41
45
46
47
54
22
32
33
33
40
0 10 20 30 40 50 60
Hong Kong SAR, China
Japan
Singapore
Australia
Korea, Rep.
New Zealand
French Polynesia
Brunei Darussalam
Guam
Malaysia
Maldives
Tonga
China
Thailand
Palau
Fiji
Tuvalu
Sri Lanka
Vanuatu
Samoa
Vietnam
Philippines
Indonesia
Solomon Islands
Mongolia
Bhutan
Micronesia, Fed. Sts.
India
Kiribati
Timor-Leste
Papua New Guinea
Lao PDR
Korea, Dem. Rep.
Nepal
Bangladesh
Cambodia
Myanmar
Upper Middle
Income
Low
Income
Lower Middle
Income
High
Income
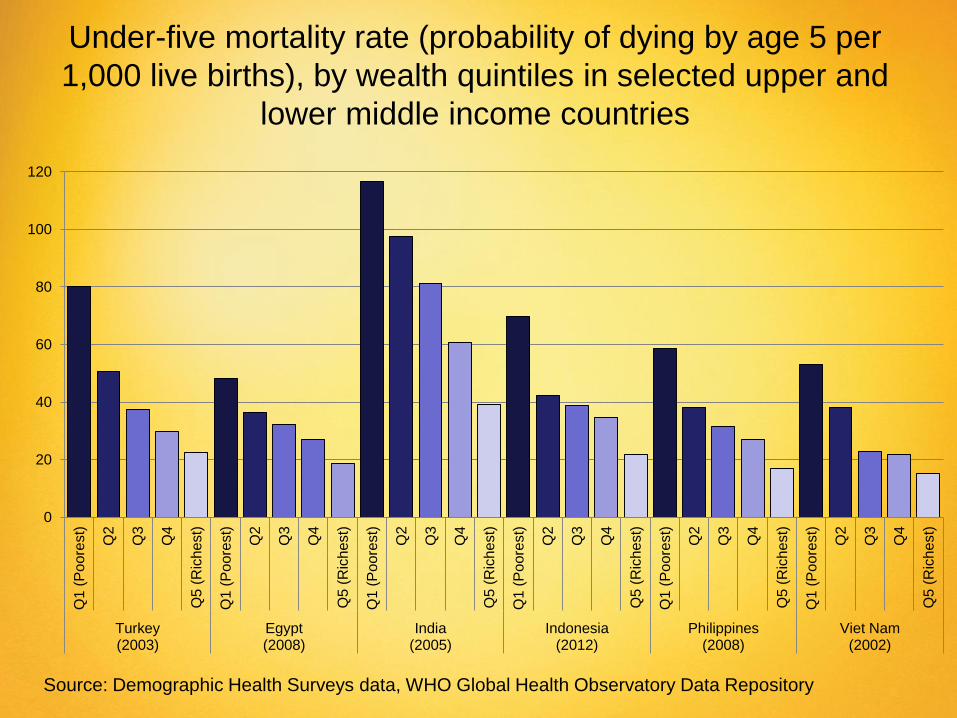
Source: Demographic Health Surveys data, WHO Global Health Observatory Data Repository
Under-five mortality rate (probability of dying by age 5 per
1,000 live births), by wealth quintiles in selected upper and
lower middle income countries
0
20
40
60
80
100
120
Q1
(P
oore
st)
Q2
Q3
Q4
Q5 (
Ric
hest)
Q1
(P
oore
st)
Q2
Q3
Q4
Q5
(R
ich
est)
Q1
(P
oore
st)
Q2
Q3
Q4
Q5
(R
ich
est)
Q1
(P
oore
st)
Q2
Q3
Q4
Q5
(R
ich
est)
Q1
(P
oore
st)
Q2
Q3
Q4
Q5
(R
ich
est)
Q1
(P
oore
st)
Q2
Q3
Q4
Q5
(R
ich
est)
Turkey(2003)
Egypt(2008)
India(2005)
Indonesia(2012)
Philippines(2008)
Viet Nam(2002)

South Australia Diabetes by income, 1991-2005
0
2
4
6
8
10
12
14
16
1991 1992 1993 1994 1995 1996 1997 1998 1999 2000 2001 2002 2003 2004 2005
Pre
va
len
ce
of
dia
be
tes
(%
)
Year
<= $20,000
> $20,000
Source: Health Omnibus Surveys, ages 15+, age standardised, PROS SA DoH

Korea - Trend of risk
factors by
household income
level, 1998 to 2010.
Source: Kim, Y. M., & Jung-
Choi, K. (2013). Socioeconomic
inequalities in health risk factors
in Korea. Journal of the Korean
Medical Association, 56(3), 175-
183
Smoking
High risk drinking
moderate exercise
nutritional deficiency
Men Women
Why worry about inequity?
A healthy city is a just city: so this is moral and
social justice issue
Affects overall well-being of a city – distribution of
health and well-being seen as judge of success of a
city (CSDH, 2008)
Corrosive to economy performance

` So please, allow this old
man in front of you to insist
that unless we all become
partisans in renewed local
and global battles for social
and economic equity in the
spirit of distributive justice,
we shall indeed betray the
future of our children and
grandchildren.
Dr. Halfdan Mahler, DG Emeritus
addressing 61st World Health
Assembly May 2008

Commission on the Social
Determinants of Health
• Launched 28th August 2008 by Dr. Margaret Chan, Director General, WHO in Geneva
• "Health inequity really is a matter of life and death"
• Recommendation: – Daily living conditions
– Power money and resources
– Monitoring, training, research, movement for health equity
Followed by many national and regional
reports – Healthy Cities should examine
implications for their city

Equity Affects overall well-being

Index of:
• Life expectancy
• Math & Literacy
• Infant mortality
• Homicides
• Imprisonment
• Teenage births
• Trust
• Obesity
• Mental illness – incl.
drug & alcohol
addiction
• Social mobility
Health and Social Problems are Worse in More Unequal Countries
Source: Wilkinson & Pickett, The Spirit Level (2009) www.equalitytrust.org.uk
Likely to be
the same
for Cities
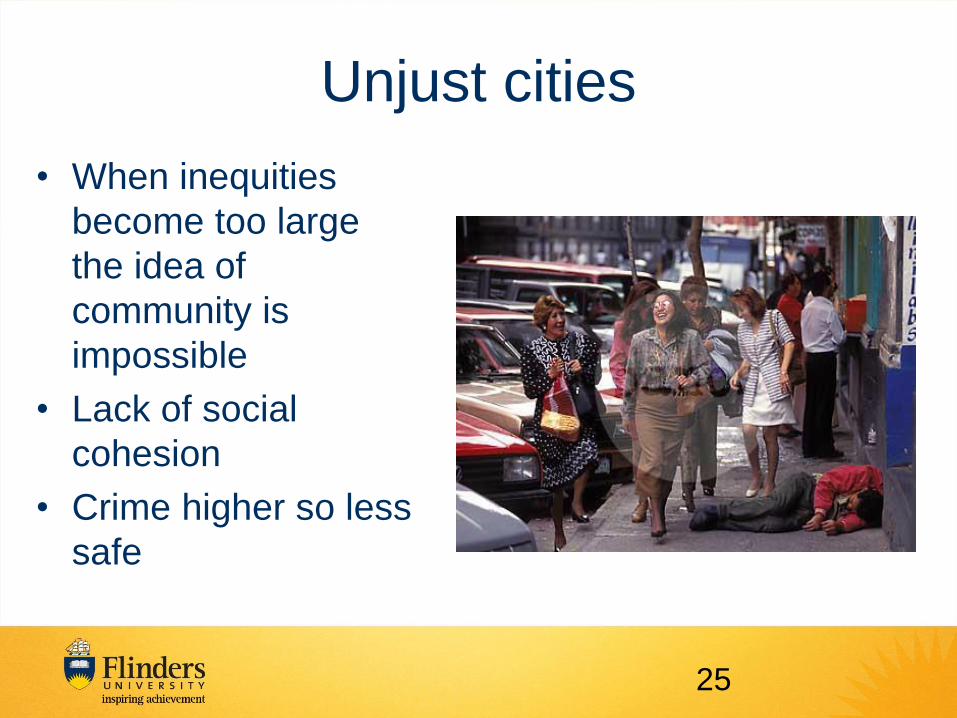
Unjust cities
• When inequities
become too large
the idea of
community is
impossible
• Lack of social
cohesion
• Crime higher so less
safe
25

Indicator U.S.A. Costa Rica Vietnam China
Life expectancy at birth (2012)
78.7 79.7 75.6 75.2
Infant mortality rate (per 1000
live births: 2013)
5.9 8.4 19.0 10.9
*Happy Planet Index (2012) 37.3
(rank 105th)
64.0
(rank 1st)
60.4
(rank 2nd)
44.7
(rank 60th)
Gross National Income per
capita (Atlas method, current
US$: 2013)
53,670. 9,550 1,730 6,560
Total health expenditure
per capita, PPP (constant
2005 Int.$:2012)
8,895.1 1,310.6 233.5 480
CO2 Emission per capita (metric tonnes 2010)
17.6 1.7 1.7 6.2
Source: World Bank, World Development Indicators (WDI) database
http://data.worldbank.org/products/wdi ; *NEF, http://www.happyplanetindex.org/
Wealth not necessary for health – depends
how you use it

Corrosive to economic
performance • In November 2013, the World Economic
Forum released its ‘Outlook on the Global Agenda 2014’, in which it ranked widening income disparities as the second greatest worldwide risk in the coming 12 to 18 months.
• Christine Lagarde (2013) (Managing Director of the International Monetary Fund) has described inequality as corrosive to growth and society and considers it should be reduced
27
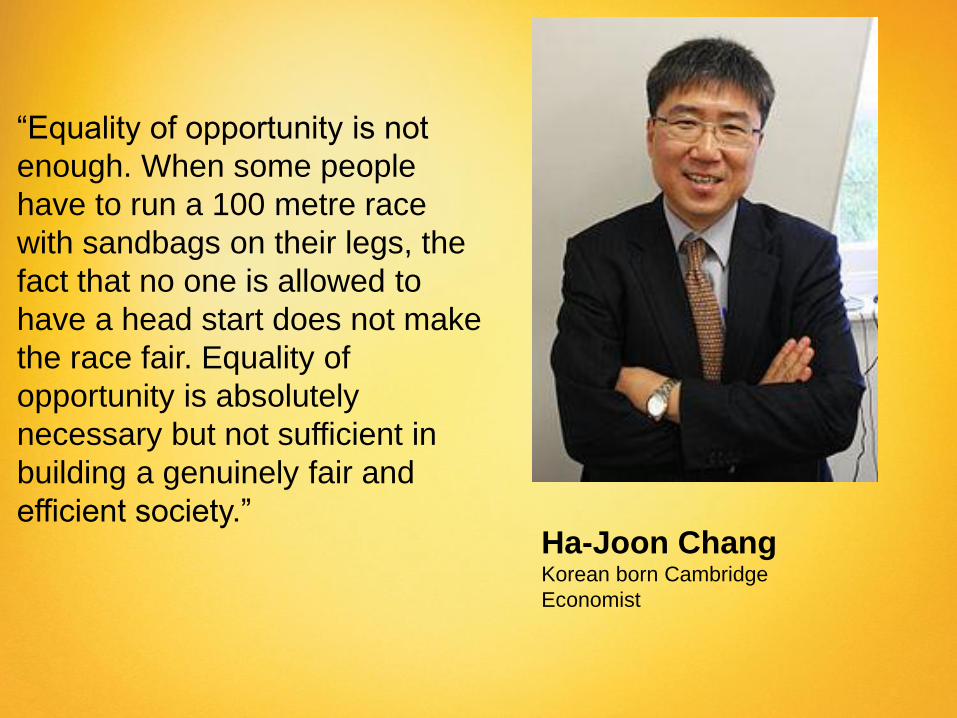
Ha-Joon Chang Korean born Cambridge
Economist
“Equality of opportunity is not
enough. When some people
have to run a 100 metre race
with sandbags on their legs, the
fact that no one is allowed to
have a head start does not make
the race fair. Equality of
opportunity is absolutely
necessary but not sufficient in
building a genuinely fair and
efficient society.”
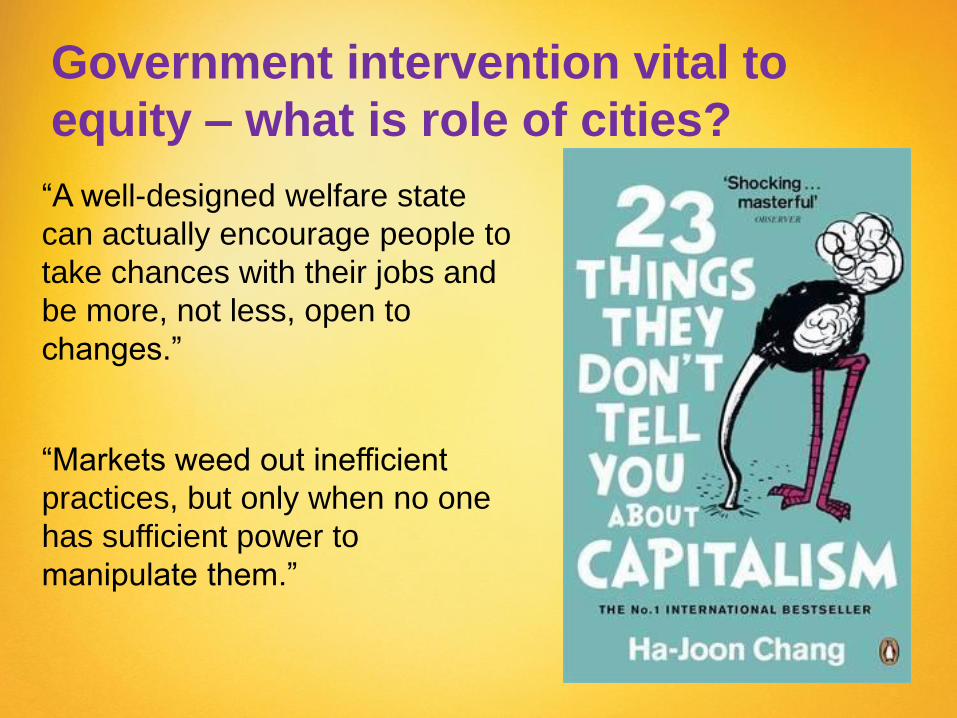
“A well-designed welfare state
can actually encourage people to
take chances with their jobs and
be more, not less, open to
changes.”
“Markets weed out inefficient
practices, but only when no one
has sufficient power to
manipulate them.”
Government intervention vital to
equity – what is role of cities?

How well does the Healthy
Cities movement do at
promoting equity?
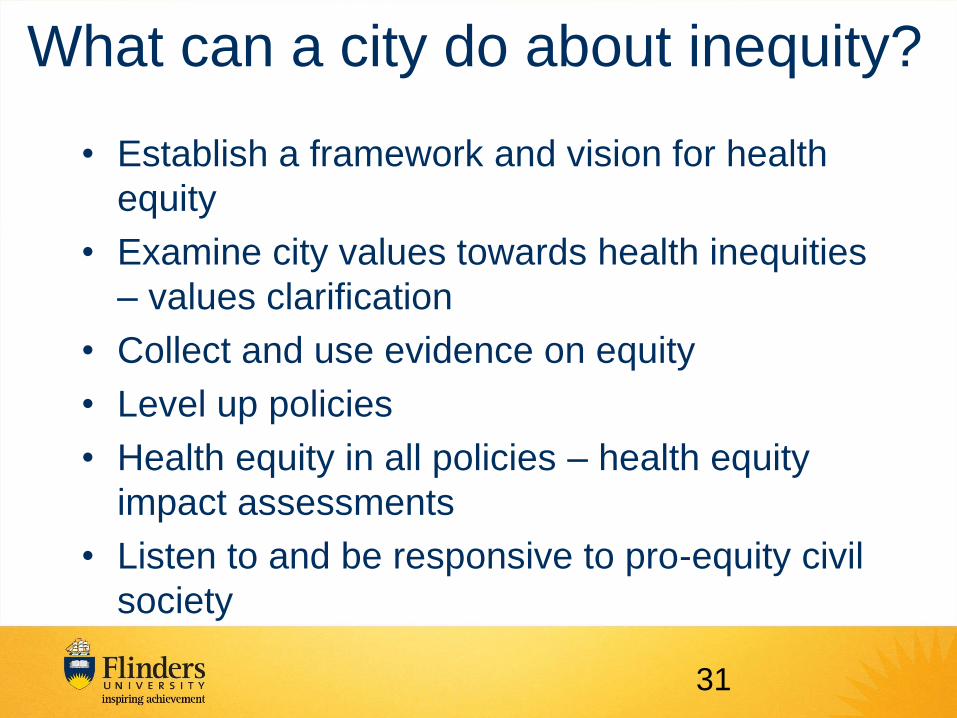
What can a city do about inequity?
• Establish a framework and vision for health
equity
• Examine city values towards health inequities
– values clarification
• Collect and use evidence on equity
• Level up policies
• Health equity in all policies – health equity
impact assessments
• Listen to and be responsive to pro-equity civil
society
31

Central Role
for Cities • Health inequalities that are
avoidable are unjust: action is
required across society
• Improve governance for the
social determinants of health
and health equity. This requires
greater coherence of action at all
levels of government −
transnational, national, regional
and local – and across all
sectors and stakeholders −
public, private and voluntary.
32
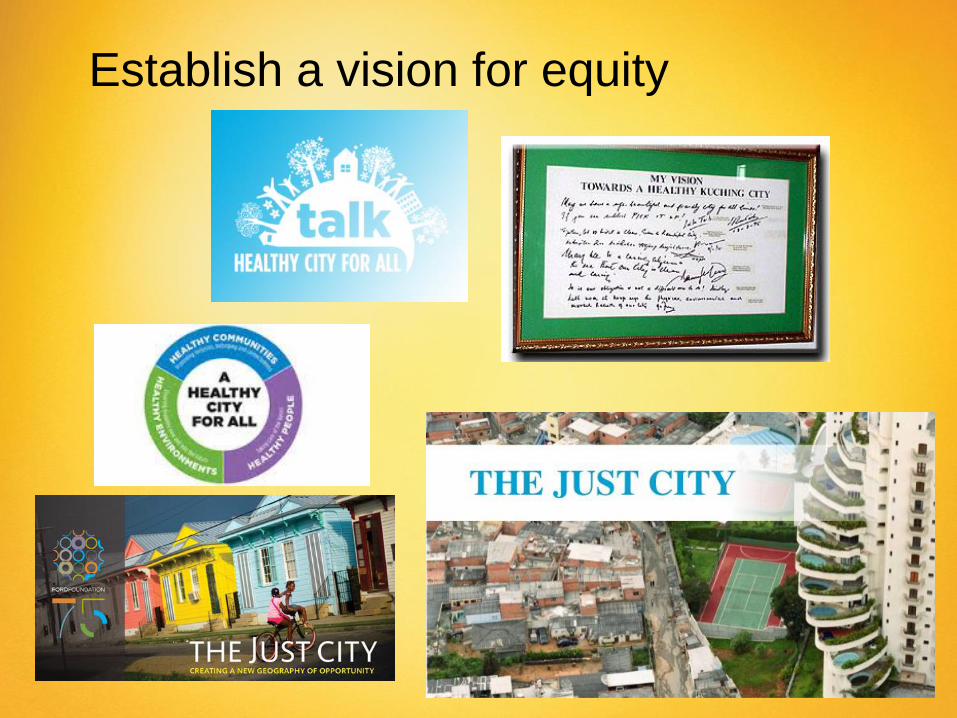
Establish a vision for equity
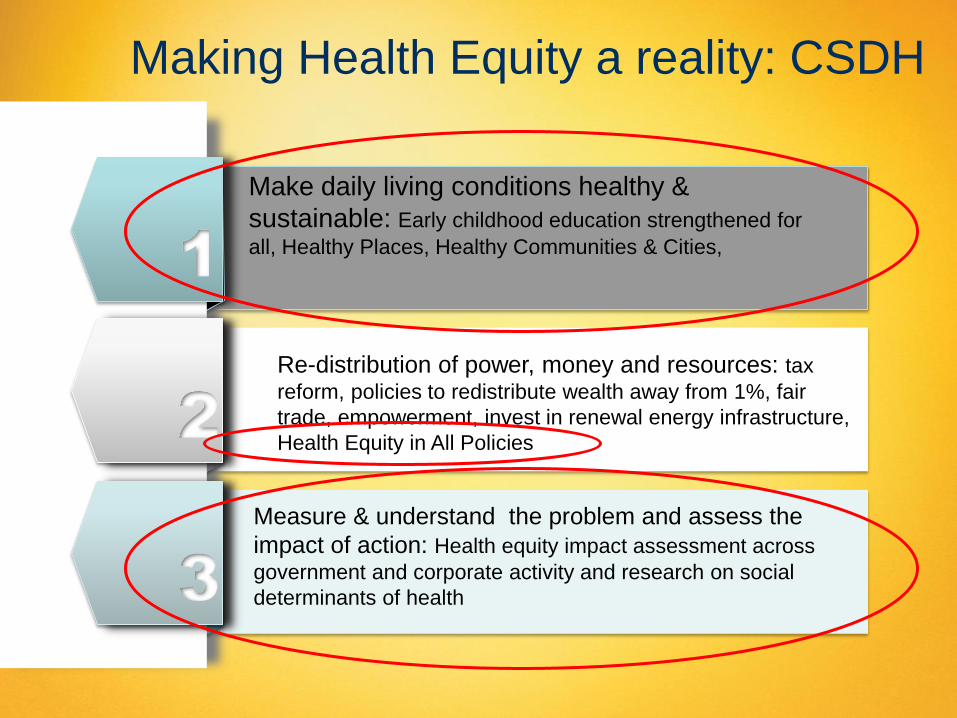
Making Health Equity a reality: CSDH
Make daily living conditions healthy &
sustainable: Early childhood education strengthened for
all, Healthy Places, Healthy Communities & Cities,
Measure & understand the problem and assess the
impact of action: Health equity impact assessment across
government and corporate activity and research on social
determinants of health
1
2
3
Re-distribution of power, money and resources: tax
reform, policies to redistribute wealth away from 1%, fair
trade, empowerment, invest in renewal energy infrastructure,
Health Equity in All Policies

Values and equity
• Why do inequities exist?
• Whose fault is it?
• Do we blame the victims?
• Do we understand the constraints on
people’s decisions and the impact of
environments on people’s lives?
• Do we ask who benefits from existing
inequities?
35

Evidence is never enough: the importance of
values to driving political will
“inequity (of health or
otherwise) is a moral
category rooted in
values, social
stratification, embedded
in political reality and
the negotiations of
social power relations”.
Monique Bégin, former Canadian
MoH, CSDH Commissioner
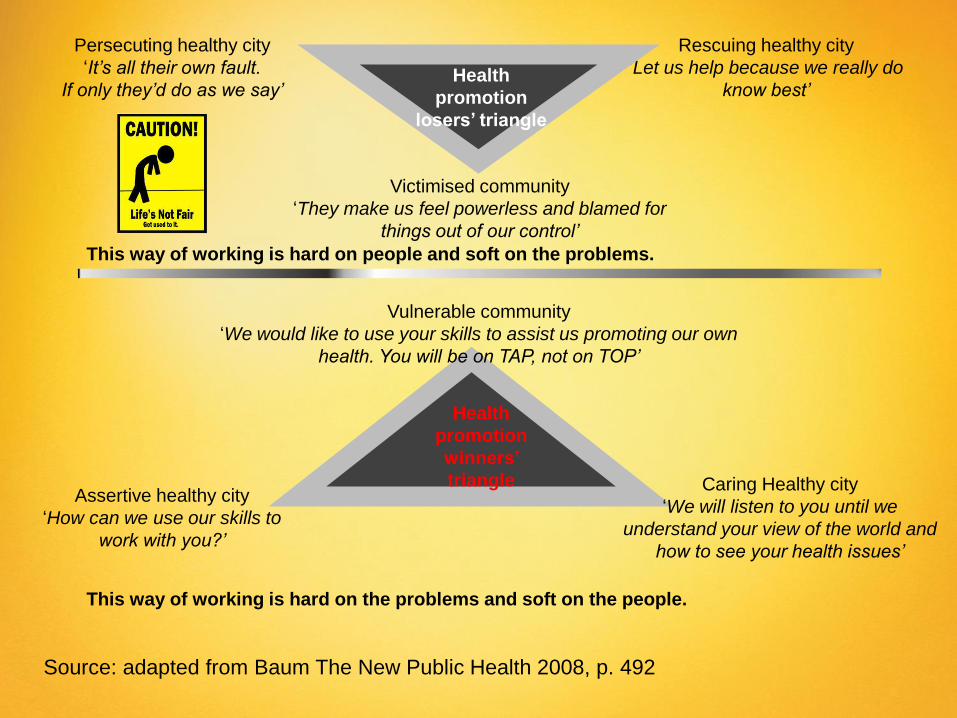
Victimised community
‘They make us feel powerless and blamed for
things out of our control’
Rescuing healthy city
‘Let us help because we really do
know best’
Persecuting healthy city
‘It’s all their own fault.
If only they’d do as we say’
This way of working is hard on people and soft on the problems.
Health
promotion
losers’ triangle
Health
promotion
winners’
triangle
Vulnerable community
‘We would like to use your skills to assist us promoting our own
health. You will be on TAP, not on TOP’
Caring Healthy city
‘We will listen to you until we
understand your view of the world and
how to see your health issues’
Assertive healthy city
‘How can we use our skills to
work with you?’
This way of working is hard on the problems and soft on the people.
Source: adapted from Baum The New Public Health 2008, p. 492

Important to look beyond the tip
of the iceberg
Visible
manifestation
Invisible yet
driving
disease and
behaviours.
Diseases
Lifestyle risk
factors
Daily living conditions
(housing, employment, social
support, crime & safety )
Economic & social
structures – local, regional,,
national and global: power &
wealth distribution, gender &
class
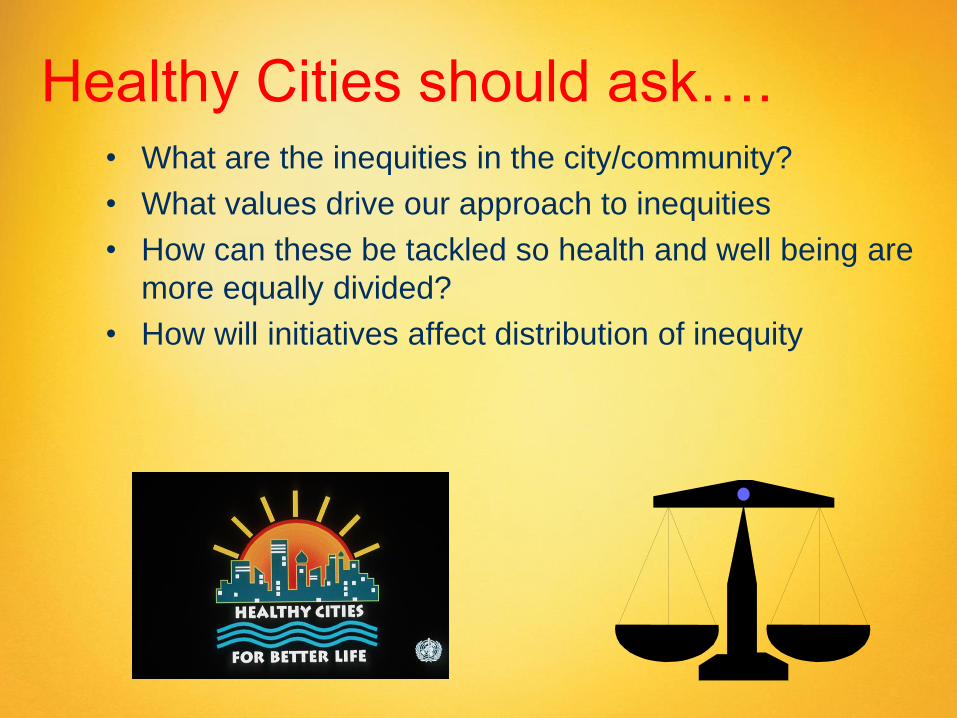
Healthy Cities should ask…. • What are the inequities in the city/community?
• What values drive our approach to inequities
• How can these be tackled so health and well being are
more equally divided?
• How will initiatives affect distribution of inequity
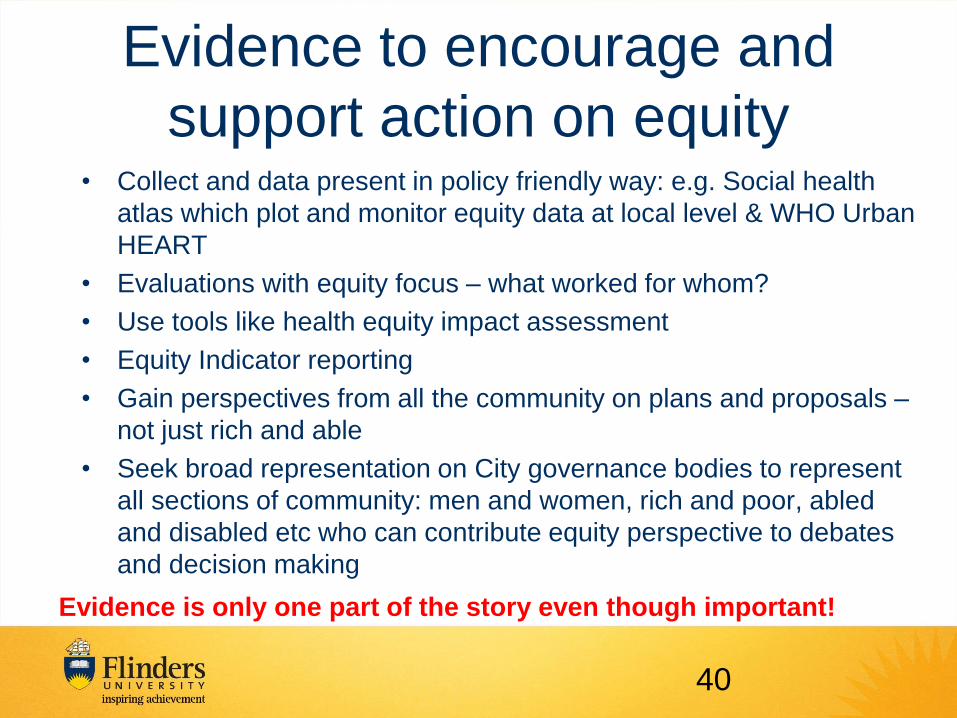
Evidence to encourage and
support action on equity • Collect and data present in policy friendly way: e.g. Social health
atlas which plot and monitor equity data at local level & WHO Urban
HEART
• Evaluations with equity focus – what worked for whom?
• Use tools like health equity impact assessment
• Equity Indicator reporting
• Gain perspectives from all the community on plans and proposals –
not just rich and able
• Seek broad representation on City governance bodies to represent
all sections of community: men and women, rich and poor, abled
and disabled etc who can contribute equity perspective to debates
and decision making
Evidence is only one part of the story even though important!
40

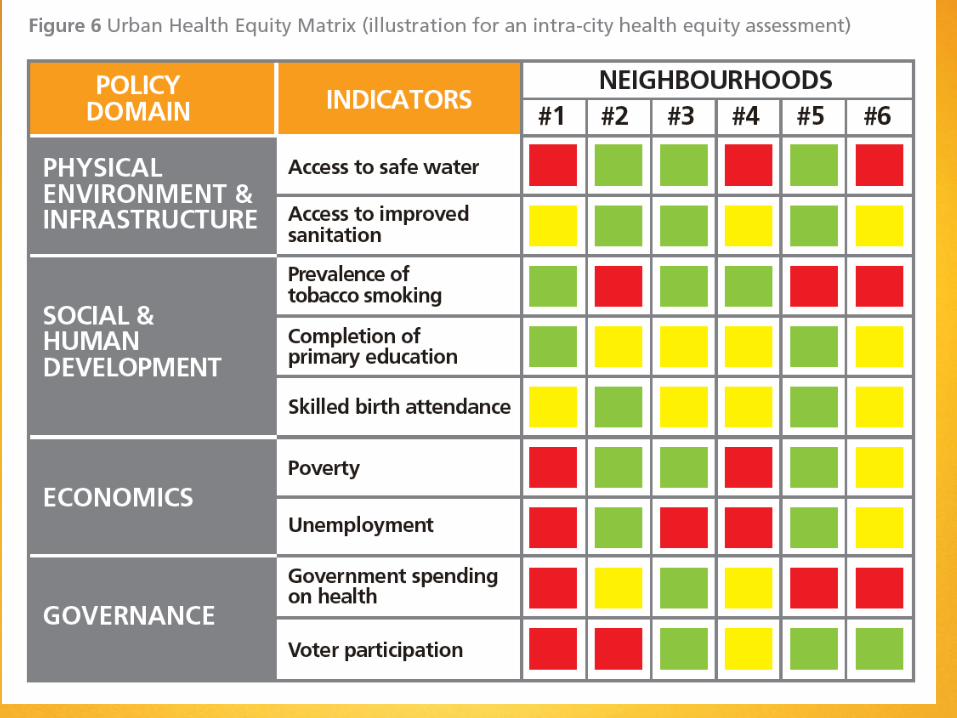
The Urban Health Equity Assessment and
Response Tool
• (Urban HEART) is a user-friendly
guide for policy- and decision-
makers at national and local levels
to:
– identify and analyse inequities in health
between people living in various parts
of cities, or belonging to different
socioeconomic groups within and
across cities;
– facilitate decisions on viable and
effective strategies interventions and
actions that should be used to reduce
inter- and intra-city health inequities
• Poses series of questions to
determine best policy response for
a particular urban setting
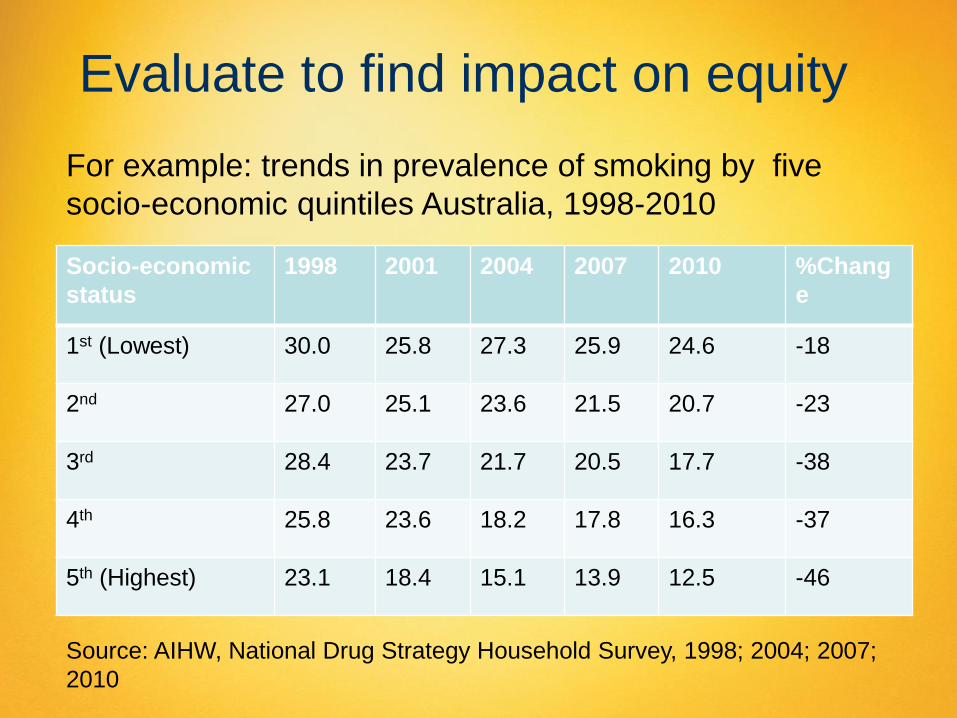
Evaluate to find impact on equity
Socio-economic
status
1998 2001 2004 2007 2010 %Chang
e
1st (Lowest) 30.0 25.8 27.3 25.9 24.6 -18
2nd 27.0 25.1 23.6 21.5 20.7 -23
3rd 28.4 23.7 21.7 20.5 17.7 -38
4th 25.8 23.6 18.2 17.8 16.3 -37
5th (Highest) 23.1 18.4 15.1 13.9 12.5 -46
For example: trends in prevalence of smoking by five
socio-economic quintiles Australia, 1998-2010
Source: AIHW, National Drug Strategy Household Survey, 1998; 2004; 2007;
2010

Policy objective - Levelling up across the city
WHO Urban HEART

Focusing solely on the
most disadvantaged will
not reduce health
inequalities sufficiently.
To reduce the steepness
of the social
gradient in health, actions
must be universal, but
with a scale and intensity
that is proportionate to the
level of disadvantage.
We call this proportionate
universalism.
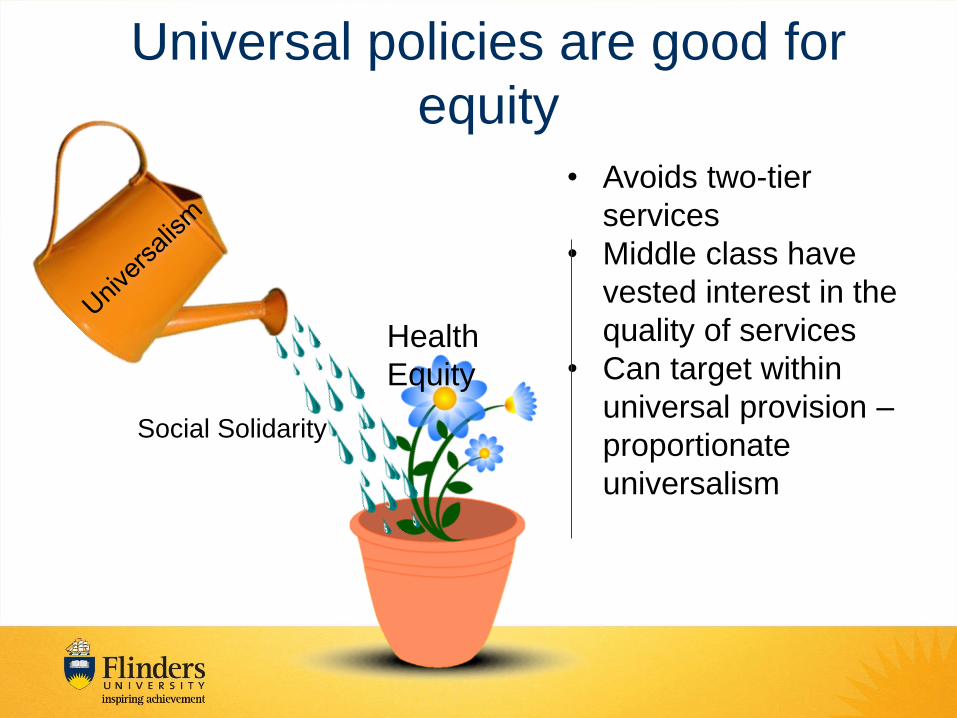
Universal policies are good for
equity
• Avoids two-tier
services
• Middle class have
vested interest in the
quality of services
• Can target within
universal provision –
proportionate
universalism
Social Solidarity
Health
Equity
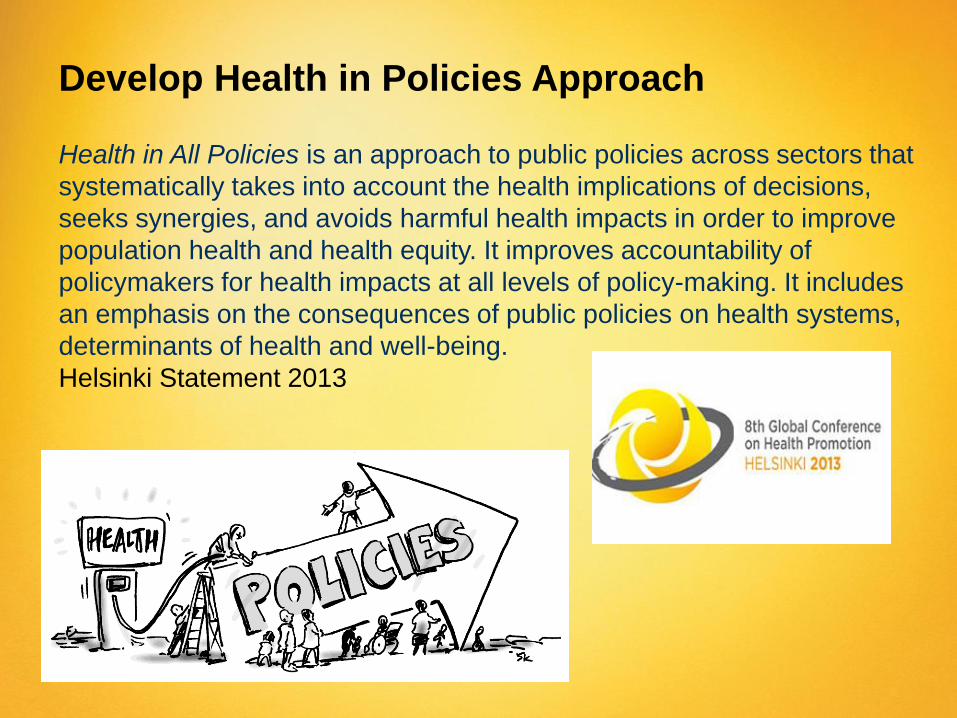
Develop Health in Policies Approach Health in All Policies is an approach to public policies across sectors that
systematically takes into account the health implications of decisions,
seeks synergies, and avoids harmful health impacts in order to improve
population health and health equity. It improves accountability of
policymakers for health impacts at all levels of policy-making. It includes
an emphasis on the consequences of public policies on health systems,
determinants of health and well-being.
Helsinki Statement 2013
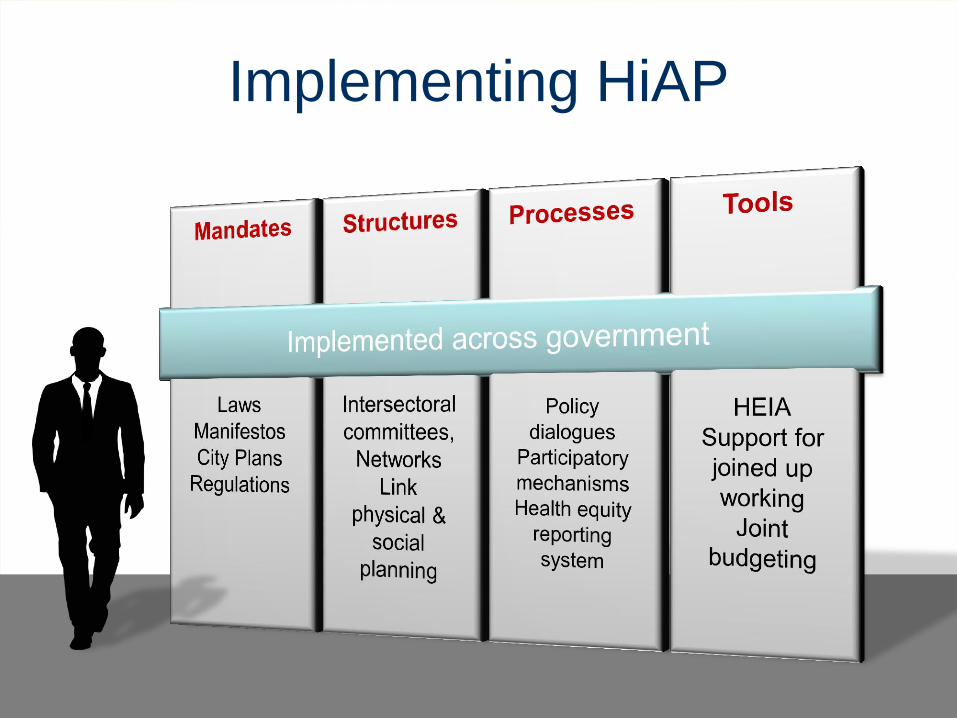
Implementing HiAP

Source: SA Government (2011) Health in All Policies: The South Australian Approach
more details at http://www.sahealth.sa.gov.au/healthinallpolicies
Contact HiAP Manager [email protected]

HiAP in cities
• Urban planning
• Transport decisions
• Community development
and strengthening
• Healthy weight
environments
What is the health
equity impact of
each area of city
activity?
50
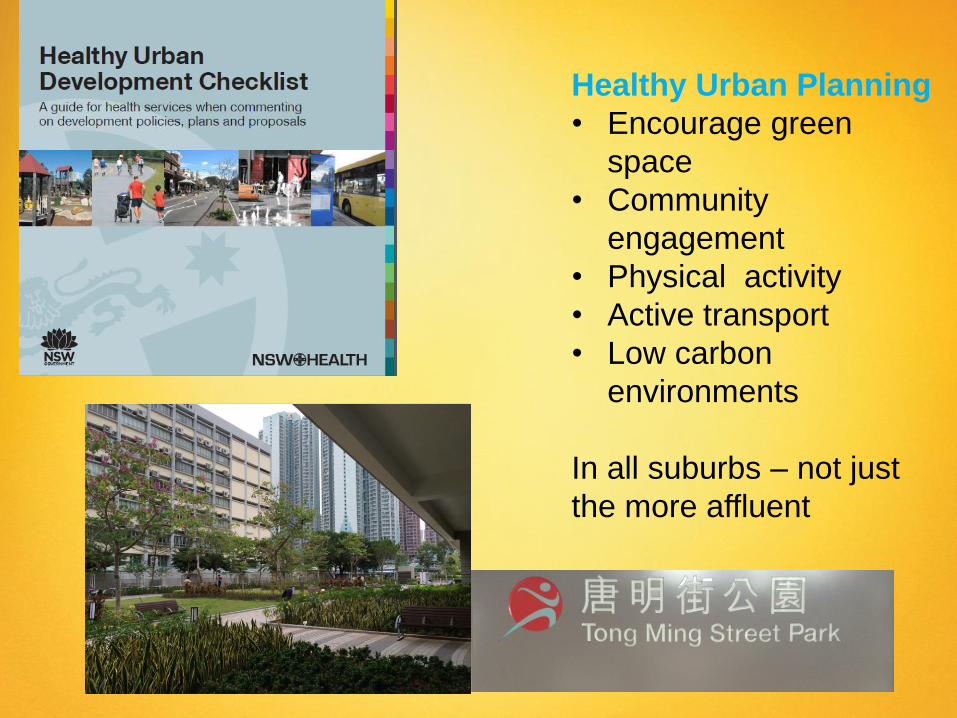
Healthy Urban Planning
• Encourage green
space
• Community
engagement
• Physical activity
• Active transport
• Low carbon
environments
In all suburbs – not just
the more affluent
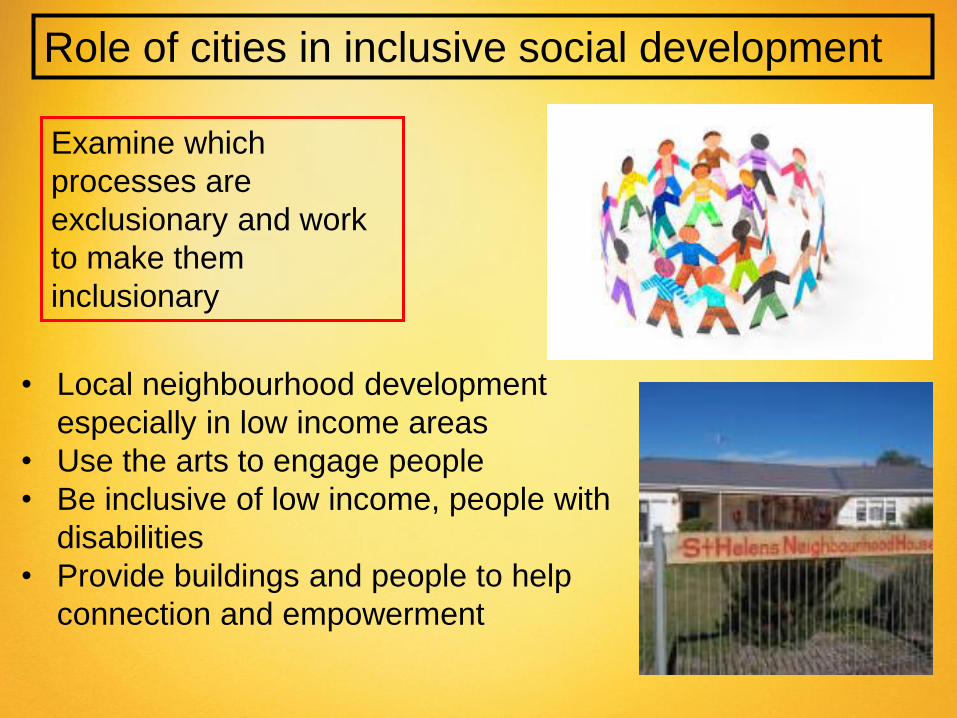
Role of cities in inclusive social development
• Local neighbourhood development
especially in low income areas
• Use the arts to engage people
• Be inclusive of low income, people with
disabilities
• Provide buildings and people to help
connection and empowerment
Examine which
processes are
exclusionary and work
to make them
inclusionary

City NCDs shaped by global forces
UN Secretary-General Ban
Ki-moon on World Diabetes
Day Nov 2013 “the condition
is largely driven by unhealthy
lifestyles, which are due to
the globalization of marketing
and trade of unhealthy
food…”
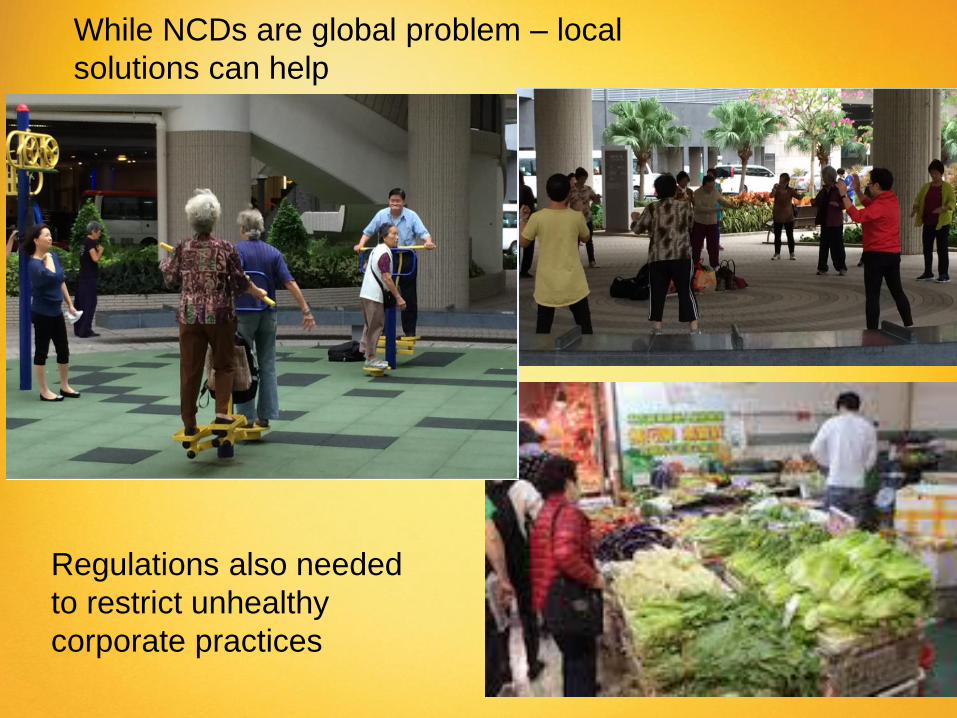
While NCDs are global problem – local
solutions can help
Regulations also needed
to restrict unhealthy
corporate practices
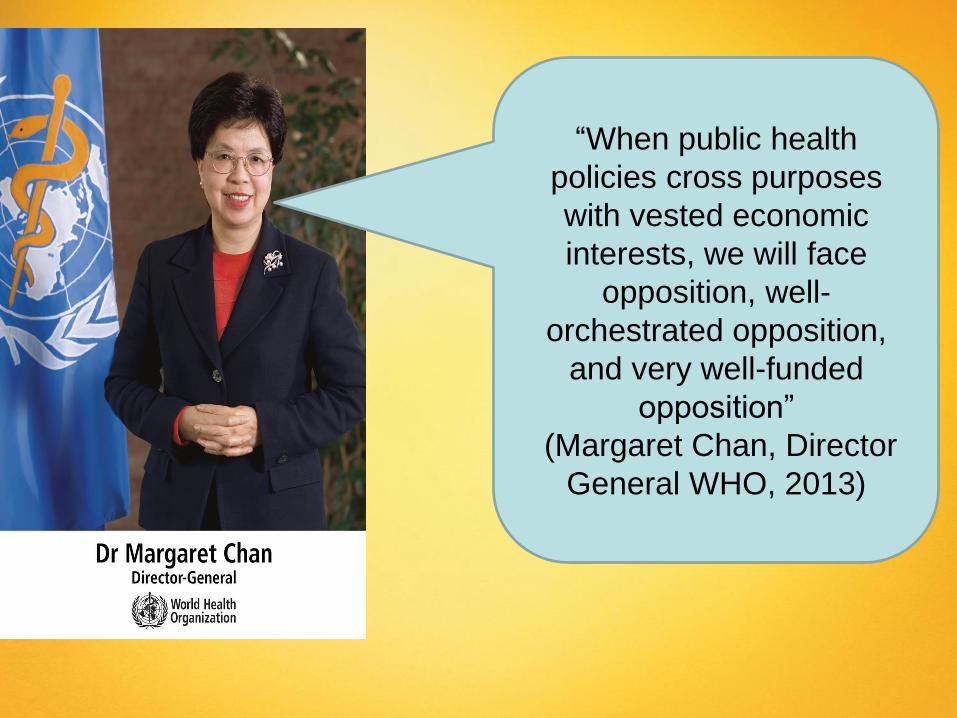
“When public health
policies cross purposes
with vested economic
interests, we will face
opposition, well-
orchestrated opposition,
and very well-funded
opposition”
(Margaret Chan, Director
General WHO, 2013)
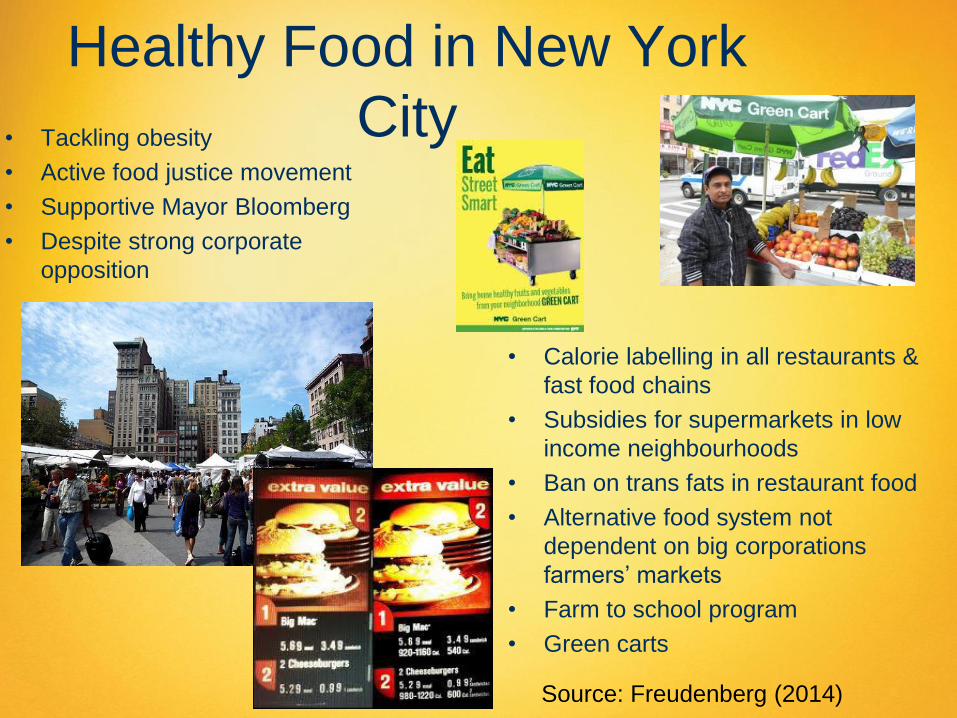
Healthy Food in New York
City • Tackling obesity
• Active food justice movement
• Supportive Mayor Bloomberg
• Despite strong corporate
opposition
• Calorie labelling in all restaurants &
fast food chains
• Subsidies for supermarkets in low
income neighbourhoods
• Ban on trans fats in restaurant food
• Alternative food system not
dependent on big corporations
farmers’ markets
• Farm to school program
• Green carts
Source: Freudenberg (2014)
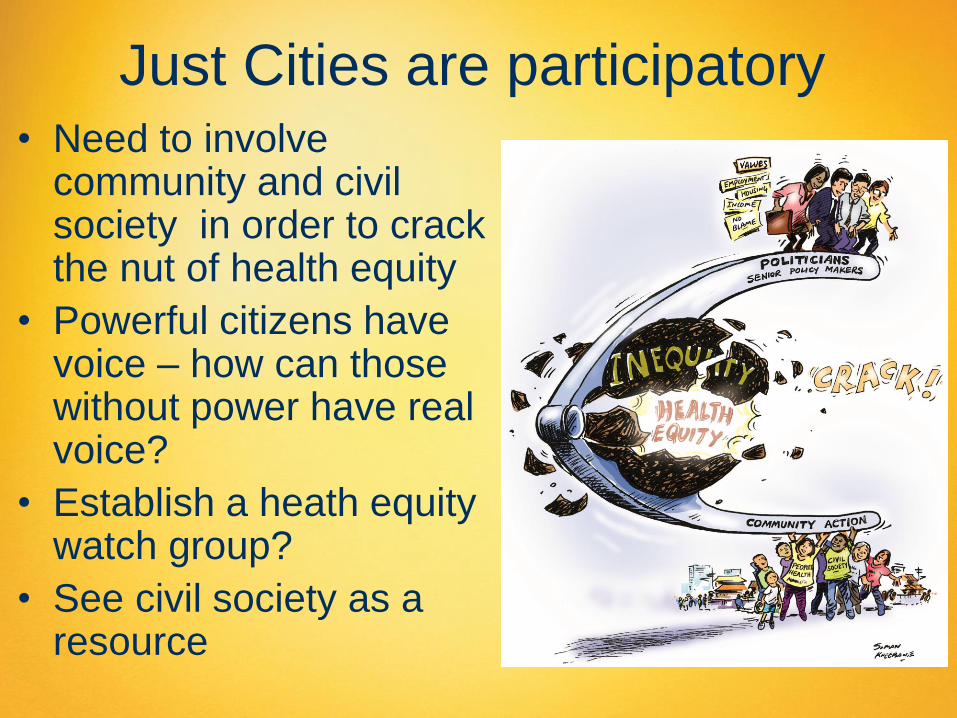
Just Cities are participatory • Need to involve
community and civil society in order to crack the nut of health equity
• Powerful citizens have voice – how can those without power have real voice?
• Establish a heath equity watch group?
• See civil society as a resource

The People’s Health Movement
Global Network for Health Activists with
focus on social, economic and
environmental determinants of health
WWW.phmovement.org Global Co-ordinator Bridget Lloyd – South Africa
Associate Co-ordinators Hani Serag – Egypt, Amit Sen Gupta - Delhi
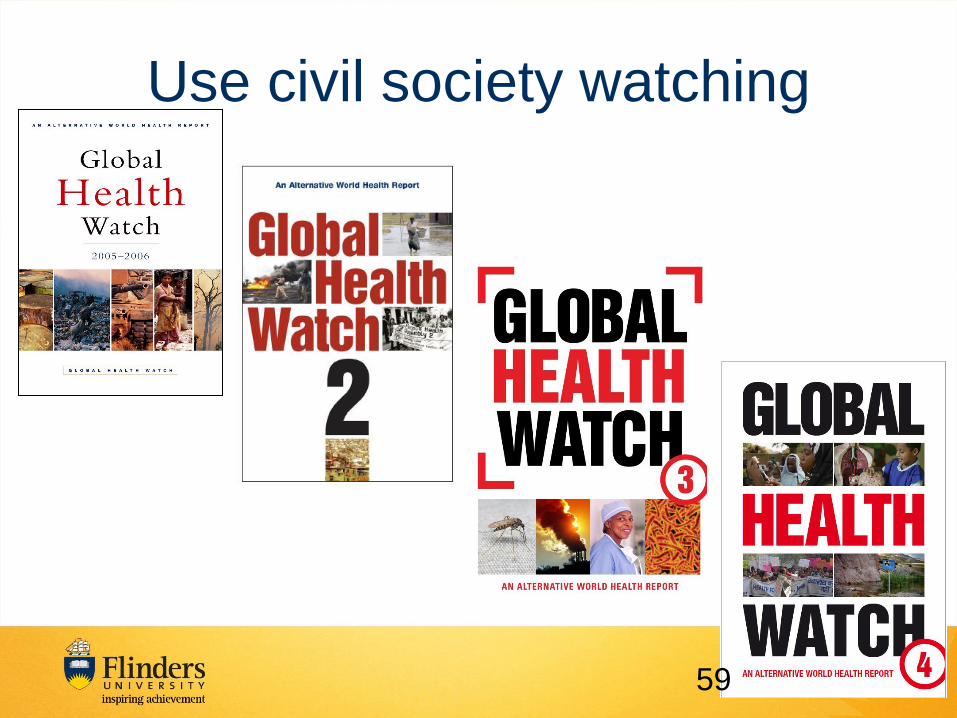
Use civil society watching
59
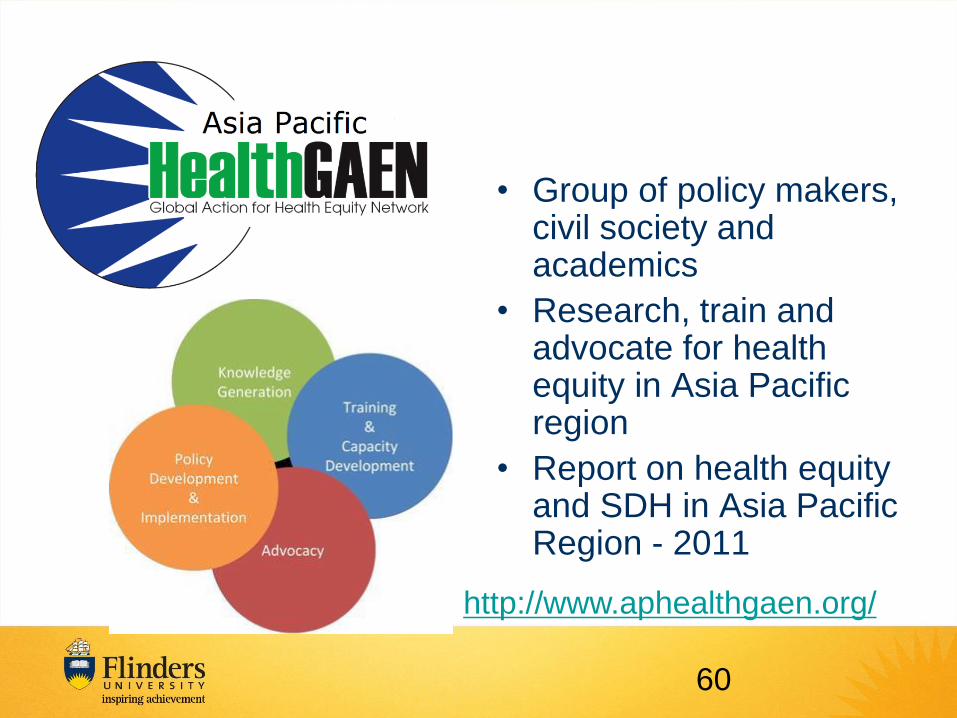
• Group of policy makers, civil society and academics
• Research, train and advocate for health equity in Asia Pacific region
• Report on health equity and SDH in Asia Pacific Region - 2011
http://www.aphealthgaen.org/
60

• Over 50
Organisations and
peak bodies
• Launched Feb 2013,
Parliament House
• Advocating for policy
change

Action on social determinants of health & equity has
city wide benefits
• Healthier population - good for employers,
education, social interaction, parenting
• Highly compatible with low carbon & sustainable
futures – good for everyone
• Economic benefits: losses from health inequities
associated with productivity losses, reduced tax
revenue, higher welfare payments, increased
treatment costs
• Lower health care costs increase funds for
investment in other sectors that can be used for
measures that support communities– virtuous cycle
In Summary
Healthy Cities should also
be just cities in which issues
of health equity are
considered in visions,
values, planning,
implementation and
evaluation
Equitable participation is
vital
Equity was central to the
original idea of Healthy
Cities – now we need to
realise that vision!

Related Documents