ª 2009 WILEY-VCH Verlag GmbH & Co. KGaA, Weinheim www.plant-soil.com J. Plant Nutr. Soil Sci. 2009, 172, 305–325 DOI: 10.1002/jpln.200800223 305 Review Article How does the Hedley sequential phosphorus fractionation reflect impacts of land use and management on soil phosphorus: A review Wakene Negassa 1 and Peter Leinweber 1 * 1 University of Rostock, Institute of Land Use, Justus-von-Liebig Weg 6, 18051 Rostock, Germany Abstract The Hedley sequential-phosphorus (P)-fractionation method has been used in many countries to study the effects of land-use and management systems on soil P. Many data sets have been obtained but collectively never have been considered or to goal topic reviewed. Therefore, the objectives of this review were to compile and systematically evaluate these data. The data gen- erated over many years were grouped into temperate, and subtropical and tropical soils of differ- ent land use and duration of soil-management studies. In natural ecosystems, vegetation types and composition and percent of vegetation covers substantially affected all P fractions with pro- nounced impacts on the labile and moderately labile P. In short-term studies (£ 10 y), changes in the labile and moderately labile inorganic P (P i ) fractions were detected when more P (e.g., by factor 5) was applied than commonly recommended for agricultural crops. However, without P application the changes in all P fractions were subtle in temperate soils, but declines were signif- icant in labile and moderately labile P in subtropical and tropical soils. In both temperate and tro- pical climates, medium (10–25 y) and long-term (>25 y) cultivation without P application depleted all P fractions, whereas most of P fractions increased with continuous P application, regardless of the amount and source of P. Synthesis of data resulted in multiple-regression func- tions which described differences in labile and moderately labile P fractions as function of differ- ences in amount of P application and duration of the experiments. Moreover, the correlation analysis also showed strong association among most of the P fractions. Current limitations in data interpretation of Hedley fractionation can be overcome by the application of 31 P nuclear–- magnetic resonance (NMR) and X-ray absorption near-edge fine-structure (XANES) spectro- scopy. Key words: soil phosphorus / P speciation / labile P / moderately labile P / stable P / temperate soils / tropical soils / 31 P NMR / P XANES Accepted November 9, 2009 1 Introduction Soil P exists in inorganic and organic compounds that range from ions in solution to very stable inorganic and organic compounds. The inorganic P (P i ) compounds mainly couple with amorphous and crystalline forms of Al, Fe, and Ca. The organic (P o ) compounds are associated with rapidly to slowly decomposable organic molecules such as nucleic acids, phospholipids, sugar phosphates, inositol phosphates, and recalcitrant humic substances (Hedley et al., 1982; Tiessen and Moir , 1993; Reddy et al., 1999). Different sequential-P- fractionation schemes have been developed to quantify P in the above described inorganic and organic forms, as sum- marized recently by Pierzynski et al. (2005). Among these dif- ferent sequential-P-fractionation schemes, the method devel- oped by Hedley et al. (1982), sometimes with slight modifica- tion, was widely applied in many countries. Cross and Schlesinger (1995) published a thorough review on applica- tions of the Hedley fractionation to characterize the biogeo- chemical P cycling in natural, unfertilized, and uncultivated soils that were arranged according to the soil orders of the USDA classification. Although a huge dataset on Hedley P fractions in soils from different land-use and management systems of both temperate and tropical agroecosystems has been accumulated over the past 25 y, a review comparable to Cross and Schlesinger (1995) has not yet been published. Therefore, the objectives of this review were to (1) compile and summarize the concentrations and proportions of P frac- tions obtained by the Hedley sequential P fractionation in contrasting land-use and management systems of temperate, subtropical, and tropical soils, and (2) to review results of new analytical approaches in P speciation which have poten- tial to improve the interpretation of the Hedley fractions. We hypothesize that compiling many results from different geo- graphical areas could help to generalize probable effects of land use and management on the Hedley fractions. Further- more, reviewing previous studies helps to identify gaps in * Correspondence: Prof. Dr. P. Leinweber; e-mail: [email protected]

Welcome message from author
This document is posted to help you gain knowledge. Please leave a comment to let me know what you think about it! Share it to your friends and learn new things together.
Transcript
ª 2009 WILEY-VCH Verlag GmbH & Co. KGaA, Weinheim www.plant-soil.com
J. Plant Nutr. Soil Sci. 2009, 172, 305–325 DOI: 10.1002/jpln.200800223 305
Review Article
How does the Hedley sequential phosphorus fractionation reflect impactsof land use and management on soil phosphorus: A reviewWakene Negassa1 and Peter Leinweber1*
1 University of Rostock, Institute of Land Use, Justus-von-Liebig Weg 6, 18051 Rostock, Germany
AbstractThe Hedley sequential-phosphorus (P)-fractionation method has been used in many countriesto study the effects of land-use and management systems on soil P. Many data sets have beenobtained but collectively never have been considered or to goal topic reviewed. Therefore, theobjectives of this review were to compile and systematically evaluate these data. The data gen-erated over many years were grouped into temperate, and subtropical and tropical soils of differ-ent land use and duration of soil-management studies. In natural ecosystems, vegetation typesand composition and percent of vegetation covers substantially affected all P fractions with pro-nounced impacts on the labile and moderately labile P. In short-term studies (£ 10 y), changes inthe labile and moderately labile inorganic P (Pi) fractions were detected when more P (e.g., byfactor 5) was applied than commonly recommended for agricultural crops. However, without Papplication the changes in all P fractions were subtle in temperate soils, but declines were signif-icant in labile and moderately labile P in subtropical and tropical soils. In both temperate and tro-pical climates, medium (10–25 y) and long-term (>25 y) cultivation without P applicationdepleted all P fractions, whereas most of P fractions increased with continuous P application,regardless of the amount and source of P. Synthesis of data resulted in multiple-regression func-tions which described differences in labile and moderately labile P fractions as function of differ-ences in amount of P application and duration of the experiments. Moreover, the correlationanalysis also showed strong association among most of the P fractions. Current limitations indata interpretation of Hedley fractionation can be overcome by the application of 31P nuclear–-magnetic resonance (NMR) and X-ray absorption near-edge fine-structure (XANES) spectro-scopy.
Key words: soil phosphorus / P speciation / labile P / moderately labile P / stable P / temperate soils /tropical soils / 31P NMR / P XANES
Accepted November 9, 2009
1 Introduction
Soil P exists in inorganic and organic compounds that rangefrom ions in solution to very stable inorganic and organiccompounds. The inorganic P (Pi) compounds mainly couplewith amorphous and crystalline forms of Al, Fe, and Ca. Theorganic (Po) compounds are associated with rapidly to slowlydecomposable organic molecules such as nucleic acids,phospholipids, sugar phosphates, inositol phosphates, andrecalcitrant humic substances (Hedley et al., 1982; Tiessenand Moir, 1993; Reddy et al., 1999). Different sequential-P-fractionation schemes have been developed to quantify P inthe above described inorganic and organic forms, as sum-marized recently by Pierzynski et al. (2005). Among these dif-ferent sequential-P-fractionation schemes, the method devel-oped by Hedley et al. (1982), sometimes with slight modifica-tion, was widely applied in many countries. Cross andSchlesinger (1995) published a thorough review on applica-tions of the Hedley fractionation to characterize the biogeo-chemical P cycling in natural, unfertilized, and uncultivated
soils that were arranged according to the soil orders of theUSDA classification. Although a huge dataset on Hedley Pfractions in soils from different land-use and managementsystems of both temperate and tropical agroecosystems hasbeen accumulated over the past 25 y, a review comparable toCross and Schlesinger (1995) has not yet been published.
Therefore, the objectives of this review were to (1) compileand summarize the concentrations and proportions of P frac-tions obtained by the Hedley sequential P fractionation incontrasting land-use and management systems of temperate,subtropical, and tropical soils, and (2) to review results ofnew analytical approaches in P speciation which have poten-tial to improve the interpretation of the Hedley fractions. Wehypothesize that compiling many results from different geo-graphical areas could help to generalize probable effects ofland use and management on the Hedley fractions. Further-more, reviewing previous studies helps to identify gaps in
* Correspondence: Prof. Dr. P. Leinweber;e-mail: [email protected]
knowledge and propose new research approaches in study-ing the dynamics of P fractions for sustainable agriculturalproduction.
2 Methods of data mining and evaluation
More than 100 articles published in soil science and relatedjournals in the past 25 y were evaluated. As different studiesused different units, we normalized the concentrations intomg Pkg–1 for P fractions and the applied P into kg P ha–1.Approximate bulk densities of (1.0 to 1.4) � 103 kg m–3 wereused to convert the applied P from mg Pkg–1 into kg P ha–1
for some studies. The amounts of different applied organicwaste such as manure, biosolids, crop residues, and greenmanure were converted into their total P equivalent on dry-matter basis. The amounts of P applied with fertilizer andorganic materials in the reviewed studies ranged from 0 to921 kg ha–1 over the corresponding study period (0–111 y).Phosphorus sources, specific rate of P, and duration of thestudies are listed in Tab. 4 to 7 for temperate soils and in Tab.9 and 10 for subtropical and tropical soils. As many reviewswere published on the effects of organic materials on soil Pdynamics in both temperate and tropical ecosystems (Stew-art and Tiessen, 1987; Condron et al., 2005; Hedley andMcLaughlin, 2005; Singh and Lal, 2005; Oberson and Fros-sard, 2005; Mullins et al., 2005; Nziguheba and B�nemann,2005), we focused on studies in which the Hedley sequential-P-fractionation scheme was applied to different land-use andmanagement systems.
In most studies from temperate climates, the extracted Pfractions comprised resin-P, 0.5 M NaHCO3-Pi and Po, 0.1 MNaOH-Pi and Po, 1 M HCl-P or 1 M H2SO4-P, and residual-Pfractions. A few studies separately extracted P from internalsurfaces of soil aggregates by ultrasonication in 0.1 MNaOH-P and recalcitrant P fractions in concentrated HCl-Pwhich in the present review were summed to the NaOH- andresidual-P fractions, respectively. Similar sequential-P-frac-tionation procedure was applied to tropical soils except forresin-P fraction in most studies. However, the number of Pfractions extracted that ranged from 4 to 9, did not show con-sistency in both agroecosystems and it was usually lower forthe studies conducted on subtropical and tropical soils (Tab.1 and 2). Unless otherwise stated, the following terminologywas used throughout the text: labile P (resin-P, 0.5 MNaHCO3-Pi and Po), moderately labile P (0.1 M NaOH-Pi andPo), and stable P fractions (HCl-P and residual-P).
Since stages of soil development affect the distribution andtransformation of different P fractions (Cross and Schle-singer, 1995), we organized this review according to the SoilTaxonomy Classification System (Brady and Weil, 2008) andassigned to these units if classifications from other systemswere reported. Accordingly, this review summarized themajor effects of land-use and management systems on theupper soil horizons, mostly ranging from 0 to 20 cm depth.Furthermore, we considered only the extreme treatments incontrasting land-use and management systems because thedifferences in P fractions from the narrow-range treatmentswere small in most studies. The effects of land-use and man-agement systems on P fractions are affected by the intensity
and duration of the management. As a result, studies wereclassified into native vegetation covers, short-term (£10 y),medium-term (10–25 y), and long-term (>25 y) in temperate,subtropical, and tropical soils. These classifications helped toillustrate the impact of land-use and management systemsover time across different soil orders in all agroecosystems.
The effects of applying different P sources over various studyperiods on P fractions were analyzed by multiple regressionsfor absolute concentration of labile and moderately labile Pfractions in selected studies in temperate, subtropical, andtropical soils. Differences in labile and moderately labile Pwere computed as function of difference in P-applicationrates and duration of the studies. Land-use and managementsystems without P application were excluded from the multi-ple-regression analysis. Pearson correlation analyses werealso computed for absolute concentrations of all P fractionsexept those from natural ecosystems.
3 Effects of land use and management on Pfractions in temperate soils
3.1 Native vegetation covers
Impacts of native vegetation covers on P fractions in varioussoil types of temperate climates were reviewed (Tab. 3). Dif-ferent vegetation at the same soil orders altered both theabsolute concentrations and the proportions of different Pfractions. The major differences were observed mainly inlabile and moderately labile P fractions. For instance, theresin-P proportion was larger under coniferous than underbroadleaf forest. Furthermore, the proportion of Po undergrasses and pastures exceeded that under forest in most ofsoil orders. This is attributed to high organic-matter (OM)accumulation by fine roots of grasses particularly in the A hor-izon (Brady and Weil, 2008) that is usually proportional to theconcentration of Po (Tiessen et al., 1984). Although little infor-mation was available on the P species of forest and grass lit-ter, we hypothesize that forest litter contains relatively moreorthophosphate diesters than grassland (McDowell andStewart, 2006). Similarly, Leinweber et al. (1997a) and Tar-anto et al. (2000) reported that orthophosphate diesters weremore easily mineralized than orthophosphate monoesters. Inaddition to litter quality, associated microorganisms, vegeta-tion composition, soil moisture regime, and soil physicochem-ical and biological characteristics affected organic-P minerali-zation (Jones, 1998; Hinsinger, 2001; Nziguheba and B�ne-mann, 2005). The absolute concentration and proportion ofHCl-P fraction was higher under beech for the Inceptisols andgrasses for the Ultisol, but higher under forest covers for theMollisols and Spodosols.
Forest sites in the temperate climate are covered predomi-nantly by ectomycorrhizal tree species (e.g., Fagus or Piceaspp.), whereas grassland and pasture are covered predomi-nantly by arbuscular mycorrhizal plants. Arbuscular mycorrhi-zal fungi are especially effective in the uptake of P beyondthe rhizosphere (Zhu et al., 2001), which is reflected by arapid turnover in Po in soils under grass and a build-up of alarge, potentially labile, microbially derived Po pool (Guggen-
ª 2009 WILEY-VCH Verlag GmbH & Co. KGaA, Weinheim www.plant-soil.com
306 Negassa, Leinweber J. Plant Nutr. Soil Sci. 2009, 172, 305–325
ª 2009 WILEY-VCH Verlag GmbH & Co. KGaA, Weinheim www.plant-soil.com
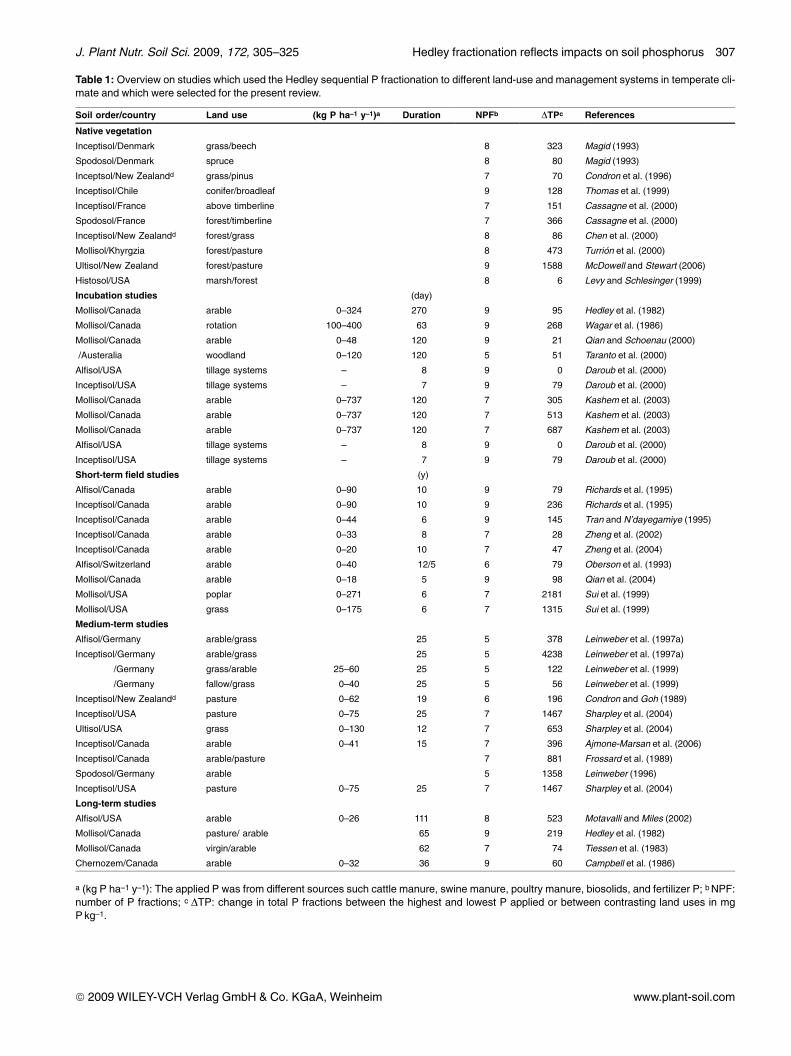
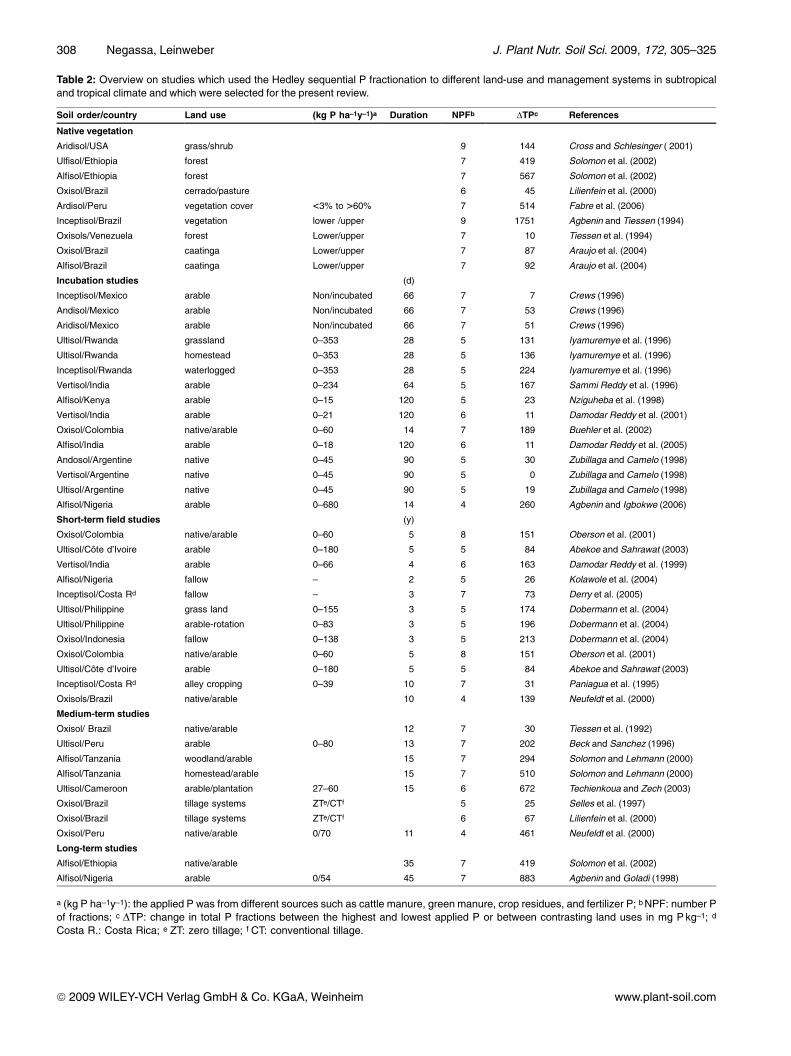
Table 1: Overview on studies which used the Hedley sequential P fractionation to different land-use and management systems in temperate cli-mate and which were selected for the present review.
Soil order/country Land use (kg P ha–1 y–1)a Duration NPFb DTPc References
Native vegetation
Inceptisol/Denmark grass/beech 8 323 Magid (1993)
Spodosol/Denmark spruce 8 80 Magid (1993)
Inceptsol/New Zealandd grass/pinus 7 70 Condron et al. (1996)
Inceptisol/Chile conifer/broadleaf 9 128 Thomas et al. (1999)
Inceptisol/France above timberline 7 151 Cassagne et al. (2000)
Spodosol/France forest/timberline 7 366 Cassagne et al. (2000)
Inceptisol/New Zealandd forest/grass 8 86 Chen et al. (2000)
Mollisol/Khyrgzia forest/pasture 8 473 Turri�n et al. (2000)
Ultisol/New Zealand forest/pasture 9 1588 McDowell and Stewart (2006)
Histosol/USA marsh/forest 8 6 Levy and Schlesinger (1999)
Incubation studies (day)
Mollisol/Canada arable 0–324 270 9 95 Hedley et al. (1982)
Mollisol/Canada rotation 100–400 63 9 268 Wagar et al. (1986)
Mollisol/Canada arable 0–48 120 9 21 Qian and Schoenau (2000)
/Austeralia woodland 0–120 120 5 51 Taranto et al. (2000)
Alfisol/USA tillage systems – 8 9 0 Daroub et al. (2000)
Inceptisol/USA tillage systems – 7 9 79 Daroub et al. (2000)
Mollisol/Canada arable 0–737 120 7 305 Kashem et al. (2003)
Mollisol/Canada arable 0–737 120 7 513 Kashem et al. (2003)
Mollisol/Canada arable 0–737 120 7 687 Kashem et al. (2003)
Alfisol/USA tillage systems – 8 9 0 Daroub et al. (2000)
Inceptisol/USA tillage systems – 7 9 79 Daroub et al. (2000)
Short-term field studies (y)
Alfisol/Canada arable 0–90 10 9 79 Richards et al. (1995)
Inceptisol/Canada arable 0–90 10 9 236 Richards et al. (1995)
Inceptisol/Canada arable 0–44 6 9 145 Tran and N’dayegamiye (1995)
Inceptisol/Canada arable 0–33 8 7 28 Zheng et al. (2002)
Inceptisol/Canada arable 0–20 10 7 47 Zheng et al. (2004)
Alfisol/Switzerland arable 0–40 12/5 6 79 Oberson et al. (1993)
Mollisol/Canada arable 0–18 5 9 98 Qian et al. (2004)
Mollisol/USA poplar 0–271 6 7 2181 Sui et al. (1999)
Mollisol/USA grass 0–175 6 7 1315 Sui et al. (1999)
Medium-term studies
Alfisol/Germany arable/grass 25 5 378 Leinweber et al. (1997a)
Inceptisol/Germany arable/grass 25 5 4238 Leinweber et al. (1997a)
/Germany grass/arable 25–60 25 5 122 Leinweber et al. (1999)
/Germany fallow/grass 0–40 25 5 56 Leinweber et al. (1999)
Inceptisol/New Zealandd pasture 0–62 19 6 196 Condron and Goh (1989)
Inceptisol/USA pasture 0–75 25 7 1467 Sharpley et al. (2004)
Ultisol/USA grass 0–130 12 7 653 Sharpley et al. (2004)
Inceptisol/Canada arable 0–41 15 7 396 Ajmone-Marsan et al. (2006)
Inceptisol/Canada arable/pasture 7 881 Frossard et al. (1989)
Spodosol/Germany arable 5 1358 Leinweber (1996)
Inceptisol/USA pasture 0–75 25 7 1467 Sharpley et al. (2004)
Long-term studies
Alfisol/USA arable 0–26 111 8 523 Motavalli and Miles (2002)
Mollisol/Canada pasture/ arable 65 9 219 Hedley et al. (1982)
Mollisol/Canada virgin/arable 62 7 74 Tiessen et al. (1983)
Chernozem/Canada arable 0–32 36 9 60 Campbell et al. (1986)
a (kg P ha–1 y–1): The applied P was from different sources such cattle manure, swine manure, poultry manure, biosolids, and fertilizer P; bNPF:number of P fractions; c DTP: change in total P fractions between the highest and lowest P applied or between contrasting land uses in mgPkg–1.
J. Plant Nutr. Soil Sci. 2009, 172, 305–325 Hedley fractionation reflects impacts on soil phosphorus 307
ª 2009 WILEY-VCH Verlag GmbH & Co. KGaA, Weinheim www.plant-soil.com
Table 2: Overview on studies which used the Hedley sequential P fractionation to different land-use and management systems in subtropicaland tropical climate and which were selected for the present review.
Soil order/country Land use (kg P ha–1y–1)a Duration NPFb DTPc References
Native vegetation
Aridisol/USA grass/shrub 9 144 Cross and Schlesinger ( 2001)
Ulfisol/Ethiopia forest 7 419 Solomon et al. (2002)
Alfisol/Ethiopia forest 7 567 Solomon et al. (2002)
Oxisol/Brazil cerrado/pasture 6 45 Lilienfein et al. (2000)
Ardisol/Peru vegetation cover <3% to >60% 7 514 Fabre et al. (2006)
Inceptisol/Brazil vegetation lower /upper 9 1751 Agbenin and Tiessen (1994)
Oxisols/Venezuela forest Lower/upper 7 10 Tiessen et al. (1994)
Oxisol/Brazil caatinga Lower/upper 7 87 Araujo et al. (2004)
Alfisol/Brazil caatinga Lower/upper 7 92 Araujo et al. (2004)
Incubation studies (d)
Inceptisol/Mexico arable Non/incubated 66 7 7 Crews (1996)
Andisol/Mexico arable Non/incubated 66 7 53 Crews (1996)
Aridisol/Mexico arable Non/incubated 66 7 51 Crews (1996)
Ultisol/Rwanda grassland 0–353 28 5 131 Iyamuremye et al. (1996)
Ultisol/Rwanda homestead 0–353 28 5 136 Iyamuremye et al. (1996)
Inceptisol/Rwanda waterlogged 0–353 28 5 224 Iyamuremye et al. (1996)
Vertisol/India arable 0–234 64 5 167 Sammi Reddy et al. (1996)
Alfisol/Kenya arable 0–15 120 5 23 Nziguheba et al. (1998)
Vertisol/India arable 0–21 120 6 11 Damodar Reddy et al. (2001)
Oxisol/Colombia native/arable 0–60 14 7 189 Buehler et al. (2002)
Alfisol/India arable 0–18 120 6 11 Damodar Reddy et al. (2005)
Andosol/Argentine native 0–45 90 5 30 Zubillaga and Camelo (1998)
Vertisol/Argentine native 0–45 90 5 0 Zubillaga and Camelo (1998)
Ultisol/Argentine native 0–45 90 5 19 Zubillaga and Camelo (1998)
Alfisol/Nigeria arable 0–680 14 4 260 Agbenin and Igbokwe (2006)
Short-term field studies (y)
Oxisol/Colombia native/arable 0–60 5 8 151 Oberson et al. (2001)
Ultisol/C�te d’Ivoire arable 0–180 5 5 84 Abekoe and Sahrawat (2003)
Vertisol/India arable 0–66 4 6 163 Damodar Reddy et al. (1999)
Alfisol/Nigeria fallow – 2 5 26 Kolawole et al. (2004)
Inceptisol/Costa Rd fallow – 3 7 73 Derry et al. (2005)
Ultisol/Philippine grass land 0–155 3 5 174 Dobermann et al. (2004)
Ultisol/Philippine arable-rotation 0–83 3 5 196 Dobermann et al. (2004)
Oxisol/Indonesia fallow 0–138 3 5 213 Dobermann et al. (2004)
Oxisol/Colombia native/arable 0–60 5 8 151 Oberson et al. (2001)
Ultisol/C�te d’Ivoire arable 0–180 5 5 84 Abekoe and Sahrawat (2003)
Inceptisol/Costa Rd alley cropping 0–39 10 7 31 Paniagua et al. (1995)
Oxisols/Brazil native/arable 10 4 139 Neufeldt et al. (2000)
Medium-term studies
Oxisol/ Brazil native/arable 12 7 30 Tiessen et al. (1992)
Ultisol/Peru arable 0–80 13 7 202 Beck and Sanchez (1996)
Alfisol/Tanzania woodland/arable 15 7 294 Solomon and Lehmann (2000)
Alfisol/Tanzania homestead/arable 15 7 510 Solomon and Lehmann (2000)
Ultisol/Cameroon arable/plantation 27–60 15 6 672 Techienkoua and Zech (2003)
Oxisol/Brazil tillage systems ZTe/CTf 5 25 Selles et al. (1997)
Oxisol/Brazil tillage systems ZTe/CTf 6 67 Lilienfein et al. (2000)
Oxisol/Peru native/arable 0/70 11 4 461 Neufeldt et al. (2000)
Long-term studies
Alfisol/Ethiopia native/arable 35 7 419 Solomon et al. (2002)
Alfisol/Nigeria arable 0/54 45 7 883 Agbenin and Goladi (1998)
a (kg P ha–1y–1): the applied P was from different sources such as cattle manure, green manure, crop residues, and fertilizer P; bNPF: number Pof fractions; c DTP: change in total P fractions between the highest and lowest applied P or between contrasting land uses in mg Pkg–1; d
Costa R.: Costa Rica; e ZT: zero tillage; f CT: conventional tillage.
308 Negassa, Leinweber J. Plant Nutr. Soil Sci. 2009, 172, 305–325
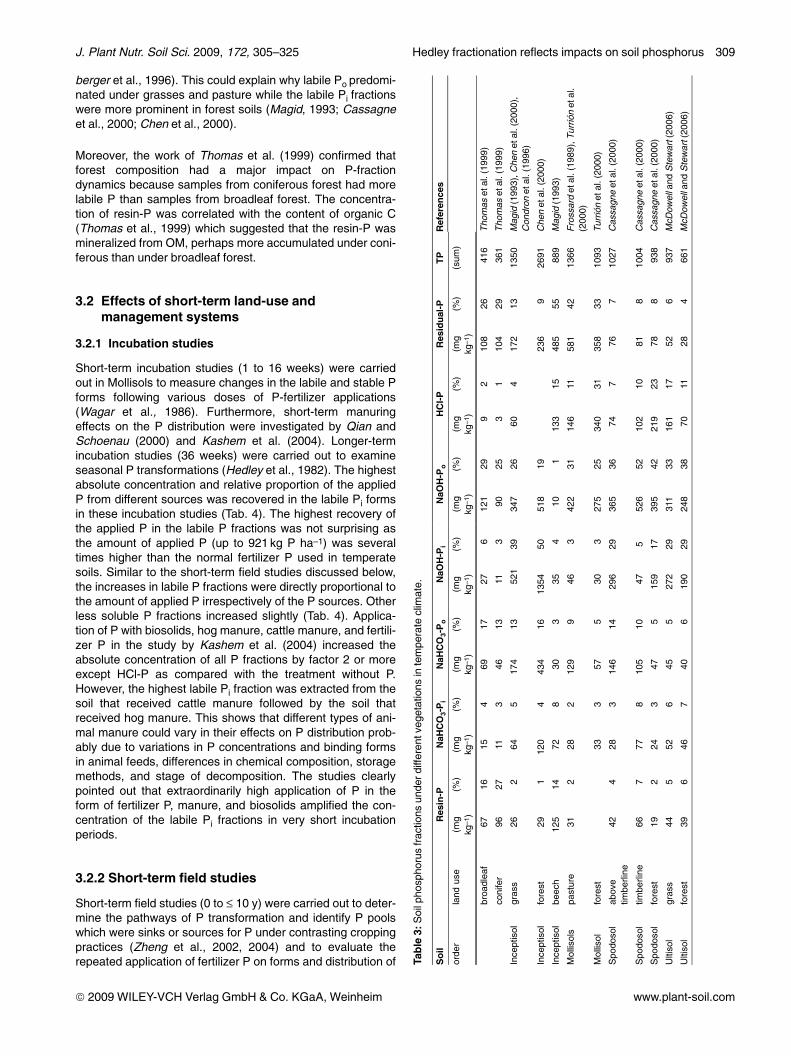
berger et al., 1996). This could explain why labile Po predomi-nated under grasses and pasture while the labile Pi fractionswere more prominent in forest soils (Magid, 1993; Cassagneet al., 2000; Chen et al., 2000).
Moreover, the work of Thomas et al. (1999) confirmed thatforest composition had a major impact on P-fractiondynamics because samples from coniferous forest had morelabile P than samples from broadleaf forest. The concentra-tion of resin-P was correlated with the content of organic C(Thomas et al., 1999) which suggested that the resin-P wasmineralized from OM, perhaps more accumulated under coni-ferous than under broadleaf forest.
3.2 Effects of short-term land-use andmanagement systems
3.2.1 Incubation studies
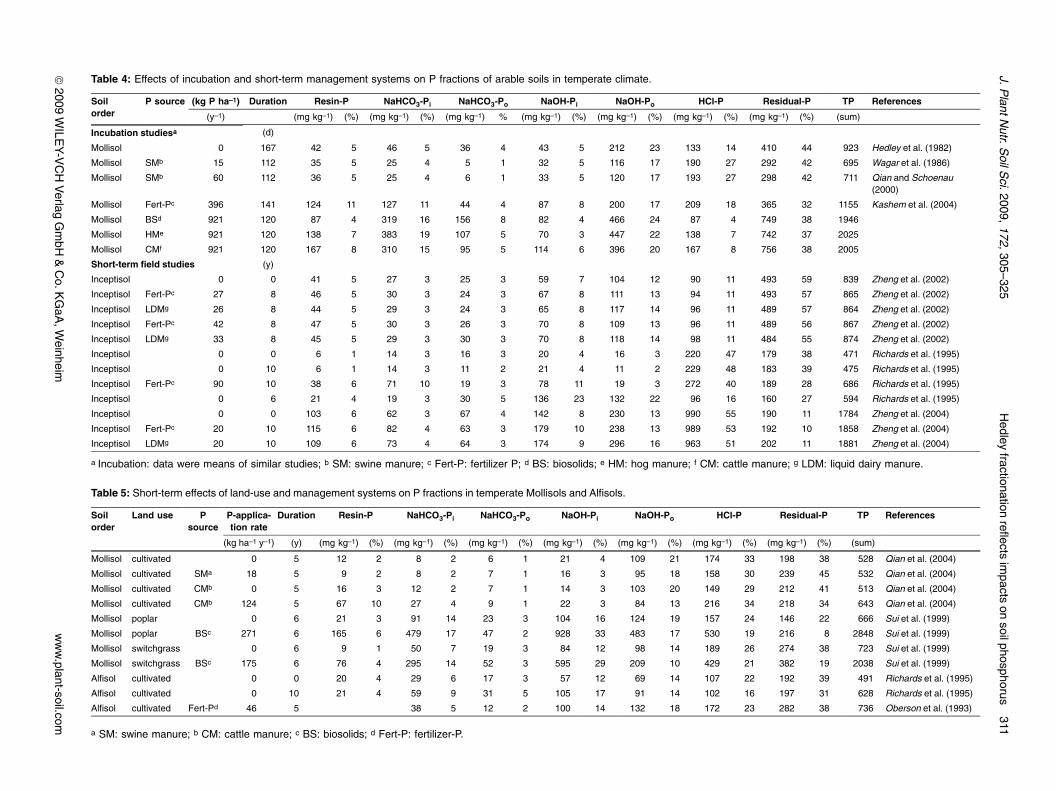
Short-term incubation studies (1 to 16 weeks) were carriedout in Mollisols to measure changes in the labile and stable Pforms following various doses of P-fertilizer applications(Wagar et al., 1986). Furthermore, short-term manuringeffects on the P distribution were investigated by Qian andSchoenau (2000) and Kashem et al. (2004). Longer-termincubation studies (36 weeks) were carried out to examineseasonal P transformations (Hedley et al., 1982). The highestabsolute concentration and relative proportion of the appliedP from different sources was recovered in the labile Pi formsin these incubation studies (Tab. 4). The highest recovery ofthe applied P in the labile P fractions was not surprising asthe amount of applied P (up to 921 kg P ha–1) was severaltimes higher than the normal fertilizer P used in temperatesoils. Similar to the short-term field studies discussed below,the increases in labile P fractions were directly proportional tothe amount of applied P irrespectively of the P sources. Otherless soluble P fractions increased slightly (Tab. 4). Applica-tion of P with biosolids, hog manure, cattle manure, and fertili-zer P in the study by Kashem et al. (2004) increased theabsolute concentration of all P fractions by factor 2 or moreexcept HCl-P as compared with the treatment without P.However, the highest labile Pi fraction was extracted from thesoil that received cattle manure followed by the soil thatreceived hog manure. This shows that different types of ani-mal manure could vary in their effects on P distribution prob-ably due to variations in P concentrations and binding formsin animal feeds, differences in chemical composition, storagemethods, and stage of decomposition. The studies clearlypointed out that extraordinarily high application of P in theform of fertilizer P, manure, and biosolids amplified the con-centration of the labile Pi fractions in very short incubationperiods.
3.2.2 Short-term field studies
Short-term field studies (0 to £ 10 y) were carried out to deter-mine the pathways of P transformation and identify P poolswhich were sinks or sources for P under contrasting croppingpractices (Zheng et al., 2002, 2004) and to evaluate therepeated application of fertilizer P on forms and distribution of
ª 2009 WILEY-VCH Verlag GmbH & Co. KGaA, Weinheim www.plant-soil.com
Table
3:Soilp
hosp
horusfrac
tions
unde
rdiffe
rent
vege
tatio
nsin
tempe
rate
clim
ate.
Soil
Res
in-P
NaH
CO
3-Pi
NaH
CO
3-Po
NaO
H-P
iNaO
H-P
oHCl-P
Res
idual-P
TP
Referen
ces
orde
rland
use
(mg
kg–1)
(%)
(mg
kg–1)
(%)
(mg
kg–1)
(%)
(mg
kg–1)
(%)
(mg
kg–1)
(%)
(mg
kg–1)
(%)
(mg
kg–1)
(%)
(sum
)
broa
dlea
f67
1615
469
1727
612
129
92
108
2641
6Tho
mas
etal.(19
99)
conifer
9627
113
4613
113
9025
31
104
2936
1Tho
mas
etal.(19
99)
Ince
ptisol
gras
s26
264
517
413
521
3934
726
604
172
1313
50Mag
id(199
3),C
henet
al.(20
00),
Con
dron
etal.(19
96)
Ince
ptisol
forest
291
120
443
416
1354
5051
819
236
926
91Che
net
al.(20
00)
Ince
ptisol
beec
h12
514
728
303
354
101
133
1548
555
889
Mag
id(199
3)
Mollisols
pasture
312
282
129
946
342
231
146
1158
142
1366
Fross
ardet
al.(19
89),Turri�
net
al.
(200
0)
Mollisol
forest
333
575
303
275
2534
031
358
3310
93Turri�
net
al.(20
00)
Spo
doso
lab
ove
timbe
rline
424
283
146
1429
629
365
3674
776
710
27Cas
sagn
eet
al.(20
00)
Spo
doso
ltim
berline
667
778
105
1047
552
652
102
1081
810
04Cas
sagn
eet
al.(20
00)
Spo
doso
lforest
192
243
475
159
1739
542
219
2378
893
8Cas
sagn
eet
al.(20
00)
Ultiso
lgras
s44
552
645
527
229
311
3316
117
526
937
McD
owella
ndStewart(20
06)
Ultiso
lforest
396
467
406
190
2924
838
7011
284
661
McD
owella
ndStewart(20
06)
J. Plant Nutr. Soil Sci. 2009, 172, 305–325 Hedley fractionation reflects impacts on soil phosphorus 309
soil Pi and Po (Richard et al., 1995) in Inceptisols (Tab. 4).The absolute concentration of the resin-P was 41 mg Pkg–1
at the inception of the study and increased by 2.6 to 6.3 mgPkg–1 with continuous application of P for 8 y at the rate of 26to 42 kg P ha–1 y–1 either from fertilizer P or liquid dairy man-ure (Zheng et al., 2002). A similar study conducted by thesame authors also indicated the highest resin-P (103mgkg–1) at the inception of the study that was changed by 8and 12 mg Pkg–1 with continuous application of 20 kg P ha–1
y–1 for 10 y in the form of liquid dairy manure and fertilizer P,respectively (Zheng et al., 2004). The unusually high P con-centrations in the resin fraction at the beginning of the studiesby Zheng et al. (2002, 2004) could be attributed to the Paccumulation from previous fertilizer-P applications as thestudies were conducted on agricultural research farms. Con-tinuous application of 0 to 42 kg P ha–1 y–1 for 8 to 10 y didnot change the absolute concentrations and the relative pro-portions of different P fractions in Inceptisols of differentcountries irrespectively of the P sources (Tab. 4). However,application of 90 kg P ha–1 y–1 for 10 y substantially increasedthe labile and moderately labile Pi fractions (Tab. 4) (Richardset al., 1995).
Short-term studies conducted on Mollisols and Alfisols oftemperate climate also showed that changes in P fractionsdepended on the amount of applied P regardless of Psources. For instance, both the absolute concentrations andproportions of different P fractions were slightly increased bylow P fertilization (<46 kg ha–1 y–1) for 5 y and substantiallyincreased by high P fertilization (>90 kg ha–1 y–1) (Obersonet al., 1993; Richards et al., 1995) (Tab. 5). For instance,extraordinary large P applications with cattle manure (Qianet al., 2004) and biosolids (Sui et al., 1999) highly enrichedthe labile and moderately labile Pi fractions. However, theabsolute concentrations and proportions of stable P fractions,particularly in soils treated with biosolids, decreased. Prob-ably this can be explained by an increased solubility of previ-ously stable P fractions due to the decrease in soil pH from6.2 to 5 (Sui et al., 1999). Surprisingly, both the absolute con-centrations and the proportions of the different P fractionsremained almost constant during continuous cultivation with-out any P application for 10 y (Tab. 5). This confirms studiesthat reported the Hedley sequential-P-fractionation schemeas insensitive to detect small changes in P fractions followingwithout P or with low rate of P application to agricultural soilsover short periods (Qian and Schoenau, 2000; Hylander andSim�n, 2006).
3.2.3 Phosphorus losses
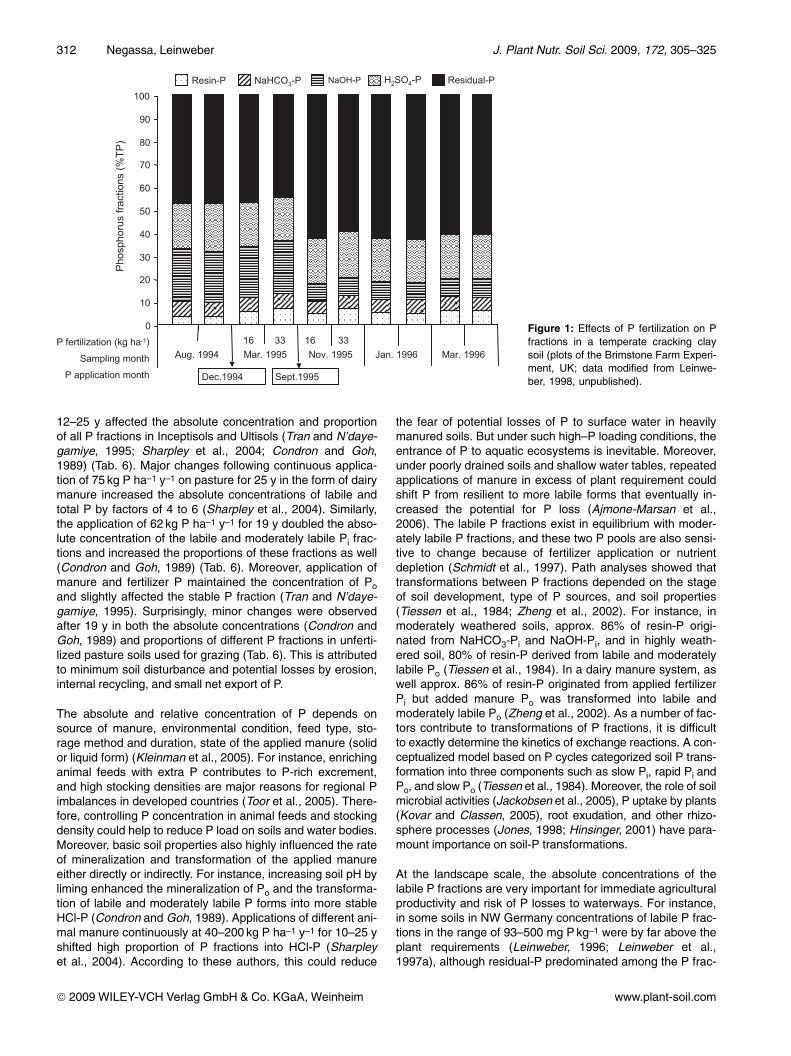
A few studies were carried out to explain P losses with leach-ing or preferential flow by Hedley fractions, which reflectedprevious P applications or imbalances. In a cracking clay soilof the Brimstone Experimental Farm (UK), the application of16 and 33 kg P ha–1 for two consecutive years did not affectboth the absolute concentration and the proportions of P frac-tions (Fig. 1). This was in line with the absence of any signifi-cant differences in the P losses with drainage water betweenthe fertilization treatments (Addiscott et al., 2000). However,in this experiment for the first time an unexpected but signifi-cant dependency of most P fractions on sampling date was
observed. Ranking of the dependent variables according toincreasing F probability indicated that sampling date influ-enced P fractions of lower solubility (NaOH-P, residual-P)more strongly than the more labile P (Olsen-P, resin-P, andH2O-P). The significant reduction in the proportions ofNaOH-P between March and November 1995 (Fig. 1) led todecreases in the concentrations of oxalate-extractable Alfrom approx. 90mmol kg–1 to approx. 60mmol kg–1 and to theincreased proportions of stable residual P. The latter could bean effect of shrinking of clay minerals that favor the formationof stable P–Al–organic matter bonds or inclusions. Further-more, some losses of NaOH-P were most probably con-nected with migrating of colloidal matter with fast preferential(by-pass) flows. Interestingly, P-fertilizer application in Sep-tember could not recover the previous proportions of labileand moderately labile P (Fig. 1).
Investigations on lysimeters filled with sand and loamy sandalso showed that soil texture determined P leaching fromsoils mainly because of hydraulic properties interacting withP binding (Leinweber et al., 1999). Among the sequential Pfractions, the P concentrations and leaching losses were sig-nificantly and positively correlated with NaHCO3-P but notwith resin-P. This indicated that not only phosphate ions butalso dissolved and colloidal matter contributes to P losses.This is in agreement with P losses greater for total P as deter-mined by IPC than for molybdenum-reactive P observed inthe Brimstone experimental field (Addiscott et al., 2000).
Susceptibility to runoff and distance to waterways are otherfactors that determined relationships between P fractions andeutrophication risk. Absolute concentrations and proportionsof different P fractions could be affected by slope position inspite of the same soil order, management, and weather con-dition (Wagar et al., 1986; Heilmann et al., 2005). After 5 y ofcropping, 15% of the applied P (160 kg ha–1) was taken up byplants, 60% remained in the top 15 cm, and 30% was recov-ered from below 15 cm (Wagar et al., 1986). According tothese authors, Po were the predominant P fractions below15 cm soil depth. This indicated that some Po fractions weremore mobile than Pi. Mobilization and downward movementof P was also increased by seasonal water ponding. Similarstudies also confirmed that pedogenesis and slope positionand resulting transport processes governed the distributionand forms of P and phosphatase activity at field scale (Heil-mann et al., 2005). These authors also stated that the con-centrations of labile and moderately labile Po and phospha-tase activity were highest in the lower slope positions whichwere sources of P losses. In general, the same soil orderunder different weather conditions, management history,slope position, and basic soil properties could differentlyaffect the distribution and losses of applied fertilizer P.
3.3 Effects of medium-term land-use andmanagement systems
A number of studies investigated the effects of medium-term(10–25 y) land-use and management systems in various soiltypes of temperate climate (Tab. 6). Application of 40 to130 kg P y–1 in form of manure and mineral fertilizer for
ª 2009 WILEY-VCH Verlag GmbH & Co. KGaA, Weinheim www.plant-soil.com
310 Negassa, Leinweber J. Plant Nutr. Soil Sci. 2009, 172, 305–325
ª2009
WILE
Y-VCHVerlag
GmbH
&Co.K
GaA
,Weinheim
www.plant-soil.com
Table 4: Effects of incubation and short-term management systems on P fractions of arable soils in temperate climate.
Soilorder
P source (kg P ha–1) Duration Resin-P NaHCO3-Pi NaHCO3-Po NaOH-Pi NaOH-Po HCl-P Residual-P TP References
(y–1) (mg kg–1) (%) (mg kg–1) (%) (mg kg–1) % (mg kg–1) (%) (mg kg–1) (%) (mg kg–1) (%) (mg kg–1) (%) (sum)
Incubation studiesa (d)
Mollisol 0 167 42 5 46 5 36 4 43 5 212 23 133 14 410 44 923 Hedley et al. (1982)
Mollisol SMb 15 112 35 5 25 4 5 1 32 5 116 17 190 27 292 42 695 Wagar et al. (1986)
Mollisol SMb 60 112 36 5 25 4 6 1 33 5 120 17 193 27 298 42 711 Qian and Schoenau(2000)
Mollisol Fert-Pc 396 141 124 11 127 11 44 4 87 8 200 17 209 18 365 32 1155 Kashem et al. (2004)
Mollisol BSd 921 120 87 4 319 16 156 8 82 4 466 24 87 4 749 38 1946
Mollisol HMe 921 120 138 7 383 19 107 5 70 3 447 22 138 7 742 37 2025
Mollisol CMf 921 120 167 8 310 15 95 5 114 6 396 20 167 8 756 38 2005
Short-term field studies (y)
Inceptisol 0 0 41 5 27 3 25 3 59 7 104 12 90 11 493 59 839 Zheng et al. (2002)
Inceptisol Fert-Pc 27 8 46 5 30 3 24 3 67 8 111 13 94 11 493 57 865 Zheng et al. (2002)
Inceptisol LDMg 26 8 44 5 29 3 24 3 65 8 117 14 96 11 489 57 864 Zheng et al. (2002)
Inceptisol Fert-Pc 42 8 47 5 30 3 26 3 70 8 109 13 96 11 489 56 867 Zheng et al. (2002)
Inceptisol LDMg 33 8 45 5 29 3 30 3 70 8 118 14 98 11 484 55 874 Zheng et al. (2002)
Inceptisol 0 0 6 1 14 3 16 3 20 4 16 3 220 47 179 38 471 Richards et al. (1995)
Inceptisol 0 10 6 1 14 3 11 2 21 4 11 2 229 48 183 39 475 Richards et al. (1995)
Inceptisol Fert-Pc 90 10 38 6 71 10 19 3 78 11 19 3 272 40 189 28 686 Richards et al. (1995)
Inceptisol 0 6 21 4 19 3 30 5 136 23 132 22 96 16 160 27 594 Richards et al. (1995)
Inceptisol 0 0 103 6 62 3 67 4 142 8 230 13 990 55 190 11 1784 Zheng et al. (2004)
Inceptisol Fert-Pc 20 10 115 6 82 4 63 3 179 10 238 13 989 53 192 10 1858 Zheng et al. (2004)
Inceptisol LDMg 20 10 109 6 73 4 64 3 174 9 296 16 963 51 202 11 1881 Zheng et al. (2004)
a Incubation: data were means of similar studies; b SM: swine manure; c Fert-P: fertilizer P; d BS: biosolids; e HM: hog manure; f CM: cattle manure; g LDM: liquid dairy manure.
Table 5: Short-term effects of land-use and management systems on P fractions in temperate Mollisols and Alfisols.
Soilorder
Land use Psource
P-applica-tion rate
Duration Resin-P NaHCO3-Pi NaHCO3-Po NaOH-Pi NaOH-Po HCl-P Residual-P TP References
(kg ha–1 y–1) (y) (mg kg–1) (%) (mg kg–1) (%) (mg kg–1) (%) (mg kg–1) (%) (mg kg–1) (%) (mg kg–1) (%) (mg kg–1) (%) (sum)
Mollisol cultivated 0 5 12 2 8 2 6 1 21 4 109 21 174 33 198 38 528 Qian et al. (2004)
Mollisol cultivated SMa 18 5 9 2 8 2 7 1 16 3 95 18 158 30 239 45 532 Qian et al. (2004)
Mollisol cultivated CMb 0 5 16 3 12 2 7 1 14 3 103 20 149 29 212 41 513 Qian et al. (2004)
Mollisol cultivated CMb 124 5 67 10 27 4 9 1 22 3 84 13 216 34 218 34 643 Qian et al. (2004)
Mollisol poplar 0 6 21 3 91 14 23 3 104 16 124 19 157 24 146 22 666 Sui et al. (1999)
Mollisol poplar BSc 271 6 165 6 479 17 47 2 928 33 483 17 530 19 216 8 2848 Sui et al. (1999)
Mollisol switchgrass 0 6 9 1 50 7 19 3 84 12 98 14 189 26 274 38 723 Sui et al. (1999)
Mollisol switchgrass BSc 175 6 76 4 295 14 52 3 595 29 209 10 429 21 382 19 2038 Sui et al. (1999)
Alfisol cultivated 0 0 20 4 29 6 17 3 57 12 69 14 107 22 192 39 491 Richards et al. (1995)
Alfisol cultivated 0 10 21 4 59 9 31 5 105 17 91 14 102 16 197 31 628 Richards et al. (1995)
Alfisol cultivated Fert-Pd 46 5 38 5 12 2 100 14 132 18 172 23 282 38 736 Oberson et al. (1993)
a SM: swine manure; b CM: cattle manure; c BS: biosolids; d Fert-P: fertilizer-P.
J.PlantN
utr.SoilS
ci.2009,172,305–325Hedley
fractionationreflects
impacts
onsoilphosphorus
311
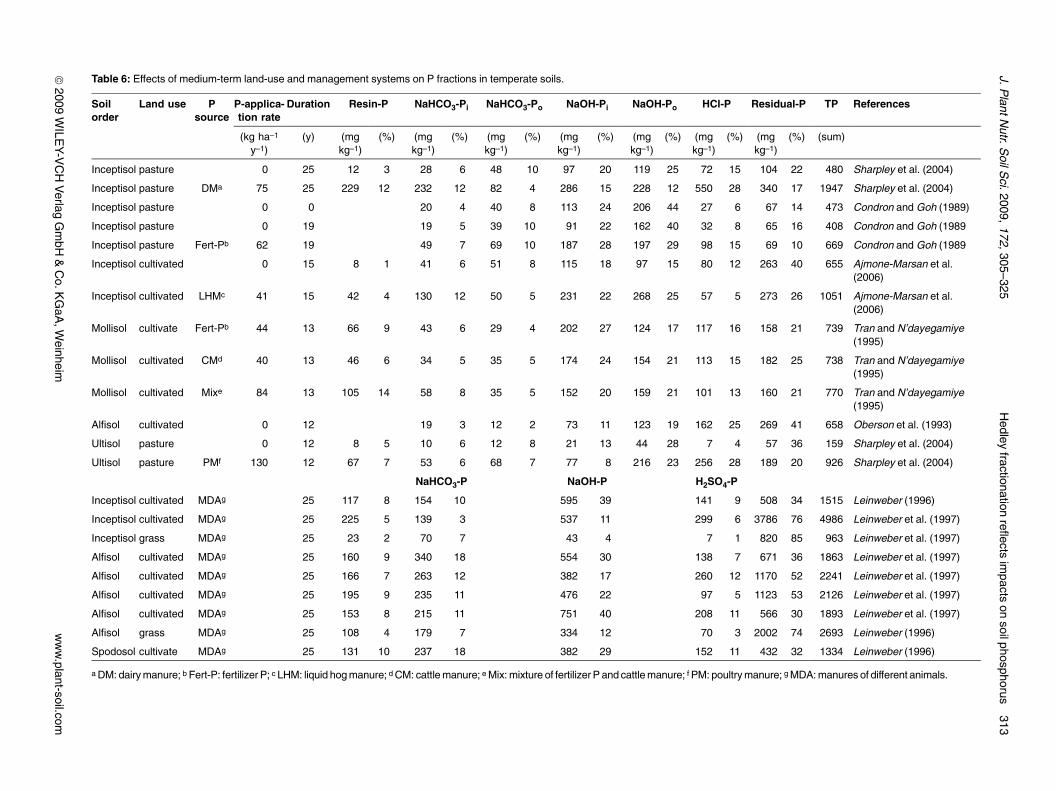
12–25 y affected the absolute concentration and proportionof all P fractions in Inceptisols and Ultisols (Tran and N’daye-gamiye, 1995; Sharpley et al., 2004; Condron and Goh,1989) (Tab. 6). Major changes following continuous applica-tion of 75 kg P ha–1 y–1 on pasture for 25 y in the form of dairymanure increased the absolute concentrations of labile andtotal P by factors of 4 to 6 (Sharpley et al., 2004). Similarly,the application of 62 kg P ha–1 y–1 for 19 y doubled the abso-lute concentration of the labile and moderately labile Pi frac-tions and increased the proportions of these fractions as well(Condron and Goh, 1989) (Tab. 6). Moreover, application ofmanure and fertilizer P maintained the concentration of Poand slightly affected the stable P fraction (Tran and N’daye-gamiye, 1995). Surprisingly, minor changes were observedafter 19 y in both the absolute concentrations (Condron andGoh, 1989) and proportions of different P fractions in unferti-lized pasture soils used for grazing (Tab. 6). This is attributedto minimum soil disturbance and potential losses by erosion,internal recycling, and small net export of P.
The absolute and relative concentration of P depends onsource of manure, environmental condition, feed type, sto-rage method and duration, state of the applied manure (solidor liquid form) (Kleinman et al., 2005). For instance, enrichinganimal feeds with extra P contributes to P-rich excrement,and high stocking densities are major reasons for regional Pimbalances in developed countries (Toor et al., 2005). There-fore, controlling P concentration in animal feeds and stockingdensity could help to reduce P load on soils and water bodies.Moreover, basic soil properties also highly influenced the rateof mineralization and transformation of the applied manureeither directly or indirectly. For instance, increasing soil pH byliming enhanced the mineralization of Po and the transforma-tion of labile and moderately labile P forms into more stableHCl-P (Condron and Goh, 1989). Applications of different ani-mal manure continuously at 40–200 kg P ha–1 y–1 for 10–25 yshifted high proportion of P fractions into HCl-P (Sharpleyet al., 2004). According to these authors, this could reduce
the fear of potential losses of P to surface water in heavilymanured soils. But under such high–P loading conditions, theentrance of P to aquatic ecosystems is inevitable. Moreover,under poorly drained soils and shallow water tables, repeatedapplications of manure in excess of plant requirement couldshift P from resilient to more labile forms that eventually in-creased the potential for P loss (Ajmone-Marsan et al.,2006). The labile P fractions exist in equilibrium with moder-ately labile P fractions, and these two P pools are also sensi-tive to change because of fertilizer application or nutrientdepletion (Schmidt et al., 1997). Path analyses showed thattransformations between P fractions depended on the stageof soil development, type of P sources, and soil properties(Tiessen et al., 1984; Zheng et al., 2002). For instance, inmoderately weathered soils, approx. 86% of resin-P origi-nated from NaHCO3-Pi and NaOH-Pi, and in highly weath-ered soil, 80% of resin-P derived from labile and moderatelylabile Po (Tiessen et al., 1984). In a dairy manure system, aswell approx. 86% of resin-P originated from applied fertilizerPi but added manure Po was transformed into labile andmoderately labile Po (Zheng et al., 2002). As a number of fac-tors contribute to transformations of P fractions, it is difficultto exactly determine the kinetics of exchange reactions. A con-ceptualized model based on P cycles categorized soil P trans-formation into three components such as slow Pi, rapid Pi andPo, and slow Po (Tiessen et al., 1984). Moreover, the role of soilmicrobial activities (Jackobsen et al., 2005), P uptake by plants(Kovar and Classen, 2005), root exudation, and other rhizo-sphere processes (Jones, 1998; Hinsinger, 2001) have para-mount importance on soil-P transformations.
At the landscape scale, the absolute concentrations of thelabile P fractions are very important for immediate agriculturalproductivity and risk of P losses to waterways. For instance,in some soils in NW Germany concentrations of labile P frac-tions in the range of 93–500 mg Pkg–1 were by far above theplant requirements (Leinweber, 1996; Leinweber et al.,1997a), although residual-P predominated among the P frac-
ª 2009 WILEY-VCH Verlag GmbH & Co. KGaA, Weinheim www.plant-soil.com
0
10
20
30
40
50
60
70
80
90
100
P fertilization (kg ha-1)
Sampling month
P application month
16 33 16 33Aug. 1994 Mar. 1995 Nov. 1995 Jan. 1996 Mar. 1996
Pho
spho
rus
fract
ions
(%TP
)
Resin-P NaOH-P Residual-PNaHCO3-P H2SO4-P
Dec.1994 Sept.1995
Figure 1: Effects of P fertilization on Pfractions in a temperate cracking claysoil (plots of the Brimstone Farm Experi-ment, UK; data modified from Leinwe-ber, 1998, unpublished).
312 Negassa, Leinweber J. Plant Nutr. Soil Sci. 2009, 172, 305–325
ª2009
WILE
Y-VCHVerlag
GmbH
&Co.K
GaA
,Weinheim
www.plant-soil.com
Table 6: Effects of medium-term land-use and management systems on P fractions in temperate soils.
Soilorder
Land use Psource
P-applica-tion rate
Duration Resin-P NaHCO3-Pi NaHCO3-Po NaOH-Pi NaOH-Po HCl-P Residual-P TP References
(kg ha–1
y–1)(y) (mg
kg–1)(%) (mg
kg–1)(%) (mg
kg–1)(%) (mg
kg–1)(%) (mg
kg–1)(%) (mg
kg–1)(%) (mg
kg–1)(%) (sum)
Inceptisol pasture 0 25 12 3 28 6 48 10 97 20 119 25 72 15 104 22 480 Sharpley et al. (2004)
Inceptisol pasture DMa 75 25 229 12 232 12 82 4 286 15 228 12 550 28 340 17 1947 Sharpley et al. (2004)
Inceptisol pasture 0 0 20 4 40 8 113 24 206 44 27 6 67 14 473 Condron and Goh (1989)
Inceptisol pasture 0 19 19 5 39 10 91 22 162 40 32 8 65 16 408 Condron and Goh (1989
Inceptisol pasture Fert-Pb 62 19 49 7 69 10 187 28 197 29 98 15 69 10 669 Condron and Goh (1989
Inceptisol cultivated 0 15 8 1 41 6 51 8 115 18 97 15 80 12 263 40 655 Ajmone-Marsan et al.(2006)
Inceptisol cultivated LHMc 41 15 42 4 130 12 50 5 231 22 268 25 57 5 273 26 1051 Ajmone-Marsan et al.(2006)
Mollisol cultivate Fert-Pb 44 13 66 9 43 6 29 4 202 27 124 17 117 16 158 21 739 Tran and N’dayegamiye(1995)
Mollisol cultivated CMd 40 13 46 6 34 5 35 5 174 24 154 21 113 15 182 25 738 Tran and N’dayegamiye(1995)
Mollisol cultivated Mixe 84 13 105 14 58 8 35 5 152 20 159 21 101 13 160 21 770 Tran and N’dayegamiye(1995)
Alfisol cultivated 0 12 19 3 12 2 73 11 123 19 162 25 269 41 658 Oberson et al. (1993)
Ultisol pasture 0 12 8 5 10 6 12 8 21 13 44 28 7 4 57 36 159 Sharpley et al. (2004)
Ultisol pasture PMf 130 12 67 7 53 6 68 7 77 8 216 23 256 28 189 20 926 Sharpley et al. (2004)
NaHCO3-P NaOH-P H2SO4-P
Inceptisol cultivated MDAg 25 117 8 154 10 595 39 141 9 508 34 1515 Leinweber (1996)
Inceptisol cultivated MDAg 25 225 5 139 3 537 11 299 6 3786 76 4986 Leinweber et al. (1997)
Inceptisol grass MDAg 25 23 2 70 7 43 4 7 1 820 85 963 Leinweber et al. (1997)
Alfisol cultivated MDAg 25 160 9 340 18 554 30 138 7 671 36 1863 Leinweber et al. (1997)
Alfisol cultivated MDAg 25 166 7 263 12 382 17 260 12 1170 52 2241 Leinweber et al. (1997)
Alfisol cultivated MDAg 25 195 9 235 11 476 22 97 5 1123 53 2126 Leinweber et al. (1997)
Alfisol cultivated MDAg 25 153 8 215 11 751 40 208 11 566 30 1893 Leinweber et al. (1997)
Alfisol grass MDAg 25 108 4 179 7 334 12 70 3 2002 74 2693 Leinweber (1996)
Spodosol cultivate MDAg 25 131 10 237 18 382 29 152 11 432 32 1334 Leinweber (1996)
a DM: dairymanure; b Fert-P: fertilizer P; c LHM: liquid hogmanure; d CM: cattlemanure; eMix:mixture of fertilizer P and cattlemanure; f PM: poultrymanure; gMDA:manures of different animals.
J.PlantN
utr.SoilS
ci.2009,172,305–325Hedley
fractionationreflects
impacts
onsoilphosphorus
313
tions (Tab. 6). These extraordinary high P concentrations inlabile forms are explained by excrement inputs from a largenumber of pigs, poultry, and cattle productions that couldthreaten water quality due to eutrophication. Although the ex-tent of labile P builds-up differed with soil types, land use,and livestock density, the highest degree of P saturation(139%) as compared with elsewhere in Europe was reportedfrom this region (Leinweber et al., 1997b).
3.4 Effects of long-term land-use and managementsystems
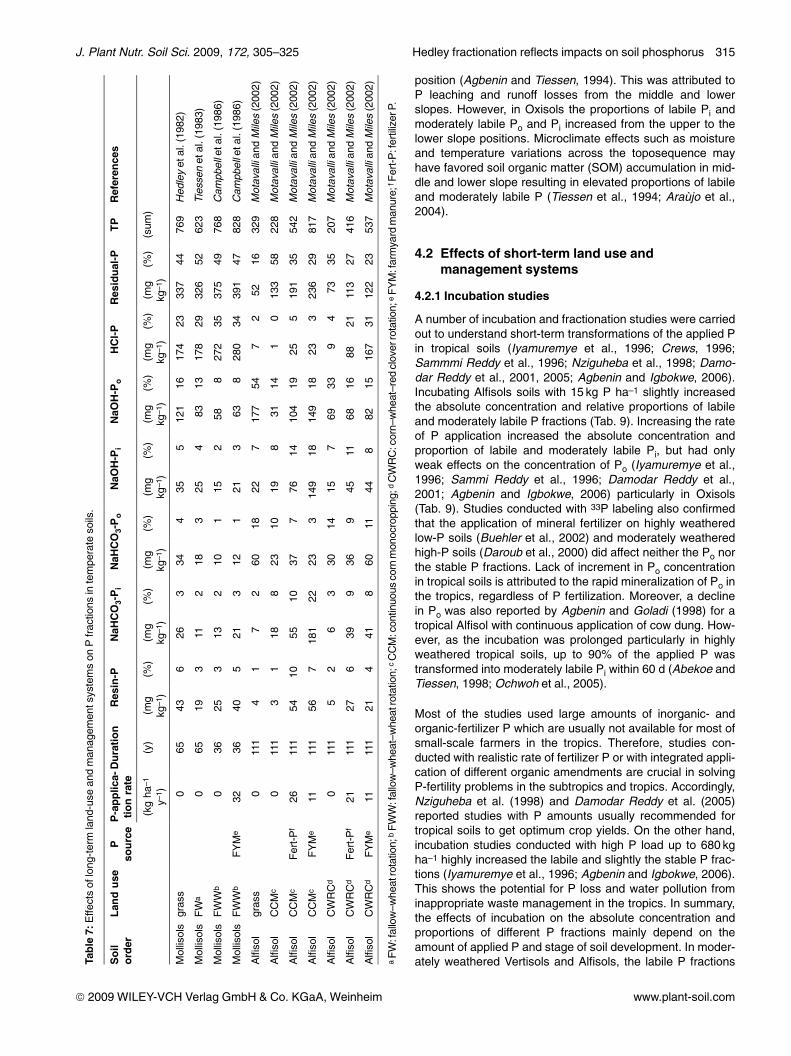
Several studies investigated the impact of long-term differentland-use and management systems on P fractions in tempe-rate soils (Tiessen et al., 1983; Campbell et al., 1986; Mota-valli and Miles, 2002). These studies showed that cultivationwithout fertilizer-P input for long time depleted most of the Pfractions and vice versa with P input regardless of the amountof applied P (Tab. 7). Long-term applications of manure andfertilizer P increased all P fractions irrespectively of theamount of applied P as compared with native prairie and con-tinuous cropping without P input (Motavalli and Miles, 2002).The studies showed that continuous monoculture and croprotation without P application depleted all P fractions. How-ever, residual-P was enriched in the continuous monocultureand highly depleted in the crop rotation. McKenzie et al.(1992) also indicated that the intensity of P depletion variedwith cropping systems. The depletion of different P fractionswas higher in monocultures (continuous wheat) than in croprotations if other conditions were comparable. The soilsunder crop rotations had higher proportions and concentra-tion of Po fractions than similar soils under monoculture(Motavalli and Miles, 2002). This difference between thecropping systems in concentration of different P fractionscould be caused by variation in crop types, crop-residue man-agement systems, climatic condition, and temporal P fluctua-tions among seasons (Oberson et al., 1996) and associatedmicroorganisms in the rhizosphere. The long-term influenceof P applications on Po fractions generally was minimal irre-spectively of the sources and amount of applied P (Campbellet al., 1986;Motavalli and Miles, 2002).
Continuous cultivation for 65 y without P input considerablydepleted the concentration of all P fractions except the HCl-Pfraction in Mollisols as compared with the adjacent unculti-vated prairie (Tiessen et al., 1983). Disproportional depletionof moderately labile P increased the proportion of HCl-Pwhich was the dominant P form in moderately weatheredsoils (Schoenau et al., 1989; Cross and Schlesinger, 1995).However, a Mollisol which received approx. 32 kg P ha–1 y–1
for 36 y had increased concentrations of the labile Pi fractionby 38% as compared with the untreated plot of the samecropping system (Campbell et al., 1986). Continuous long-term P applications at low rate could increase the concentra-tion of labile and moderately labile P fractions. As crops andpastures removed certain amounts of the applied P throughharvesting, the major portions returned to the soils in the formof above- and belowground residues. Therefore, special pre-cautions are required in managing soils subjected to continu-ous long-term P applications even if the P dose is low.
In summary, loading temperate soils with large amounts of Pfrom different sources resulted in large increases in the mostlabile P fractions regardless of the period of applications.Moreover, continuous applications of low doses of fertilizer P(11 to 32 kg P ha–1 y–1) for 36–111 y increased almost all Pfractions. Soil-textural classes, slope position, and seasonalwater ponding were found to affect leaching losses of labile Pfractions with pronounced mobility in Po forms. Therefore,either high P loading within a short-term or low fertilizer-Papplication surplus to removal in the long-term is potentiallyrisky for the nutrient status of aquatic ecosystems. On theother hand, continuous cultivation without P input highlydepleted the labile and moderately labile P fractions, whereasit moderately depleted the stable P fractions. Although cropproduction without P application is not a common practice ontemperate soils, judicious application of different P sourceson agricultural lands are required. This entails consideringthe P uptake and efficiency of the crop in balance with P addi-tion, using residual-P from previously applied P for crop pro-duction, and appropriate animal-waste management for sus-tainable production and productivity of both conventional andorganic farming.
4 Effects of land use and management on Pfractions in subtropical and tropical soils
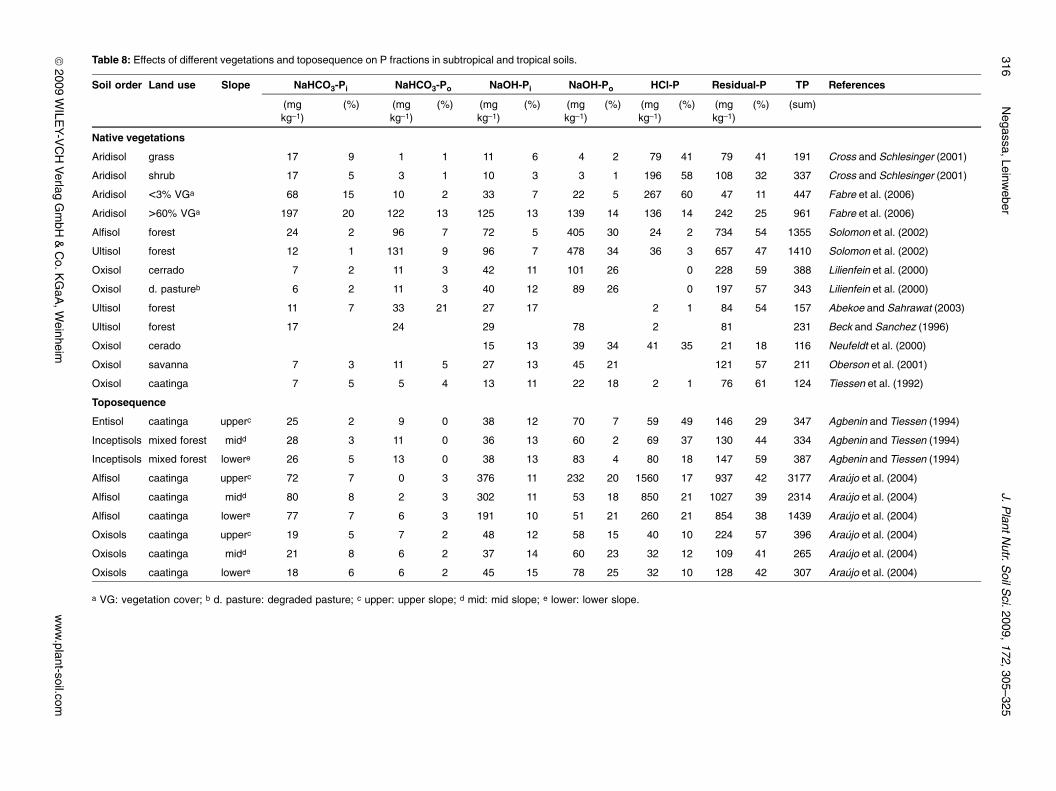
4.1 Native vegetation covers and toposequence
Many studies in tropical regions investigated P fractionsunder native vegetation covers (Lilienfein et al., 2000; Crossand Schlesinger, 2001; Solomon et al., 2002; Fabre et al.,2006) and/or toposequence effects on the distribution of Pfractions (Agbenin and Tiessen, 1994; Araujo et al., 2004).Some studies also compared anthropogenic disturbed agroe-cosystems to native vegetation cover (Tiessen et al., 1992;Beck and Sanchez, 1996; Neufeldt et al., 2000; Obersonet al., 2001; Abekoe and Sahrawat, 2003). The general orderof different P fractions was based on the stage of soil devel-opment and percent of vegetation cover. Accordingly, the Ari-disols were highly dominated by HCl-P fractions, whereas theUltisols and Oxisols were dominated by residual-P (Tab. 8).Residual-P in Aridisols and moderately labile Po in moder-ately and highly weathered tropical soils were the secondhigher concentration and proportion of P fractions (Tab. 8).Increasing percent of vegetation cover on Aridsols largelyaugmented the labile and moderately labile P fractions at theexpense of the stable P fraction. This clearly shows that notonly the stage of soil development (Cross and Schlesinger,1995) but also percent and type of vegetation cover (Crossand Schlesinger, 2001; Fabre et al., 2006) govern the con-centrations and proportions of biogeochemical P forms in sur-face soils.
Table 8 also shows the influence of toposequence on P formsand distribution in tropical soils. The differences in both abso-lute concentration and proportion of different P fractions weremore pronounced when the soils and vegetation differedacross the toposequence. In a toposequence with associatedEntisols and Inceptisols, the absolute concentration of almostall P fractions decreased from the upper to the lower slope
ª 2009 WILEY-VCH Verlag GmbH & Co. KGaA, Weinheim www.plant-soil.com
314 Negassa, Leinweber J. Plant Nutr. Soil Sci. 2009, 172, 305–325
position (Agbenin and Tiessen, 1994). This was attributed toP leaching and runoff losses from the middle and lowerslopes. However, in Oxisols the proportions of labile Pi andmoderately labile Po and Pi increased from the upper to thelower slope positions. Microclimate effects such as moistureand temperature variations across the toposequence mayhave favored soil organic matter (SOM) accumulation in mid-dle and lower slope resulting in elevated proportions of labileand moderately labile P (Tiessen et al., 1994; Ara�jo et al.,2004).
4.2 Effects of short-term land use andmanagement systems
4.2.1 Incubation studies
A number of incubation and fractionation studies were carriedout to understand short-term transformations of the applied Pin tropical soils (Iyamuremye et al., 1996; Crews, 1996;Sammmi Reddy et al., 1996; Nziguheba et al., 1998; Damo-dar Reddy et al., 2001, 2005; Agbenin and Igbokwe, 2006).Incubating Alfisols soils with 15 kg P ha–1 slightly increasedthe absolute concentration and relative proportions of labileand moderately labile P fractions (Tab. 9). Increasing the rateof P application increased the absolute concentration andproportion of labile and moderately labile Pi, but had onlyweak effects on the concentration of Po (Iyamuremye et al.,1996; Sammi Reddy et al., 1996; Damodar Reddy et al.,2001; Agbenin and Igbokwe, 2006) particularly in Oxisols(Tab. 9). Studies conducted with 33P labeling also confirmedthat the application of mineral fertilizer on highly weatheredlow-P soils (Buehler et al., 2002) and moderately weatheredhigh-P soils (Daroub et al., 2000) did affect neither the Po northe stable P fractions. Lack of increment in Po concentrationin tropical soils is attributed to the rapid mineralization of Po inthe tropics, regardless of P fertilization. Moreover, a declinein Po was also reported by Agbenin and Goladi (1998) for atropical Alfisol with continuous application of cow dung. How-ever, as the incubation was prolonged particularly in highlyweathered tropical soils, up to 90% of the applied P wastransformed into moderately labile Pi within 60 d (Abekoe andTiessen, 1998; Ochwoh et al., 2005).
Most of the studies used large amounts of inorganic- andorganic-fertilizer P which are usually not available for most ofsmall-scale farmers in the tropics. Therefore, studies con-ducted with realistic rate of fertilizer P or with integrated appli-cation of different organic amendments are crucial in solvingP-fertility problems in the subtropics and tropics. Accordingly,Nziguheba et al. (1998) and Damodar Reddy et al. (2005)reported studies with P amounts usually recommended fortropical soils to get optimum crop yields. On the other hand,incubation studies conducted with high P load up to 680 kgha–1 highly increased the labile and slightly the stable P frac-tions (Iyamuremye et al., 1996; Agbenin and Igbokwe, 2006).This shows the potential for P loss and water pollution frominappropriate waste management in the tropics. In summary,the effects of incubation on the absolute concentration andproportions of different P fractions mainly depend on theamount of applied P and stage of soil development. In moder-ately weathered Vertisols and Alfisols, the labile P fractions
ª 2009 WILEY-VCH Verlag GmbH & Co. KGaA, Weinheim www.plant-soil.com
Table
7:Effe
ctsof
long
-term
land
-use
andman
agem
ents
ystemson
Pfrac
tions
intempe
rate
soils.
Soil
order
Lan
duse
Pso
urce
P-applic
a-tionrate
Duration
Res
in-P
NaH
CO
3-Pi
NaH
CO
3-Po
NaO
H-P
iNaO
H-P
oHCl-P
Res
idual-P
TP
Referen
ces
(kgha
–1
y–1 )
(y)
(mg
kg–1)
(%)
(mg
kg–1)
(%)
(mg
kg–1)
(%)
(mg
kg–1)
(%)
(mg
kg–1)
(%)
(mg
kg–1)
(%)
(mg
kg–1)
(%)
(sum
)
Mollisols
gras
s0
6543
626
334
435
512
116
174
2333
744
769
Hed
leyet
al.(19
82)
Mollisols
FW
a0
6519
311
218
325
483
1317
829
326
5262
3Ties
senet
al.(19
83)
Mollisols
FWW
b0
3625
313
210
115
258
827
235
375
4976
8Cam
pbelle
tal.(198
6)
Mollisols
FWW
bFYM
e32
3640
521
312
121
363
828
034
391
4782
8Cam
pbelle
tal.(198
6)
Alfiso
lgras
s0
111
41
72
6018
227
177
547
252
1632
9Motav
allian
dMiles(200
2)
Alfiso
lCCM
c0
111
31
188
2310
198
3114
10
133
5822
8Motav
allian
dMiles(200
2)
Alfiso
lCCM
cFert-Pf
26111
5410
5510
377
7614
104
1925
519
135
542
Motav
allian
dMiles(200
2)
Alfiso
lCCM
cFYM
e11
111
567
181
2223
314
918
149
1823
323
629
817
Motav
allian
dMiles(200
2)
Alfiso
lCWRCd
0111
52
63
3014
157
6933
94
7335
207
Motav
allian
dMiles(200
2)
Alfiso
lCWRCd
Fert-Pf
21111
276
399
369
4511
6816
8821
113
2741
6Motav
allian
dMiles(200
2)
Alfiso
lCWRCd
FYM
e11
111
214
418
6011
448
8215
167
3112
223
537
Motav
allian
dMiles(200
2)
aFW:fallow–w
heatrotatio
n;bFWW:fallow–w
heat–w
heatrotatio
n;cCCM:con
tinuo
usco
rnmon
ocropp
ing;
dCWRC:corn–
whe
at–red
clov
errotatio
n;eFYM:farmya
rdman
ure;
f Fert-P:fertilizer
P.
J. Plant Nutr. Soil Sci. 2009, 172, 305–325 Hedley fractionation reflects impacts on soil phosphorus 315
ª2009
WILE
Y-VCHVerlag
GmbH
&Co.K
GaA
,Weinheim
www.plant-soil.com
Table 8: Effects of different vegetations and toposequence on P fractions in subtropical and tropical soils.
Soil order Land use Slope NaHCO3-Pi NaHCO3-Po NaOH-Pi NaOH-Po HCl-P Residual-P TP References
(mgkg–1)
(%) (mgkg–1)
(%) (mgkg–1)
(%) (mgkg–1)
(%) (mgkg–1)
(%) (mgkg–1)
(%) (sum)
Native vegetations
Aridisol grass 17 9 1 1 11 6 4 2 79 41 79 41 191 Cross and Schlesinger (2001)
Aridisol shrub 17 5 3 1 10 3 3 1 196 58 108 32 337 Cross and Schlesinger (2001)
Aridisol <3% VGa 68 15 10 2 33 7 22 5 267 60 47 11 447 Fabre et al. (2006)
Aridisol >60% VGa 197 20 122 13 125 13 139 14 136 14 242 25 961 Fabre et al. (2006)
Alfisol forest 24 2 96 7 72 5 405 30 24 2 734 54 1355 Solomon et al. (2002)
Ultisol forest 12 1 131 9 96 7 478 34 36 3 657 47 1410 Solomon et al. (2002)
Oxisol cerrado 7 2 11 3 42 11 101 26 0 228 59 388 Lilienfein et al. (2000)
Oxisol d. pastureb 6 2 11 3 40 12 89 26 0 197 57 343 Lilienfein et al. (2000)
Ultisol forest 11 7 33 21 27 17 2 1 84 54 157 Abekoe and Sahrawat (2003)
Ultisol forest 17 24 29 78 2 81 231 Beck and Sanchez (1996)
Oxisol cerado 15 13 39 34 41 35 21 18 116 Neufeldt et al. (2000)
Oxisol savanna 7 3 11 5 27 13 45 21 121 57 211 Oberson et al. (2001)
Oxisol caatinga 7 5 5 4 13 11 22 18 2 1 76 61 124 Tiessen et al. (1992)
Toposequence
Entisol caatinga upperc 25 2 9 0 38 12 70 7 59 49 146 29 347 Agbenin and Tiessen (1994)
Inceptisols mixed forest midd 28 3 11 0 36 13 60 2 69 37 130 44 334 Agbenin and Tiessen (1994)
Inceptisols mixed forest lowere 26 5 13 0 38 13 83 4 80 18 147 59 387 Agbenin and Tiessen (1994)
Alfisol caatinga upperc 72 7 0 3 376 11 232 20 1560 17 937 42 3177 Araffljo et al. (2004)
Alfisol caatinga midd 80 8 2 3 302 11 53 18 850 21 1027 39 2314 Araffljo et al. (2004)
Alfisol caatinga lowere 77 7 6 3 191 10 51 21 260 21 854 38 1439 Araffljo et al. (2004)
Oxisols caatinga upperc 19 5 7 2 48 12 58 15 40 10 224 57 396 Araffljo et al. (2004)
Oxisols caatinga midd 21 8 6 2 37 14 60 23 32 12 109 41 265 Araffljo et al. (2004)
Oxisols caatinga lowere 18 6 6 2 45 15 78 25 32 10 128 42 307 Araffljo et al. (2004)
a VG: vegetation cover; b d. pasture: degraded pasture; c upper: upper slope; d mid: mid slope; e lower: lower slope.
316Negassa,Leinw
eberJ.P
lantNutr.S
oilSci.2009,172,305–325
highly enriched, whereas in highly weathered Oxisols, thelabile and moderately labile Pi fractions were significantly in-creased over those in the respective control treatments.Regardless of duration of incubation, and sources of appliedP, the absolute concentration and proportion of Po wereslightly affected in incubated tropical soils except under highP loading.
4.2.2 Pot experiments
Continuous cropping of maize (Zea mays L.) and soybean(Glycine max [L.] Merr) on different tropical soils loaded withhigh dose of fertilizer P highly depleted the labile and moder-ately labile Pi fractions (Guo et al., 2000). These authors alsostated that the Po and stable P fractions remained almostconstant at the end of 14 crop harvests except the labile Po ina Mollisol that was highly depleted. Similarly, growing alfalfa(Medicago sativa L.) for 66 d highly depleted the native labilePi in the rhizosphere of different soil orders without affectingthe Po fractions (Crews, 1996). This clearly showed that soilPo has minor contribution to plant nutrition under high dose offertilizer P but is a major source of plant-available P in low-input tropical agriculture (Adepetu and Corey, 1976; Tiessenet al., 1992; Nziguheba and B�nemann, 2005). Althoughsuch a high dose of fertilizer-P application practically doesnot exist elsewhere, supporting the P-fraction data by plant-biomass yields could help to understand the efficiency of resi-dual-P fertilizers for plant growth that usually advocated as astrategy for P capitalization in low-P subtropical and tropicalsoils.
4.2.3 Short-term field studies
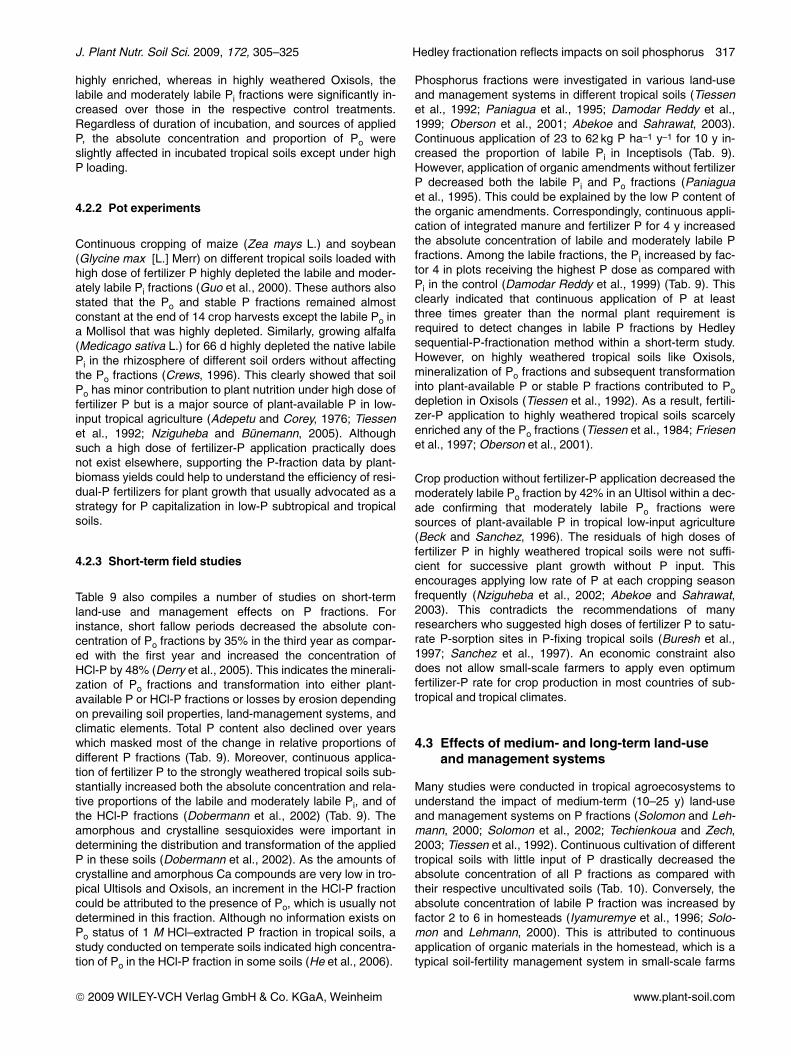
Table 9 also compiles a number of studies on short-termland-use and management effects on P fractions. Forinstance, short fallow periods decreased the absolute con-centration of Po fractions by 35% in the third year as compar-ed with the first year and increased the concentration ofHCl-P by 48% (Derry et al., 2005). This indicates the minerali-zation of Po fractions and transformation into either plant-available P or HCl-P fractions or losses by erosion dependingon prevailing soil properties, land-management systems, andclimatic elements. Total P content also declined over yearswhich masked most of the change in relative proportions ofdifferent P fractions (Tab. 9). Moreover, continuous applica-tion of fertilizer P to the strongly weathered tropical soils sub-stantially increased both the absolute concentration and rela-tive proportions of the labile and moderately labile Pi, and ofthe HCl-P fractions (Dobermann et al., 2002) (Tab. 9). Theamorphous and crystalline sesquioxides were important indetermining the distribution and transformation of the appliedP in these soils (Dobermann et al., 2002). As the amounts ofcrystalline and amorphous Ca compounds are very low in tro-pical Ultisols and Oxisols, an increment in the HCl-P fractioncould be attributed to the presence of Po, which is usually notdetermined in this fraction. Although no information exists onPo status of 1 M HCl–extracted P fraction in tropical soils, astudy conducted on temperate soils indicated high concentra-tion of Po in the HCl-P fraction in some soils (He et al., 2006).
Phosphorus fractions were investigated in various land-useand management systems in different tropical soils (Tiessenet al., 1992; Paniagua et al., 1995; Damodar Reddy et al.,1999; Oberson et al., 2001; Abekoe and Sahrawat, 2003).Continuous application of 23 to 62 kg P ha–1 y–1 for 10 y in-creased the proportion of labile Pi in Inceptisols (Tab. 9).However, application of organic amendments without fertilizerP decreased both the labile Pi and Po fractions (Paniaguaet al., 1995). This could be explained by the low P content ofthe organic amendments. Correspondingly, continuous appli-cation of integrated manure and fertilizer P for 4 y increasedthe absolute concentration of labile and moderately labile Pfractions. Among the labile fractions, the Pi increased by fac-tor 4 in plots receiving the highest P dose as compared withPi in the control (Damodar Reddy et al., 1999) (Tab. 9). Thisclearly indicated that continuous application of P at leastthree times greater than the normal plant requirement isrequired to detect changes in labile P fractions by Hedleysequential-P-fractionation method within a short-term study.However, on highly weathered tropical soils like Oxisols,mineralization of Po fractions and subsequent transformationinto plant-available P or stable P fractions contributed to Podepletion in Oxisols (Tiessen et al., 1992). As a result, fertili-zer-P application to highly weathered tropical soils scarcelyenriched any of the Po fractions (Tiessen et al., 1984; Friesenet al., 1997; Oberson et al., 2001).
Crop production without fertilizer-P application decreased themoderately labile Po fraction by 42% in an Ultisol within a dec-ade confirming that moderately labile Po fractions weresources of plant-available P in tropical low-input agriculture(Beck and Sanchez, 1996). The residuals of high doses offertilizer P in highly weathered tropical soils were not suffi-cient for successive plant growth without P input. Thisencourages applying low rate of P at each cropping seasonfrequently (Nziguheba et al., 2002; Abekoe and Sahrawat,2003). This contradicts the recommendations of manyresearchers who suggested high doses of fertilizer P to satu-rate P-sorption sites in P-fixing tropical soils (Buresh et al.,1997; Sanchez et al., 1997). An economic constraint alsodoes not allow small-scale farmers to apply even optimumfertilizer-P rate for crop production in most countries of sub-tropical and tropical climates.
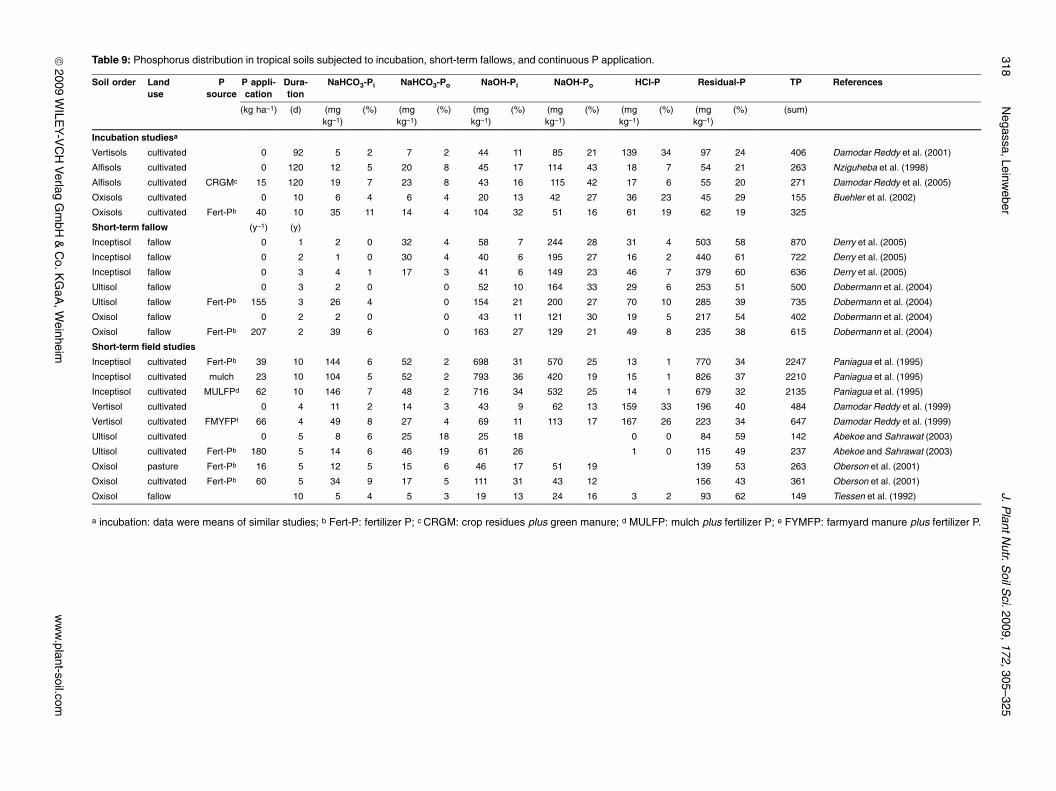
4.3 Effects of medium- and long-term land-useand management systems
Many studies were conducted in tropical agroecosystems tounderstand the impact of medium-term (10–25 y) land-useand management systems on P fractions (Solomon and Leh-mann, 2000; Solomon et al., 2002; Techienkoua and Zech,2003; Tiessen et al., 1992). Continuous cultivation of differenttropical soils with little input of P drastically decreased theabsolute concentration of all P fractions as compared withtheir respective uncultivated soils (Tab. 10). Conversely, theabsolute concentration of labile P fraction was increased byfactor 2 to 6 in homesteads (Iyamuremye et al., 1996; Solo-mon and Lehmann, 2000). This is attributed to continuousapplication of organic materials in the homestead, which is atypical soil-fertility management system in small-scale farms
ª 2009 WILEY-VCH Verlag GmbH & Co. KGaA, Weinheim www.plant-soil.com
J. Plant Nutr. Soil Sci. 2009, 172, 305–325 Hedley fractionation reflects impacts on soil phosphorus 317
ª2009
WILE
Y-VCHVerlag
GmbH
&Co.K
GaA
,Weinheim
www.plant-soil.com
Table 9: Phosphorus distribution in tropical soils subjected to incubation, short-term fallows, and continuous P application.
Soil order Landuse
Psource
P appli-cation
Dura-tion
NaHCO3-Pi NaHCO3-Po NaOH-Pi NaOH-Po HCl-P Residual-P TP References
(kg ha–1) (d) (mgkg–1)
(%) (mgkg–1)
(%) (mgkg–1)
(%) (mgkg–1)
(%) (mgkg–1)
(%) (mgkg–1)
(%) (sum)
Incubation studiesa
Vertisols cultivated 0 92 5 2 7 2 44 11 85 21 139 34 97 24 406 Damodar Reddy et al. (2001)
Alfisols cultivated 0 120 12 5 20 8 45 17 114 43 18 7 54 21 263 Nziguheba et al. (1998)
Alfisols cultivated CRGMc 15 120 19 7 23 8 43 16 115 42 17 6 55 20 271 Damodar Reddy et al. (2005)
Oxisols cultivated 0 10 6 4 6 4 20 13 42 27 36 23 45 29 155 Buehler et al. (2002)
Oxisols cultivated Fert-Pb 40 10 35 11 14 4 104 32 51 16 61 19 62 19 325
Short-term fallow (y–1) (y)
Inceptisol fallow 0 1 2 0 32 4 58 7 244 28 31 4 503 58 870 Derry et al. (2005)
Inceptisol fallow 0 2 1 0 30 4 40 6 195 27 16 2 440 61 722 Derry et al. (2005)
Inceptisol fallow 0 3 4 1 17 3 41 6 149 23 46 7 379 60 636 Derry et al. (2005)
Ultisol fallow 0 3 2 0 0 52 10 164 33 29 6 253 51 500 Dobermann et al. (2004)
Ultisol fallow Fert-Pb 155 3 26 4 0 154 21 200 27 70 10 285 39 735 Dobermann et al. (2004)
Oxisol fallow 0 2 2 0 0 43 11 121 30 19 5 217 54 402 Dobermann et al. (2004)
Oxisol fallow Fert-Pb 207 2 39 6 0 163 27 129 21 49 8 235 38 615 Dobermann et al. (2004)
Short-term field studies
Inceptisol cultivated Fert-Pb 39 10 144 6 52 2 698 31 570 25 13 1 770 34 2247 Paniagua et al. (1995)
Inceptisol cultivated mulch 23 10 104 5 52 2 793 36 420 19 15 1 826 37 2210 Paniagua et al. (1995)
Inceptisol cultivated MULFPd 62 10 146 7 48 2 716 34 532 25 14 1 679 32 2135 Paniagua et al. (1995)
Vertisol cultivated 0 4 11 2 14 3 43 9 62 13 159 33 196 40 484 Damodar Reddy et al. (1999)
Vertisol cultivated FMYFPf 66 4 49 8 27 4 69 11 113 17 167 26 223 34 647 Damodar Reddy et al. (1999)
Ultisol cultivated 0 5 8 6 25 18 25 18 0 0 84 59 142 Abekoe and Sahrawat (2003)
Ultisol cultivated Fert-Pb 180 5 14 6 46 19 61 26 1 0 115 49 237 Abekoe and Sahrawat (2003)
Oxisol pasture Fert-Pb 16 5 12 5 15 6 46 17 51 19 139 53 263 Oberson et al. (2001)
Oxisol cultivated Fert-Pb 60 5 34 9 17 5 111 31 43 12 156 43 361 Oberson et al. (2001)
Oxisol fallow 10 5 4 5 3 19 13 24 16 3 2 93 62 149 Tiessen et al. (1992)
a incubation: data were means of similar studies; b Fert-P: fertilizer P; c CRGM: crop residues plus green manure; d MULFP: mulch plus fertilizer P; e FYMFP: farmyard manure plus fertilizer P.
318Negassa,Leinw
eberJ.P
lantNutr.S
oilSci.2009,172,305–325
in the subtropics and tropics. Continuous application of P tohighly weathered tropical soils increased the concentration ofdifferent Pi fractions with prominent effects on the moderatelylabile Pi fractions. This showed that the moderately labile Pifractions were both sources and sinks of plant-available P intropical soils (Cross and Schlesinger, 1995; Lilienfein et al.,2000; Techienkoua and Zech, 2003).
Similar to the findings for soils in temperate climates, continu-ous cultivation without P application considerably depletedthe labile and moderately labile P fractions in tropical soils(Solomon et al., 2002; Nwoke et al., 2003). However, thedepletion in subtropical and tropical soils was faster than intemperate soils mainly because of variations in basic soilproperties that emanated from soil-weathering stages, cli-matic elements, and management systems. High tempera-tures in the humid tropics accelerate the development of Ulti-sols and Oxisols with low soil pH and enrichments in variablycharged pedogenic oxides. Under such circumstances, thetransformations of labile and moderately labile Pi fractionsfrom native P and fertilizer-P application into stable P werefast.
A few studies investigated the impact of long-term (>25 y)land-use and management systems in subtropical and tropi-cal soils, and the data confirmed that P fractions weredepleted significantly without P input (Solomon et al., 2002).The application of organic materials did not stop the reductionof Po and residual-P fractions (Agbenin and Goladi, 1998).According to this study, however, application of either fertili-zer P or farmyard manure or a combination of them signifi-cantly increased labile to moderately labile Pi fractions.
In summary, agricultural practices with low P input to differenttropical soils depleted labile and moderately labile P fractions.However, the intensity of depletion depended on basic soilproperties such as soil texture, soil pH, SOM, native concen-tration of total P, and amount of applied P (Duffera andRobarge, 1996, 1999). Activities of soil organisms, types ofplants grown, and management systems could also affect theinternal transformation and cycle of both native and appliedP. As a result, the Hedley sequential P fractionation couldclearly sort out the fate of applied P in tropical soils if thedose of applied P was higher or the duration of managementwith low P input relatively longer.
5 Synthesis: Effect of P application and timeon labile and moderately labile P fractions
Results of studies selected according to variation in time andrate of P application were subjected to multiple-regressionanalyses to test the contribution of these factors on the varia-bility in concentrations of P fractions. Table 11 shows the var-iation in P application and duration of the studies on labileand moderately labile P fractions in soils of temperate, andsubtropical and tropical climate. The variations due to appli-cation of P and duration of studies were 46% in labile and18% in moderately labile P in soils of temperate climate. Thenegative coefficient for time in the data set of moderatelylabile P indicated that P from this fraction can be either trans-
ª 2009 WILEY-VCH Verlag GmbH & Co. KGaA, Weinheim www.plant-soil.com
Table
10:E
ffectsof
med
ium-an
dlong
-termsland
-use
andman
agem
ents
ystemson
Pfrac
tions
insu
btropica
land
trop
ical
soils.
Soilorder
Lan
duse
Pso
urce
Pap
plic
ation
Duration
NaH
CO
3-Pi
NaH
CO
3-Po
NaO
H-P
iNaO
H-P
oHCl-P
Res
idual-P
TP
Referen
ces
(kgha
–1)
(d)
(mgkg
–1)
(%)
(mgkg
–1)
(%)
(mgkg
–1)
(%)
(mgkg
–1)
(%)
(mgkg
–1)
(%)
(mgkg
–1)
(%)
(sum
)
Med
ium-term
studies
Alfiso
lscu
ltiva
ted
015
184
164
7717
5613
8820
189
4344
4Solom
onan
dLe
hman
n(200
0)
Alfiso
lho
mes
tead
man
ures
0>10
121
1370
713
814
9310
207
2232
734
956
Solom
onan
dLe
hman
n(200
0)
Alfiso
lcu
ltiva
ted
025
51
364
485
227
2410
160
965
935
Solom
onet
al.(20
02)
Ultiso
lE.plan
ta0
1559
52
043
735
137
1119
716
399
3212
31Te
chienk
ouaan
dZec
h(200
3
Ultiso
lcu
ltiva
ted
fertilize
rP
67>15
677
222
279
2720
120
198
1925
825
1025
Tech
ienk
ouaan
dZec
h(200
3
Ultiso
lT.
Plant
bfertilize
rP
150
1579
513
160
135
235
1424
915
521
3116
98Te
chienk
ouaan
dZec
h(200
3
Ultiso
lcu
ltiva
ted
013
83
136
3314
4620
21
132
5623
4Bec
kan
dSan
chez
(199
6)
Ultiso
lcu
ltiva
ted
fertilize
rP
8013
5713
4410
126
2976
1729
710
424
436
Bec
kan
dSan
chez
(199
6)
Oxiso
lcu
ltiva
ted
fertilize
rP
7011
132
2396
1715
827
191
3357
7Neu
feldte
tal.(200
0)
Oxiso
lRefores
ted
1333
2350
3539
2819
1314
1Neu
feldte
tal.(200
0)
Oxiso
lRefores
ted
fertilize
rP
3420
6916
102
2489
2115
938
419
Neu
feldte
tal.(200
0)
Oxiso
lcu
ltiva
ted
fertilize
rP
129
64
324
1620
134
393
6015
4Ties
senet
al.(19
92)
Long-term
studies
Alfiso
lT.
plan
tfertilize
rP
1035
121
485
485
227
2310
163
365
978
Solom
onet
al.(20
02)
Alfiso
lcu
ltiva
ted
045
170
1747
513
013
146
1511
011
397
4010
00Agb
enin
andGolad
i(19
98)
Alfiso
lcu
ltiva
ted
fertilize
rP
3645
697
2310
13
320
1035
712
338
1112
7941
3092
Agb
enin
andGolad
i(19
98)
Alfiso
lcu
ltiva
ted
mixture
5445
527
2811
06
393
2127
014
313
1727
014
1883
Agb
enin
andGolad
i(19
98)
aE.plan
t:eu
calyptus
plan
tatio
n;bT.
plan
t:teaplan
tatio
n.
J. Plant Nutr. Soil Sci. 2009, 172, 305–325 Hedley fractionation reflects impacts on soil phosphorus 319
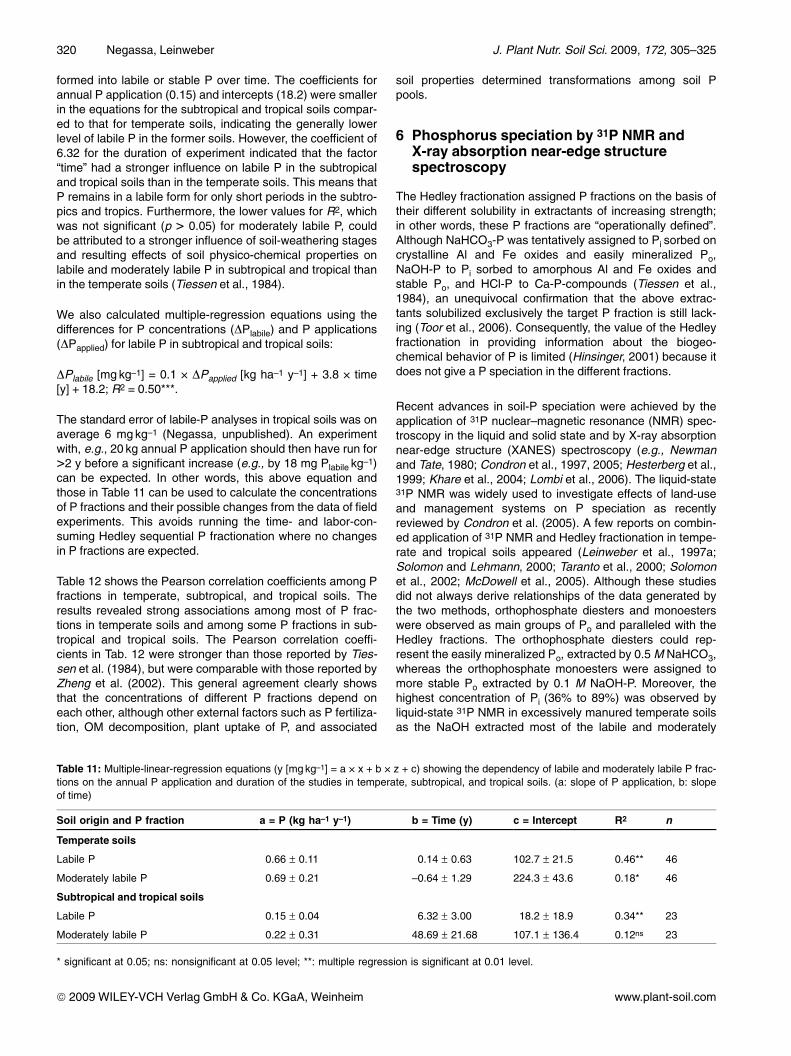
formed into labile or stable P over time. The coefficients forannual P application (0.15) and intercepts (18.2) were smallerin the equations for the subtropical and tropical soils compar-ed to that for temperate soils, indicating the generally lowerlevel of labile P in the former soils. However, the coefficient of6.32 for the duration of experiment indicated that the factor“time” had a stronger influence on labile P in the subtropicaland tropical soils than in the temperate soils. This means thatP remains in a labile form for only short periods in the subtro-pics and tropics. Furthermore, the lower values for R2, whichwas not significant (p > 0.05) for moderately labile P, couldbe attributed to a stronger influence of soil-weathering stagesand resulting effects of soil physico-chemical properties onlabile and moderately labile P in subtropical and tropical thanin the temperate soils (Tiessen et al., 1984).
We also calculated multiple-regression equations using thedifferences for P concentrations (DPlabile) and P applications(DPapplied) for labile P in subtropical and tropical soils:
DPlabile [mg kg–1] = 0.1 � DPapplied [kg ha–1 y–1] + 3.8 � time[y] + 18.2; R2 = 0.50***.
The standard error of labile-P analyses in tropical soils was onaverage 6 mgkg–1 (Negassa, unpublished). An experimentwith, e.g., 20 kg annual P application should then have run for>2 y before a significant increase (e.g., by 18 mg Plabile kg–1)can be expected. In other words, this above equation andthose in Table 11 can be used to calculate the concentrationsof P fractions and their possible changes from the data of fieldexperiments. This avoids running the time- and labor-con-suming Hedley sequential P fractionation where no changesin P fractions are expected.
Table 12 shows the Pearson correlation coefficients among Pfractions in temperate, subtropical, and tropical soils. Theresults revealed strong associations among most of P frac-tions in temperate soils and among some P fractions in sub-tropical and tropical soils. The Pearson correlation coeffi-cients in Tab. 12 were stronger than those reported by Ties-sen et al. (1984), but were comparable with those reported byZheng et al. (2002). This general agreement clearly showsthat the concentrations of different P fractions depend oneach other, although other external factors such as P fertiliza-tion, OM decomposition, plant uptake of P, and associated
soil properties determined transformations among soil Ppools.
6 Phosphorus speciation by 31P NMR andX-ray absorption near-edge structurespectroscopy
The Hedley fractionation assigned P fractions on the basis oftheir different solubility in extractants of increasing strength;in other words, these P fractions are “operationally defined”.Although NaHCO3-P was tentatively assigned to Pi sorbed oncrystalline Al and Fe oxides and easily mineralized Po,NaOH-P to Pi sorbed to amorphous Al and Fe oxides andstable Po, and HCl-P to Ca-P-compounds (Tiessen et al.,1984), an unequivocal confirmation that the above extrac-tants solubilized exclusively the target P fraction is still lack-ing (Toor et al., 2006). Consequently, the value of the Hedleyfractionation in providing information about the biogeo-chemical behavior of P is limited (Hinsinger, 2001) because itdoes not give a P speciation in the different fractions.
Recent advances in soil-P speciation were achieved by theapplication of 31P nuclear–magnetic resonance (NMR) spec-troscopy in the liquid and solid state and by X-ray absorptionnear-edge structure (XANES) spectroscopy (e.g., Newmanand Tate, 1980; Condron et al., 1997, 2005; Hesterberg et al.,1999; Khare et al., 2004; Lombi et al., 2006). The liquid-state31P NMR was widely used to investigate effects of land-useand management systems on P speciation as recentlyreviewed by Condron et al. (2005). A few reports on combin-ed application of 31P NMR and Hedley fractionation in tempe-rate and tropical soils appeared (Leinweber et al., 1997a;Solomon and Lehmann, 2000; Taranto et al., 2000; Solomonet al., 2002; McDowell et al., 2005). Although these studiesdid not always derive relationships of the data generated bythe two methods, orthophosphate diesters and monoesterswere observed as main groups of Po and paralleled with theHedley fractions. The orthophosphate diesters could rep-resent the easily mineralized Po, extracted by 0.5M NaHCO3,whereas the orthophosphate monoesters were assigned tomore stable Po extracted by 0.1 M NaOH-P. Moreover, thehighest concentration of Pi (36% to 89%) was observed byliquid-state 31P NMR in excessively manured temperate soilsas the NaOH extracted most of the labile and moderately
ª 2009 WILEY-VCH Verlag GmbH & Co. KGaA, Weinheim www.plant-soil.com
Table 11: Multiple-linear-regression equations (y [mg kg–1] = a � x + b � z + c) showing the dependency of labile and moderately labile P frac-tions on the annual P application and duration of the studies in temperate, subtropical, and tropical soils. (a: slope of P application, b: slopeof time)
Soil origin and P fraction a = P (kg ha–1 y–1) b = Time (y) c = Intercept R2 n
Temperate soils
Labile P 0.66 – 0.11 0.14 – 0.63 102.7 – 21.5 0.46** 46
Moderately labile P 0.69 – 0.21 –0.64 – 1.29 224.3 – 43.6 0.18* 46
Subtropical and tropical soils
Labile P 0.15 – 0.04 6.32 – 3.00 18.2 – 18.9 0.34** 23
Moderately labile P 0.22 – 0.31 48.69 – 21.68 107.1 – 136.4 0.12ns 23
* significant at 0.05; ns: nonsignificant at 0.05 level; **: multiple regression is significant at 0.01 level.
320 Negassa, Leinweber J. Plant Nutr. Soil Sci. 2009, 172, 305–325
labile Pi (Leinweber et al., 1997a). Similarly, 50% to 70% of Piwas observed in various land-use systems of tropical soilswith liquid-state 31P NMR (Solomon and Lehmann, 2000).However, the efficiency of 31P NMR in determining native Piwas small, but 20% to 50% of Po extracted by the Hedleysequential P fraction could be assigned by 31P NMR (Tarantoet al., 2000). This clearly shows that land-use and manage-ment systems governed the P species, and that these effectscould be determined in good agreement with the Hedley Pfractions and with liquid-state 31P NMR.
The application of solid-state 31P NMR spectroscopy to soilsis limited to a minimum concentration of 1 mg P g–1 requiredfor signal detection (Condron et al., 1997; Toor et al., 2006).Moreover, high concentrations of paramagnetics also nega-tively affected the spectra quality by decreasing signal-to-noise ratio and by increasing intensity of spinning side bands(Cade-Menun et al., 2002; Condron et al., 2005). Further-more, the association of different cations with P ions andocclusion of P species within the structure of organic phasesmade spectral resolution poor (Frossard et al., 1994; Shandet al., 1999). This may be one reason why solid-state 31PNMR was not used in combination with the Hedley P fraction.
Synchrotron-based P K-edge XANES is a new analyticaltechnique that advanced the knowledge of P species inminerals and soils (Hesterberg et al., 1999; Beaucheminet al., 2003; Sato et al., 2005) and organic wastes (Shoberet al., 2006; Toor et al., 2006). Moreover, the P K-edgeXANES was used to study P speciation and distribution incalcareous soils (Lombi et al., 2006) and to investigateadsorbed phosphate distribution in ferrihydrite and boehmite(Khare et al., 2004). However, as far as we know, only twostudies supported the Hedley sequential P fractions with P K-
edge XANES data (Beauchemin et al., 2003; Kruse and Lein-weber, 2008). According to these authors, the K-edgeXANES directly identified some forms of Pi in the soil, where-as the Hedley sequential P fractionation provided indirectsupporting data. However, the K-edge XANES in its presentresolution failed to identify Po compounds because the spec-tral features of Po were scarcely different from Pi regardlessof slight differences in the intensity of the white-line peak andshape of the oxygen oscillation (Beauchemin et al., 2003;Toor et al., 2006).
In a recent study on different types of manure, Ajiboye et al.(2007) clearly showed the advantages of the combination ofsequential P fractionation, solution 31P NMR, and P K-edgeXANES in P speciation. They emphasized that the combina-tion of any two of these techniques could not provide enoughinformation about P chemistry, but all three can. In summary,the specific advantages and disadvantages of both the clas-sic Hedley sequential P fractionation and the advanced P-speciation techniques strongly call for a combined applicationto increase our understanding of P chemistry in soils andrelated materials.
7 Conclusions
(1) The Hedley sequential P fractionation was suited to detectchanges in concentrations of different P fractions, dependingon the amount of P applied or severity of P depletion, and theduration of land-use and management impacts on P turnoverin soils. Therefore, this fractionation is a useful approach toinvestigate the fate of native and applied P in agroecosys-tems to adopt appropriate use and management concepts.
ª 2009 WILEY-VCH Verlag GmbH & Co. KGaA, Weinheim www.plant-soil.com
Table 12: Pearson correlation coefficients among concentrations of P fractions in temperate, subtropical, and tropical soils.
P fraction Resin-P NaHCO3-Pi NaHCO3-Po NaOH-Pi NaOH-Po HCl-P
(mg kg–1)
Temperate soils (n = 55)
Resin-P
NaHCO3-Pi 0.74**
NaHCO3-Po 0.57** 0.65**
NaOH-Pi 0.51** 0.70** 0.26 ns
NaOH-Po 0.69** 0.83** 0.79** 0.55*
HCl-P 0.54** 0.24 ns 0.23 ns 0.37** 0.32*
Residual-P 0.45** 0.50** 0.43** 0.00 0.47** 0.00
Subtropical and tropical soils (n = 28 to 32)
NaHCO3-Pi
NaHCO3-Po 0.85**
NaOH-Pi 0.41* 0.38*
NaOH-Po 0.45* 0.57** 0.81**
HCl-P 0.69** 0.46* 0.25 ns 0.07 ns
Residual-P 0.58** 0.62** 0.81** 0.81 0.16 ns
* significant at 0.05; ns: nonsignificant level; **: correlation is significant at 0.01 level.
J. Plant Nutr. Soil Sci. 2009, 172, 305–325 Hedley fractionation reflects impacts on soil phosphorus 321
(2) In natural ecosystems, the concentration of total P wassimilar in temperate, subtropical, and tropical soils regardlessof soil orders. However, subjecting the soils to different land-use and management systems radically shifted the concen-trations and distribution of P fractions. Loading soils with Pgreatly increased the labile Pi fraction in temperate climatesand the moderately labile Pi fraction in the subtropics and tro-pics. Therefore, excess labile Pi may be subject to runoff andleaching losses in temperate soils. The role of enriched mod-erately labile Pi in subtropical and tropical soils, either assource for plant nutrition or as potential contaminant of fresh-water, is less clear. Irrespectively of climatic zone, manage-ment could scarcely enrich Po in the short term, but the Pofractions were strongly depleted in tropical soils under low Pinput. Therefore, management of tropical soils should bedirected to maintain a Po level sufficient for the nutrition ofarable crops.
(3) The review of P in soil orders by Cross and Schlesinger(1995) and the present review strongly suggest that the Hed-ley fractions may have different meanings in both chemicalspecies and pedoecological functions in temperate comparedwith those in subtropical and tropical soils. Therefore, metho-dological approaches to improve the interpretation basis ofthe Hedley fractionation and derived consequences for soilmanagement must consider the soil mineralogical and phy-sico-chemical properties. Furthermore, relationships shouldbe established between labile and moderately labile P frac-tions and crop yields in different climates.
(4) The complementary application of advanced analyticaltechniques such as 31P NMR and synchrotron-basedP XANES will reveal more detailed insights into the chemicalspecies behind the sequential Hedley fractions and nonex-tractable residues. Success in the broad application of thesecomplementary analytical approaches will depend onimprovements in spectral resolution and P-detection limits,developments of new techniques and databases of referencecompounds, e.g., for XANES at the P L-edge (Kruse et al.,2009), and last but not least from broad access of researchersto the relevant techniques and facilities.
Acknowledgments
This research was supported by the German AcademicExchange Service (DAAD) project A/05/33320 who provideda fellowship for the first author. We thank Elena Heilmann,Institute for Land Use, University of Rostock, for assisting usin literature searches. The two anonymous reviewers arehighly acknowledged for their constructive comments andsuggestions that improved the quality of the manuscript.
References
Abekoe, M. K., Sahrawat, K. L. (2003): Long-term cropping effect onphosphorus fractions in an Ultisol of the humid forest zone in WestAfrica. Commun. Soil Sci. Plant Anal. 34, 427–437.
Abekoe, M. K., Tiessen, H. (1998): Fertilizers P transformation and Pavailability in hill slope soils of northern Ghana. Nutr. Cycl. Agro-ecosyst. 52, 45–54.
Addiscott, T. M., Brockie, D. Catt, J. A., Christian, D. G., Harris, G. L.,Howse, K. R., Mirza, N. A., Pepper, T. J. (2000): Phosphate lossesthrough field drains in a Heavy cultivated soil. J. Environ. Qual. 29,522–532.
Adepetu, J. A., Corey, R. B. (1976): Organic phosphorus as apredictor of plant available phosphorus in soils of southern Nigeria.Soil Sci. 122, 159–164.
Agbenin, J. O., Goladi, J. T. (1998): Dynamics of phosphorus frac-tions in a savanna Alfisol under continuous cultivation. Soil UseManage. 14, 59–64.
Agbenin, J. O., Igbokwe, S. O. (2006): Effects of soil-dung manureincubation on the solubility and retention of applied phosphate by aweathered tropical semi-arid soil. Geoderma 133, 191–203.
Agbenin, J. O., Tiessen, H. (1994): Phosphorus transformations in atoposequence of Lathosols and Cambisols from semi-arid north-eastern Brazil. Geoderma 62, 345–362.
Ajiboye, B., Akinremi, O. O., Hu, Y., Flaten, D. N. (2007): Phosphorusspeciation of sequential extracts of organic amendments usingnuclear magnetic resonance and x-ray absorption near edgestructure spectroscopies. J. Environ. Qual. 36, 1563–576.
Ajmone-Marsan, F., C�t�, D., Simard, R. R. (2006): Phosphorustransformations under reduction in long-term manured soils. PlantSoil 282, 239–250.
Araffljo, M. S. B., Schaefer, C. E. R., Sampaio, E. V. S. B. (2004): Soilphosphorus fractions from toposequences of semi-arid Latosolsand Luvisols in northeasten Brazil. Geoderma 119, 309–321.
Beauchemin, S., Hesterberg, D., Chou, J., Beauchemin, M., Simard,R. R., Sayers, D. E. (2003): Speciation of phosphorus in phos-phorus-enriched agricultural soils using X-ray absorptionnear-edge structure spectroscopy and chemical fractionation.J. Environ. Qual. 32, 1809–1819.
Beck, M. A., Sanchez, P. A. (1996): Soil phosphorus movement andbudget after 13 years of fertilized cultivation in the Amazon basin.Plant Soil 184, 23–31.
Brady, N. C., Weil, R. R. (2008): Nature and Properties of Soils. 14thedn., Prentice Hall, Upper Saddle River, NJ, USA, p. 992.
Buehler, S., Oberson, A., Rao, I. M., Friesen, D. K., Frossard, E.(2002): Sequential phosphorus extraction of a 33P labeled Oxisolunder contrasting agricultural systems. Soil Sci. Soc. Am. J. 66,868–877.
Buresh, R. J., Smithson, P. C., Hellums, D. T. (1997): Building soilphosphorus capital in Africa, in Buresh, R. J., Sanchez, P. A.,Calhoun, F. (eds.): Replenishing Soil Fertility in Africa. Soil ScienceSociety of America Special Publication No. 51, Madison, WI, USA,pp. 111–149.
Cade-Menun, B. J., Liu, C. W., Nunlist, R., McColl, J. G. (2002): Soiland litter phosphorus-31 nuclear magnetic resonance spectro-scopy: extractants, metals, and phosphorus relaxation times.J. Environ. Qual. 31, 457–465.
Campbell, C., Schnitzer, M., Stewart, J. W. B., Biederbeck, V. O.,Selles, F. (1986): Effects of manure and P fertilizers on propertiesof a black chernozem in southern Saskatchewan. Can. J. Soil Sci.66, 601–613.
Cassagne, N., Remaury, M., Gauquelin, T., Fabre, A. (2000): Formsand profile distribution of soil phosphorus in alpine Inceptisols andSpodosols (Pyrenees, France). Geoderma 95, 161–172.
Chen, C. R., Condron, L. M., Davis, M. R., Sherlock, R. R. (2000):Effects of afforestation on phosphorus dynamics and biologicalproperties in a New Zealand grassland soil. Plant Soil 220,150–163.
Condron, L. M., Goh, K. M. (1989): Effects of long-term phosphaticfertilizers applications on amounts and forms of phosphorus in
ª 2009 WILEY-VCH Verlag GmbH & Co. KGaA, Weinheim www.plant-soil.com
322 Negassa, Leinweber J. Plant Nutr. Soil Sci. 2009, 172, 305–325
soils under irrigated pasture in New Zealand. J. Soil Sci. 40,383–395.
Condron, L. M., Davis, M. R., Newman, R. H., Cornforth, I. S. (1996):Influence of conifers on the forms of phosphorus in selected NewZealand grassland soils. Biol. Fertil. Soils 21, 37–42.
Condron, L. M., Frossard, E., Newman, R. H., Tekely, P., Morel, J. L.(1997): Use of 31P NMR in the study of soils and the environment,in Nanny, M. A., Minear, R. A., Leenheer, J. A. (eds.): Nuclearmagnetic resonance spectroscopy in environmental chemistry.Oxford University Press, New York, pp. 247–271.
Condron, L. M., Turner, B. L., Cade-Menun, B. J. (2005): Chemistryand dynamics of soil organic phosphorus, in Sims, J. T., Sharpley,A. S. (eds.): Phosphorus: Agriculture and the Environment.Agronomy Monograph 46. ASA, CSSA, SSSA, Madison, WI, pp.87–121.
Crews, T. E. (1996): The supply of phosphorus from native, inorganicphosphorus pools in continuously cultivated Mexican agroeco-systems. Agric. Ecosyst. Environ. 57, 197–208.
Cross, A. F., Schlesinger, W. H. (1995): A literature review andevaluation of the Hedley fractionation: Applications to the biogeo-chemical cycle of soil phosphorus in natural ecosystems.Geoderma 64, 197–214.
Cross, A. F., Schlesinger, W. H. (2001): Biological and geochemicalcontrols on phosphorus fractions in semiarid soils. Biogeochem.52, 155–172.
Damodar Reddy, D., Rao, A. S., Takkar, P. N. (1999): Effects ofrepeated manure and fertilizers phosphorus additions on soil phos-phorus dynamics under a soybean-wheat rotation. Biol. Fertil.Soils 28, 150–155.
Damodar Reddy, D., Rao, A. S., Singh, M. (2001): Crop residueaddition effects on myriad forms and sorption of phosphorus in aVertisol. Biores. Technol. 80, 93–99.
Damodar Reddy, D., Rao, A. S., Singh, M. (2005): Changes in P frac-tions and sorption in an Alfisol following crop residues. J. PlantNutr. Soil Sci. 168, 241–247.
Daroub, S. H., Pierce, F. J., Ellis, B. G. (2000): Phosphorus fractionsand fate of phosphorus-33 in soils under plowing and no-tillage.Soil Sci. Soc. Am. J. 64, 170–176.
Derry, D. D., Voroney, R. P., Brice�o, J. A. (2005): Long-term effectsof short-fallow frijol tapado on soil phosphorus pools in Costa Rica.Agric. Ecosyst. Environ. 110, 91–103.
Dobermann, A., George, T., Thevs, N. (2002): Phosphorus fertilizerseffects on soil phosphorus pools in acid upland soils. Soil Sci. Soc.Am. J. 66, 652–660.
Duferra, M., Robarge, W. P. (1996): Characterization of organic andinorganic phosphorus in the highland plateau soils of Ethiopia.Commun. Soil Sci. Plant Anal. 27, 2799–2814.
Duferra, M., Robarge, W. P. (1999): Soil characteristics andmanagement effects on phosphorus sorption by highland plateausoils of Ethiopia. Soil Sci. Soc. Am. J. 63, 1455–1462.
Fabre, A., Gauquelin, T., Vilasante, F., Ortega, A., Puig, H. (2006):Phosphorus content in five representative landscape units of theLomas de Arequipa (Atacama Desert-Peru). Catena 65, 80–86.
Friesen, D. K., Rao, I. M., Thomas, R. J., Oberson, A., Sanz, J. I.(1997): Phosphorus acquisition and cycling in crop and pasturesystems in low fertility tropical soils. Plant Soil 196, 289–294.
Frossard, E., Stewart, J. W. B., Arnaud, R. J. S. T. (1989): Distri-bution and mobility of phosphorus in grassland and forest soils ofSaskatchewan. Can. J. Soil Sci. 69, 401–416.
Frossard, E., Tekely, P., Grimal, J. Y. (1994): Characterization ofphosphate species in urban sewage sludges by high-resolutionsolid-state 31P NMR. Eur. J. Soil Sci. 45, 403–408.
Guggenberger, G., Christensen, B. T., Rubæk, G., Zech, W. (1996):Land-use and fertilization effects on P forms in two European soils:resign extraction and 31P-NMR analysis. Eur. J. Soil Sci. 47,605–614.
Guo, F., Yost, R. S., Hue, N. V., Evensen, C. I., Silva, J. A. (2000):Changes in phosphorus fractions in soils under intensive plantgrowth. Soil Sci. Soc. Am. J. 64, 1681–1689.
He, Z., Fortuna, A., Senwo, Z. N., Tazisong, I. A., Honeycutt, C. W.,Griffin, T. S. (2006): Hydrochloric fractions in Hedley fractionationmay contain inorganic and organic phosphate. Soil Sci. Soc. Am. J.70, 893–899.
Hedley, M., McLaughlin, M. (2005): Reactions of phosphate fertilizersand by-products in soils, in Sims, J. T., Sharpley, A. S. (eds.):Phosphorus: Agriculture and the Environment. Agronomy Mono-graph 46, ASA, CSSA, SSSA, Madison, WI, pp. 181–252.
Hedley, M. J., Stewart, J. W. B., Chauhan, B. S. (1982): Changes inorganic and organic soil phosphorus fractions induced by culti-vation practices and laboratory incubations. Soil Sci. Soc. Am. J.46, 970–976.
Heilmann, E., Leinweber, P., Ollesch, G., Meißner, R., (2005): Spatialvariability of sequentially extracted P fractions in a silty loam.J. Plant Nutr. Soil Sci. 168, 307–315.
Hesterberg, D., Zhou, W., Hutchison, K. J., Beauchemin, S., Sayers,D. E. (1999): XAFS study of adsorbed and mineral forms of phos-phate. J. Synchrotron Rad. 6, 636–638.
Hinsinger, P. (2001): Bioavailability of soil inorganic P in the rhizo-sphere as affected by root-induced chemical change: a review.Plant Soil 237, 173–195.
Hylander, L. D., Sim�n, G. (2006): Phosphorus fractionation in soilsand wastewater sorbent materials as an indicator of materialspecific and storage-dependant availability. Commun. Soil Sci.Plant Anal. 37, 1013–1030.
Iyamuremye, F., Dick, R. P., Baham, J. (1996): Organic amendmentsand phosphorus dynamics: II. Distribution of soil phosphorus frac-tions. Soil Sci. 161, 436–443.
Jakobsen, I., Leggett, M. E., Richardson, A. E. (2005): Rhizospheremicroorganisms and plant phosphorus uptake, in Sims, J. T.,Sharpley, A. S. (eds.): Phosphorus: Agriculture and the Envir-onment. Agronomy Monograph 46, ASA, CSSA, SSSA, Madison,WI, USA, pp. 437–494
Jones, D. L. (1998): Organic acids in the rhizosphere-a critical review.Plant Soil 205, 25–44.
Kashem, A., Akinremi, O. O., Racz, G. J. (2004): Phosphorus frac-tions in soil amended with organic and inorganic phosphorussources. Can. J. Soil Sci. 84, 83–90.
Khare, N., Hesterberg, D., Beauchemin, S., Wang, S. (2004):XANES determination of adsorbed phosphate distribution betweenferrihydrite and boehmite in mixtures. Soil Sci. Soc. Am. J. 68,460–469.
Kleinman, P. J. A., Wolf, A., Sharpley, A., Beegle, D. B., Saporito,L. S. (2005): Survey of water-extractable phosphorus in livestockmanures. Soil Sci. Soc. Am. J. 69, 701–708.
Kolawole, G. O., Tijani-Eniola, H., Tian, G. (2004): Phosphorus frac-tions in fallow systems of West African: Effect of residuesmanagement. Plant Soil 263, 113–120.
Kovar, J. L., Claassen, N. (2005): Soil-root interactions and phos-phorus nutrition of plants, in Sims, J. T., Sharpley, A. S. (eds.):Phosphorus: Agriculture and the Environment. Agronomy Mono-graph 46, ASA, CSSA, SSSA, Madison, WI, USA, pp. 379–414.
Kruse, J., Leinweber, P. (2008): Phosphorus in sequentially extractedfen peat soils: a K-edge X-ray absorption near edge structure
ª 2009 WILEY-VCH Verlag GmbH & Co. KGaA, Weinheim www.plant-soil.com
J. Plant Nutr. Soil Sci. 2009, 172, 305–325 Hedley fractionation reflects impacts on soil phosphorus 323
(XANES) spectroscopy study. J. Plant Nutr. Soil Sci. 171,613–620.
Kruse, J., Leinweber, P., Eckhardt, K.-U., Godlinski, F., Hu, Y., Zuin, L.(2009): Phosphorus L2,3-edge XANES: Overview of referencecompounds. J. Synchrotron Rad. 16, 1–13.
Leinweber, P. (1996): Phosphorus fractions in soils from an area withhigh density of livestock population. Z. Pflanzenernhr. Bodenkd.159, 251–256.
Leinweber, P., Haumaier, L., Zech, W. (1997a): Sequential extrac-tions and 31P-NMR spectroscopy of phosphorus froms in animalmanures: whole soils and particle-size separates from denselypopulated livestock area in northwest Germany. Biol. Fertil. Soils25, 89–94.
Leinweber, P., L�nsmann, F., Eckhardt, K.-U. (1997b): Phosphorussorption capacities and saturation of soils in two regions withdifferent livestock densities in northwest Germany. Soil UseManage. 13, 82–89.
Leinweber, P., Meissner, R., Eckhardt, K.-U., Seeger, J. (1999):Management effects on forms of phosphorus of in soil and leachinglosses. Eur. J. Soil Sci. 50, 413–424.
Levy, E., Schlesinger, W. (1999): A comparison of fractionation meth-ods for forms of phosphorus in soils. Biogeochem. 47, 25–38.
Lilienfein, J., Wilcke, W., Ayarza, M. A., Vilela, L., Lima, S. D. C.,Zech, W. (2000): Chemical fractionation of phosphorus, sulphur,and molybdenum in Brazilian savannah Oxisols under differentland use. Geoderma 96, 31–46.
Lombi, E., Scheckel, K. G., Armstrong, R. D., Forrester, S., Cutler,J. N., Paterson, D. (2006): Speciation and Distribution of Phos-phorus in a Fertilized Soil: A Synchrotron-Based Investigation. SoilSci. Soc. Am. J. 70, 2038–2048.
Magid, J. (1993): Vegetation effects on phosphorus fractions in set-aside soils. Plant Soil 149, 111–119.
McDowell, R. W., Stewart, I. (2006): The phosphorus composition ofcontrasting soils in pastoral, native and forest management inOtago, New Zealand: Sequential extraction and 31P NMR.Geoderma 130, 176–189.
McDowell, R. W., Condron, L. M., Stewart, I., Cave, V. (2005): Chem-ical nature and diversity of phosphorus in New Zealand pasturesoils using 31P nuclear magnetic resonance spectroscopy andsequential fractionation. Nutr. Cycl. Agroecosyst. 72, 241–254.
McKenzie, R. H., Stewart, J. W. B., Dormaar, J. F., Schaalje, G. B.(1992): Long-term crop rotation and fertilizers effects on phos-phorus transformation: I. In a Chernozemic soil. Can. J. Soil Sci.72, 569–579.
Motavalli, P. P., Miles, R. J. (2002): Soil phosphorus fractions after111 years of animal manure and fertilizers applications. Biol. Fertil.Soils 36, 35–42.
Mullins, G., Joern, B., Moore, P. (2005): By-product phosphorus:sources, characteristics, and management, in Sims, J. T.,Sharpley, A. S. (eds.): Phosphorus: Agriculture and the Envir-onment. Agronomy Monograph 46, ASA, CSSA, SSSA, Madison,WI, USA, pp. 829–880.
Neufeldt, H., da Sila, J. E., Ayarza, M. A., Zech, W. (2000): Land-useeffects on phosphorus fractions in Cerrado Oxisols. Biol. Fertil.Soils 31, 30–37.
Newman, R. H., Tate, K. R. (1980): Soil characterized by 31P nuclearmagnetic resonance. Commun. Soil Sci. Plant Anal. 11, 835–842.
Nwoke, O. C., Vanlauwe, B., Diels, J., Sanginga, N., Osonubi, O.,Merckx, R. (2003): Assessment of labile phosphorus fractions andadsorption characteristics in relation to soil properties of WestAfrican savanna soils. Agric. Ecosyst. Environ. 100, 285–294.
Nziguheba, G., B�nemann, E. (2005): Organic phosphorus dynamicsin tropical agroecosystems, in Turner, B.L., Frossard, E., Baldwin,D. S. (eds.): Organic phosphorus in the environment. Wallingford,Oxon, UK, CAB International, pp. 243–268.
Nziguheba, G., Palm, C. A., Buresh, R. J., Smithson, P. C. (1998):Soil phosphorus fractions and adsorption as affected by organicand inorganic sources. Plant Soil 198, 159–168.
Nziguheba, G., Merckx, R., Palm, C. A. (2002): Soil phosphorusdynamics and maize response to different rates of phosphorusfertilizers applied to an Acrisol in western Kenya. Plant Soil 243,1–10.
Oberson, A., Frossard, E. (2005): Phosphorus management fororganic agriculture, in Sims, J. T., Sharpley, A. S. (eds.): Phos-phorus: Agriculture and the Environment. Agronomy Monograph46, ASA, CSSA, SSSA, Madison, WI, pp. 761–780.
Oberson, A., Fardeau, J. C., Besson, J. M., Sticher, H. (1993): Soilphosphorus dynamics in cropping systems managed according toconventional and biological agricultural methods. Biol. Fertil. Soils16, 111–117.
Oberson, A., Besson, J. M., Maire, N., Sticher, H. (1996): Microbialprocesses in soil organic phosphorus transformations in conven-tional and biological cropping systems. Biol. Fertil. Soils 21,138–148.
Oberson, A., Friesen, D. K., Rao, I. M., B�hler, S., Frossard, E.(2001): Phosphorus transformations in Oxisol under contrastingland-use systems: The role of the soil microbial biomass. Plant Soil237, 197–210.
Ochwoh, V. A., Claassens, A. S., de Jager, P. C. (2005): Chemicalchanges of applied and native phosphorus during incubation anddistribution into different soil phosphorus pools. Commun. Soil Sci.Plant Anal. 36, 535–556.
Paniagua, A., Mazzarino, M. J., Kass, D., Szott, L., Fernandez, C.(1995): Soil phosphorus fractions under five tropical agroeco-systems on a volcanic soil. Aust. J. Soil Res. 33, 311–320.
Pierzynski, G. M., McDowell, R. W., Sims, J. T. (2005): Chemistry,cycling, and potential movement of inorganic phosphorus in soils,in J. T. Sims, and A. S. Sharpley (eds.): Phosphorus: Agricultureand the Environment. Monograph No. 46, ASA, CSSA, SSSA,Madison, WI, pp. 53–86.
Qian, P., Schoenau, J. J. (2000): Fractions of P in soil as influencedby a single addition of liquid swine manure. Can. J. Soil Sci. 80,561–566.
Qian, P., Schoenau, J. J., Wu, T., Mooleki, P. (2004): Phosphorusamounts and distribution in a Saskatchewan soil after five years ofswine and cattle manure application. Can. J. Soil Sci. 84, 275–281.
Reddy, K. R., Kadlec, R. H., Flaig, E., Gale, P. M. (1999): Phosphorusretention in streams and wetlands: a review. Critical ReviewsEnviron. Sci. Technol. 29, 83–146.
Richards, J. E., Bates, T. E., Sheppard, S. C. (1995): Changes in theforms and distribution of soil phosphorus due to long term cornproduction. Can. J. Soil Sci. 75, 311–318.
Sammi Reddy, K., Rao, A. S., Takkar, P. N. (1996): Transformation offertilizers P in a Vertisol amended with farmyard manure. Biol.Fertil. Soils 22, 279–282.
Sanchez, P. A., Shepherd, K. D., Soule, M. J., Place, F. M., Buresh,R. J., Izac, A. M., Mokunywe, A. U., Kwesiga, F. R., Ndiritu, C. G.,Woomer, P. L. (1997): Soil fertility replenishment in Africa: Aninvestment in natural resource capital, in Buresh, R. J, Sanchez,P. A., Calhoun, F. (eds.): Replenishing Soil Fertility in Africa. SoilSci. Soc. Am. Spec. Publ. No. 51, Madison, WI, pp. 1–46.
Sato, S., Solomon, D., Hyland, C., Ketterings, Q. M., Lehmann, J.(2005): Phosphorus speciation in manure and manure amended
ª 2009 WILEY-VCH Verlag GmbH & Co. KGaA, Weinheim www.plant-soil.com
324 Negassa, Leinweber J. Plant Nutr. Soil Sci. 2009, 172, 305–325
soils using XANES spectroscopy. Environ. Sci. Technol. 39,7485–7491.
Schmidt, J. P., Buol, S. W., Kamprath, E. J. (1997): Soil phosphorusdynamics during 17 years of continuous cultivation: A method toestimate long-term P availability. Geoderma 78, 59–70.
Schoenau, J. J., Stewart, J. W. B., Bettany, J. R. (1989): Forms andcycling of phosphorus in prairie and boreal forest soils.Biogeochem. 8, 223–237.
Selles, F., Kochhann, R. A., Denardin, J. E., Zentner, R. P., Faga-nello, A. (1997): Distribution of phosphorus fractionations in aBrazilian Oxisols under different tillage systems. Soil Till. Res. 44,23–34.
Shand, C. A., Cheshire, M. V., Bedrock, C. N., Chapman, P. J.,Fraser, A. R., Chudek, J. A. (1999): Solid-phase 31P NMR spectraof peat and mineral soils, humic acids and soil solution compo-nents: influence of iron and manganese. Plant Soil 214, 153–163.
Sharpley, A. N., McDowell, R. W., Kleinman, P. J. A. (2004):Amounts, forms and solubility of phosphorus in soils receivingmanure. Soil Sci. Soc. Am. J. 68, 2048–2054.
Shober, A. L., Hesterberg, D. L., Sims, J. T., Gardner, S. (2006):Characterization of phosphorus species in biosolids and manuresusing XANES Spectroscopy. J. Environ. Qual. 35, 1983–1993.
Singh, B. R., Lal, R. (2005): Phosphorus management in low-inputagricultural systems, in Sims, J. T., Sharpley, A. S. (eds.): Phos-phorus: Agriculture and the Environment. Agronomy Monograph46, ASA, CSSA, SSSA, Madison, WI, USA, pp. 729–760.
Solomon, D., Lehmann, J. (2000): Loss of phosphorus from soil insemi-arid northern Tanzania as a result of cropping; evidence fromsequential extraction and 31P-NMR spectroscopy. Eur. J. Soil Sci.51, 699–708.
Solomon, D., Lehmann, J., Mamo, T., Fritzsche, F., Zech, W. (2002):Phosphorus forms and dynamics as influenced by land use chang-es in the sub-humid Ethiopian highlands. Geoderma 105, 21–48.
Stewart, J. W. B., Tiessen, H. (1987): Dynamics of soil organic phos-phorus. Biogeochem. 4, 41–60.
Sui, Y., Thompson, M. L., Shang, C. (1999): Fractionation of phos-phorus in a Mollisol amended with biosolids. Soil Sci. Soc. Am. J.63, 1174–1180.
Taranto, M. T., Adams, M. A., Polglase, P. J. (2000): Sequential frac-tionation and characterization (31P-NMR) of phosphorus-amendedsoils in Banksia integrifolia (L.f.) woodland and adjacent pasture.Soil Biol. Biochem. 32, 169–177.
Techienkoua, M., Zech, W. (2003): Chemical and spectral characteri-zation of soil phosphorus under three land uses from an AndicPalehumult in West Cameroon. Agric. Ecosyst. Environ. 100,193–200.
Thomas, S. M., Johnson, A. H., Frizano, J., Vann, D. R., Zarin, D. J.,Joshi, A. (1999): Phosphorus fractions in montane forest soils of
the Corsillera de Piuchu�, Chile: biogeochemical implications.Plant Soil 211, 139–148.
Tiessen, H., Moir, J. O. (1993): Characterization of available P bysequential extraction. In: Carter, M.R. (ed.) Soil Sampling andMethods of Analysis. Can. Soc. Soil Sci., Lewis Publishers, BocaRaton, FL, pp. 75–86.
Tiessen, H., Stewart, J. W. B., Moir, J. (1983): Changes in organicand inorganic phosphorus composition of two grassland soils andtheir particle size fractions during 60–90 years of cultivation. J. SoilSci. 34, 815–823.
Tiessen, H., Stewart, J. W. B., Cole, C. V. (1984): Pathways of phos-phorus transformation in soils of differing pedogenesis. Soil Sci.Soc. Am. J. 48, 853–858.
Tiessen, H., Salcedo, I. H., Sampaio, E. V. S. B. (1992): Nutrientsand soil organic matter dynamics under shifting cultivation in semi-arid northeastern Brazil. Agric. Ecosyst. Environ. 38, 139–151.
Tiessen, H., Chacon, P., Cuevas, E. (1994): Phosphorus and nitrogenstatus in soils and vegetation along a toposequence of dystrophicrainforests on the upper Rio Negro. Oecologia 99, 145–150.
Toor, G. S., Cade-Menun, B. J., Sims, J. T. (2005): Establishing alinkage between phosphorus forms in dairy diets, feces, andmanures. J. Environ. Qual. 34, 1380–1391.
Toor, G. S., Hunger, S., Peak, J. D., Sims, J. T., Sparks, D. L. (2006):Advances in the characterization and of phosphorus in organicwastes: environmental and agronomic applications. Advan. Agron.89, 1–72.
Tran, T. S., N’dayegamiye, A. (1995): Long term effect of fertilizersand manure application on the forms and availability of soil phos-phorus. Can. J. Soil Sci. 75, 281–285.
Turri�n, M. B., Glaser, B., Solomon, D., Ni, A., Zech, W. (2000):Effects of deforestation on phosphorus poos in mountain soils ofthe Alay Range, Khyrgyzia. Biol. Fertil. Soils 31, 134–142.
Wagar, B. I., Stewart, J. W. B., Moir, J. O. (1986): Changes with timein the form and availability of residual fertilizers phosphorus onchernozemic soils. Can. J. Soil Sci. 66, 105–119.
Zheng, Z., Simard, R. R., Lafond, J., Parent, L. E. (2002): Pathwaysof soil phosphorus transformations after 8 years of cultivationunder contrasting cropping practices. Soil Sci. Soc. Am. J. 66,999–1007.
Zheng, Z., MacLeod, J. A., Sanderson, J. B., Lafond, J. (2004): Soilphosphorus dynamics after ten annual applications of mineral ferti-lizers and liquid dairy manure: fractionation and path analyses. SoilSci. 169, 449–456.
Zhu, Y. G., Cavagnaro, T. R., Smith, S. E., Dickson, S. (2001):Backseat driving? Accessing phosphate beyond the rhizosphere–depletion zone. Trends Plant Sci. 6, 194–195.
Zubillaga, M. S., de Lpez Camelo, L. G. (1998): Pathways of nativeand fertilizers phosphorus in Argentine soils. Nutr. Cycl. Agro-ecosyst. 51, 101–105.
ª 2009 WILEY-VCH Verlag GmbH & Co. KGaA, Weinheim www.plant-soil.com
J. Plant Nutr. Soil Sci. 2009, 172, 305–325 Hedley fractionation reflects impacts on soil phosphorus 325
Related Documents