How does saltwater intrusion alter anaerobic microbial metabolism in a freshwater wetland? Amy J Burgin 1 , Valerie A. Schoepfer 1 , Ashley M. Helton 2 , Marcelo Ardón 3 , Emily S. Bernhardt 2 , Robert A. Payn 4 , and Geoffery C. Poole 4 Timberlake Wetland, Coastal N.C.

Welcome message from author
This document is posted to help you gain knowledge. Please leave a comment to let me know what you think about it! Share it to your friends and learn new things together.
Transcript
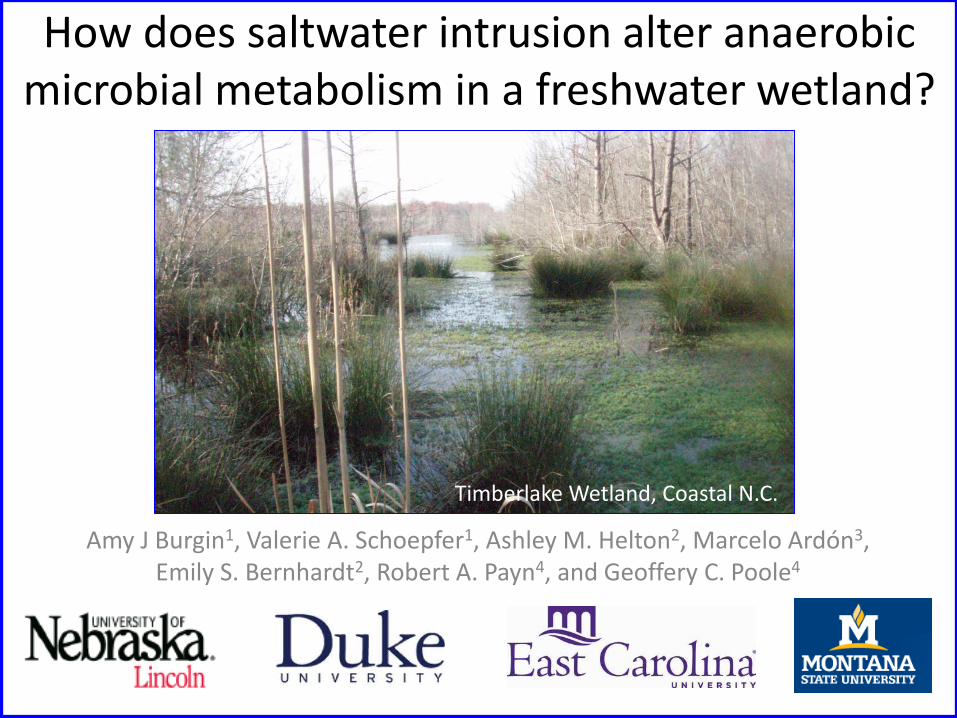
How does saltwater intrusion alter anaerobic microbial metabolism in a freshwater wetland?
Amy J Burgin1, Valerie A. Schoepfer1, Ashley M. Helton2, Marcelo Ardón3, Emily S. Bernhardt2, Robert A. Payn4, and Geoffery C. Poole4
Timberlake Wetland, Coastal N.C.
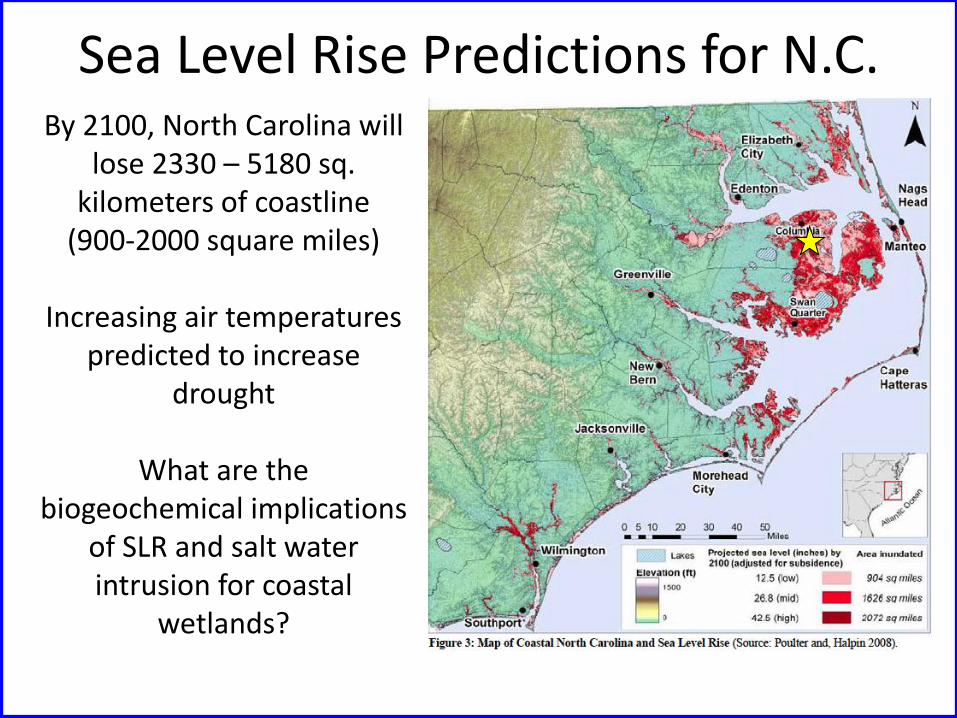
Sea Level Rise Predictions for N.C. By 2100, North Carolina will
lose 2330 – 5180 sq. kilometers of coastline
(900-2000 square miles)
Increasing air temperatures predicted to increase
drought
What are the biogeochemical implications
of SLR and salt water intrusion for coastal
wetlands?
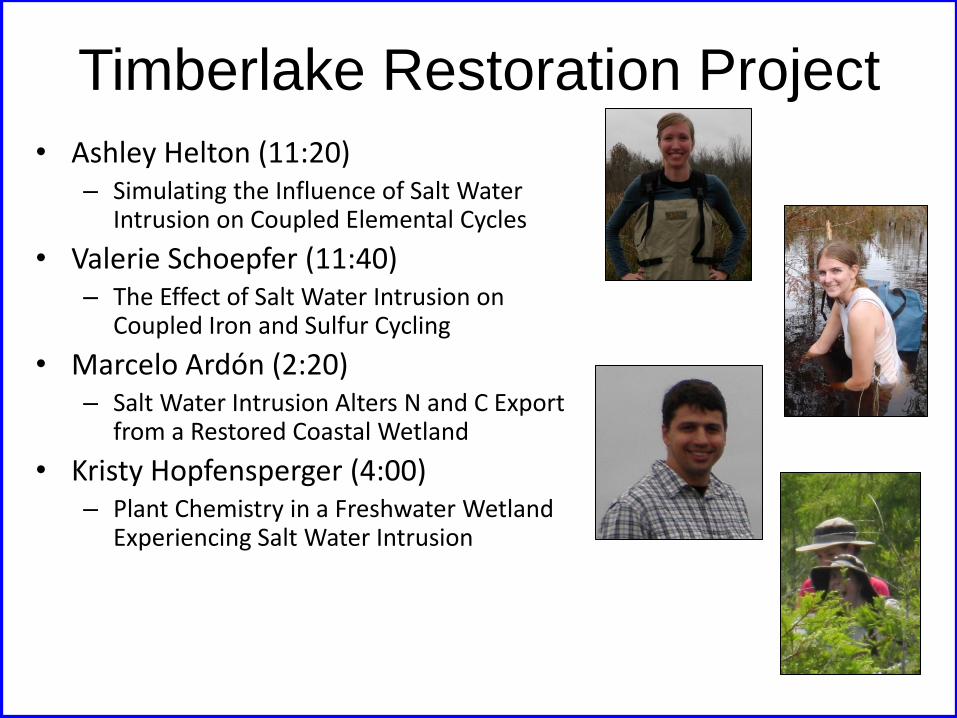
Timberlake Restoration Project • Ashley Helton (11:20)
– Simulating the Influence of Salt Water Intrusion on Coupled Elemental Cycles
• Valerie Schoepfer (11:40) – The Effect of Salt Water Intrusion on
Coupled Iron and Sulfur Cycling
• Marcelo Ardón (2:20) – Salt Water Intrusion Alters N and C Export
from a Restored Coastal Wetland
• Kristy Hopfensperger (4:00) – Plant Chemistry in a Freshwater Wetland
Experiencing Salt Water Intrusion
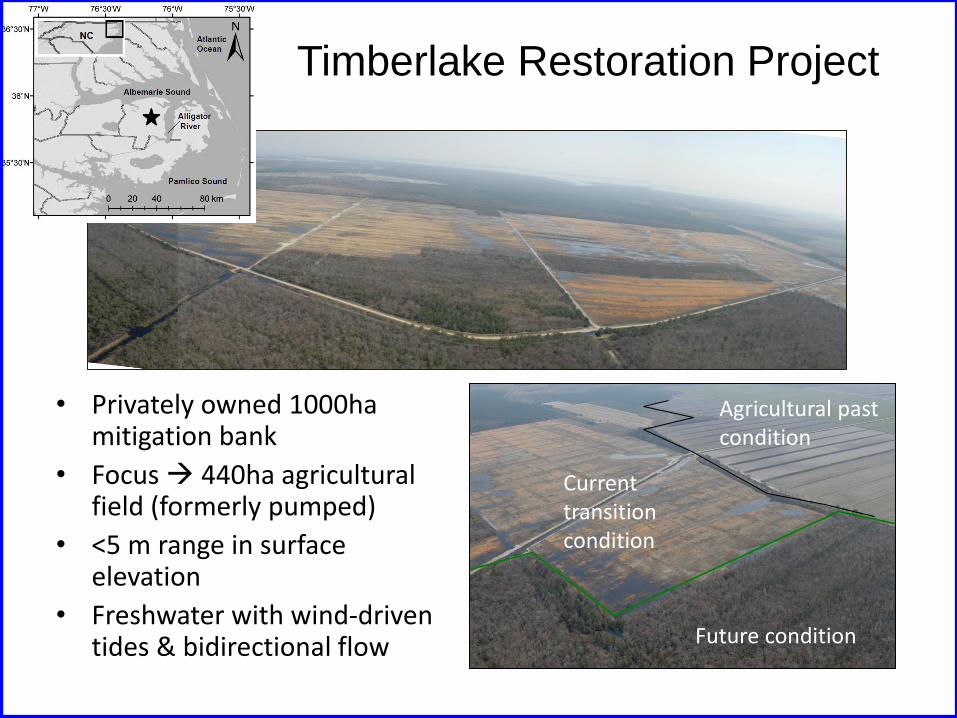
Timberlake Restoration Project
• Privately owned 1000ha mitigation bank
• Focus 440ha agricultural field (formerly pumped)
• <5 m range in surface elevation
• Freshwater with wind-driven tides & bidirectional flow
Future condition
Agricultural past condition
Current transition condition
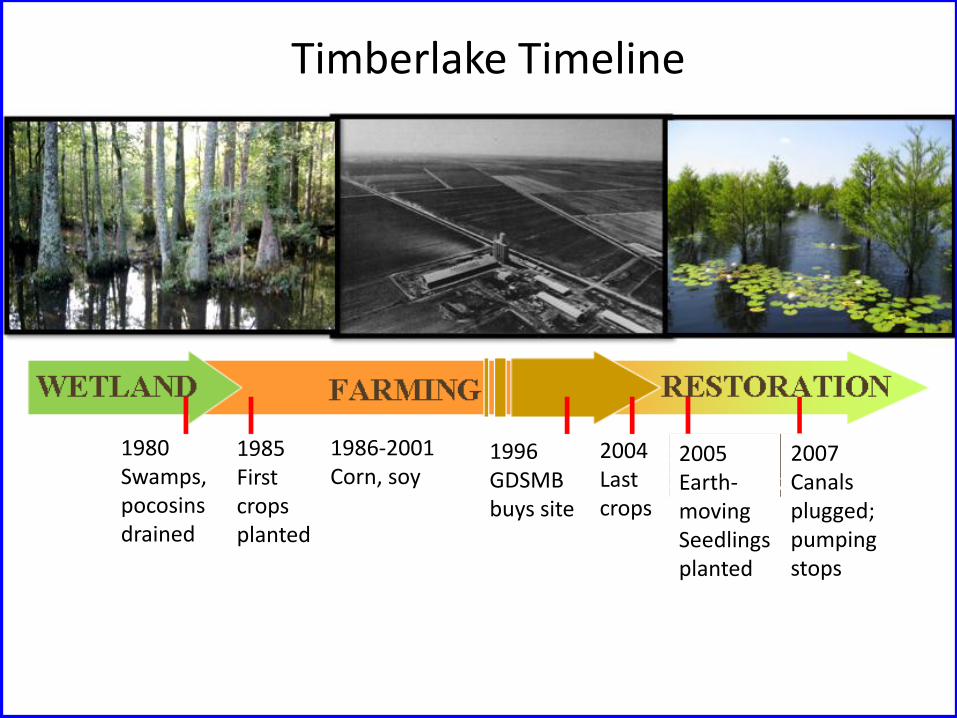
~1980’s Timberlake Timeline
1980 Swamps, pocosins drained
1985 First crops planted
1996 GDSMB buys site
1986-2001 Corn, soy
2004 Last crops
2005 Earth-moving Seedlings planted
2007 Canals plugged; pumping stops
OUTFLOW =
SALT WATER
EXPOSED
MIDPOINT 2 INFLOWS =
MINIMAL SALT
EXPOSURE
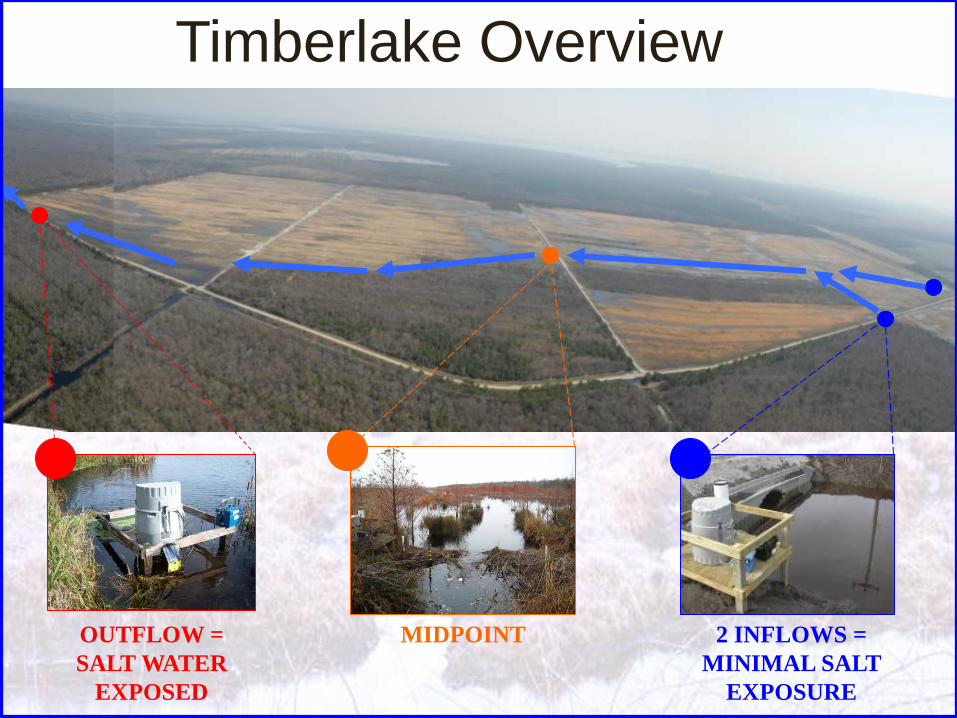
Timberlake Overview
OUTFLOW =
SALT WATER
EXPOSED
MIDPOINT 2 INFLOWS =
MINIMAL SALT
EXPOSURE
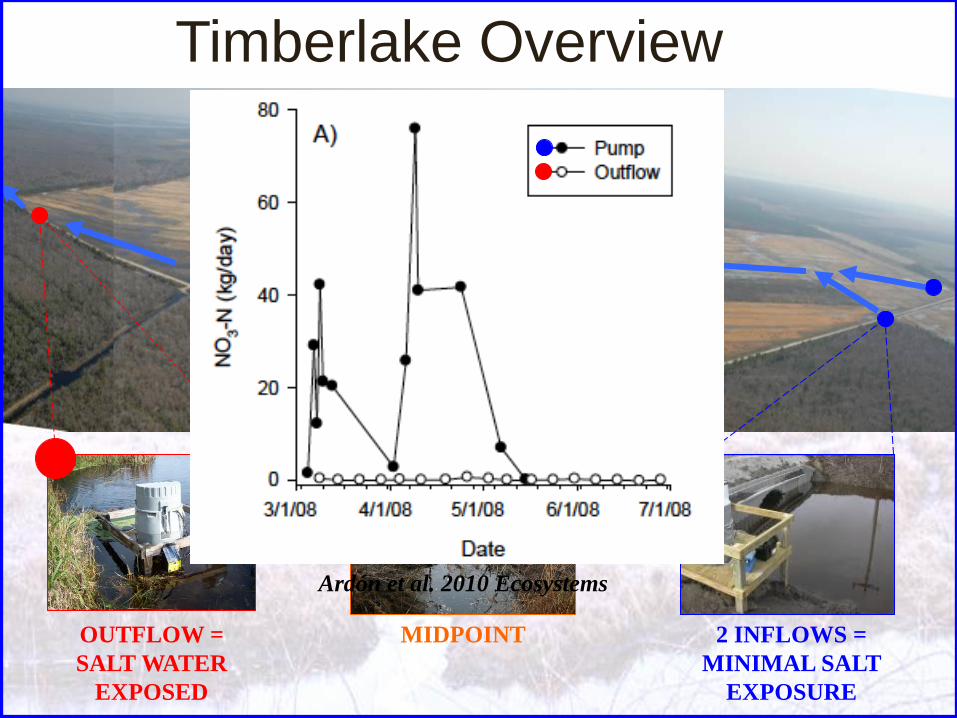
Timberlake Overview
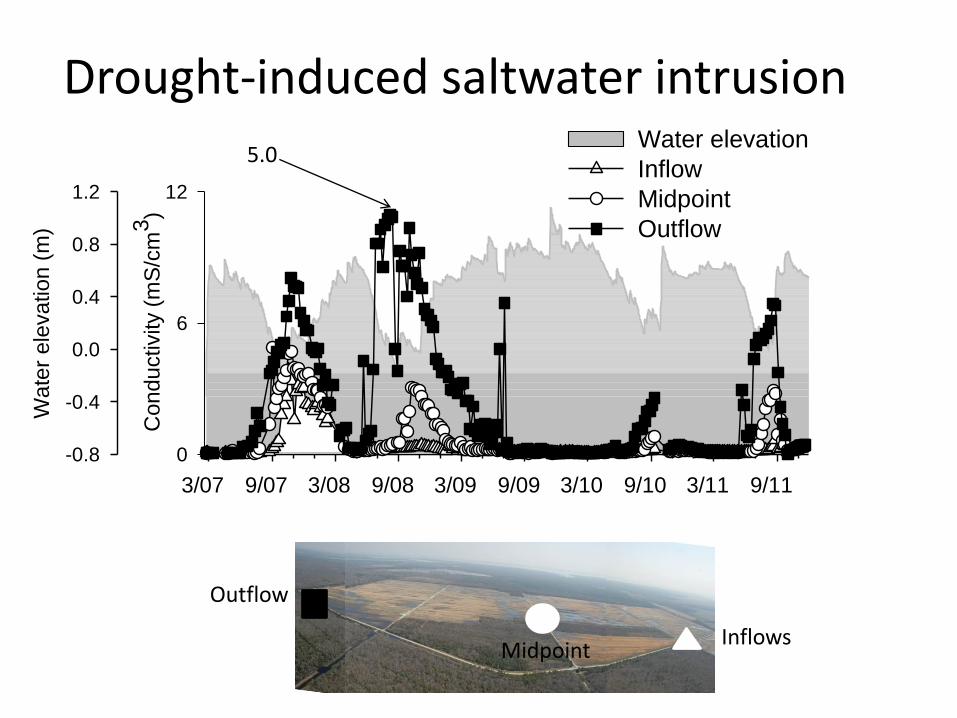
Ardón et al. 2010 Ecosystems
3/07 9/07 3/08 9/08 3/09 9/09 3/10 9/10 3/11 9/11
Wa
ter
ele
va
tio
n (
m)
-0.8
-0.4
0.0
0.4
0.8
1.2
Con
du
ctivity (
mS
/cm
3)
0
6
12
Water elevation
Inflow
Midpoint
Outflow
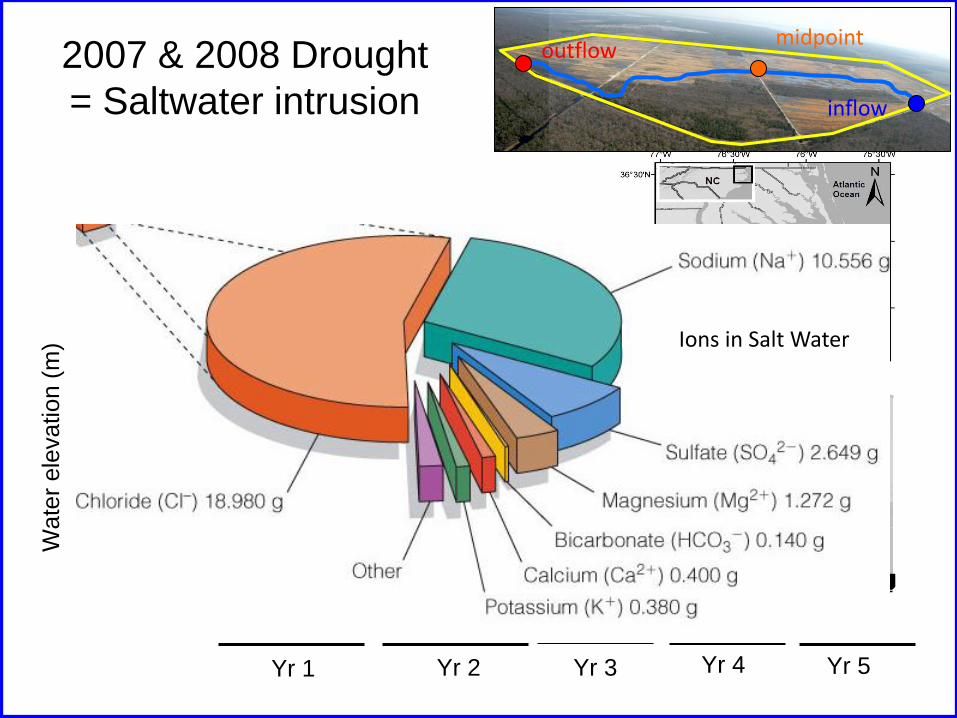
2007 & 2008 Drought
= Saltwater intrusion
5 ppt
Yr 1 Yr 2 Yr 3
outflow
inflow
midpoint
Yr 4 Yr 5
Ions in Salt Water
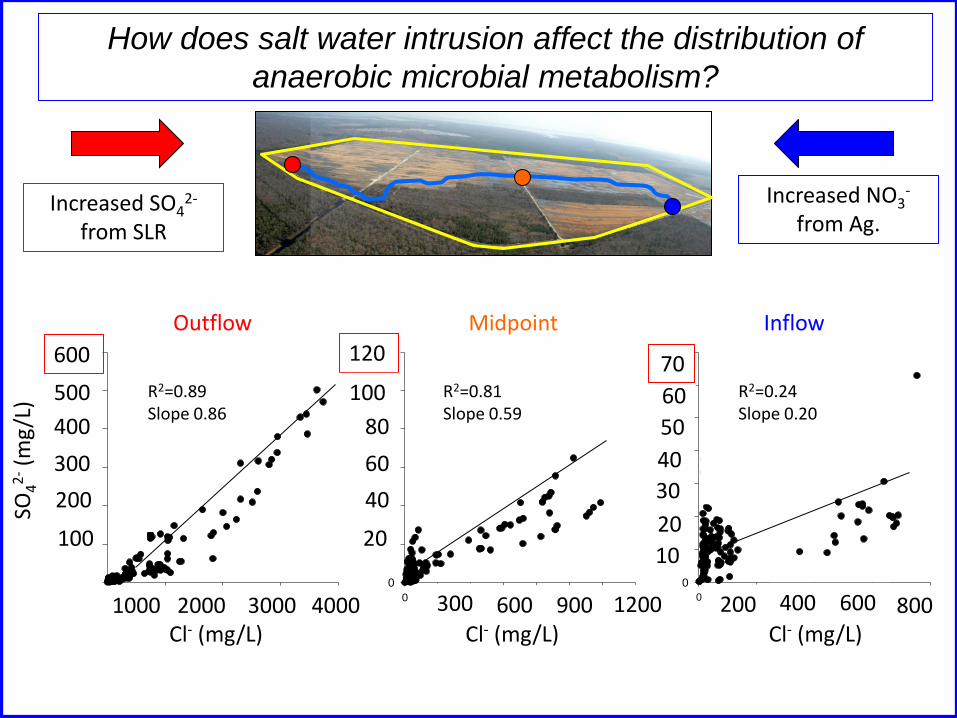
Increased SO42-
from SLR
Increased NO3-
from Ag.
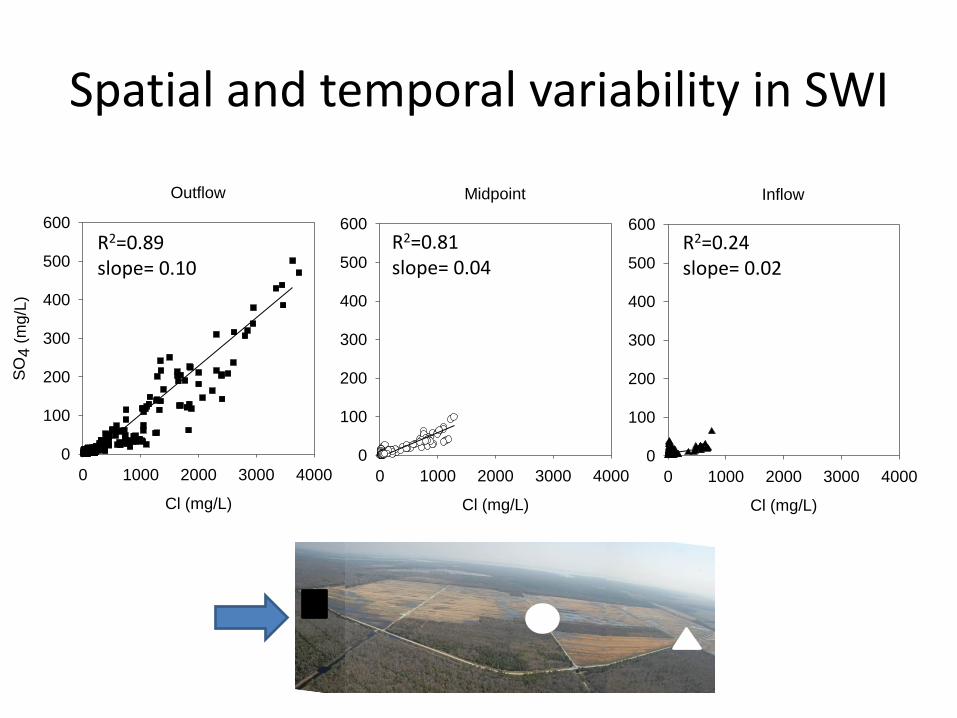
Outflow
Cl (mg/L)
0 1000 2000 3000 4000
SO
4 (
mg
/L)
0
100
200
300
400
500
600
Midpoint
Cl (mg/L)
0 200 400 600 800 1000 1200 1400
SO
4 (
mg
/L)
0
20
40
60
80
100
120
Inflow
Cl (mg/L)
0 200 400 600 800
SO
4 (
mg
/L)
0
10
20
30
40
50
60
70
R2=0.89 Slope 0.86
R2=0.81 Slope 0.59
R2=0.24 Slope 0.20
Outflow Midpoint Inflow
SO4
2- (
mg
/L)
600
500
400
300
200
100
Cl- (mg/L) Cl- (mg/L) Cl- (mg/L)
120
100
80
60
40
20
60
50
40
30
20
10
70
1000 2000 3000 4000 300 600 900 1200 200 400 600 800
How does salt water intrusion affect the distribution of
anaerobic microbial metabolism?

Burgin et al. (2011) Frontiers in Ecology and the Environment
How does salt water intrusion affect the distribution of
anaerobic microbial metabolism?
How does salt water intrusion affect the distribution of
anaerobic microbial metabolism?
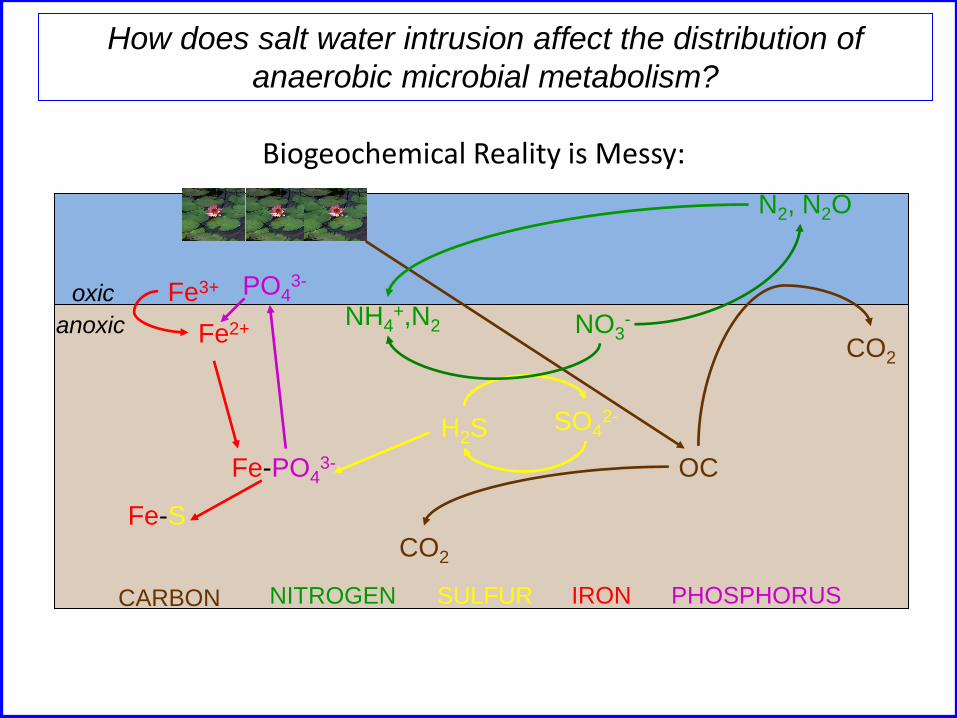
Biogeochemical Reality is Messy:
oxic
anoxic
SO42-
OC
CO2
H2S
CO2
CARBON NITROGEN SULFUR IRON PHOSPHORUS
Fe-PO43-
Fe3+ PO43-
Fe2+
Fe-S
N2, N2O
NO3- NH4
+,N2
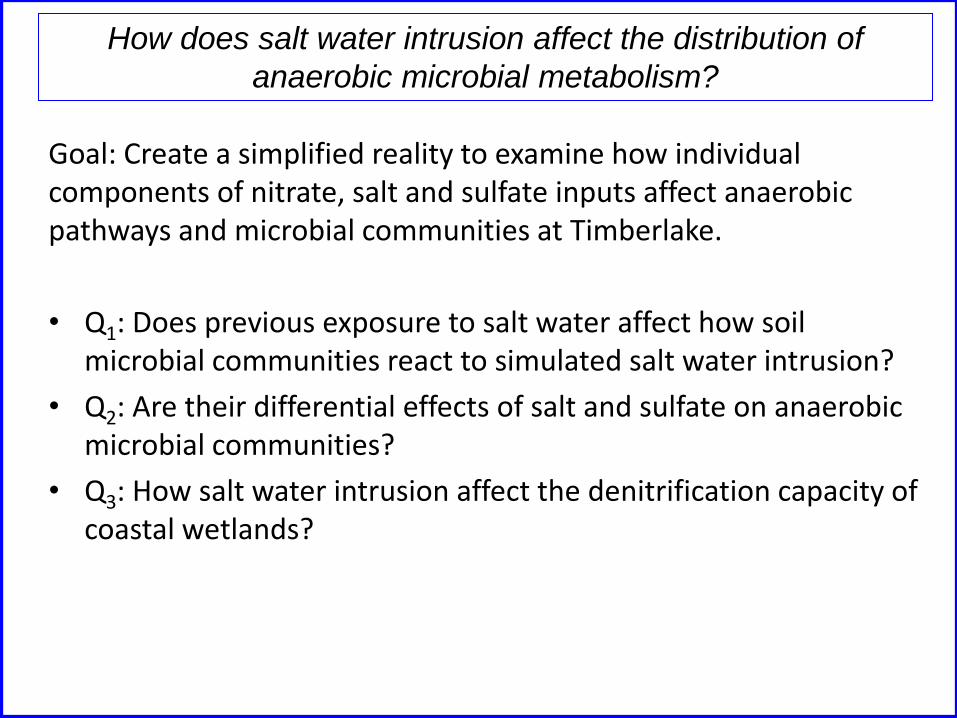
Goal: Create a simplified reality to examine how individual components of nitrate, salt and sulfate inputs affect anaerobic pathways and microbial communities at Timberlake.
• Q1: Does previous exposure to salt water affect how soil microbial communities react to simulated salt water intrusion?
• Q2: Are their differential effects of salt and sulfate on anaerobic microbial communities?
• Q3: How salt water intrusion affect the denitrification capacity of coastal wetlands?
How does salt water intrusion affect the distribution of
anaerobic microbial metabolism?
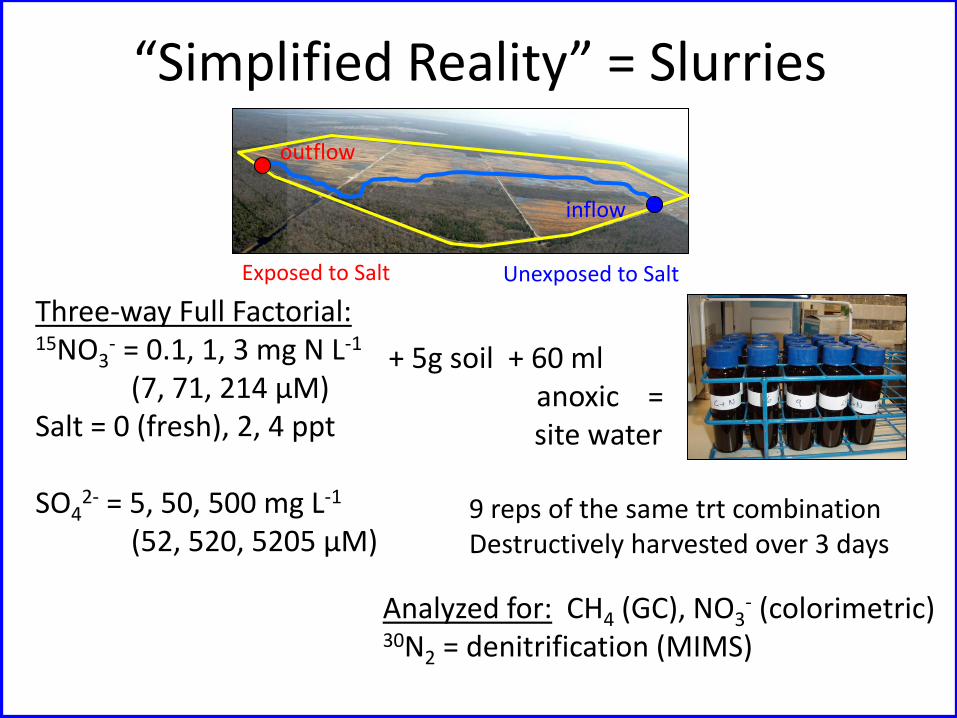
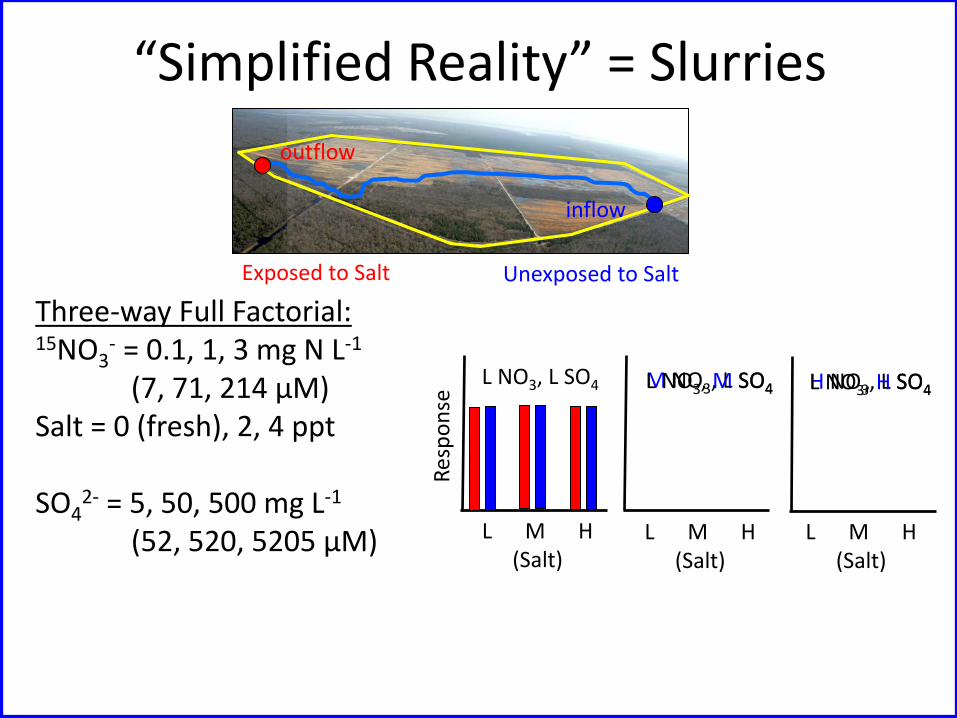
“Simplified Reality” = Slurries
outflow
inflow
Exposed to Salt Unexposed to Salt
Three-way Full Factorial: 15NO3
- = 0.1, 1, 3 mg N L-1
(7, 71, 214 μM) Salt = 0 (fresh), 2, 4 ppt SO4
2- = 5, 50, 500 mg L-1
(52, 520, 5205 μM)
+ 5g soil + 60 ml anoxic = site water
9 reps of the same trt combination Destructively harvested over 3 days
Analyzed for: CH4 (GC), NO3- (colorimetric)
30N2 = denitrification (MIMS)
“Simplified Reality” = Slurries
outflow
inflow
Exposed to Salt Unexposed to Salt
Three-way Full Factorial: 15NO3
- = 0.1, 1, 3 mg N L-1
(7, 71, 214 μM) Salt = 0 (fresh), 2, 4 ppt SO4
2- = 5, 50, 500 mg L-1
(52, 520, 5205 μM)
Res
po
nse
L NO3, L SO4
L M H (Salt)
L M H (Salt)
L M H (Salt)
M NO3, L SO4 H NO3, L SO4 L NO3, M SO4 L NO3, H SO4
0
5
10
15
20
25
30
0 2 4
Nit
rate
Red
uct
ion
(n
mo
les/
hr)
Salinity (ppt)
0
5
10
15
20
25
30
0 2 4Salinity (ppt)
0
5
10
15
20
25
30
0 2 4Salinity (ppt)
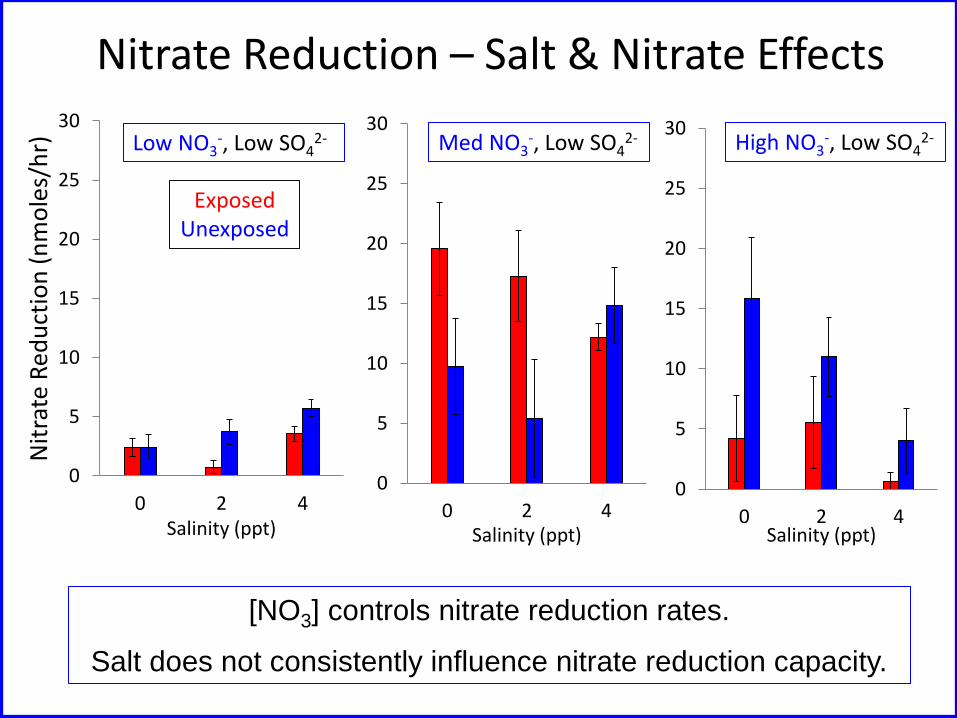
[NO3] controls nitrate reduction rates.
Salt does not consistently influence nitrate reduction capacity.
Low NO3-, Low SO4
2- Med NO3-, Low SO4
2- High NO3-, Low SO4
2-
Exposed Unexposed
Nitrate Reduction – Salt & Nitrate Effects
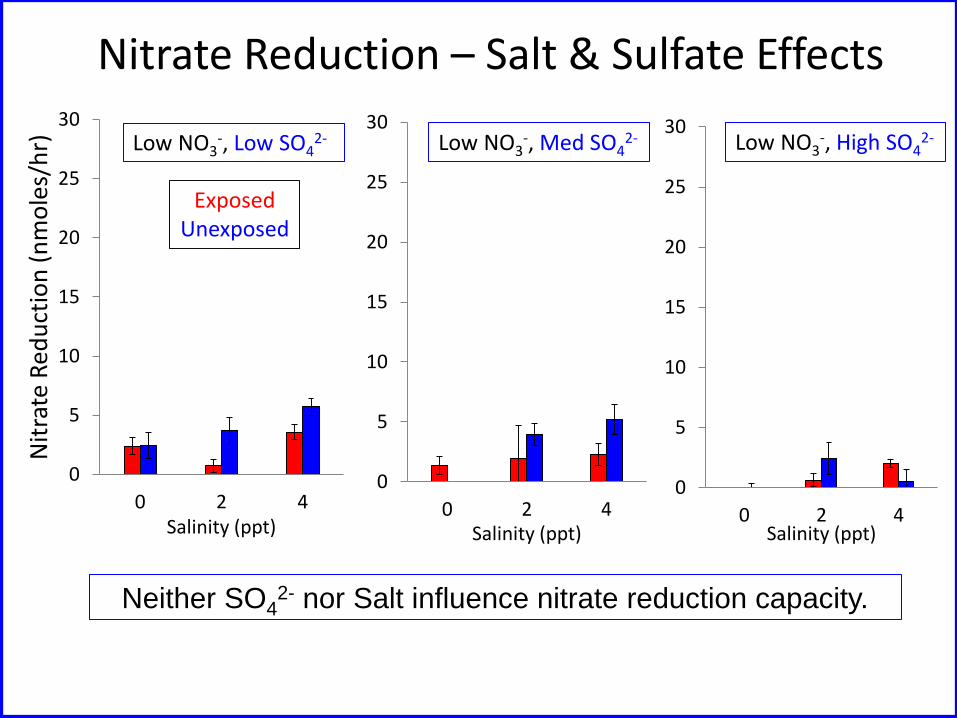
Nitrate Reduction – Salt & Sulfate Effects
0
5
10
15
20
25
30
0 2 4
Nit
rate
Red
uct
ion
(n
mo
les/
hr)
Salinity (ppt)
0
5
10
15
20
25
30
0 2 4Salinity (ppt)
0
5
10
15
20
25
30
0 2 4Salinity (ppt)
Neither SO42- nor Salt influence nitrate reduction capacity.
Low NO3-, Low SO4
2- Low NO3-, Med SO4
2- Low NO3-, High SO4
2-
Exposed Unexposed

Denitrification – Salt & Nitrate Effects
0
5
10
15
20
25
30
35
40
0 2 4
Den
itri
fica
tio
n (
nm
ole
s N
2/h
r)
Salinity (ppt)
0
5
10
15
20
25
30
35
40
0 2 4Salinity (ppt)
0
5
10
15
20
25
30
35
40
0 2 4Salinity (ppt)
[NO3] controls denitrification rates
Clear salt effect on denitrification with excess NO3-
Unexposed > Exposed denitrification rates
Low NO3-, Low SO4
2- Med NO3-, Low SO4
2- High NO3-, Low SO4
2-
Exposed Unexposed
0
5
10
15
20
25
30
35
40
0 2 4
Den
itri
fica
tio
n (
nm
ole
s N
2/h
r)
Salinity (ppt)
0
5
10
15
20
25
30
35
40
0 2 4Salinity (ppt)
0
5
10
15
20
25
30
35
40
0 2 4Salinity (ppt)
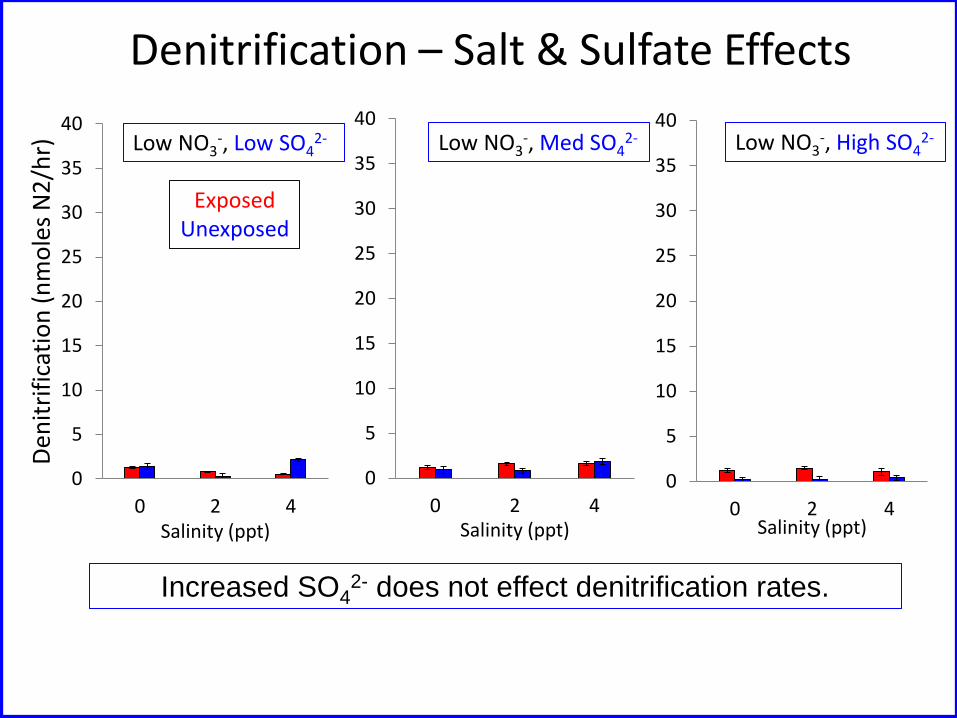
Denitrification – Salt & Sulfate Effects
Increased SO42- does not effect denitrification rates.
Low NO3-, Low SO4
2- Low NO3-, Med SO4
2- Low NO3-, High SO4
2-
Exposed Unexposed
-1.0
-0.5
0.0
0.5
1.0
1.5
2.0
0 2 4
Met
han
e p
ote
nti
al (
nm
ole
s/h
r)
Salinity (ppt)
-1.0
-0.5
0.0
0.5
1.0
1.5
2.0
0 2 4Salinity (ppt)
-1.0
-0.5
0.0
0.5
1.0
1.5
2.0
0 2 4Salinity (ppt)
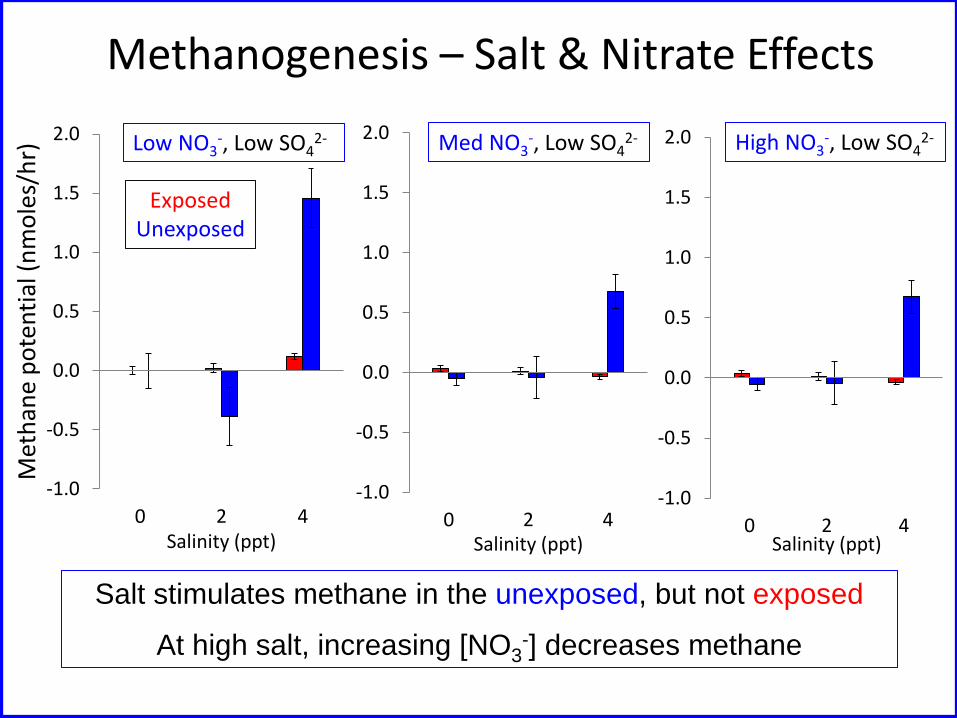
Methanogenesis – Salt & Nitrate Effects
Salt stimulates methane in the unexposed, but not exposed
At high salt, increasing [NO3-] decreases methane
Low NO3-, Low SO4
2- Med NO3-, Low SO4
2- High NO3-, Low SO4
2-
Exposed Unexposed
-1.0
-0.5
0.0
0.5
1.0
1.5
2.0
0 2 4Salinity (ppt)
-1.0
-0.5
0.0
0.5
1.0
1.5
2.0
0 2 4Salinity (ppt)
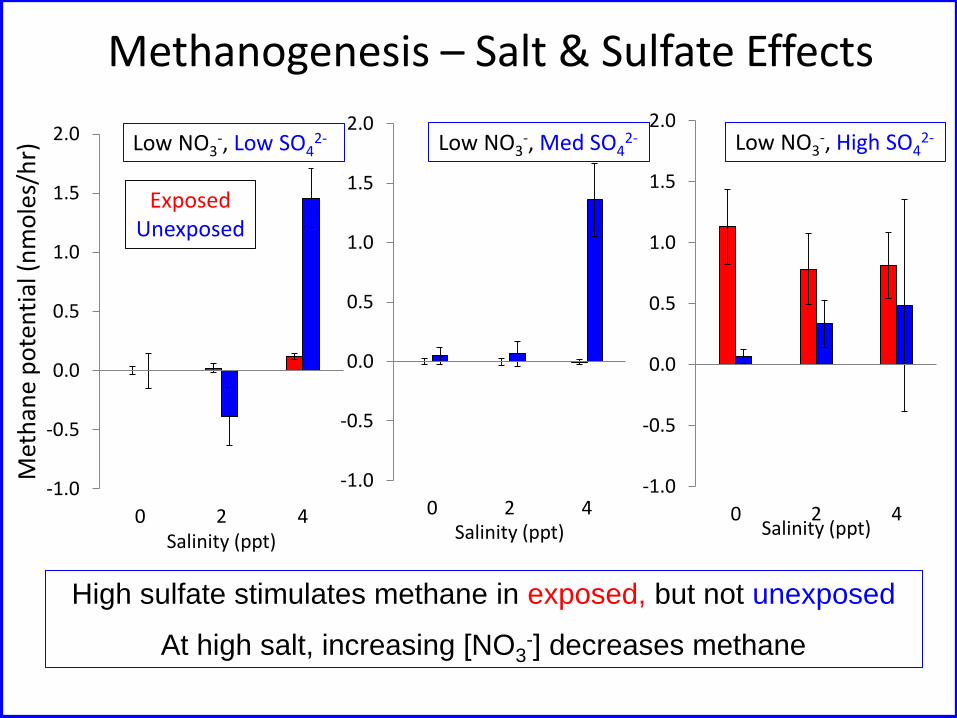
Methanogenesis – Salt & Sulfate Effects
-1.0
-0.5
0.0
0.5
1.0
1.5
2.0
0 2 4
Met
han
e p
ote
nti
al (
nm
ole
s/h
r)
Salinity (ppt)
Low NO3-, Low SO4
2- Low NO3-, Med SO4
2- Low NO3-, High SO4
2-
Exposed Unexposed
High sulfate stimulates methane in exposed, but not unexposed
At high salt, increasing [NO3-] decreases methane
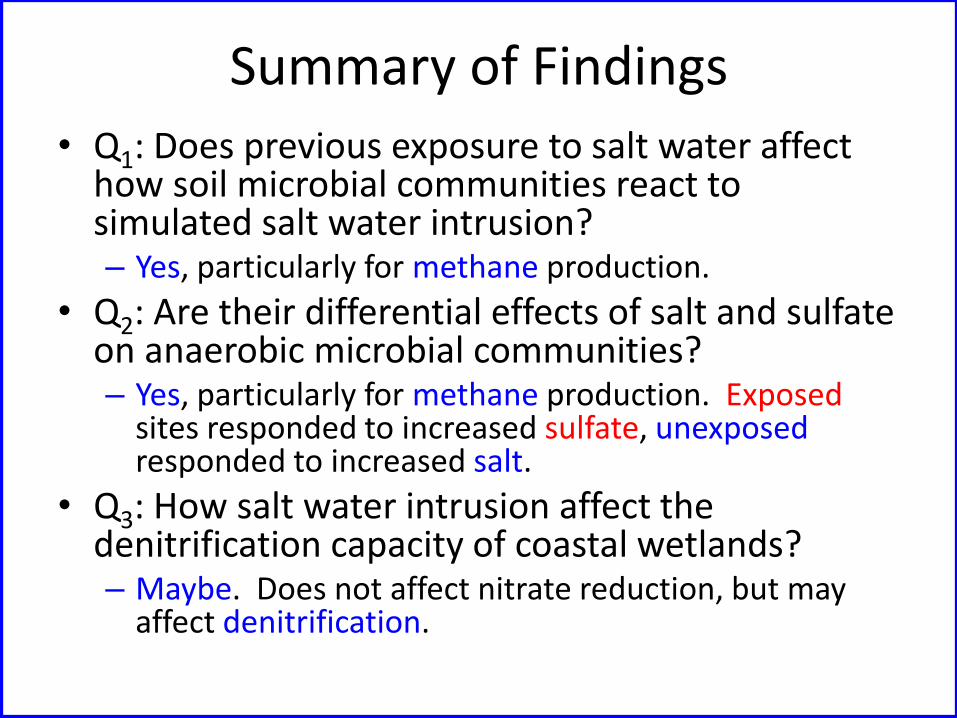
Summary of Findings
• Q1: Does previous exposure to salt water affect how soil microbial communities react to simulated salt water intrusion? – Yes, particularly for methane production.
• Q2: Are their differential effects of salt and sulfate on anaerobic microbial communities? – Yes, particularly for methane production. Exposed
sites responded to increased sulfate, unexposed responded to increased salt.
• Q3: How salt water intrusion affect the denitrification capacity of coastal wetlands? – Maybe. Does not affect nitrate reduction, but may
affect denitrification.
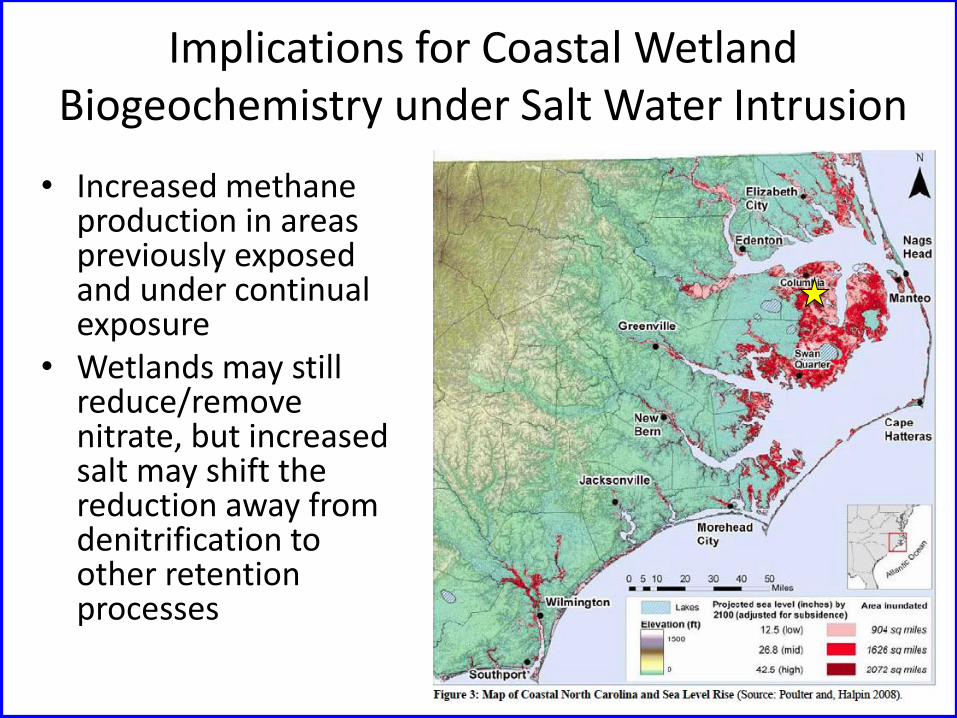
Implications for Coastal Wetland Biogeochemistry under Salt Water Intrusion
• Increased methane production in areas previously exposed and under continual exposure
• Wetlands may still reduce/remove nitrate, but increased salt may shift the reduction away from denitrification to other retention processes
Acknowledgements
• Medora Burke-Scoll and Anna Fedders
• Terry Loecke
• Kristy Hopfensperger
• Sarah Harvey, Erin Cull, Melanie Stall, James Detraz, and Geraldine Nogaro
• NSF Ecosystems
3/07 9/07 3/08 9/08 3/09 9/09 3/10 9/10 3/11 9/11
Wate
r ele
vation (
m)
-0.8
-0.4
0.0
0.4
0.8
1.2
Conductivity (
mS
/cm
3)
0
6
12
Water elevation
Inflow
Midpoint
Outflow
Drought-induced saltwater intrusion
5.0
Outflow
Midpoint Inflows
Outflow
Cl (mg/L)
0 1000 2000 3000 4000
SO
4 (
mg
/L)
0
100
200
300
400
500
600
Midpoint
Cl (mg/L)
0 1000 2000 3000 4000
0
100
200
300
400
500
600
Inflow
Cl (mg/L)
0 1000 2000 3000 4000
0
100
200
300
400
500
600
Spatial and temporal variability in SWI
R2=0.89 slope= 0.10
R2=0.81 slope= 0.04
R2=0.24 slope= 0.02
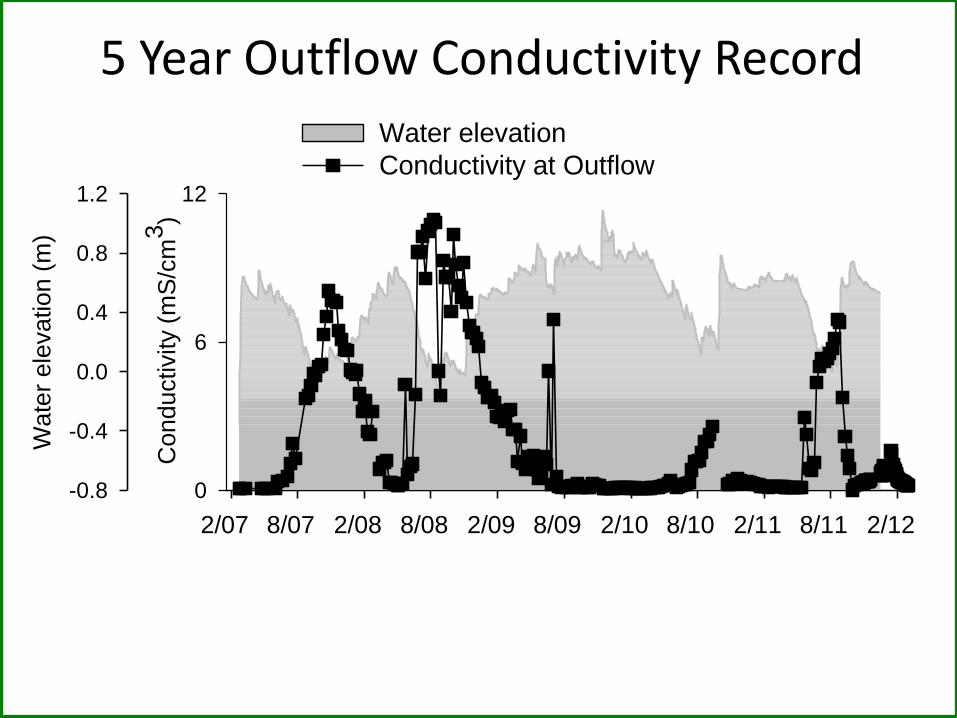
2/07 8/07 2/08 8/08 2/09 8/09 2/10 8/10 2/11 8/11 2/12
Wate
r ele
vation (
m)
-0.8
-0.4
0.0
0.4
0.8
1.2
Conductivity (
mS
/cm
3)
0
6
12
Water elevation
Conductivity at Outflow
5 Year Outflow Conductivity Record
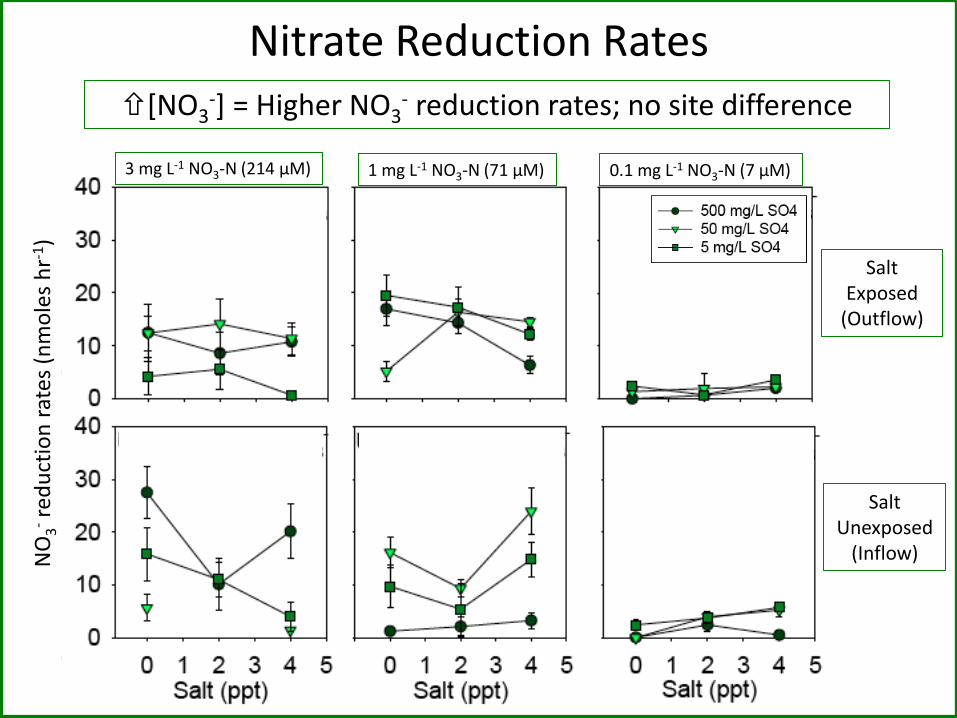
Nitrate Reduction Rates N
O3
- red
uct
ion
rat
es (
nm
ole
s h
r-1)
3 mg L-1 NO3-N (214 μM) 1 mg L-1 NO3-N (71 μM) 0.1 mg L-1 NO3-N (7 μM)
Salt Exposed
(Outflow)
Salt Unexposed
(Inflow)
[NO3-] = Higher NO3
- reduction rates; no site difference
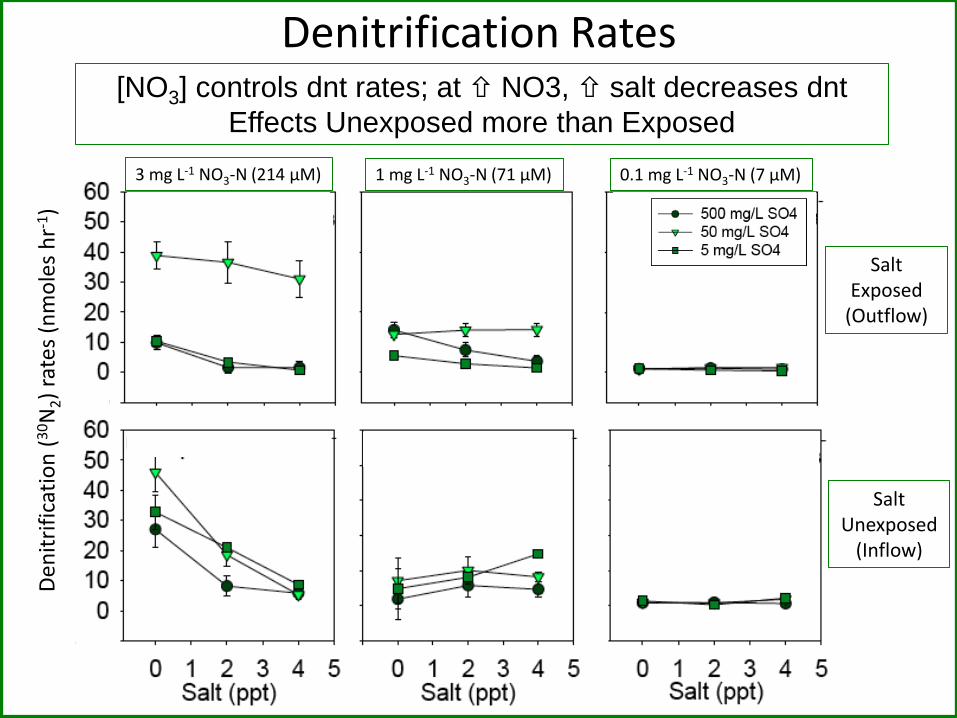
Denitrification Rates D
enit
rifi
cati
on
(3
0N
2)
rate
s (n
mo
les
hr-1
)
3 mg L-1 NO3-N (214 μM) 1 mg L-1 NO3-N (71 μM) 0.1 mg L-1 NO3-N (7 μM)
Salt Exposed
(Outflow)
Salt Unexposed
(Inflow)
[NO3] controls dnt rates; at NO3, salt decreases dnt
Effects Unexposed more than Exposed
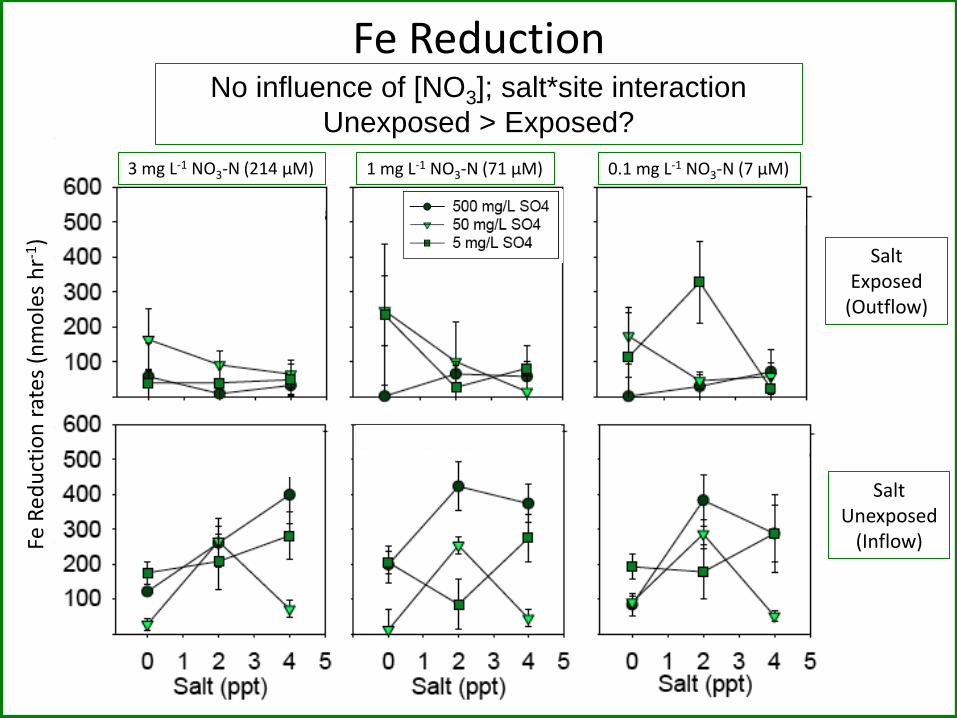
Fe Reduction
3 mg L-1 NO3-N (214 μM) 1 mg L-1 NO3-N (71 μM) 0.1 mg L-1 NO3-N (7 μM)
Salt Exposed
(Outflow)
Salt Unexposed
(Inflow) Fe R
edu
ctio
n r
ates
(n
mo
les
hr-1
)
No influence of [NO3]; salt*site interaction
Unexposed > Exposed?
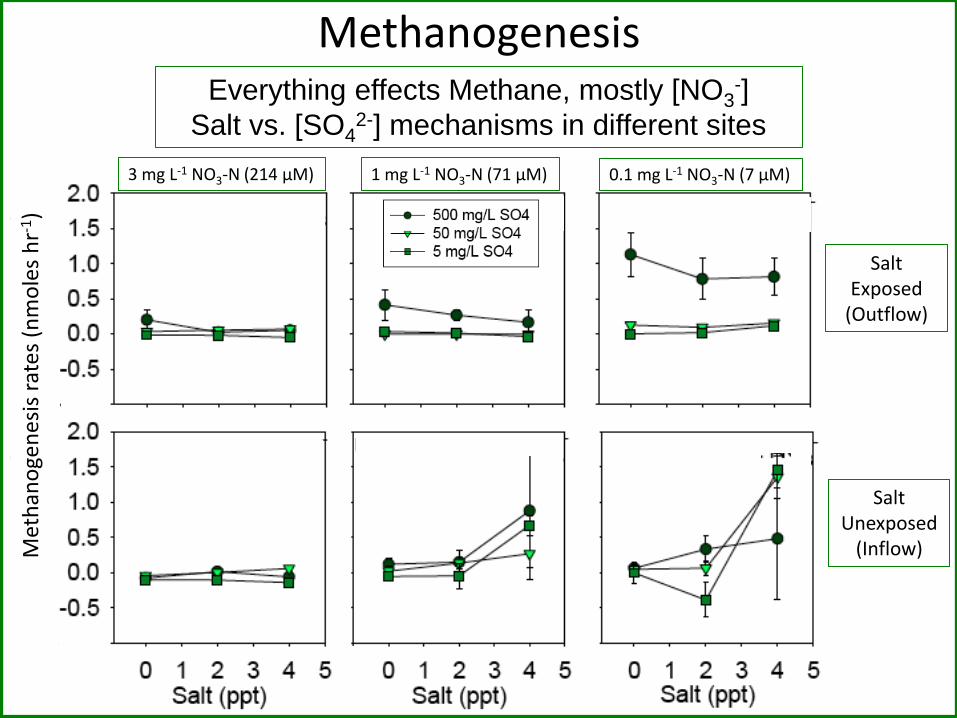
Methanogenesis
3 mg L-1 NO3-N (214 μM) 1 mg L-1 NO3-N (71 μM) 0.1 mg L-1 NO3-N (7 μM)
Salt Exposed
(Outflow)
Salt Unexposed
(Inflow) Met
han
oge
ne
sis
rate
s (n
mo
les
hr-1
)
Everything effects Methane, mostly [NO3-]
Salt vs. [SO42-] mechanisms in different sites
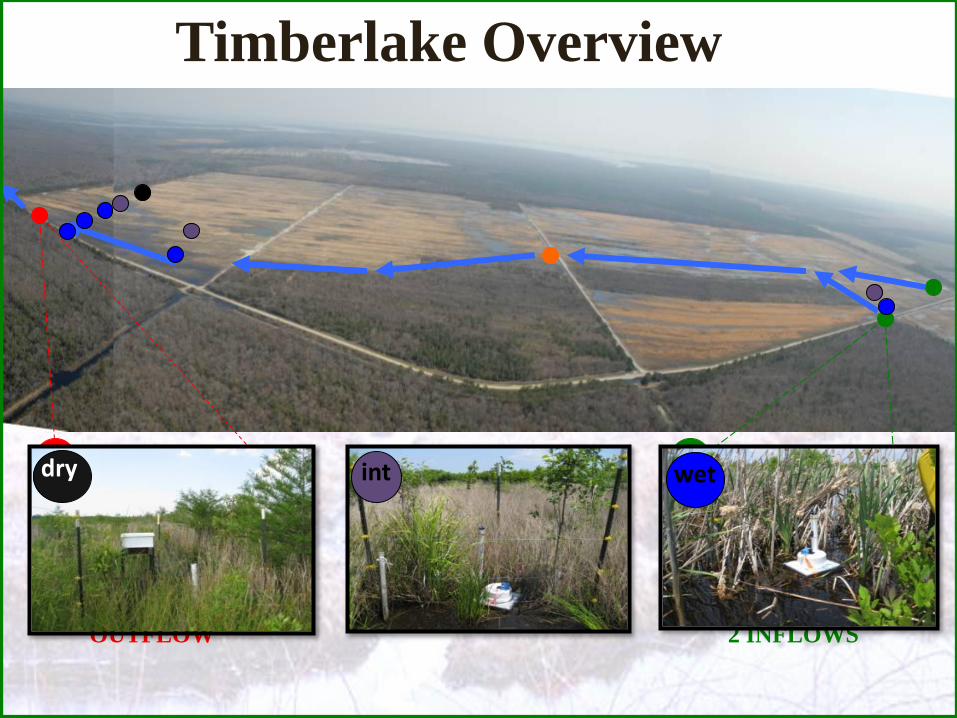
OUTFLOW 2 INFLOWS
Timberlake Overview
int dry wet
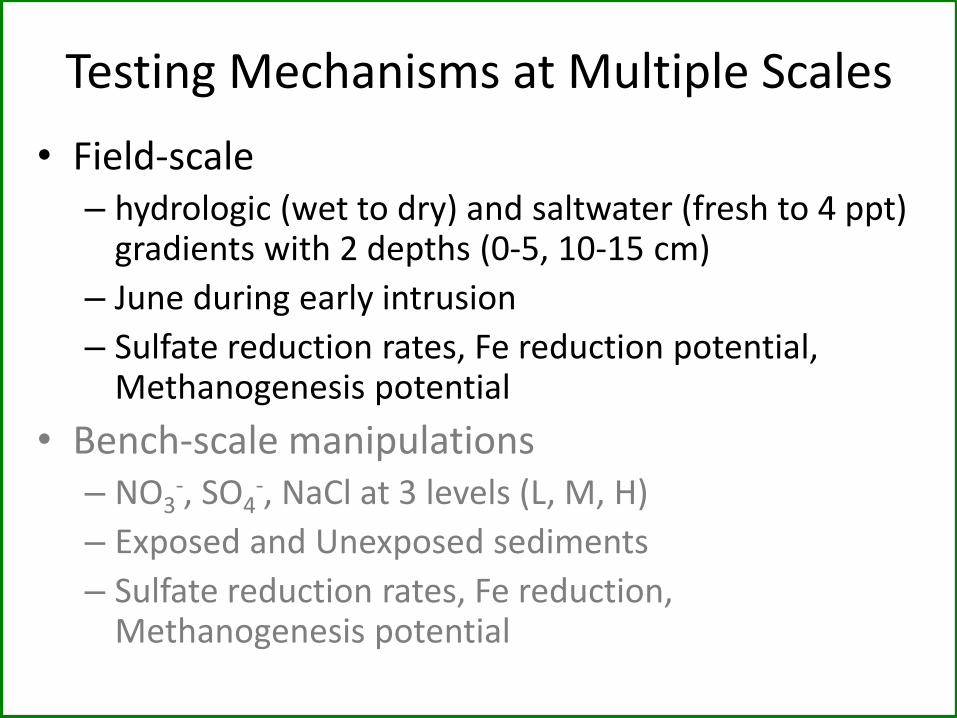
Testing Mechanisms at Multiple Scales
• Field-scale – hydrologic (wet to dry) and saltwater (fresh to 4 ppt)
gradients with 2 depths (0-5, 10-15 cm)
– June during early intrusion
– Sulfate reduction rates, Fe reduction potential, Methanogenesis potential
• Bench-scale manipulations – NO3
-, SO4-, NaCl at 3 levels (L, M, H)
– Exposed and Unexposed sediments
– Sulfate reduction rates, Fe reduction, Methanogenesis potential
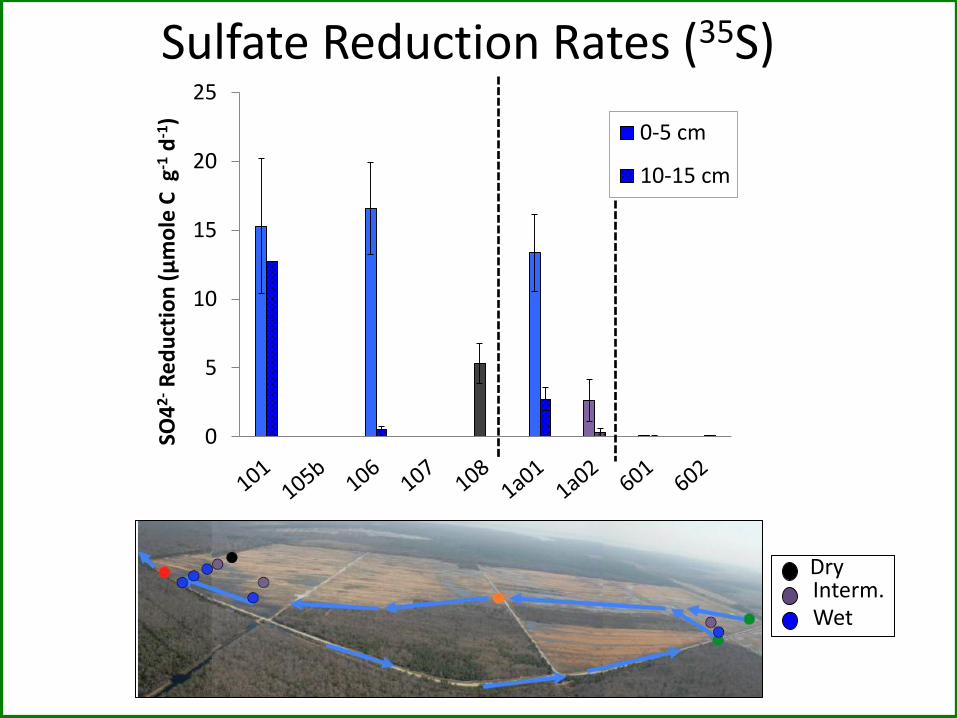
0
5
10
15
20
25
SO4
2- R
ed
uct
ion
(μ
mo
le C
g-1
d-1
)
0-5 cm
10-15 cm
Dry Interm. Wet
Sulfate Reduction Rates (35S)
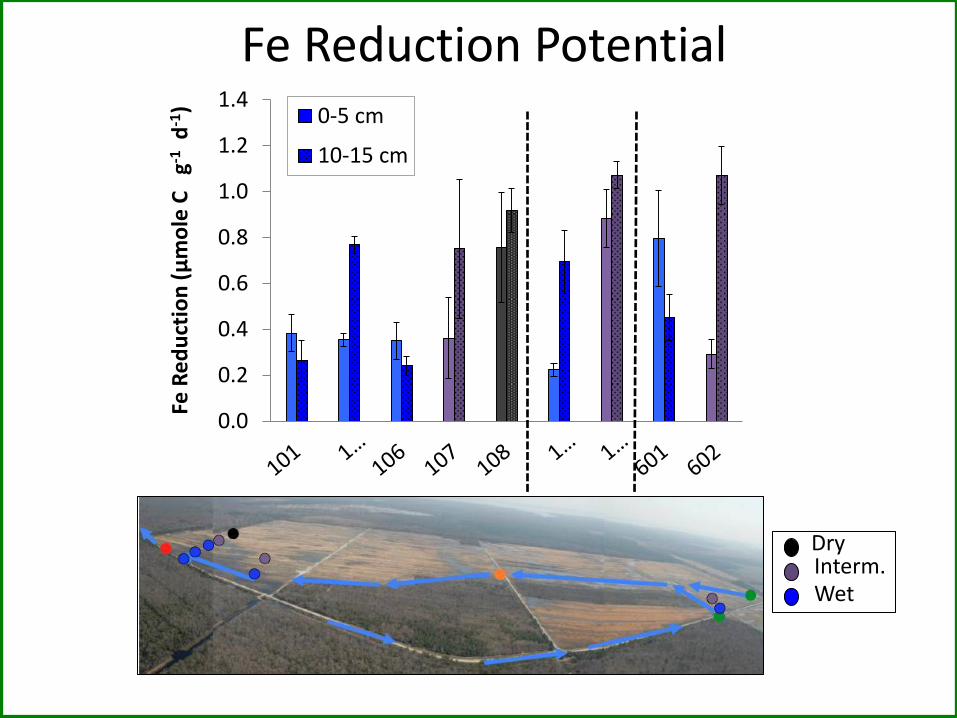
Dry Interm. Wet
Fe Reduction Potential
0.0
0.2
0.4
0.6
0.8
1.0
1.2
1.4
Fe R
ed
uct
ion
(μ
mo
le C
g-1
d-1
) 0-5 cm
10-15 cm
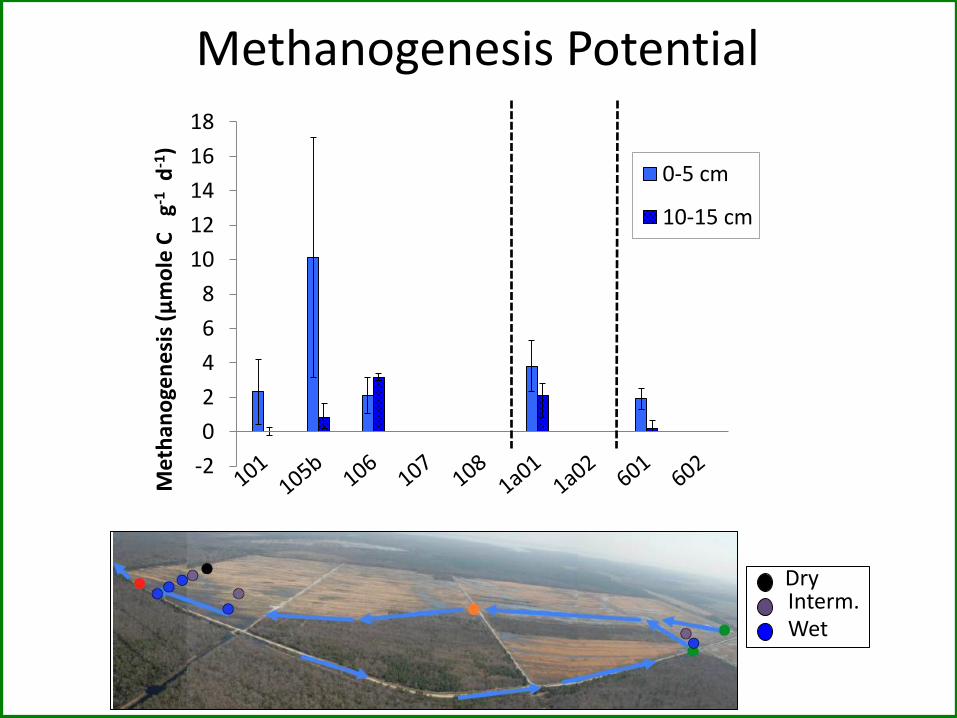
-2
0
2
4
6
8
10
12
14
16
18
Met
han
oge
ne
sis
(μm
ole
C
g-1 d
-1)
0-5 cm
10-15 cm
Dry Interm. Wet
Methanogenesis Potential
Related Documents