How do financial contracts evolve for new ventures. Tim Jenkinson Saïd Business School, University of Oxford and CEPR * Christian Rauch American University of Sharjah Danying Fu Saïd Business School, University of Oxford Abstract While previous papers have characterized various features of the financial contracts between entrepreneurs and venture capitalists, little is known about how the equity contracts evolve over the life of new ventures. Using the novel data set containing financial contract terms applying to different classes of stock, this paper is the first to focus on exploring the how the equity contract terms granted by the same investee private firms may vary across time, and determining the possible influencing factors. We find that there exists a default contract, for the terms adopt by different companies or used by the same companies in different funding rounds are surprisingly similar. Further, we notice, by analyzing the evolution patterns, that equity contracts change asymmetrically across different terms and at different stages of the investee firms. We also provide insights into the discussion on whether employing post-money valuation will definitely result in the over-valuation of start-ups. Our preliminary regression results show that the headroom, the new measure we developed as a proxy for the company’s financial flexibility, be negatively related to the dilution of common stockholders’ ownership of the company. December 2019 Keywords: New ventures, convertible preferred stock, financial contract terms JEL classification: G23, G24, G32 * Email address of corresponding author: [email protected] Acknowledgement: this work is partly funded by Kenan Institute’s Frontiers of Entrepreneurship Research Grant We thank Junida Mulla for providing excellent research assistance.

Welcome message from author
This document is posted to help you gain knowledge. Please leave a comment to let me know what you think about it! Share it to your friends and learn new things together.
Transcript

How do financial contracts evolve for new ventures.
Tim Jenkinson
Saïd Business School, University of Oxford and CEPR*
Christian Rauch
American University of Sharjah
Danying Fu
Saïd Business School, University of Oxford
Abstract
While previous papers have characterized various features of the financial contracts
between entrepreneurs and venture capitalists, little is known about how the equity
contracts evolve over the life of new ventures. Using the novel data set containing
financial contract terms applying to different classes of stock, this paper is the first to
focus on exploring the how the equity contract terms granted by the same investee
private firms may vary across time, and determining the possible influencing factors.
We find that there exists a default contract, for the terms adopt by different companies
or used by the same companies in different funding rounds are surprisingly similar.
Further, we notice, by analyzing the evolution patterns, that equity contracts change
asymmetrically across different terms and at different stages of the investee firms. We
also provide insights into the discussion on whether employing post-money valuation
will definitely result in the over-valuation of start-ups. Our preliminary regression
results show that the headroom, the new measure we developed as a proxy for the
company’s financial flexibility, be negatively related to the dilution of common
stockholders’ ownership of the company.
December 2019
Keywords: New ventures, convertible preferred stock, financial contract terms
JEL classification: G23, G24, G32
* Email address of corresponding author: [email protected]
Acknowledgement: this work is partly funded by Kenan Institute’s Frontiers of Entrepreneurship Research Grant
We thank Junida Mulla for providing excellent research assistance.

1
1. Introduction
New ventures typically obtain their businesses’ developing and expanding capital from private
sources, such as friends, families & fools (‘FFF’), angel investors, venture capitalists, private equity
funds etc. Although academic research on financial contracting has discussed, from theoretical
perspective, a lot about a firm’s optimal debt-equity ratio and security design, the empirical
discussion of financial contacts is a more recent phenomena. Papers by Kaplan and Stromberg
(2002), Bengtssony and Bernhardtz (2012), Bengtsson and Sensoy (2013) and Ewens et al. (2019)
have provided valuable empirical view on financial contracts adopted in VC deals, focussing on
deals made until 2010. However, the tracking of financial contract’s evolution over the life of the
investee new ventures remain unexplored. In this paper we provide, for the first time, empirical
evidence on how equity contracts evolve for a board range of new ventures based in the U.S., over
20 years from 1999 to 2018, and to explore the possible factors that might influence the observed
patterns, taking advantage of a new, extensive, company-level dataset of financial contract terms
derived from legal documents. We also innovately develop the ‘three-direction analysis strategy’
to fully reveal the change of contract terms.
The most important document we draw on to extract contract terms granted to different
series of stock is the Certificate of Incorporation (CoI), which is filed by the companies registered
in the U.S. at each of their funding rounds. To reduce the potential selection bias which is evident
in some recent research that focuses implicitly on companies that have successfully raised multiple
rounds of financing and are heading towards very successful exits, we sample both successful and
unsuccessful companies. Our initial sample covers 77 companies whose first equity rounds were
launched between 1st January 2010 to 31st December 2018. This sample covers a wide range of
startup and growth companies. Among the most notable companies are Uber, Airbnb, WeWork,
Pinterest or SpaceX. However, the data set also includes more obscure, smaller and younger
companies such as biotech firm Visualase Inc, payments infrastructure company CardSpring,
online video platform KnowledgeVision Systems, organic baby product retailer The Honest Co.,
VR developer Magic Leap, or business intelligence software provider Looker Data Sciences.
Our access to the scanned copies of these COIs and data analysis strategy enable us to do a
systematic analysis of the evolution of contract terms. since we collect the terms offered by
different companies for the same series, we are also able to analyze the cross-sectional variation in
2
contracts across different start-ups. For example, whether there is a “default” contract which most
start-ups adopt in their first equity funding round? And across rounds, how terms offered to
different series deviate from the default contract?
And, for every private company, its CoIs record how the financing terms applying to all the
classes of stock that have been issued vary over multiple funding rounds. So, for a specific
company, we are able to analyze its financial contracts evolution from three directions. First, we
examine, by comparing terms offered to series A at Round A to that given to series B at Round B,
whether more investor friendly terms are needed to be offered to attract new investors. We refer to
this as the ‘Diagonal’ analysis. Second, we look back to the CoI issued at the time of the initial
series A funding (‘Round A’) to see whether the terms were subsequently changed, i.e.,
renegotiated when the next funding round occurred. We refer to this as the ‘Vertical’ analysis.
Third, we study, by comparing terms given to various investors at each round. For example, we
analyse common stock, series A and series B at Round B. We refer to this as the ‘Horizontal’
analysis. How rights are distributed among investors, has important implications for the recent
discussion about whether the use of post-money valuation will lead to headline valuations of early-
stage businesses being significantly over-stated.
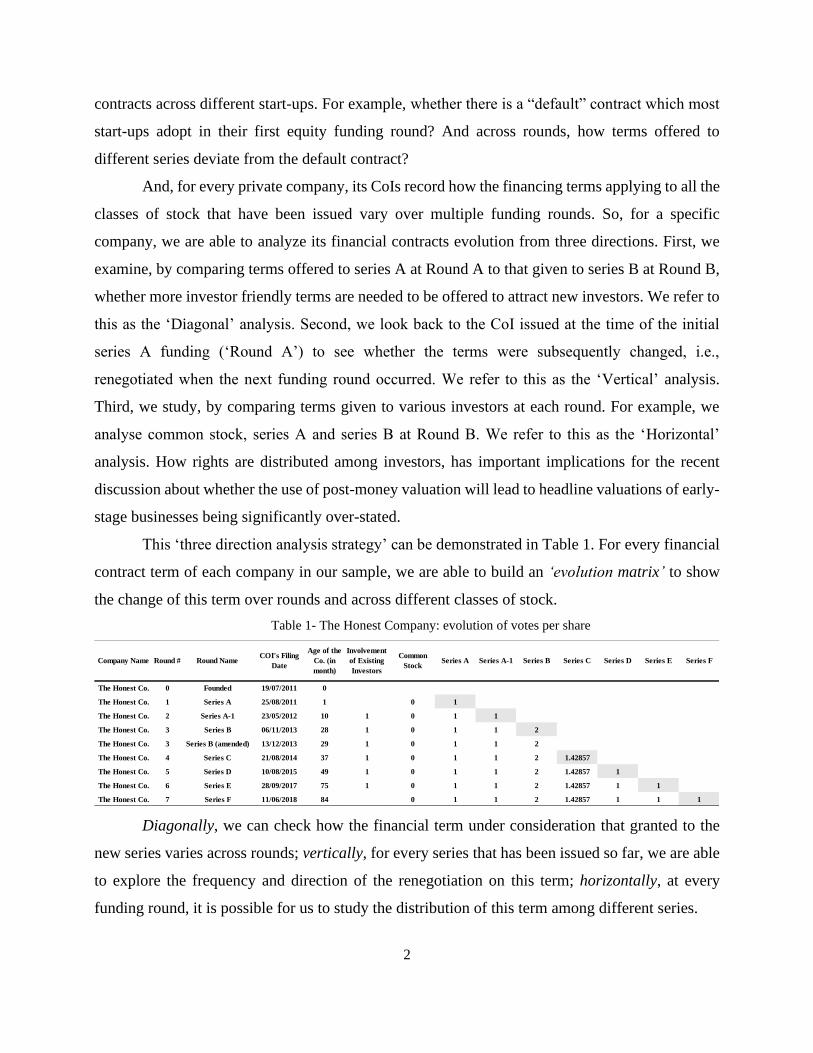
This ‘three direction analysis strategy’ can be demonstrated in Table 1. For every financial
contract term of each company in our sample, we are able to build an ‘evolution matrix’ to show
the change of this term over rounds and across different classes of stock.
Table 1- The Honest Company: evolution of votes per share
Diagonally, we can check how the financial term under consideration that granted to the
new series varies across rounds; vertically, for every series that has been issued so far, we are able
to explore the frequency and direction of the renegotiation on this term; horizontally, at every
funding round, it is possible for us to study the distribution of this term among different series.
Company Name Round # Round NameCOI's Filing
Date
Age of the
Co. (in
month)
Involvement
of Existing
Investors
Common
StockSeries A Series A-1 Series B Series C Series D Series E Series F
The Honest Co. 0 Founded 19/07/2011 0
The Honest Co. 1 Series A 25/08/2011 1 0 1
The Honest Co. 2 Series A-1 23/05/2012 10 1 0 1 1
The Honest Co. 3 Series B 06/11/2013 28 1 0 1 1 2
The Honest Co. 3 Series B (amended) 13/12/2013 29 1 0 1 1 2
The Honest Co. 4 Series C 21/08/2014 37 1 0 1 1 2 1.42857
The Honest Co. 5 Series D 10/08/2015 49 1 0 1 1 2 1.42857 1
The Honest Co. 6 Series E 28/09/2017 75 1 0 1 1 2 1.42857 1 1
The Honest Co. 7 Series F 11/06/2018 84 0 1 1 2 1.42857 1 1 1
3
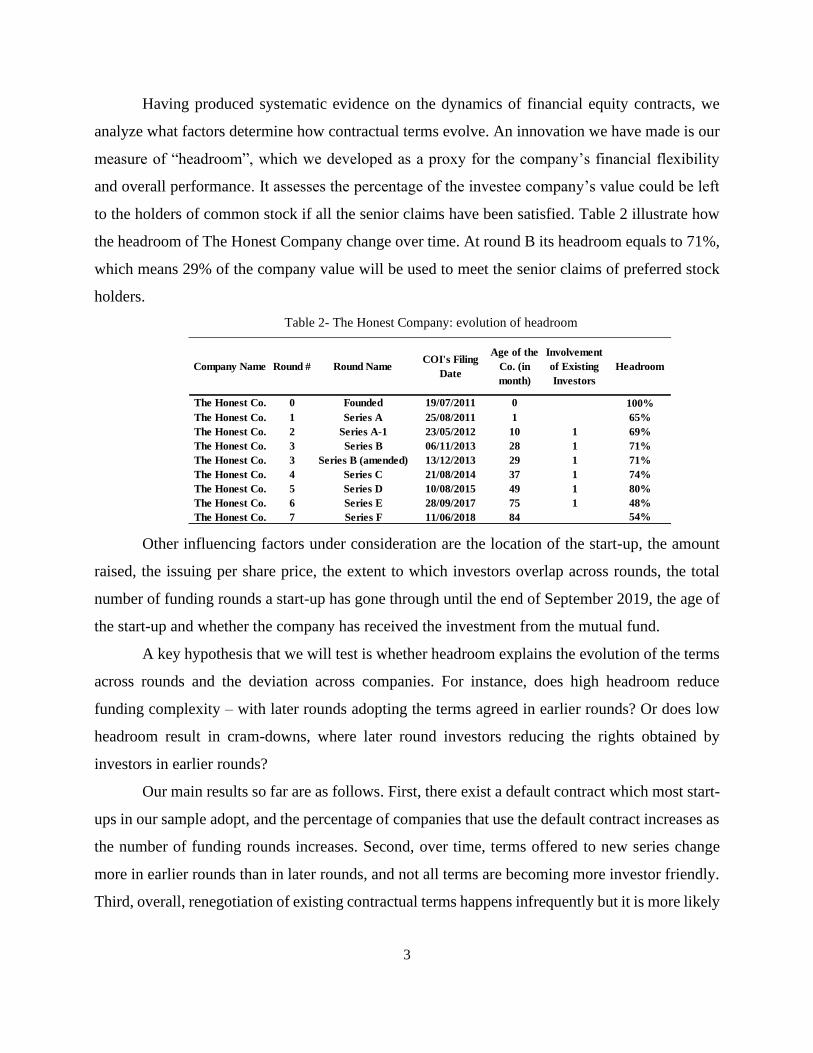
Having produced systematic evidence on the dynamics of financial equity contracts, we
analyze what factors determine how contractual terms evolve. An innovation we have made is our
measure of “headroom”, which we developed as a proxy for the company’s financial flexibility
and overall performance. It assesses the percentage of the investee company’s value could be left
to the holders of common stock if all the senior claims have been satisfied. Table 2 illustrate how
the headroom of The Honest Company change over time. At round B its headroom equals to 71%,
which means 29% of the company value will be used to meet the senior claims of preferred stock
holders.
Table 2- The Honest Company: evolution of headroom
Other influencing factors under consideration are the location of the start-up, the amount
raised, the issuing per share price, the extent to which investors overlap across rounds, the total
number of funding rounds a start-up has gone through until the end of September 2019, the age of
the start-up and whether the company has received the investment from the mutual fund.
A key hypothesis that we will test is whether headroom explains the evolution of the terms
across rounds and the deviation across companies. For instance, does high headroom reduce
funding complexity – with later rounds adopting the terms agreed in earlier rounds? Or does low
headroom result in cram-downs, where later round investors reducing the rights obtained by
investors in earlier rounds?
Our main results so far are as follows. First, there exist a default contract which most start-
ups in our sample adopt, and the percentage of companies that use the default contract increases as
the number of funding rounds increases. Second, over time, terms offered to new series change
more in earlier rounds than in later rounds, and not all terms are becoming more investor friendly.
Third, overall, renegotiation of existing contractual terms happens infrequently but it is more likely
Company Name Round # Round NameCOI's Filing
Date
Age of the
Co. (in
month)
Involvement
of Existing
Investors
Headroom
The Honest Co. 0 Founded 19/07/2011 0 100%
The Honest Co. 1 Series A 25/08/2011 1 65%
The Honest Co. 2 Series A-1 23/05/2012 10 1 69%
The Honest Co. 3 Series B 06/11/2013 28 1 71%
The Honest Co. 3 Series B (amended) 13/12/2013 29 1 71%
The Honest Co. 4 Series C 21/08/2014 37 1 74%
The Honest Co. 5 Series D 10/08/2015 49 1 80%
The Honest Co. 6 Series E 28/09/2017 75 1 48%
The Honest Co. 7 Series F 11/06/2018 84 54%

4
to happen for earily issued series, and on the contrary to cash flow rights, control rights are more
likely to be renegotiated more investor friendly. Fourth, the latest series does not necessarily have
the best terms, at least not in every right. Last, our preliminary regression results suggest that the
portion of the investee companies granted to both holders of common stock and holders of the latest
series are negatively related to round number. While higher headroom results in higher ownership
of common stock holders, it’s negative relationship with that of the latest series’ holders is not
significant. But there is inertia in ownership of the latest series, but not in that of common stock.
The remainder of the paper proceeds as follows. In the next section we introduce briefly
the framework that underlies private companies’ funding raising and explain how our paper is
related to and contributes to the existing literature. In section 3, we explain our data and the initial
sample. In section 4 we provide a descriptive analysis of the data, in particular how the financial
terms evolve over the funding rounds of the start-ups. In section 5 we use an econometric analysis
to explore the possible factors that influence the evolution of contractual terms. Section 6
concludes.
2. Background
With the fast growth of private capital for new ventures, both in terms of volume and the
number of capital providers, and the greater availability of private investment data, the range of the
research, both theoretic and empirical, on financial contracts of private companies between insiders
and outsiders has been greatly expanded. First, the context under which a contract is considered
has been extended from being static to dynamic1, where the optimal financial contract design is
considered in an evolving manner; Second, the discussions on incentive conflicts or asymmetry
information problems has been broadened from agency problems between the entrepreneur and the
finacer, to frictions among different investors2; Third, the issue of financial contract design has
been deepened from analyzing the best debt-equity ratio to studying the best combination of control
rights and cash flow rights3; Fourth, empirical evidence of the theoretic claim that financial contract
1 See, e.g. Bergemann and Hege (1998), Bengtssony and Bernhardtz (2012), Bienz and Hirsch (2012), Bengtsson and
Sensoy (2013), Chemmanur and Chen (2014) and Hellmann and Thiele (2019)
2 See, e.g. Chemmanur and Chen (2014) and Hellmann and Thiele (2015),
3 See, e.g. Kaplan and Stromberg (2002) and Cestone (2014)

5
terms have impact on value creation of the investee companies has been obtained for financial
terms offered in the first VC funding round4. This paper, contribute to these development trends of
financial contracting research by providing, for the first time, empirical evidence for equity
contractual evolution patterns by examing terms offered in different financing rounds for the same
company, with both cashflow rights and control rights analyzed, and the study is not restricted to
a certain type of investors. Apart from exploring the evolving relationship between entrepreneur,
existing investors and new investors, it also checks the dynamic interaction between financial
contract terms and the performance of the investee private equity. In this section, we first describe
the contracting structure new ventures adopt in practice nowadays before discussing how this paper
fit in the current literature.
A. Background on Contracting Structures of New Ventures
It is common for new ventures, who face a long path to profitability or have high capital
requirement, to raise equity capital across multiple funding rounds. This arrangement of raising
capital is referred to as “Stage Financing” (Da Rin and Hellmann (2019)). The investors may differ
across funding rounds. A venture usually starts with a Seed Round which individual angel investors
are most likely to be attracted to, while VC funds often focus on investing in later funding rounds.
In most cases, equity securities with different terms are issued in different funding rounds.
Start-ups normally issue two equity securities: common stock and preferred stock. Common stock
has the residual claim on the company’s assets but with little downside protection, while preferred
stock has some downside protection or preferential claim on the assets of the company in
liquidation (which includes sale to another company). There are different types of preferred stock:
(1) pure preferred stock - the type of preferred stock that has senior cash flow rights over common
stock but is given worse terms in other rights, for example, a junior preferred stock may have no
voting rights or can’t convert into common stock; (2) convertible preferred stock - the type of
preferred stock that, apart from enjoying senior cash flow rights over common stock, also has at
least the same, if not better, terms in other rights; (3) participating convertible preferred stock - the
4 See Ewens et al. (2019)

6
type of convertible preferred stock that receives a liquidation preference and a pro-rata share of
any remaining value.
Convertible preferred stock is the most commonly used preferred stock by start-ups. In this
paper, we examine the evolution of contract terms given to all types of preferred stock issued by
companies in our sample from their funding dates to the earlier one of 30th September 2019 and
dates when they exit 5.
It is conventional that preferred stock is named with capital letter which increases
alphabetically based on the issuing time. For example, preferred stock issued in the first funding
round is called Series A and that issued in the second funding round is referred to as Series B. Some
companies may also add a number after the capital letter when naming their preferred stock. Those
labelled with the same capital letter indicate that they were issued subsequently and the class that
with smallest number was issued before these with bigger number. For example, Series D-2 was
issued right after Series D-1.
Different classes of preferred stock issued by the same start-up usually have different
contract terms. Contract terms for a funding round set out the rights and obligation of both parties,
i.e., investors and the entrepreneurs. They are prepared by the potential investor in the form of a
“Term Sheet”, shaped by negotiation of the involving parties’, finalized and signed by both parties
in legally binding documents such as Subscription Agreement and Shareholders’ Rights
Agreement, and recorded in legal filings like CoIs. The evolution of contract terms across rounds
is mainly driven by the interaction of the evolving bargaining power of the issuer, the existing
investors (if any) and the potential investors.
In general, common stock is held by founders and employees while preferred stock is sold
to investors6.
5 Note that in some cases, different classes of common stock are also issued. These ‘newly issued’ types of common
stock differ from the common stock initially issue in control rights and are normally not convertible from preferred
stock. However, these different types of common stock are required to be converted into the normal common stock
either at exit or at some points before the exit as described in CoIs. For our purposes, we only consider the terms
offered to common stock that issued in the very beginning and that preferred stock is convertible to.
6 But we also notice cases where investors have common stock of the investee company in their portfolio.

7
B. Literature Review
This paper relates to few areas of the academic literature.
The first, the theoretic and empirical literature focus on financial contracting. With the help
of our novel data set, which consists of all the key terms extracted from all the financial contracts
signed by the investee new ventures over a time period of 20 years, this paper tests predications of
the related theoretic papers in a dynamic context. First, we examine the independent allocations of
cash flow rights and of control rights, as proposed in the famous paper Aghion and Bolton (1992).
However, deffering from the seminal Kaplan and Stromberg (2003) who provides the empirical
evidence of Aghion and Bolton (1992), we have complete observations of all equity financing
rounds for every firm and this facilitates our checking of the evolving trade-off relationship
between cash flow rights and control rights over time and how it is dynamically impacted by the
performance. Second, using the headroom as the proxy of the investee company’s ability to
payback investors’ investment and the evolution data of terms applying to every class of stock, this
paper tests the validity of two important assumptions underlying many theoretic papers that when
payment is guaranteed, the investor does not care about control rights, and that, as summarized
explicitly Hart (2001), when the investor is in charge, the impediment to renegotiation is high since
the entrepreneur does not have the money to bribe the investor. Third, this paper examines the
empirical prediction made on the dynamic evolution of venture capital contracts by Chemmanur
and Chen (2014) that in the earlier financing rounds, more downside protections are given to the
venture capitalist while in later rounds, more upside components. Fourth, by collecting the financial
terms of funding rounds from 1999 to 2018, this paper inspects the negative relationship between
VC market changes and valuation and exit time of the investee firms as predicated by Hellmann
and Thiele (2015).
This paper is also related to the empirical literature on venture capital contracting. The main
contributions that this paper makes to this strand of literature is that: (1) we have completed
observations of financial terms over all funding rounds of the same private companies; (2) we
consider all the key cash flow rights and control rights; (3) we derived the terms from legal
documents; (4) we analyse the evolution of financial contracts over 20 years from the beginning of
1999 to the end of September 2019 (the ‘time period’); and (5) we don’t limit the research to
venture capital funded rounds but consider all the equity funding rounds a company has gone
8
through during the time period. The best-known paper in this field is Kaplan and Stromberg (2003),
who analyzed 213 VC investments in 119 early-stage business by 14 VC firms. Most of these
funding rounds were completed before the dot-com bubble burst in 2000. They relied upon VC
firms voluntarily releasing the details of their funding rounds, as at the time it was not possible to
obtain systematic evidence on the terms of the financing. Their paper includes a wealth of
information about the terms of the financings, but the focus is not on how the financing terms
evolve over the life of the start-up business which is our focus. The more recent Bengtsson and
Sensoy (2013) looks at the regenotiation issue of venture capital contracts also extract terms from
legal documents, but they only look at the cash flow rights and similar to Kaplan and Stromberg
(2003), they collect the evolution data from the perspective of venture capitalist instead of
assembling the completed observations of the investee companies. And this is also true to
Bengtssony and Bernhardtz (2012), who examine the inertia venture capitalists have when deal
with financial contracting, using similar data sources.
Another closely related paper is Ewens, Gorbenko and Korteweg (2019) that focuses on
how VC contract terms can influence startup outcomes. However, their study is limited to the terms
offered in the first funding round without analyzing how financial terms evolve over funding
rounds, and they only focus on the VC-funded rounds.
The second related literature looks at the valuation of start-up businesses. A recent paper
by Gornall and Strebulaev (2018) considers whether the use of post-money valuation will lead to
headline valuations of early-stage businesses being significantly over-stated. They focus on the
initial funding rounds of early-stage ventures and calculate, from an ex ante perspective, how the
value of preferred and common stock differs, and use this approach to then estimate the extent to
which headline valuations of successful ventures –$1bn+ “unicorns” – are over-stated. However,
while they look in detail at the contract terms offered in the first “series A” financing, they do not
track how the terms, and the value of those terms, varies over time. They conclusion that the use
of post-money valuation can lead to a serious over-statement of start-ups’ value.
However, the conclusion that all unicorns are overvalued may be subject to doubt if we
bring the time dimension into the picture. In very successful ventures, i.e. when headroom is high,
the terms received by later stage investors may be largely irrelevant, as the probability that the
preferred stock will be converted (voluntarily by the investor) into common stock increases,

9
irrespective of whether the ultimate exit is an acquisition or IPO. There may be some specific terms
– such as IPO ratchets – that drive a wedge between the value of the preferred and the common
stock, but these are only present in a small minority of cases. Our findings suggest that, in the case
of very successful ventures, the economic value derived from late funding rounds may be very
close to their headline post-money valuation. Therefore, for late-stage businesses that raise money
at increasing valuations over multiple funding rounds – and maintain significant headroom by not
granting, for example, multiple liquidation preferences – their valuation may well be very close to
their headline post-money valuation. So, unicorn may actually exist!
Other recent papers have also been investigating financing rounds of mature early-stage
businesses, in the context of mutual fund investments in such firms (for example, Chernenko,
Lerner and Zeng (2018), Agarwal, Barber, Cheng, Hameed and Yasuda (2018), and Kwon, Lowry
and Qian (2019)). Although they are not our focus, we also include companies that obtain mutual
fund investments in our sample, and check whether the inclusion of mutual fund investment would
influence the evolvement of terms offered to preferred stockholders. Such cases provide an
interesting perspective as the mutual funds are required to produce a fair value of their holding
which can be compared with the valuation implicit in the latest funding round.
Finally, this paper is related to the recent body of empirical literature on dynamic debt
contracting, such as Roberts (2015), Roberts and Sufi (2009) or Gârleanu and Zwiebel (2009) who
analyze the contractual features and changes in debt contracts upon renegotiations or the
involvement of new contracting parties. Even though these papers offer broad evidence on dynamic
debt contracting, little evidence is known on the changes in equity contracts over time.

10
3. Data
In this paper, we build an extensive data set of financial terms applying to common and
preferred stock. The data set is derived from Certificates of Incorporation (CoI)7 which are legal
documents filed by U.S. registered companies at each funding round. We obtained scanned copies
of CoIs from Lagniappe Labs8, who, by the end of September 2019, had collected CoIs for over
6,700 U.S. start-up companies.
CoIs are revised for each funding round, and provide a description of rights applicable to
all the classes of stock that have been issued at the time when the CoI is filed. For example, the
CoI issued at series B funding will describe , subsequent to the filing of this CoI, the terms applying
to the series A and series B investors. Therefore, our data set, which extracts terms of each class of
stock from CoIs issued for each funding round, allows us to see: first, for a specific stock, whether
the terms were subsequently changed when the next funding round occurred; second, at a specific
time being, how rights are distributed among all classes of stock; and third, at a certain new funding
round, whether more investor friendly terms are needed to attract investors to invest in the new
issued stock.
To make sure that we find the correct CoI for every funding round so that our data set is as
accurate as possible ,we also make use of other databases such as Crunchbase and Preqin for
companies’ funding rounds’ information like round date, capital raised, and investors involved.
Our initial data set comprises financial terms extracted from 451 CoIs filed by 77 U.S. based private
companies. And we are in the progress of expanding the data set to cover 300 U.S. ventures which
cover over 2,000 CoIs. with the year of the investment round traced all the way back to 1999 and
up to Sept 2019. It will be the first and the largest data set so far that records for over 20 years, the
key cash flow and control terms for all the equity funding rounds launched by U.S based private
companies across the lives of these investee companies, using reliable legal documents. A number
of important previous papers that looked at financial contracting between the entrepreneur and
7In some states, this legal document may have slightly different names. For example, in the state of California, it is
called the Article of Incorporation. For consistency and easy reference, we use Certificate of Incorporate to represent
this document.
8Lagniappe Labs collects a large volumes of private company information from original source documents from the
Secretary of State offices. www.lanyaplabs.com.
11
venture capitalists in a specific round, but they either use data from the self-discloure contacts from
venture capitalists, as Kaplan and Stromberg (2003) or focus only on a specific funding round like
Ewens, Gorbenko and Korteweg (2019) who make use of the Certificate of Incorporation for
financial terms but restricted to 1,695 first financing rounds between 2002 and 2010, or collect the
data from the perspective of venture capitalist instead of from the investee companies and hence
miss the completed record of how financial terms evolve over the life of a new venture, examples
are Bienzl and Hirsch (2011), Bengtssony and Bernhardtz (2012) and Bengtsson and Sensoy
(2013).
A. Certificate of Incorporate (‘CoI’)
A CoI is the legal document that proves a company was duly formed in the U.S. A typical
CoI includes three categories of information: (1) the company’s legal name and its location; (2) the
number of shares of each class of stock the company is authorized to issue; and (3) the rights of
each authorized class of stock. As long as there is a change to information described in any of the
three category, an updated CoI called the Restated Certificate of Incorporation, is required by law
to be filed in the state where the company is registered. For example, if a U.S. registered company
wants to raise new capital either by issuing new class of stock or by issuing existing class of stock
to the extent that the total outstanding shares of this class of stock after the new issue would exceed
its current authorized number, this company must file a restated CoI. For consistency and easy
reference, we refer, in this paper, both the initial Certificate of Incorporation and the restated
Certificate of Incorporation ‘Certificate of Incorporation’.
The fact that the financial terms of each class of stock in our data set are extracted from
legal documents guarantees the reliability of the data set. Furthermore, compared to terms obtained
from contracts between VCs and their investee firms, our data set avoids the potential selection
bias caused by self disclosure contracts by venture capitalist.
The original filed CoIs are archived in the corresponsing state where a company is
registered. However, although their certified copies are public available, the access fee is very
high.9 Therefore, instead of requesting copies of the CoIs directly from each state, we obtained the
9 For example in Delware, where most U.S. start-ups are registered, as of September 2019, a certified copy of CoI costs
$50, plus $2 per page (see https://corp.delaware.gov/regguide/).

12
scanned copies of CoIs from Lagniappe Labs. For every company in our sample, we collect all the
scanned copies of its CoIs that are available in Lagniappe Labs as of the end of September 2019:
for the selected 77 companies, 451 CoIs are analyzed.
It worth noting that although Lagniappe Labs have a large archive of CoIs, for some rounds
of some companies, the corresponding CoIs are missing in the database. However, this will not
compromise completeness of our data set, since for the 283 funding rounds covered by our current
sample, 95% of them have at least one corresponding CoI. No other data set that we are aware of
combines a large number of funding rounds with such a high level of completeness over the life of
the private companies.
As a result, the reliability and completeness of our data set allows us to provide empirical
evidences for the evolution of private companies’ equity financial contracts with high accuracy.
However, the strength of our data set is balanced by the fact that some information are unavoidable
lost in the process of extracting terms from legal documents and quantifing these legal terms. Also,
there are inevitable sample selection issues as poor performance companies normally survive fewer
funding rounds and the possiblity that more popular companies are included in Lagniappe Labs.
We first explain the way we extract terms from CoIs, sepecifically, how we determine whether a
CoI is associated with a funding round and in a CoI which terms we extract, before describing our
sample and the potential selection issue.
B. Associate a CoI with a funding round
Since convertible preferred stock (‘Preferred Stock’) is the predominant security issued by
ventures in financing round (Kaplan and Stromberg (2002)), we focus in this paper on the evolution
of financial terms offered to holders of different series of preferred stock. We define a funding
round (‘round’) as the financing round where a new class of preferred stock is issued, and we
assume a round only issues one new class of preferred stock. By this definition of round, there must
be at least one corresponding CoI for each round. However, since for some companies Lagniappe
Labs does not archive scanned copies of all their filed CoIs. For the accuracy of our analysis, we
only study the evolution of financial terms of the rounds that have at least one scanned copy of the
associated CoIs available in Lagniappe Labs’ database.

13
In this paper, unless it mentioned clearly in the CoI or can be deducted with certainty by
the dates of CoI that several series are authorized together in the same CoI, in which case the CoI
is considered to associate with these several series. A CoI is deemed to be associated with a series
if it is the first, ranked by the filing date, that describes the terms applying to the new preferred
stock, and among all the securities that are mentioned in the CoI, this preferred stock is the one
issued in the most recent round at the time when the CoI was filed. An example to illustrate this is
if among all CoIs of Company Z, a CoI is the first one that mentions Series B, and among all classes
of preferred stock that described on this CoI, Series B is the one issued in the latest round, i.e., the
2nd funding round, then this CoI is considered to be associated with round series B. For a round,
there may be subsequent changes in the authorized number of shares or in the financial terms
offered to one or more classes of stock, in this case, an amended CoI is required, by the law, to be
filed. As a result, this round will have more than one CoIs. To trace the changing pattern of financial
terms as accurate as possible, we study all the CoIs associated with a round as long as we have
access to their scanned copies in Lagniappe Labs’ database.
We will detail in section 4 how we rank and name the funding rounds to facilitate the
comparison analysis across companies.
C. Information extracted from CoIs and quantification strategy
Details on the information we extract from a CoI and our quantification strategy are
provided in Table 3, it shows that we derive two parts of information from a CoI. The first one is
the general description of all classes of stock, such as the authorized number of such each class of
stock the company is entitled to issue and their prices per share while the second part of information
we collect is the key financial terms that applicable to each class of stock.
Table 3: Information extraction and quantification
Classes of Information Information collected from CoIs Quantification/Codification Strategy
Classes of shares Name of the class
Authorized number of each class of shares The number of shares
Original Per Share Price The price
Dividends Contractual dividend 1 for yes, 0 for no
Liquidation order 1, 2, 3 represents the 1st, 2nd, 3rd to receive the payment respectively
Liquidation multiplier The ratio of the liquidation amount per share over the original price
Access to remaining assests 1 for yes, 0 for no
Control Control of corporate actions (voting rights) votes number per share
Redemption 1 for yes, 0 for no
IPO Rachet 1 for yes, 0 for no
Anti-dilution protection 0 if no anti-dilution protection; 3 if full rachet; 2 if narrow weighted based; 1 if weighted based
Number and class of shares
Liquidation Preference
CoversionThe number of common stock per share of preferred stock can converts into if optional convertible;
0 if not optional convertibleOptional conversion-initial conversion price
Other Provisions

14
The financial terms described in a typical CoI can be divided into seven categories: (1)
Dividends; (2) Liquidation preference; (3) Voting rights; (4) Optional conversion right; (5)
Mandatory conversion; (6) Redemption rights; and (7) IPO rachet.
The key financial terms we are analyzing in this paper are (1) whether the payment of a
dividend is independent of the claim of holders/ directors or the performance of the investee
company (‘contractual dividend’); (2) the payment order in the case of liquidation (‘liquidation
preference order’); (3) the promised payment amount in the case of liquidation (‘liquidation
preference amount’); (4) whether holders are expected to receive the greater of the promised
liquidation amount and the amount they could receive should they have converted the preferred
stock they are holding into common stock when the liqidation events happen (‘Greater of Rule);
(5) whether a class of stock has claim to the remaining asset after paying all the liquidation
preference (‘liquidation participation’); (6) the votes number per share of a stock has (‘votes
number’); (7) whether a class of stock is redeemable at the option of holders (‘redemption’); (8)
adjustments made to conversion ratio should there is a dilution event (‘anti-dilution protection’);
(9) whether there is a promised IPO price or target price at IPO for a class of stock (‘IPO rachet’).
Since CoIs are complicated law documents and most of the terms are described in
contractual clauses, to facilitate empirical analysis, we will describe our quantification strategy the
section 4.
D. Sample of start-ups
As of the end of September 2019, There are 18,832 companies in the database of Lagniappe
Labs. To construct our sample of start-ups to analyze, we impose no restrictions to companies’
valuation, exit route, investment stage, industry or size. However, we limit ourselves to U.S.
companies for which there is at least one scanned CoI in Lagniappe Labs’ database. This criterion
leave us with 6,929 U.S. start-ups. We then compare, for each of the 6,929 companies, the number
of equity funding rounds with the number of CoI scanned copies available in the database. To only
choose these whose CoI scanned copies’ number is equal or greater than their equity funding
rounds to guarantee as much as possible that we have enough CoIs to analyse terms evolution
across rounds. 3,111 companies are left after applying this criterion. We then divide these 3,111
into 26 subgroups based on the year when their first funding round were launched starting from

15
1994 until 2019. We forgo the companies whose first equity round were launched in 1994 to 1998,
for the number of companies in these subgroups are less than ten. We also exclude companies
whose first equity round is in 2019, for there are too few observation for each of these companies.
We then randomly select companies the 20 subgroups to create our sample.
Table 4 displays the summary statistics of our current dataset. Panel A shows the status of
the companies in our sample. Nineteen of them were acquired or conducted an IPO with 5
companies entered bankruptcy and fifty seven remain private and one closed down as of September
2019. 89% of these companies were founded after the financial crisis and the average founding
year is 2012. Almost half of the ventures in our sample, i.e., 45%, are based in Silicon Valley. As
of September 2019, 30% of them had received mutual funds investment and the average number
of funding rounds is 3.68.
Table 4- Summary Statistics of Sample
Since we select our sample from the list of companies that have records in the database of
Lagniappe Labs, our sample maybe biased towards more popular start-ups which investors show
more interest in. Note, however, that we do not analyse the influence of financial terms on the
investee companies’ performance in this paper, and so potential selection bias towards more
popular companies or even more successful ones is less important.
All Companies Private IPO M&A
Number 77 57 5 14
Average Year Founded 2012 2013 2011 2011
Location
Sillicon Valley 45% 39% 40% 71%
Non-Sillicon Valley 55% 61% 60% 29%
Co. with Mutual Fund Investment 31% 26% 80% 29%
Average Round Number (Classes of Preferred Stock) 3.68 3.88 3.60 3.07
Panel B. Security Characteristics
Mean Median Minimum Maximum
Number of Preferred Series 3.68 3 1 10
Panel C. Round Characteristics
Series A Series B Series C Serues D Series E Series F
Nr. Companies 77 60 51 35 23 15
Nr. Companies with CoIs 65 56 50 34 22 14
Average Age by Round 1.14 1.96 2.72 3.44 4.10 4.19
2.33
0%
0%
1.00
Standard Deviation
100%
Panel A. Company Characteristics
Closed
1
2010

16
4. Univariate Analysis
This paper examines the evolution of key financial terms for each class of preferred stock
that have been issued by the end of September 2019 by these private companies in our sample. The
evolution patterns are explored in three directions: (1) diagonally, whether and how the key
financial terms offered to the new series varies over time; (2) vertically, wheter and how the key
financial terms offered to a specific series change across round; and (3) horizontally, whether and
how better off the latest series is compared to other classes of stock.
In the first part of this section, we describe our variables of interest and the assumptions
made in this paper. In the second part, we show the identified patterns (‘descriptive evidence’).
A. Methodology
Our data set is immense, consisting of information of four dimensions: company, stock,
funding round and financial terms, so in order to analyse evolution’s patterns, we need to build
some summary variables. And because it is impossible to codify every single contingencies stated
in a CoI, we make some reasonable assumptions to facilitate our analysis.
A.1. Variables of Interest
(a) Funding rounds
As briefly explained in the previous section, we define a funding round as the financing
round where a new class of preferred stock is issued, and we assume a round only issues one new
class of preferred stock.
If a round has multiple CoIs, we collect data from all of them. But we use the information
strategically: (1) to study the diagonal and horizontal evolutions , we only compare information of
collected from the each round’s first CoI; and (2) to study vertical evolution, we compare
information collected from all CoIs.
(b) Round number (‘i’) and stock number (‘j’)
Although there is a thumb of rule to name a preferred stock and the related funding round
(as shown section 2.2), in practice, companies name their preferred stock and rounds in different
ways, which means the names of the preferred stock sometime do not indicate the sequence of the
funding rounds where these preferred stock were issued. To facilitate our analysis of the evolution

17
of financial terms applying to preferred stock, we need to know, for each company in our sample,
the issuing sequence of its preferred stock, and, to make comparison of such evolution across
companies, we need to create a variable to record this sequence information consistently.
To obtain the sequence information, we first rank the round based on round date from the
earliest to the latest. The ranking strategy is (1) for those rounds with CoIs, we record the round
date as the filing date of its first corresponding CoI and then rank the round based on round date
from the earliest to the latest and assign round number 1,2, 3 … to the first, second, third,…(2) for
rounds without CoIs, we assume that rank of the round date is increasing Alphabetically and
numerically based on the name of the security issued in the round. For example, suppose we only
have CoI which features series A and series B for the first time. In this case, we assume that series
A was issued before series B, therefore round A comes before round B. Another example is series
D-1 and D-2, which may share the same CoI, but, by our definition of round, there are two rounds,
one is series D-1 round and the other one is series D-2 round, and round D-1 comes before round
D-2.
We then construct a variable called the round number which records the sequence of the
round date. This is to assign round number 1, 2, 3…, n to the first, second, third,…, nth round
respectively. To be consistent with industry practice, we then rename the preferred stock that issued
in round 1 series A, round 2 series B and so on. We use i to indicate the round number where i=1,
2, 3,…n, and use j to represent the Series sequence where j=A, B, C,…For example, Series A
means preferred stock that is issued in the first funding round. However, in practice, funding rounds
are usually called by the preferred stock that issued in that round, for example, round 1 and round
2 are often referred to as round series and round series B respectively. We will use these two ways
of naming funding rounds interchangeably in this paper. Note that we also define round 0 be the
funding round where common stock is issued, and j=0 to represent common stock.
(c) The financial term Ri,jk
For a specific company, Ri,jk is the k right that offered to series j at round i, where i is the
round number where i =0,1,....n, and j is the class of stock that was first issued in round j (‘series
j’), where j=0,1,2,....,m, however, note that j ≤ i, since series j will not be issued before round j.

18
In this paper, since we focus on examining the evolution of the nine key financial terms, k=
contractual dividend, liquidation order, liquidation multiplier, greater of rule, liquidation
participation, votes number, redemption, anti-dilution protection, and IPO rachet
(d) The seniority Si,jk
The seniority Si,jk is a variable we create to assess, in regard of a certain right k, how better
off holders of security j where j ≤ i, are compared to holders of other classes of stock. The value
of Si,jk is closely related to the value of Ri,j
k , which we will discuss in detail in section 4.1.2. The
value of Sijk is defined as below.
Si,jk = −Ri,j
k when k= liquidation order; and
Si,jk = Ri,j
k otherwise
The way to interpret seniority Si,jk is that, among all classes of preferred stock issued by the
same company, the higher a class of preferred stock’s seniority is regarding k, the more investor-
friendly k right this type of preferred stock has.
(e) The diagonal change of rights Di+1k , where i= 1, 2, 3, 4…, n
Di+1k = Si+1,i+1
k − Si,ik measures the change of seniority in right k that is offered to the latest
series at round i. Di+1k >0 means compared to that given to series(i-1) at the round (i-1), the k right
granted to series i at round i becomes more investor friendly; Di+1k =0 means the same k right is
offered; and Di+1k <0 means less investor friendly k right is offered.
(f) The vertical change of rights Vi,jk , where j ≤ i and where i, j=1, 2, 3, 4…, n
Vi,jk = Si,j
k − Si−1,jk measures the change of seniority in right k that offered to series j across
round. If ri,jk ≠ 0, a renegotiation regarding right k of series j is deemed to happen at round i; Vi,j
k >0
indicates more investor friendly k right is offered to j through renegotiation at round i; and Vi,jk <0
means less investor friendly k right is offered to j through renegotiation in round i.
(g) The change of rights horizontally Hik, where i= 1, 2, 3, 4…, n
Hik assesses if and how much more investor-friendly the latest series is, compared to
common stock and other series.
Hik =
𝑇ℎ𝑒 𝑛𝑢𝑚𝑏𝑒𝑟 𝑜𝑓 𝑠𝑒𝑟𝑖𝑒𝑠 𝑎𝑡 𝑟𝑜𝑢𝑛𝑑 𝑖 (𝑖𝑛𝑐𝑙𝑢𝑑𝑖𝑛𝑔 𝑐𝑜𝑚𝑚𝑜𝑛 𝑠𝑡𝑜𝑐𝑘) 𝑡ℎ𝑎𝑡 ℎ𝑎𝑠 𝑖𝑛𝑓𝑒𝑟𝑖𝑜𝑟 𝑘 𝑟𝑖𝑔ℎ𝑡 𝑡𝑜 𝑠𝑒𝑟𝑖𝑒𝑠 𝑖
𝑇ℎ𝑒 𝑛𝑢𝑚𝑏𝑒𝑟 𝑜𝑓 𝑐𝑙𝑎𝑠𝑠𝑒𝑠 𝑜𝑓 𝑠𝑒𝑟𝑖𝑒𝑠 (𝑖𝑛𝑐𝑙𝑢𝑑𝑖𝑛𝑔 𝑐𝑜𝑚𝑚𝑜𝑛 𝑠𝑡𝑜𝑐𝑘)−1∗ 100%

19
Hik =0% shows the latest series j isn’t granted with more preferential k rights than other
series; Hik =100% means regarding right k, series j is the most investor-friendly (it is better that
all the remaining classes of stock); and Hik ∈ (0%, 100%) displays that j has senior k right than
some series, but not all of them, and the larger Hik is, the more classes of series have inferior k
rights than that of series j.
(h) The headroom ℎ𝑒𝑎𝑑𝑟𝑜𝑜𝑚𝑖
The headroom of a company is the variable to assess the company’s financial flexibility
and overall performance. Headroom shows the value of the company that would be left over to
expand the business or return to shareholders, after paying off liquidation preference should a
liquidation event be triggered, paying the contractual dividends (if any), and paying off debt (if
any). The formula of headroom is
1−CLPi+CCDi+DTi
Vi
where CLPi=cumulative liquidation preference immediately after ith round;
CCDi= cumulative unpaid contractual dividends immediately after ith round;
DTi= cumulative debt immediately after ith round
Vi= valuation of the company immediately after ith round.
We then explain below how we get the value needed to calculate headroom.
i. Liquidation preference
When calculating headroom, apart from excluding the liquidation amount promised
to preferred stockholders, we also deduct from the company’s value the liquidation
preference of all the senior common stock that have seniority in liquidation payment than
normal common stock.
ii. Contractual dividends
Contractual dividends are assumed to be paid yearly. So, when calculating
headroom, we deduct the cumulative one-year contractual dividends payable immediately
after the ith round.
iii. Debt
We assume there is no debt in this version of draft.
iv. Valuation of the company immediately after the ith round

20
We calculate the company’s value immediate after the ith round by post-money
valuation formula of multiplying the number of outstanding shares of common stock
(including these issuable upon the conversion of the outstanding shares of preferred stock)
immediately after the ith round with the per share price of the series that issued in round i.
However, since accurate the number of outstanding shares of common stock is normally
unavailable and according to the rule ‘Reservation of shares’ mentioned in CoIs, which
requires the company to ‘reserve and keep available out of its authorized but unissued
capital for the purpose of effecting the conversion of preferred stock, such number of its
duly authorized shares of common stock as shall from time to time be sufficient to effect
the conversion of all outstanding preferred stock’, we calculate the approximate outstanding
shares of common stock ) immediately after the ith round by multiplying authorized number
of common stock mentioned in the COI corresponding to round i (′ACSi′) by a discount
factor Fi.
Fi represents the proportion of ACSi that has actually been issued and issuable upon
the conversion of then outstanding preferred stock. In our paper, for simplicity, we assume
Fi is a constant number across i and companies. i.e., Fi =80%. To check the validity of our
results, we will also do a robustness check by having Fi =50% and 100%.
(i) The ownership of the investee company (in the form of common stock)
We assess a specific type of stock’s holders’ ownership of the investee company by the
percentage of the total number of authorized common stock they own or deemed to own. The
denominator is the total number of authorized common stock and the numerator is (1) for the holder
of common stock, the authorized number of common stock after deducting the shares that are
reserved for the conversion of all the preferred stock, which is calculated by multiplying the total
authorized number of preferred stock by their conversion ratio; (2) for the holder of a specific
preferred stock, the authorized shares of common stock are reserved for the conversion of this type
of stock.
We realize that the authorized number of shares does not equal the actual number of shares
that has been issued. However, since we only examine the ratio, where both the denominator and
numerator are authorized numbers, if the ratios of the shares being actual issued over the shares
authorized to issue are similar among the common stock and each class of preferred stock, the

21
ownership calculated by us would be close to the real story. Further, authorized but unissued shares
represent potential obligations and rights, so it is also important to take them into consideration
when discussing the ownership distribution of the investee company.
When calculating the authorized shares of common stock that are reserved for the
conversion of a certain series, we make adjustment to the conversion ratio if this series is offered
with anti-dilution protection and this protection has been triggered.
A.2. Data extraction and codification
In this section, we summarize explain in detail our quantification strategy for information
extracted from CoIs.
Because CoIs only record the authorized number of shares of all classes of stock that have
been issued or are going to be issued at the time when the CoIs are filed, we can only make use of
the authorized number of shares instead of the number of shares that are really outstanding.
However, for our purposes, this will only potentially affect our assessment of the value of the
company and the variables whose calculation is based on the valuation of the company, since we
only examine evolution and distribution of financial rights from the per share perspective instead
of from the class perspective. As for the potential risk of overstatement of a company’s value and
related variables, we adopt a discount factor, as explained in detail in section A.1.(h), to minimize
this risk.
A.3. Assumptions
However, CoIs are complicated law documents and most of the contractual clauses
described in CoIs are contingent on certain circumstances. For example, the CoI of Social Finance,
Inc’s funding round where Series B was first issued, describes the liquidation amount per share of
Series A and Series B can receive are $0.80 and $8.791258 respectively plus “any declared or
accrued by unpaid dividends”. Therefore, to extract financial terms from CoIs and to simplify our
analysis, we need to make some assumptions.
(a) When calculating liquidation amount, we assume, at this stage of our research
i. All dividend claimed have been paid
ii. All accruing dividends accrued have been paid

22
(b) When calculating votes number, we assume that if the number of votes per common
stock is not clearly mentioned in CoIs, we assume each share of common stock has one vote.
(c) When calculating anti-dilution protection, IPO rachet or any other rights that have
requirements for the minimum outstanding of shares, we assume the number of outstanding shares
of the series under concern is greater than the required minimum number of shares outstanding
(d) When calculating the conversion price of series after anti-dilution protection
adjustments we only consider the anti-dilution protection that are triggered by additional shares of
qualified common stock issuable as a result of the issuance of a new class of preferred convertible
stock i.e. we don't consider the additional common stock issuable because of the increase issuance
of the type of convertible stock that had been issued in previous rounds. So, even if the authorized
number of previous issued class increases and its conversion price is lower than the conversion
prices of the classes we are considering, we don’t do anti-dilution adjustments to the conversion
prices of the classes of series under consideration.
(e) When collecting redemption term, we assume that if the redemption right is not
mentioned clearly in CoIs, we assume the securities are not redeemable at the option of holders.
B. Descriptive Evidence
In this section, we present how the financial terms we observed in our current sample evolve across
funding rounds. We first show how similar the financial contract terms offered by different
companies are, and that this similarity increases across rounds. We then describe, in our novel three
directions, the asymmetric evolution patterns of the key financial terms under consideration.
Finally, we describe how the common stock holders’ ownership of the investee company and the
ownership owned by the latest series holders evolve over time.
B.1. The existence of a default contract
In this subsection, we compare, across the start-ups in our sample, the contract terms given
to their latest series. We find that, companies offer similar financial contract terms to their latest
series i.e., most of these ventures cluster around the modes of the financial terms. As Table 5
shows, for each financial term displayed in the table, there exists a default which most companies

23
adopt, and these values are consistent over rounds. The key terms of the default contract observed
are summarized in Table 5.
Table 5- The default contract
This finding is consistent with the analysis of Da Rin and Hellmann (2019), who note that
Term Sheets, which act as the basis of the final legal binding contract, “tend to be drafted by
experienced lawyers who develop standard templates, and only adjust a limited number of clauses
to the specific conditions of each deal”.
The practice of adopting a ‘default contract’ is also consistent with the fact that these
contracts are incomplete because of the difficulties to foresee what could happen in the future (Hart
(1995)). Since the investee’s operation and therefore the portability of the investment is hard to
predict, especially for investments in early rounds, it is safer for the potential investors who prepare
the preliminary contracts for the start-up to consider, use the set of terms, which based on their
experience or based on their lawyers’ experience, would work. From the perspective of
entrepreneurs, in general they have limited bargaining power at the early financing rounds, so if all
the potential investors come with similar terms, they have no choice but to say yes. Not to mention
that many entrepreneurs at normally over positive about their projects at the early stage of ventures,
and some of them are green hands in capital raising, which all make them to accept the terms the
‘professional’ investors offered.
But why this stickiness to default contract persist and even increase for some terms over
time? One possible explanation is ‘Stage Financing’. For a majority of ventures, capital raising is
not once and for all, but is stepwise, which means start-ups get the necessary funding to develop
their businesses through multiple financing rounds. Before every funding rounds, rights and
obligations for both parties of the proposed new series are negotiated, and most importantly, price
Contract terms Default values Interpretations
A. Cash Flow Rights
Contractual Dividend 0 dividend offered is not contractual
Liquidation Order 1 get paid first if liquidation events happen
Liquidation Multiplier 1 get paid of the original issuing price in liquidation
Liquidation Participation 0 no claim to the remaining assets
B. Control Rights
Votes per share 1 one vote per share
C. Other Protective Provisions
Redemption 0 not redeemable at the option of holders
Anti Dilution Protection 1 the protection is broad-based weighted
IPO Rachet 0 no IPO rachet protection

24
of the series is also part of the negotiation. As a result, price of the series can be a tool to balance
the rights and obligation of entrepreneur, existing investors and potential investors, which means
changes of investment risk or profitability can be reflected by change in price instead of by variance
in financial terms.
However, some terms are more ‘default’ among companies, in other words, more
companies are gathering at the modes of these terms, than other terms. And some terms are more
‘sticky’ across rounds than others, namely the percentage of companies crowded at the mode is
more stable for some terms. For example, table 6 indicates that liquidation order is both more
default and more sticky than in every funding round, all companies assign their new series the
highest seniority in the liquidation payment order, while the ratio of companies that would give
redemption right to the new series varies across rounds and in half of series, it is lower than 90%.
For these terms that are not so ‘default’, or the default value is ‘no such right’, we define
them as the “Optional Rights”, and we suspect that their value maybe more contingent on the
performance of the investee. We will check this hypothesis in our future regression analysis.
Meanwhile, we categorize the remaining rights under concern as “compulsory rights”. Table 7
describes the proportion of companies that have ever given these optional rights in at least one of
funding round (the percentage of companies whose values of the optional rights equal to non-zero
in at least one round), and if these rights are given when they are given. An interesting pattern that
worth notice is that contractual dividend is seldomly given, but if it is ever granted, it would be
granted at the very beginning of a company’s financing history.
Table 6- % of companies that adopt the default terms
Nr. Companies
Nr. Companies with CoIs
Cash Flow Rights
Contractual Dividend
Liquidation Order
Liquidation Multiplier
Liquidation Participation
Control Rights
Votes per share
Other Protective Provisions
Redemption
Anti Dilution Protection
IPO Rachet
100%
100%
100%
100%
100%
80%
100%
80%
Serise A Serise B Serise C Serise D Serise E Serise F Serise G
77 60 51 35 23 15 11 5
5
Serise H
97% 100%
65 56 50 34 22 14 11
100% 100%97% 95% 96%
93% 100%
100% 98% 98% 100% 95% 100% 100%
94% 96% 96% 97% 100% 100% 100%
100% 96% 97% 95% 100% 100%
91% 100%82% 86% 92%
86% 93% 94% 97% 95%
82% 88% 90% 94% 95% 93% 91%
91%
100% 100% 98% 97% 91% 86% 82%
93% 100%

25
Table7 - Optional rights: how likely, when they are given
B.2. The evolution of key financial terms
(a) Diagonal analysis: how financial terms given to new series varies across rounds?
Table 8 shows that, overall, companies seldomly change the terms offered to new series,
and even if changes happen, they are more likely to happen in earlier rounds. We further observe
that cashflow rights and control rights are quite stable, namely in most rounds, the values of these
terms are the same to that given in the immediate previous round. However, other protective
provisions, i.e., redemption, anti-dilution protection and IPO rachet, have more variance and are
more likely to get more investor friendly once changes are made.
Table 8 – % of companies where terms offered to new series changed
% of Co. have given the right
Optional Rights
Contractual Dividend 5% 1.00 (0.00)
Liquidation Participation 21% 1.40 (1.30)
Redemption 16% 1.08 (0.30)
Anti Dilution Protection 99% 1.38 (0.68)
IPO Rachet 5% 5.50 (2.80)
( ) denotes standard errors
* denotes that conditional on the right under concern is given
Average round where the rights are first given*
Series B Series C Series D Series E Series F Series G Series H
Nr. Companies 60 51 35 23 15 11 5
Nr. Companies with CoIs 56 50 34 22 14 11 5
A. Cash Flow Rights
Contractual Dividend 2% 2% 3% 5% . . .
Liquidation Order . 2% 3% 5% . . .
Liquidation Multiplier 4% 9% 3% 5% . . .
Liquidation Participation 4% 11% 3% 5% 8% . .
B. Control Rights
Votes per share 4% 2% 3% 5% 8% . .
C. Other Protective Provisions
Redemption 4% . . . . . .
Anti Dilution Protection 13% 9% 9% 10% 15% 10% .
IPO Rachet . 2% 3% 10% 15% 10% .
. indicates no terms offered to new investors changed;
indicates if terms offered to new investors changed, they become more investor-friendly for majority of companies

26
(b) Vertical analysis: how rights granted to a series get renegotiated?
Table 9 suggests renegotiation is not a common phenomenon. It also show renegotiation
happens more often for stocks issued in earlier rounds. Conditional on renegotiation happening,
cashflow rights are most likely to become less investor friendly while control rights such as votes
per share get more investor friendly in a majority of rounds, which indicate the existence of the
trade-off between cash flow rights and control rights.
The finding that earlier series are more likely to get renegotiated can be understood in the
context of stage financing. From the investors perspective, in earlier funding rounds, the
performance of the investee is more unpredictable, therefore, the contract terms agreed for series
issued in earlier rounds are based more on industry experience than on the investee’s
characteristics, which means the terms agreed in the earlier series may not protect the investors
well enough in later stage when new series are issued and when circumstances faced by the investee
company have changed. As a result, investors in earlier series have higher demand than that of later
rounds to renegotiate. From the perspective of the entrepreneur, he is more willing to accept the
renegotiation request because of the requirement of future funding, meanwhile, in order to attract
new investors, he may also adjust downwards the terms offered to previous investors.
The renegotiation results depend on the relative bargaining power and on the investors’
preference of terms, which can be a function of the investee’s performance. For example, when the
headroom of the investee company, a proxy of its financial flexibility, is very high, existing
investors are not so worried about they will not get paid of the promised amount if liquidation
happens or liquidation is unlikely to happened at all, so liquidation payment order is not such a
concern to them and they are willing to give the new investors the first order in payment since it is
a very cheap term for them compared to the benefits they can receive from the injection of new
capital. Investors’ preference of terms is also influenced by whether they also invest in later rounds,
and how much they invest in the later rounds. If they pull most of their money in the later rounds,
it is of their interest to argue for adjusting down the terms offered in earlier rounds.

27
Table 9 - % of companies where terms were renegotiated in at least one round
(c) Horizontal analysis: how the seniority of latest series varies across rounds?
Table 10 indicates that the preferred stock issued in the most recent round (the latest series)
does not necessarily being given the best terms, at least not in every term. Further, the seniority of
latest series seems to decrease over rounds.
Table 10 - % of companies that with latest series have the best terms
Common Stock Series A Series B Series C Series D Series E Series F Series G
Nr. Companies 77 77 60 51 35 23 15 11
A. Cash Flow Rights
Contractual Dividend . 4% 2% 2% 3% . . . Liquidation Order 93% 31% 30% 24% 27% 28% 33% 14%
Liquidation Multiplier . 3% 3% . . . . . Liquidation Participation . 6% 10% 2% . . . .B. Control Rights
Votes per share . 10% 10% 9% 13% 22% . .C. Other Protective Provisions
Redemption . 1% . . . . . . Anti Dilution Protection . 10% 3% 2% . . . . IPO Rachet . . . . . . . .
. indicates no terms offered to new investors changed;
indicates renegotiation happens and terms get more investor-friendly in majority of rounds on average;
indicates renegotiation happens and terms get less investor-friendly in majority of rounds on average;
otherwise, renegotiation happens and terms get more investor-friendly in half of the rounds on average;
Series A Series B Series C Series D Series E Series F Series G Series H
Nr. Companies 77 60 51 35 23 15 11 5
Nr. Companies with CoIs 65 56 50 34 22 14 11 5
A. Cash Flow Rights
Contractual Dividend 100% 100% 100% 98% 100% 100% 100% 100%
Liquidation Order 100% 100% 98% 98% 100% 95% 100% 100%
Liquidation Multiplier 100% 100% 100% 100% 97% 95% 93% 91%
Liquidation Participation 100% 11% 9% 4% 3% 0% 0% 0%
B. Control Rights
Votes per share 100% 98% 98% 88% 88% 82% 50% 64%
C. Other Protective Provisions
Redemption 100% 100% 98% 98% 100% 100% 100% 100%
Anti Dilution Protection 100% 100% 100% 98% 97% 95% 93% 100%
IPO Rachet 100% 100% 100% 100% 97% 95% 93% 91%

28
For example, compared to common stock, the preferred stock issued in the latest funding
round, in general, has no claim to the remaining assets in liquidation unless they convert into
common stock, namely give up the downside protection preferred stock enjoyed, and only has
slightly better terms such as contractual dividend and votes number per share, and the latest series’
seniority of these terms over common stock declines across rounds.
It is true that the latest series have seniority in liquidation payment and has the promised
liquidation amount, but when the probability of liquidation is very low or when the headroom or
market value of the investee company is very high, this downside protection is of very limited
value. On the contrary, the types of stock that have claims to the remaining assets, for example
common stock, is of much higher value. So, the probability that the latest to be converted into
common stock is high, and thus the value premium of the latest series over common stock is low,
if any.
Similar logic applies to redemption. Anti-dilution protection and IPO rachet, all these rights
offer downside protections which are of limited real value if the performance of the investee is so
good or so certain that investors don’t really care much about whether these extra terms would be
offered, although because of aversion loss, they prefer it to remain the same than become less
investor friendly than previous rounds.
Therefore, we have concerns regarding the conclusion made by Ilya Strebuleav and Will
Gornall (2018) that the value of unicorns, most of which are considered as promising and
successful, are seriously overstated by using the post-money valuation from later funding rounds
because (1) common stock does not always have less investor friendly terms than the latest series;
(2) the seniority of the latest series over common stock decreases over time; (3) when the
performance of the investee is good, any extra downside protection given to the latest series is of
very limited value. For successful companies, the preferred shareholders will voluntarily convert
their shares into common stock, and this probability increases as the headroom measure rises. As
a result, although it is possible that the values of young and bad performing companies are inflated
by using the post-money valuation (since in the early years the protections afforded by preferred
stock have considerable option value), mature and successful companies such as unicorns are less
likely to be over-valued, at least not by the logic that the latest series is always more value than the
common stock.

29
B.3. The evolution of ownership distribution
Graph 1 displays that percentage of the company owned by common stockholders drops
dramatically in the first two rounds; however, the dilution is not as severe in later rounds, and
interestingly, the ownership of the latest series also declines over rounds. One possible reason is
that common stockholders, which are represented by the founders of the investee company, gain
significant larger bargaining power in later funding rounds, since successfully raising several
funding rounds is itself a very strong signal of good operation of the business. Another explanation
is that investors of later rounds care more about cashflow rights instead of trying to control the
company, which is supported by Sergey Chernenko, Josh Lener and Yao Zeng (2017)’s finding
that Mutual funds who normally invest in later rounds, are less involved than VCs and provide less
governance in general.
This pattern that investors interest and ability to gain higher percentage of the company
declines across rounds is further confirmed by the decreasing pattern of the latest series’ ownership
of the company in Graph 1.
Graph 1 – The evolution of ownership

30
5. Preliminary Multivariate Analysis
In order to have a deeper understanding of the factors driving the evolution patterns
identified in part 4, we are conducting some regression analysis. To control for endogeneity issues
arising from company and round specific characteristics, we first try the fixed effect model. We
follow a general to specific modelling. The general Specification was as follows:
Where 𝑦𝑖𝑡 is the variables whose evolution patterns we are considering, for example the
ownership owned by the common stock. i and t indicates that the variable of company i at time t,
i.e., round t; 𝐴𝑔𝑒𝑖𝑡 is the age of the investee company i at round t; 𝑅𝑜𝑢𝑛𝑑𝑁𝑟𝑖𝑡 is the total round
number of the company i at round t; 𝐸𝑥𝑖𝑠𝑡𝑖𝑛𝑔 𝐼𝑛𝑣𝑒𝑠𝑡𝑜𝑟𝑠𝑖𝑡 is a dummy variable that indicates
whether round t of company i receive the investment from investors of previous rounds with 1 for
Yes and 0 for No; 𝐻𝑒𝑎𝑑𝑟𝑜𝑜𝑚 𝑖𝑡 is the headroom of company i immediately after round t. 𝑆𝑖𝑙𝑖𝑐𝑜𝑛𝑖
describes whether the company is located in Silicon Valley or not with 1 for Yes and 0 for No; 𝜀𝑖𝑡
is the error term.
As a trial, we use the percentage of companies owned by common stock holders and the
latest series holders as the dependent variable and get the results displayed in Table 11. It shows
first that ownership of both types of stocks is negatively related to round number. In the case of
common stock, the dilution of ownership due to one more round is not more pronounced for Silicon
Valley companies. Second Headroom is positively related to ownership of common stock, but not
significantly related to ownership of latest series, for there may be a rachet effect functioning here,
in other words, the ownership of latest series is more likely to be impacted by how much of the
company were given to the previous latest series (the then latest series of previous round), or there
exists inertia.
𝑦𝑖𝑡 =𝛼0 ∗ 𝑦𝑖𝑡−1
+ 𝛼1𝐴𝑔𝑒𝑖𝑡 + 𝛼2 ∗ 𝑅𝑜𝑢𝑛𝑑𝑁𝑟𝑖𝑡 + 𝛼3 ∗ 𝐸𝑥𝑖𝑠𝑡𝑖𝑛𝑔 𝐼𝑛𝑣𝑒𝑠𝑡𝑜𝑟𝑠𝑖𝑡 + 𝛼4 ∗ 𝐻𝑒𝑎𝑑𝑟𝑜𝑜𝑚 𝑖𝑡 + 𝛼5 ∗
𝑆𝑖𝑙𝑖𝑐𝑜𝑛𝑖 ∗ 𝑅𝑜𝑢𝑛𝑑𝑁𝑟𝑖𝑡+. , . + + 𝜀𝑖𝑡

31
Table 11 – Regression results for the ownership evolution
All Specifications in the above regression analysis include Company and Round Fixed
Effects; Standard Errors (in parentheses) are clustered at the company level. Headroom captures
performance and is correlated with unobserved bargaining power (since it incorporates liquidation
preference). However, our simple regression above may subject to endogeneity.
Endogeneity concerns arise due to two factors: Firstly, the models estimated using fixed
effects are dynamic. Secondly, headroom is most likely endogenous: headroom captures
performance and is correlated with unobserved bargaining power (since it incorporates liquidation
preference). Because all dependent variables considered will most likely be affected by unobserved
bargaining power, headroom will be endogenous.
Therefore, valid instruments are needed. We are currently working on finding the potential
instruments and at the same time expanding our sample size so that we can get more reliable
regression results on other evolution patterns shown in part 4.
(1) Common
Stock
(2)Common
Stock
(3)Latest
Series
(4)Latest
Series
Observations 205 205 205 205
Age 0.000977 0.000535 0.00145 0.00151
(0.000765) (0.000531) (0.00113) (0.00125)
Round Nr -0.0313** -0.126*** -0.0479** -0.114***
(0.0115) (0.0168) (0.0156) (0.0291)
Silicon*Round Nr -0.0119 -0.00519 0.0136 0.0138
(0.0172) (0.00964) (0.0157) (0.0148)
L.Ownership 0.437*** 0.0633 0.377* 0.331*
(0.100) (0.0847) (0.171) (0.137)
L.Ownership*Silicon 0.000345 0.0394 0.0945 0.0651
(0.191) (0.102) (0.262) (0.246)
Involvelemt of Existing Investors -0.0187 -0.00140 -0.0398 0.0119
(0.0574) (0.0208) (0.0482) (0.0650)
Headroom 0.256*** -0.134
(0.0667) (0.130)
Squared Round Nr 0.00934*** 0.00750***
(0.00136) (0.00194)
Company Fixed Effects Yes Yes Yes Yes
Round Fixed Effects Yes Yes Yes Yes
Constant 0.360*** 0.578*** 0.251** 0.401***
(0.0963) (0.0833) (0.0762) (0.104)
Evolution Of Ownership
All Specifications include Company and Round Fixed Effects; Standard Errors (In paranthesis) are clustered at the company level. Hedroom
captures performance and is correlated with unobserved bargaining power (since it incorporates liquidation preference). Because all our
right handside variables will most likely be affected by unobserved bargaining power, headroom will be endogenous. In the current
specification, further endogeneity problems arise since a lagged dependent variable is included. We are working on finding valid
instruments by considering Arellano-Bond instruments for the lagged ownership. Moreover, we are exploring the average age of
companies in certain locations as another potential instrument for headroom. * p<0.05 ** p<0.01 *** p<0.001

32
One way to potentially tackle this is through Arellano-Bond instruments: Lags of variables
can be used as instruments. The validity of lags as instruments relies on the assumption that there
is no serial correlation of order greater than the lag used in the error term. Specifying a first lag of
the dependent variable was generally enough to get rid of serial correlation of higher order. This
may perhaps be explained by the fact that bargaining power of parties involved may be a sticky
variable across rounds and hence incorporating more dynamics in our model are necessary to
capture this stickiness. The significance and direction of the effect of explanatory variables
remained the same as that of FE for many rights, although the magnitude differed.
One problem encountered is that when extending our sample with non-MF companies, we
noticed that there were a number of companies with less than 3 rounds for which COI was available;
some of them even had one round. If we use Arellano Bond instruments of lagged dependent
variable and lagged headroom going up to lag 3, these companies will not be included in estimation.
Since these companies may also be the ones that do not perform well, the sample selection bias
will deteriorate. To understand the degree of this issue, 7 companies have no more than 1 round
and 15 companies have no more than three rounds in our current sample of 40 companies. A
potential instrument we intend to explore, in this case, is average age of companies in each round,
by the location of the companies or industry to which they belong to. Since higher longevity of a
company is correlated with performance, we would expect it to be correlated with headroom.
Moreover, average age of companies by location may not be correlated with unobserved factors
affecting the dependent variables in all directions for a specific company. Hence, this could be a
valid instrument for headroom. we are going to test this in our work going forward.
6. Conclusions
This paper is the first to shed light on the evolution of the financial contracts used to raise
equity capital for new ventures. This paper is currently still ongoing, and this draft is preliminary.
Future work will focus on expanding the sample size and adjusting methodology to tackle potential
endogeneity due to headroom and lagged dependent variable. We will also doing related robustness
check once we have larger sample size.

References
Aghion, Philippe and Patrick Bolton (1992), An incomplete contracts approach to financial
contracting, The Review of Economic Studies, Vol. 59, No. 3, pp. 473-494.
Agarwal, Vikas, Brad Barber, Si Cheng, Allaudeen Hameed and Ayako Yasuda (2018), “Private
Company Valuations by Mutual Funds”, Working Paper.
Bengtsson, Ola and Berk Sensoy (2013), “Changing the Nexus: The Evolution and Renegotiation
of Venture Capital Contracts”, Journal of Financial and Quantitative Analysis (JFQA),
Forthcoming.
Bengtsson, Ola and Dan Bernhardt (2012), “Different Problem, Same Solution: Contract-
Specialization in Venture Capital”, Working Paper.
Bergemann, Dirk and Ulrich Hege (1998), “Venture Capital Financing, Moral Hazard and
Learning”, Journal of Banking & Finance 22 (1998) 703-735.
Bienz, Carsten and Julia Hirsch (2012), “The Dynamics of Venture Capital Contracts”, Review of
Finance (2012) 16: 157–195.
Cestone, Giacinta (2014), “Venture Capital Meets Contract Theory: Risky Claims or Formal
Control?”, Review of Finance (2014) 18: pp. 1097–1137.
Chemmanur, Thomas. and Zhaohui Chen (2014), “Venture Capitalists versus Angels: The
Dynamics of Private Firm Financing Contracts”, The Review of Corporate Finance Studies,
Volume 3, Issue 1-2, September 2014, Pages 39–86.
Chernenko, Sergey, Josh Lerner and Yao Zeng (2018), “Mutual Funds as Venture Capitalists:
Evidence from Unicorns”, Working Paper.
Ewens Michael, Alexander S. Gorbenko and Arthur Korteweg, Venture Capital Contracts ,2019,.
NBER Working Papers 26115, National Bureau of Economic Research, Inc.
Gârleanu, Nicolae, Jeffrey Zwiebel (2009), “Design and Renegotiation of Debt Covenants”,
Review of Financial Studies 22. 749-781.

34
Gornall, Will and Ilya Strebulaev (2018), “Squaring Venture Capital Valuations with Reality”,
forthcoming Journal of Financial Economics.
Hart, Oliver (1995), “Firms, Contracts and Financial Structure”, Clarendon Press, Oxford.
Hart, Oliver (2001), “Financial contracting”, Journal of Economic Literature, Vol. XXXIX, pp.
1079-1100
Hellmann, Thomas and Veikko Thiele (2015), “Friends or Foes? The Interrelationship between
Angel and Venture Capital Markets”, Journal of Financial Economics, 115(3), March, 639-653.
Hellmann, Thomas and Veikko Thiele (2019), “May the Force be With You:Investor Power and
Company Valuations”, Working Paper.
Kaplan, Steven and Per Stromberg (2003), “Financial Contracting Theory Meets the Real World:
An Empirical Analysis of Venture Capital Contracts”, Review of Economics Studies 70, 281.315.
Kwon, Sungjoung, Michelle Lowry, Yiming Qian (2019), “Mutual Fund Investments in Private
Firms”, Working Paper.
Roberts, Michael R. (2015), “The Role of Dynamic Renegotiation and Asymmetric Information in
Financial Contracting”, Journal of Financial Economics 116. 61-81.
Roberts, Michael R.and Amir Sufi (2009), “Renegotiation of financial contracts: Evidence from
private credit agreements”, Journal of Financial Economics 93. 159-184.
Da Rin and Hellmann (2019)

35
Related Documents