How do consumers in developed countries value the environment and workers’ social rights in developing countries? Anne-Célia Disdier Stéphan Marette Paper published in Food Policy 37 (2012): 1–11. Abstract This paper uses a lab experiment to investigate developed countries’ consumer valuations of characteristics linked to the environment and workers’ social rights in developing countries. It focuses on seafood products and distinguishes between regular, environmentally friendly and fair trade varieties. Consumer valuations are elicited with a multiple price list. Results show that environmental and social labels have similar effects on participant willingness-to-pay when they are first presented. Using welfare variation coming from the labels, we also show that the absence of negative information linked to the regular variety may lead to an underestimation of the value of information associated with the label. Keywords: label, willingness-to-pay, multiple price list, value of information, seafood. JEL Classification: C9, D8, J8, Q5. Financial support received by the “AgFoodTrade - New Issues in Agricultural, Food and Bioenergy Trade” (Grant Agreement no.212036) research project, funded by the European Commission, is gratefully acknowledged. The views expressed in this paper are the sole responsibility of the authors and do not necessarily reflect those of the Commission. Corresponding author: Paris School of Economics-INRA, 48 boulevard Jourdan, 75014 Paris, France. Email: [email protected] INRA, UMR Economie Publique INRA-AgroParisTech, Avenue Lucien Brétignières, 78850 Thiverval-Grignon, France. Email: [email protected]

Welcome message from author
This document is posted to help you gain knowledge. Please leave a comment to let me know what you think about it! Share it to your friends and learn new things together.
Transcript

How do consumers in developed countries value the environment and
workers’ social rights in developing countries?
Anne-Célia Disdier Stéphan Marette
Paper published in Food Policy 37 (2012): 1–11.
Abstract
This paper uses a lab experiment to investigate developed countries’ consumer valuations of characteristics linked to the environment and workers’ social rights in developing countries. It focuses on seafood products and distinguishes between regular, environmentally friendly and fair trade varieties. Consumer valuations are elicited with a multiple price list. Results show that environmental and social labels have similar effects on participant willingness-to-pay when they are first presented. Using welfare variation coming from the labels, we also show that the absence of negative information linked to the regular variety may lead to an underestimation of the value of information associated with the label.
Keywords: label, willingness-to-pay, multiple price list, value of information, seafood.
JEL Classification: C9, D8, J8, Q5.
Financial support received by the “AgFoodTrade - New Issues in Agricultural, Food and Bioenergy Trade” (Grant Agreement no.212036) research project, funded by the European Commission, is gratefully acknowledged. The views expressed in this paper are the sole responsibility of the authors and do not necessarily reflect those of the Commission. Corresponding author: Paris School of Economics-INRA, 48 boulevard Jourdan, 75014 Paris, France. Email: [email protected] INRA, UMR Economie Publique INRA-AgroParisTech, Avenue Lucien Brétignières, 78850 Thiverval-Grignon, France. Email: [email protected]
1. Introduction
Environmentally friendly and fair trade labeled products have emerged over the last two decades
and their markets have expanded very rapidly. By enhancing production and export capacities,
such products may contribute to the emergence of developing countries on the world market and
to their economic growth. Some factors may however restrict their sales. At the macro-level,
multilateral trade negotiations at the World Trade Organization (WTO), while acknowledging
the important role played by such labels, do not make them mandatory. For instance, under WTO
rules, countries cannot ban products based on the way they are produced (environment pollution,
indecent working conditions, etc.). At the micro-level, consumers may not really trust such labels
or are not willing to pay a premium for such products.
In this paper, we investigate developed countries’ consumer valuations of characteristics
linked to the environment and workers’ social rights in developing countries. Developed
countries are indeed the main market for labeled products coming from developing countries. We
use a lab experiment conducted in France in 2009 to evaluate the impact of information about
environmental and social characteristics of products on consumer choice. We distinguish
between regular and labeled varieties. Production of regular varieties may imply pollutions
and/or may not respect decent social rights, while labeled varieties goods are made according to
certain environmental or/and social production standards. Successive positive or negative
information is delivered to participants. Our experiment focuses on shrimps. Several
environmental and social issues affect their production in developing countries.
World shrimp production has grown rapidly during the last two decades. However, this
boom has come at some cost. First, there are health costs as shrimps often contain bacteria
(e.g. salmonella) or pesticide, drug and antibiotic residues. There are also concerns related to the
environment with the destruction of mangroves and the depletion of rivers and groundwater
sources for maintaining oxygen levels in farms. Other concerns deal with the illegal use of areas
3
for shrimp aquaculture and corruption of local authorities, as well as bad working conditions
(World Bank, 2001). These costs are likely to play an increasing role in swaying both
consumers’ choices and international trade. Environmentally friendly shrimps have recently
emerged. However, they represent less than 1% of world production (Hervieu, 2009).
This paper makes an important contribution to the experimental literature on labels. This
literature shows that a significant proportion of consumers are willing to pay substantial
premiums for environmentally friendly products (Blend and Van Ravenswaay, 1999; Bougherara
and Combris, 2009; Loureiro et al., 2001; Nimon and Beghin, 1999; Wessells et al., 1999) or fair
trade products (Arnot et al., 2006; Loureiro and Lotade, 2005). However, there is still
disagreement on whether or not labeling should combine different characteristics to increase
WTP and to favor products from developing countries. Loureiro and Lotade (2005) compare
WTP for coffee with fair trade, environmentally friendly or organic labels and Bernard and
Bernard (2009) compare WTP for milk with conventional, organic, rBST-free or no-antibiotic
characteristics. These papers offer a ranking of positive premiums for these new characteristics
signaled by a label and suggest that consumers are very receptive to one characteristic. Our paper
goes one step further since we show that the ordering of information is important. Participants
are receptive to the first-detailed characteristic presented in the experiment. However, we also
highlight a fast-diminishing interest in the added characteristic presented in second position.
The second contribution of our paper is to provide a complete estimation of the value of
information associated with labels and defined by consumer surplus variations derived from the
experimental results. While previous papers have determined the value of information through
experimental auctions or surveys, we attempt to do so with a choice procedure based on a
multiple price list. Furthermore, the estimation includes all negative and positive information for
a characteristic (social or environmental) that delineates the regular and the new labeled
varieties. In many existing studies (Huffman et al., 2003, 2007; Lusk et al., 2005; Lusk and

4
Marette, 2010; Rousu et al., 2004, 2007; Rousu and Lusk, 2009), 1 all information revealed in the
experiment concerns only the newly introduced variety and not the regular/conventional variety.
Our paper shows that the omission of the negative (or positive) information linked to the
regular/conventional variety may bias the estimation of information value. More precisely, this
omission leads to an underestimation of the value of information associated with the label since
the knowledge about the regular variety is still imperfect.
The next section describes the experiment. Results are reported in section 3. Section 4
provides econometric estimations of the determinants of consumer willingness-to-pay. Section 5
studies the value of information and consumer welfare. Section 6 concludes.
2. Experiment
2.1 Sample
The sample consists of 160 people aged between 18 and 85 years. We conducted the experiment
in Paris, France, in multiple one-hour sessions in December 2009. The sample of participants
was randomly selected based on the quota method. Participants were contacted by phone and
informed that they will have to reply to questions about food during one hour with a 15-euro
participation fee. The sample is relatively representative of the age-groups and the socio-
economic status of the population of the city although retired people are slightly over-
represented.
In our experiment, the sample is divided into four groups (see the explanation and the
figure 1 below) and participants are randomly assigned to one group. A Pearson chi-square test
1 One exception is Gifford and Bernard (2004).
5
shows that the four groups are not significantly different from each other in terms of participants’
socio-economic characteristics (gender, age, education, income, household composition).2
2.2 Product
The experiment focuses on a 100g plastic package of farmed, midsize, shelled, cooked and
refrigerated shrimps. Cooked and refrigerated shrimps are the most consumed shrimps in France
(two-thirds of all consumption of shrimps both in value and quantity in 2008 according to the
FranceAgriMer, 2008).3 As no major brand dominates the market, the private brand (linked to a
French supermarket) is concealed to avoid any influence of this supermarket brand.
For fair trade and environmentally friendly shrimps, we add the corresponding label to
the picture of the regular product (instead of using real labeled products). Indeed for really
measuring the marginal value of the environmental and fair trade characteristics with sequential
choices, regular, environmentally friendly and fair trade varieties would have to be similar in a
maximum number of elements, namely, brand, sauce, weight, packaging, and price. Such a
similarity between regular and environmentally friendly varieties did not exist and no fair trade
shrimps were sold on the French market at the time of the study.4 In this last case, the experiment
allows us to measure consumers’ WTP for the hypothetical fair trade variety and evaluate the
possible benefits linked to the introduction of a fair trade label, which is likely to appear in a near
future for shrimps. Participants are however not informed during the experiment that the fair
trade variety is not currently available on the market.
2 The socio-economic characteristics of participants within each group and the results of the Pearson chi-square test
are available upon request.
3 Statistics do not distinguish between shelled and non-shelled shrimps.
4 Furthermore, the cold process linked to refrigeration makes the sale/distribution of real products to participants
hazardous in terms of food safety.

6
Based on the previous literature, the risks of possible hypothetical biases can be
downplayed regarding the welfare measures, since the marginal WTP (namely the difference
between WTP expressed under different choices) is used for computing the value of information
that is the surplus variation coming from revealed information (see also footnote 5). By
comparing hypothetical and non-hypothetical responses, Lusk and Schroeder (2004) show that
marginal WTP for a change in quality/characteristic is, in general, not statistically different
across hypothetical and real payment settings. Moreover, Camerer and Hogarth (1999) show that
performance-based financial incentives have little effect on mean responses.
2.3 Experimental design and revealed information
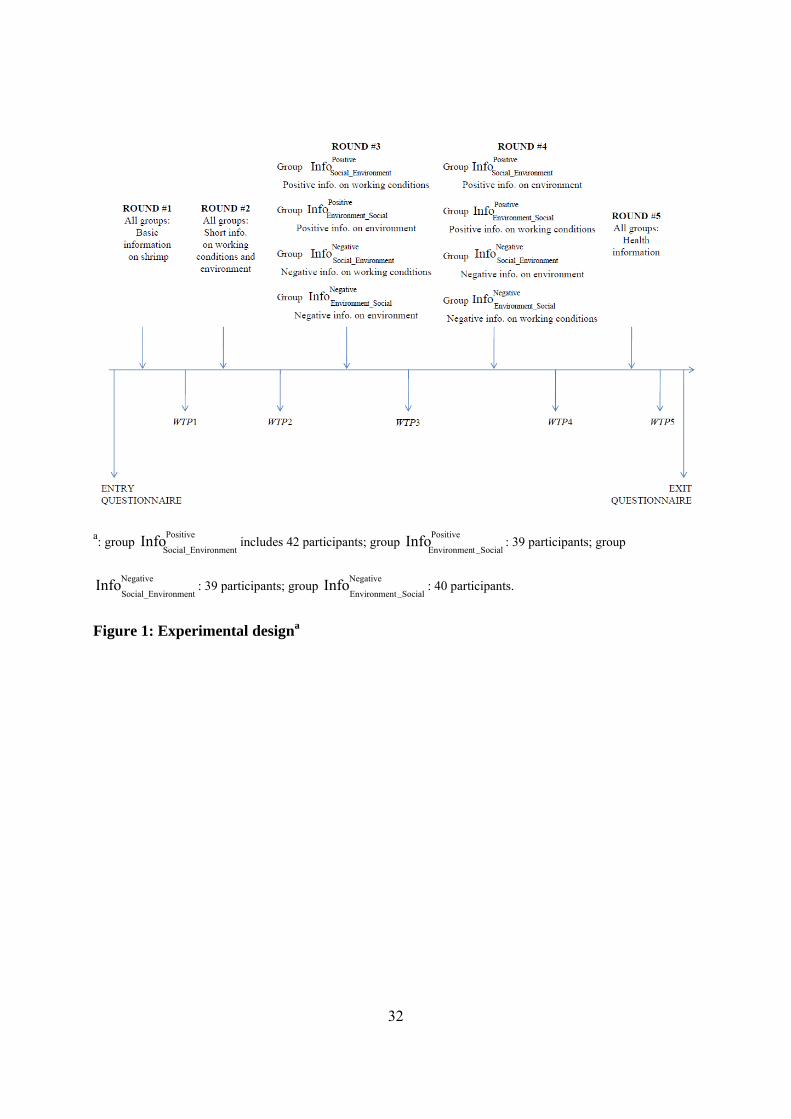
The experiment is divided into several stages as described in figure 1. Participants receive
general instructions and sign a consent form. They fill in an entry questionnaire on consumption
behavior and socio-demographic characteristics. Five successive rounds of WTP elicitation are
then organized. For each round, we first provide some information to the participants. After the
information revelation, they fill in a multi-price list (or payment card) presented on a paper sheet,
which allows elicitation of the WTP. Finally, participants complete an exit questionnaire and
receive the €15 compensation.
Insert figure 1 here
While the complete information revealed to participants is given in appendix, it is
possible to sum up the content delivered at different points in the experiment as follows:
- In the first round, we provide basic information about the shrimp, including the range
of existing prices observed in supermarkets (between €1.50 and €4).
- In the second round, we provide brief information on concerns about the environment
and working conditions.

7
- In the third and fourth rounds, we reveal additional information about possible
environmental and working conditions attributes linked to shrimps. We divide our
sample into four groups and we vary the type (positive vs. negative) and the order of
information (environmental vs. social) provided to each group. The two first groups
(groups ironmentSocial_Env
PositiveInfo and
Social_tEnvironmen
PositiveInfo ) receive positive information, while the
two last groups (groups ironmentSocial_Env
NegativeInfo and
Social_tEnvironmen
NegativeInfo ) receive negative
information. Information on working conditions is delivered before information on
environmental conditions to groups ironmentSocial_Env
PositiveInfo and
ironmentSocial_Env
NegativeInfo , while
groups _SocialtEnvironmen
PositiveInfo and
Social_tEnvironmen
NegativeInfo receive information on environmental
conditions before information on working conditions.
- Finally, in the fifth round, we reveal information about safety. Previous experiments
show that safety information is a priority for participants eclipsing other
characteristics (Marette et al., 2009), while in this experiment we want to ignore food
safety considerations except at the end of the experiment.
A multiple price list is presented on a sheet of paper to elicit participants’ WTP. During
each choice phase, participants are asked to choose whether or not they will buy the product for
prices varying from €0.25 to €4 with a 25-cent interval between possible choices. A color picture
of the shrimp package is posted on the paper sheet. For fair trade and environmentally friendly
shrimps, we also post a “fair trade” or “environmentally friendly” label. For each price,
participants have to check off either “yes”, “no” or “maybe” denoting their purchase preferences.
The option “maybe” is useful for capturing hesitation that differs from a firm “yes”. For each
choice #i with i=1,...,5, the WTP is determined by taking the highest price linked to a “yes”
choice. If no “yes” is checked off, we set the WTP to zero. If “yes” is always selected, we set the
WTP to €4.
8
Andersen et al. (2006) underline two disadvantages of the multiple price list. The first
disadvantage is the interval response eliciting interval from participants rather than point
estimates for WTP. With our experiment, the 25-cent interval offers enough precision for the
elicited WTP. The other disadvantage is the framing effect with a psychological bias towards the
middle of the multiple price list for choices made by participants. Andersen et al. (2006) control
for this effect by changing the boundaries of the multiple price list. In this paper we do not
change the boundaries of the list and therefore do not control for this framing effect, since we
focus on the impact of the revelation of information and messages. The psychological bias is
plausible for the first round of our experiment, 18.1% of participants expressing a WTP of €2.
However, this effect disappears after the revelation of information. Only 11.3% of participants
make a bid of €2 in choice #2, and this percentage becomes less than 6% in choices #3, #4 and
#5. Despite these limitations, the multiple price list methodology is useful for providing
information regarding the consumers’ WTP.
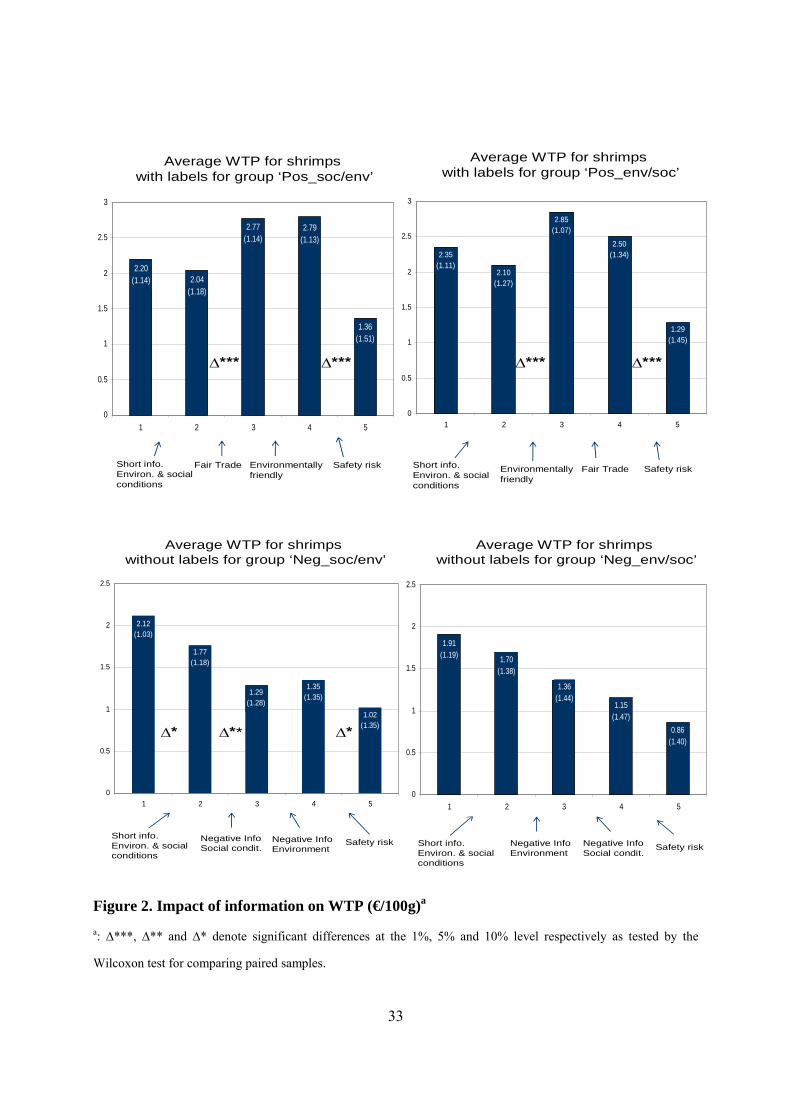
3. Experimental results
Figure 2 shows the average WTP in euro for 100g of shrimps. This average takes into account
bids by all participants, including the ones with WTP equal to zero. The standard deviation is
reported in parentheses. Recall that the two upper groups ironmentSocial_Env
PositiveInfo and
Social_tEnvironmen
PositiveInfo
(respectively the two lower groups ironmentSocial_Env
NegativeInfo and
Social_tEnvironmen
NegativeInfo ) receive positive
information with labels (respectively negative information). The x-axis of each graph details
under each bar the round of choice i with i=1,...,5 and information preceding the choice leading
to the WTP elicitation. The indicators Δ isolate the significant impact of a single round of
additional information. We test for the significance of the WTP differences following a single
round of information (namely, between WTP #i and WTP #i+1) by using the Wilcoxon test for
paired samples and indicate the significant differences at the 1 %, 5%, and 10% level.
9
Insert figure 2 here
Seven main results could be highlighted:
(i) The initial WTP before the revelation of any information about social, environmental
and health-related conditions is similar across groups. A Kruskal-Wallis test concludes that the
valuation for the first round across the four groups is not statistically significant.
(ii) The short and vague message we provide does not influence consumers with pre-
existing knowledge about the question studied in the experiment. A Kruskal-Wallis test
concludes that the valuation for the second round is similar across groups. Furthermore, the
revelation of short and general information about environment and social conditions before
choice #2 does not lead to a significant change in WTP for three of the four groups. For the last
group (group ironmentSocial_Env
NegativeInfo ), the Wilcoxon test for paired samples shows that the difference
in WTP between the first and the second bars is significant but only at the 10% level. This result
differs from conclusions showing that short and simple information is efficient for changing
WTP (Wansink et al., 2004). Clearly, there are no definitive conclusions that depend on both the
products and the characteristics at stake.
(iii) A sufficient level of precision in the revealed information is efficient for changing
WTP. Participants react to the second and more precise round of information (before choice #3).
The differences in WTP between the second and third bars of each graph are significant, except
for one group (group Social_tEnvironmen
NegativeInfo , significant at 10.1% only).
(iv) Positive information has a larger impact on consumers’ WTP in absolute value than
negative information. The average variation in absolute value between the second and third bars
is equal to €0.73 and to €0.75 for the two groups receiving positive information and only to
€0.34 and to €0.48 for the two groups receiving negative information.5 This diverges from some
5 For positive information the premium equal to €0.75 corresponds to an increase of 35% of the WTP. Some farms
in Madagascar recently offer organic shrimps with a price premium of 25% compared to regular products sold in
10
results on food safety showing that negative information has a larger impact than positive
information (Fox et al., 2002; Hayes et al., 1995). One explanation for our result could be that
consumers tend to undervalue the distinctive advantage of the label and give higher ratings to
products with a label and additional details covered by that label (Hoogland et al., 2007).
(v) Different labels have similar effect. The Mann-Whitney-U test across the two groups
ironmentSocial_Env
PositiveInfo and
Social_tEnvironmen
PositiveInfo reveals that valuations for the third rounds are not
statistically different, even if labels are different. Interestingly, the same result occurs when one
focuses on the two groups receiving negative information. The fact that no label dominates other
labels may explain the appearance of new labels on the market, since some producers may
benefit from higher consumers WTP with a new signal that is different from other labels. This
result also suggests that farmers from developing countries could consider different quality
improvements associated with different labels to capture consumer WTP.
(vi) Consumers’ WTP does not seem to be influenced by different labels or negative
information. The additional information about the second characteristic (before choice #4 leading
to the 4th bar) does not impact WTP for the four groups of participants. This is true whatever the
type of information (positive vs. negative) and in case of positive information whatever the type
of labels (environmentally friendly or fair trade). Similarly, the last information about safety
(before choice #5 leading to the 5th bar) clearly matters for the two groups, which previously
received only positive information. The effect is much smaller and even not significant for the
two groups previously receiving negative information.
other farms (see Hervieu, 2009). This premium of 25% at the farm gate is a lower bound since middlemen and
supermarkets tend to increase it when offering the organic product. This simple comparison suggests that our
welfare measures do not suffer from a hypothetical bias

11
(vii) Experiment results are driven by neither an information effect per se nor a tiredness
effect. First, the revelation of short and general information before choice #2 does not lead to a
significant change in WTP for three of the four groups, suggesting the absence of an information
perturbation whatever its content (information effect per se). As a consequence, the significant
impact of information before choice #3 can really be interpreted as a shock coming from the
content of positive information or negative information. Second, the significant impact of the last
round of information before choice #5 indicates that participants’ attention does not suffer from a
tiredness effect.6 The non-significant impact of information before choice #4 can therefore be
interpreted as the absence of an additional premium for a second characteristic (under both
positive and negative information).
4. Econometric estimations
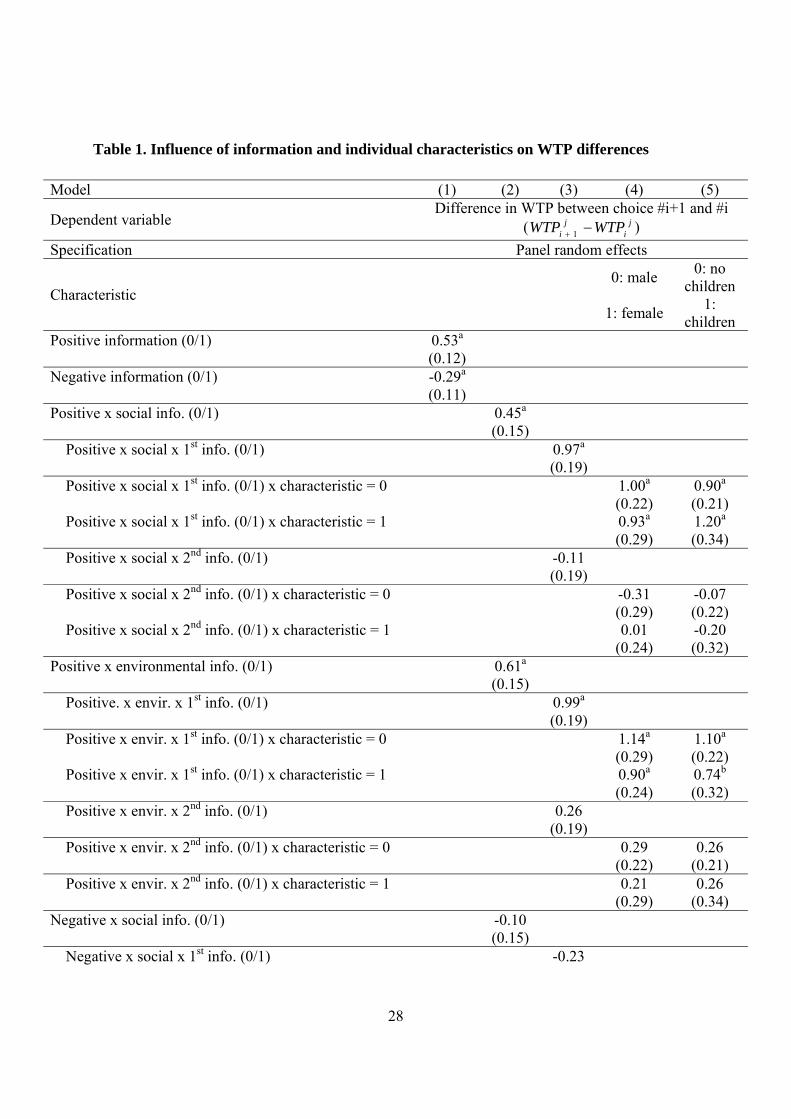
We now provide more explanations regarding the results of figure 2 and investigate the
determinants of changes in WTP. To do so, we regress difference in WTP expressed by
participants between choices #i+1 and #i (with i=1,…,4) on information and participants’
characteristics. Results are presented in table 1. Since participants provide several answers, our
sample is a panel and we could use a panel estimator. However, each participant makes multiple
choices, and therefore there could be some correlation across data points relating to WTP. To
deal with this issue, we use the random effects panel estimator.7
We first examine whether the revelation of positive information (respectively negative)
before choice #i+1 increases (respectively decreases) participants’ WTP (column 1). We assume
6 Due to tiredness, participants’ attention could decrease during the experiment and they react less (or even do not
react) to new information. 7 We also tested for the influence of participants’ socio-economic characteristics (sex, age, presence of children in
the household, and level of education). Because none of the estimated coefficients on these variables was
statistically significant, we decided to remove them from the estimations.

12
that three types of information are revealed during the experiment: (i) neutral information (i.e.
general and brief messages #1 and 2 provided to all participants), (ii) positive information
(messages #3 and 4 delivered to groups ironmentSocial_Env
PositiveInfo and
Social_tEnvironmen
PositiveInfo ), and (iii) negative
information (messages #3 and #4 delivered to groups ironmentSocial_Env
NegativeInfo and
Social_tEnvironmen
NegativeInfo , and
message #5 to all groups). To test the impact of information on participants WTP, we therefore
define two dummies: one for positive information and one for negative information. The first
dummy (respectively the second one) is set to one if positive information (respectively negative
information) is revealed and 0 otherwise. Results suggest that revealed positive information
increases participants’ WTP, while negative information decreases it. Estimated coefficients on
both dummy variables are significant at the 1% level.
In column (2), we interact the dummies on positive and negative information with
dummies on the type of revealed information before choice #i+1: environmental, social or
health-related. Interestingly, only three interaction terms are significant at the 1% level and have
the expected sign; positive social and positive environmental information increases WTP, while
negative safety information reduces WTP. The two other interaction terms (namely, negative
social and negative environmental information) are not significant. Furthermore, the F-test shows
that the interaction terms (positive x social information and positive x environmental
information) are not significantly different.
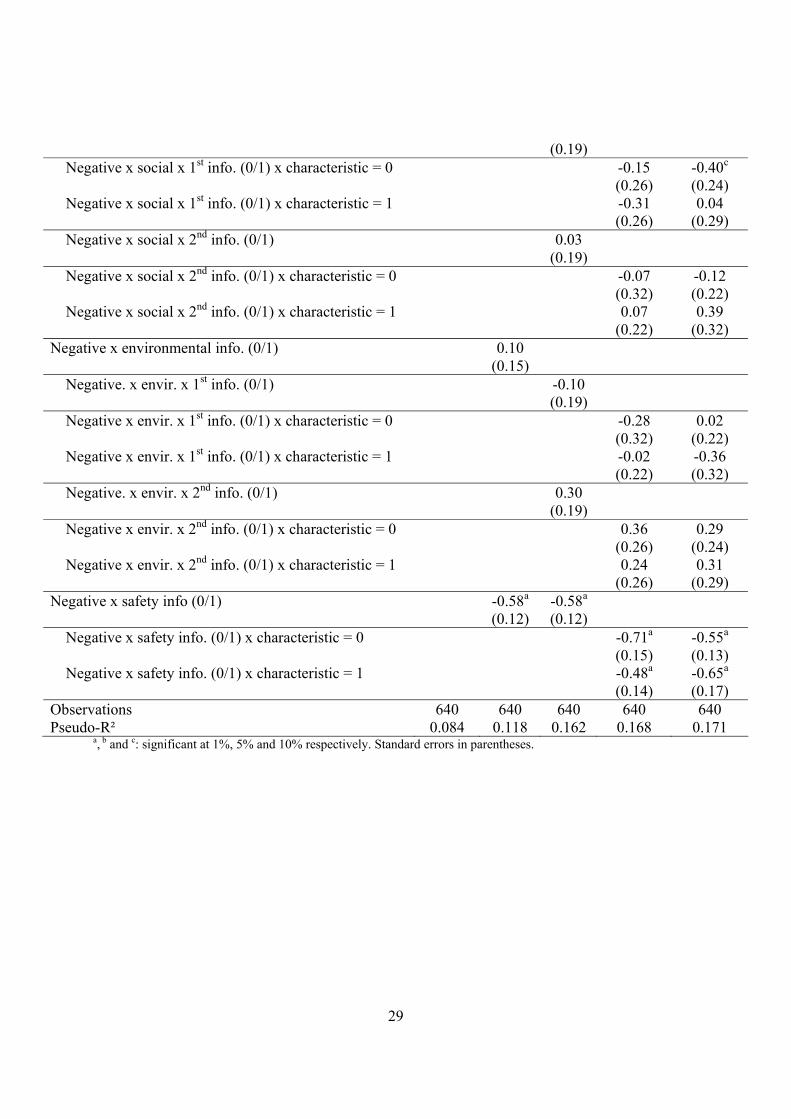
Column (3) examines if the order in which information is presented impacts the WTP, i.e.
if information about social conditions (respectively environment) has a similar or different effect
depending on whether it is presented before or after environmental concerns (respectively social
conditions). To perform this analysis we define two dummies: “first information” equals to one
for information provided before choice #3 (0 otherwise) and “second information” set to one for
information revealed before choice #4 (0 otherwise). We then interact these two dummies with
the previous dummies on positive/negative and social/environmental information. Results show
13
that only the positive message on social or environmental conditions delivered before choice #3
significantly affects the differences in WTP. The first negative message before choice #3 and the
second (positive or negative) message before choice #4 have no significant influence. Besides,
the F-tests suggest that the interaction terms (positive x social x first information and positive x
environmental x first information) are not significantly different. These results are in line with
figure 2 and confirm that consumers’ valuations are more sensitive to positive information than
to negative information.
Finally, in columns (4) and (5), we investigate whether information affects differently
participants belonging to alternative demographic groups. We interact information variables with
two socio-economic characteristics of participants: sex and presence vs. absence of children in
the household. Previous results remain qualitatively unchanged. The estimated coefficients on
these interaction terms show some differences between male and female and between
participants living with/without children at home. However, the F-tests suggest that these
differences are not statistically significant. This absence of influence of socio-economic
characteristics is often found in experimental economics, especially when one controls for the
individual effect (i.e. for the correlation across the multiple choices made by each participant) as
we do. It suggests that reactions to information seem similar across the sample of participants
and, by extrapolation, for the overall French population. In other words, reactions are relatively
similar whatever the people attending the experiment.
Insert table 1 here
5. Value of information and consumer welfare
The WTP can be used to determine the consumer surplus and the value of information.
Following Foster and Just (1989) and Teisl et al. (2001), information is welfare enhancing if
consumers change their consumption behavior. The contribution of our experiment is twofold.

14
First, we investigate whether positive and negative information for the same characteristics has a
similar impact on participants’ behaviors. Second, we combine both positive and negative
information to estimate consumer welfare. Our approach therefore differs from the previous
studies focusing only on the effect or/and the value of information related to the labeled variety
(Huffman et al., 2003, 2007; Lusk et al., 2005; Rousu et al., 2004, 2007; Rousu and Lusk, 2009).
Consumers’ knowledge is affected by various parameters including levels of consumer
attention, advertising, ambient opinion, media coverage, regulation, etc. There are many contexts
of information perception that makes difficult the precise characterization of “correct” or
“incorrect” information. Some consumers (or nations) pay more attention to positive information
and some others are more concerned by negative information. Many limits in consumption are
coming from difficulties to collect, understand and/or process the load of information (Ariely,
2000). Imperfect recall, lack of time before purchasing or/and confusion about complex
information characterize many consumers in the supermarket and potentially bias their
consumption decisions. Risks of consumers’ confusion and difficulties to understand complex
recommendations with positive and negative points of views diminish the information efficiency
(Sasaki et al., 2011).
All these facts explained why we describe different contexts of information. Surplus
analysis under different contexts could help streamline debates around food media coverage and
improve regulatory efficiency regarding the revelation of information. Both positive and negative
messages are complementary since they concern different varieties in competition. Positive
information is clearly related to the variety with the label (organic or fair trade), while negative
information is related to the regular variety without label. Revealing information about the
environmentally friendly or fair trade variety does not mean that all information is revealed about
the ‘harmful’ one and the extent of the environmental and social problems. The consumers’
perception of the regular variety is also modified by the revelation of information about the
15
regular variety.8 This revelation impacts the intensity of the perceived variety differentiation as
precisely described in section 5.3”
We focus on information delivered just before choice #3. This information significantly
impacts WTP for three of the four groups (see figure 2)9, and therefore its welfare impact can be
computed by comparing 3WTP and 1WTP . The focus on this third message presents three main
advantages:
(i) When positive information linked to a label is revealed, consumers are aware of a
new purchasing option. In this case, we may simulate the introduction of a new variety of the
product signaled by a label (fair trade or environmentally friendly label).
(ii) When negative information about the regular variety is revealed, consumers may
take different action compared to the absence of precise information. In this case, we may
determine a non-internalized damage.
(iii) Eventually, we combine both types of positive and negative information to have a
complete view when different varieties of a given product coexist on the market. The
combination of detailed and complete information about each variety provides a balanced
estimation of the value of information. In our context, each group provides well-informed,
thoughtful preferences about one variety without interferences with competing varieties since the
consumers’ focalization is guaranteed.
8 Negative information on the regular product would not be revealed by the regular industry via advertising. It may
be revealed by intense campaigns made by environmentalist groups that can be highly vocal like Greenpeace. Rousu
et al. (2004) detail a method for valuing information as correct despite the eyes of the entity providing it. In this
paper, we do not focus on a specific entity, but rather insist on different sources of information linked to different
products.
9 For group ‘Neg_env/soc’, information is significant at 10.1% only when we compare WTP2 and WTP3. However,
the comparison of WTP1 and WTP3 for this group shows a statistically significant difference at 1%.

16
5.1 Positive information about the new (labeled) variety
With positive information linked to a labeled variety for groups ironmentSocial_Env
PositiveInfo and
Social_tEnvironmen
PositiveInfo , we can measure the impact of a label introduction on participants’ surplus. This
label leads to the introduction of a new variety complying with the label requirements. Before
measuring the value of information, we determine the participants’ purchase choices in periods 1
and 3. We assume that a participant purchases a good if his WTP for the good is higher than the
price observed on average in the supermarkets in France. Before choice #1, only “regular”
shrimps are offered, and the participant can choose between two outcomes: regular at price RP
and none. The participant j chooses the option generating the highest utility, namely:
1 1max{ ,0}j jRCS WTP P , (1)
where the subscript 1 denotes the bid linked to choice #1 for a participant j (with j=1,…,N).
When a label is introduced at price LP (before choice #3), the participant can choose
between three outcomes: regular variety, labeled variety, and none. She/he chooses the
alternative, which generates the highest utility, and thus:
3 1 3max{ , ,0}j j jR LCS WTP P WTP P . (2)
We now turn to the value of information by using two metrics to compute the average
value for each group ironmentSocial_Env
PositiveInfo or
Social_tEnvironmen
PositiveInfo receiving positive information. The
participants’ surplus change from a label introduction, if all participants are fully informed about
the label, is:
3 1 1 3 11 1
[ ] [max{ , ,0} max{ ,0}]K K
j j j j jR L R
j jKLabel
CS CS WTP P WTP P WTP P
CSK K
. (3)
where K can take two values. First K=SP, where SP is the number of switchers receiving positive
information who start to consume the labeled variety after its introduction. In this case, the
information revelation only modifies the surplus of these switchers. Conversely, the surplus
17
variation is zero for participants who do not change their behavior, namely by continuing to
choose the regular variety or nothing when the label is introduced and when RP is constant
(which is the case under constant-return to scale for producers). Second, K=NP, where NP is the
overall number of participants within a group receiving positive information. The measure given
by (3) is similar to the one provided in papers focusing on the introduction of genetically
modified products (Huffman et al., 2003, 2007; Lusk et al., 2005).
5.2 Negative information about the regular variety
With negative information revealed to groups ironmentSocial_Env
NegativeInfo and
Social_tEnvironmen
NegativeInfo , we can
measure the non-internalized damage10 linked to the lack of precise information (as before
choice #1). When the negative and precise information (before choice #3) is revealed to these
two groups, some participants stop buying the product. For a participant j, the non-internalized
damage linked to the absence of complete information about a characteristic before choice #1 is
][ 31jj
jj WTPWTPID where Ij is an indicator variable taking the value of 1 if participant j is
predicted to have chosen the regular variety at price PR with 1j
RWTP P in choice #1 (and 0
otherwise). The non-internalized damage reduces the participant’s surplus associated with choice
#1. By taking into account 1 1max{ ,0}j jRCS WTP P (see equation 1), the overall surplus is:
][0,max 31111jj
jRjjjj WTPWTPIPWTPDCSCSC (4)
When negative information is revealed, outcomes remain unchanged (regular variety or
none). However, participants may adjust their consumption, and the surplus becomes
3 3max{ ,0}j j
RCS WTP P . For each group ironmentSocial_Env
NegativeInfo or
Social_tEnvironmen
NegativeInfo , the value of
10 This non-internalized damage is slightly different from the cost of ignorance suggested by Foster and Just (1989).
In Foster and Just’s (1989) framework, consumers incur a cost of ignorance from consuming a contaminated product
that could cause detrimental health effects without knowledge of the adverse information.
18
information or total surplus change for participants linked to the revealed information is given
by:
3 11
3 1 1 31
[ ]
[max{ ,0} max{ ,0} [ ] ]
K j j
jKNeg
Kj j j j
R R jj
CS CSC
CSK
WTP P WTP P I WTP WTP
K
(5)
where K=SN (the number of switchers) or K=NN (the overall number of participants within a
group receiving negative information). In this context, SN is the number of switchers that stop
consuming the product when negative information is revealed before choice #3.
5.3 Combination of positive and negative information
Eventually, one can combine negative and positive information across the groups by integrating
the average values of the non-internalized damages coming from groups receiving negative
information in the surplus of the groups receiving positive information. This combination is
likely to be more satisfying compared to previous situations presented in subsections 5.1
(revelation of positive information on the labeled variety only) and 5.2 (revelation of negative
information on regular variety only) as it equally balances the weight of both groups for positive
and negative information. The value of information is computed to measure the impact of the
new variety linked to a fair trade or environmentally friendly label by including the average
value of the non-internalized damage linked the purchase/consumption of the regular variety.
The existence of a new label may also lead many consumers to question the existence of “bad”
characteristics linked to the regular variety.
For the two groups receiving negative information, the average value of the non-
internalized damage linked to the regular variety is:

19
N
N
N
jj
N
j
jjj
I
WTPWTPI
DE
1
131 ][
)( (6)
where 1
NN
jj
I is the number of participants who purchase the good based on WTP revealed by
choice #1.
The average measure E(D) coming from group ironmentSocial_Env
NegativeInfo is integrated in the
participant’s j surplus for group ironmentSocial_Env
PositiveInfo receiving positive information (the equivalent
can be made for groups Social_tEnvironmen
NegativeInfo and
Social_tEnvironmen
PositiveInfo ). By taking into account
1 1max{ ,0}j jRCS WTP P given by (1) and linked to the choice #1, the overall surplus with only
the regular variety on the market is:
)(0,max)( 111 DEIPWTPDECSCSD jRjjj (7)
The introduction of the label leads to two situations, namely case 1 and case 2. Under
case 1, participants faced with a label are only aware of positive information coming from the
label for choosing between options (regular, label, and none), but their choices may be distorted
because of a lack of information regarding the regular variety. Their surplus is
)(0,,max 313 DEIIPWTPPWTPCSD RjL
jR
jj , where IIjR is an indicator variable taking the
value of 1 if participant j is predicted to have chosen the regular variety at price PR when the
label exists on the market (and 0 otherwise). In this case, the value of information is:
K
DEIPWTPDEIIPWTPPWTP
K
CSDCSD
CSD
K
jjR
j
jR
L
j
R
j
K
j
jj
LabelK
1131
113
)(0,max)(0,,max (8)

20
where K=SP (the number of switchers) or K=NP (the overall number of participants within a
group receiving positive information).
Under case 2, participants faced with a label are fully aware of both positive information
coming from the label and negative aspects linked to the regular variety when they choose
between regular, label or none. The emergence of a label may indeed lead to awareness of
negative aspects linked to the regular variety. For instance, participants realize to what extent the
production of the regular variety pollutes the environment or does not provide decent working
conditions. Thus, their surplus is 0,,)(max 313 Lj
Rjj PWTPPDEWTPCSE . Their WTP for
the regular variety at price PR is )(1 DEWTP j if they are aware of the negative aspect based on
the average non-internalized damage E(D) that is internalized in their demand. In this case, the
value of information is:
K
DEIPWTPPWTPPDEWTP
K
CSDCSE
CSE
K
jjR
j
L
j
R
j
K
j
jj
LabelK
1131
113
)(0,max0,,)(max
(9)
where K=SP (the number of switchers) or K=NP (the overall number of participants within a
group).
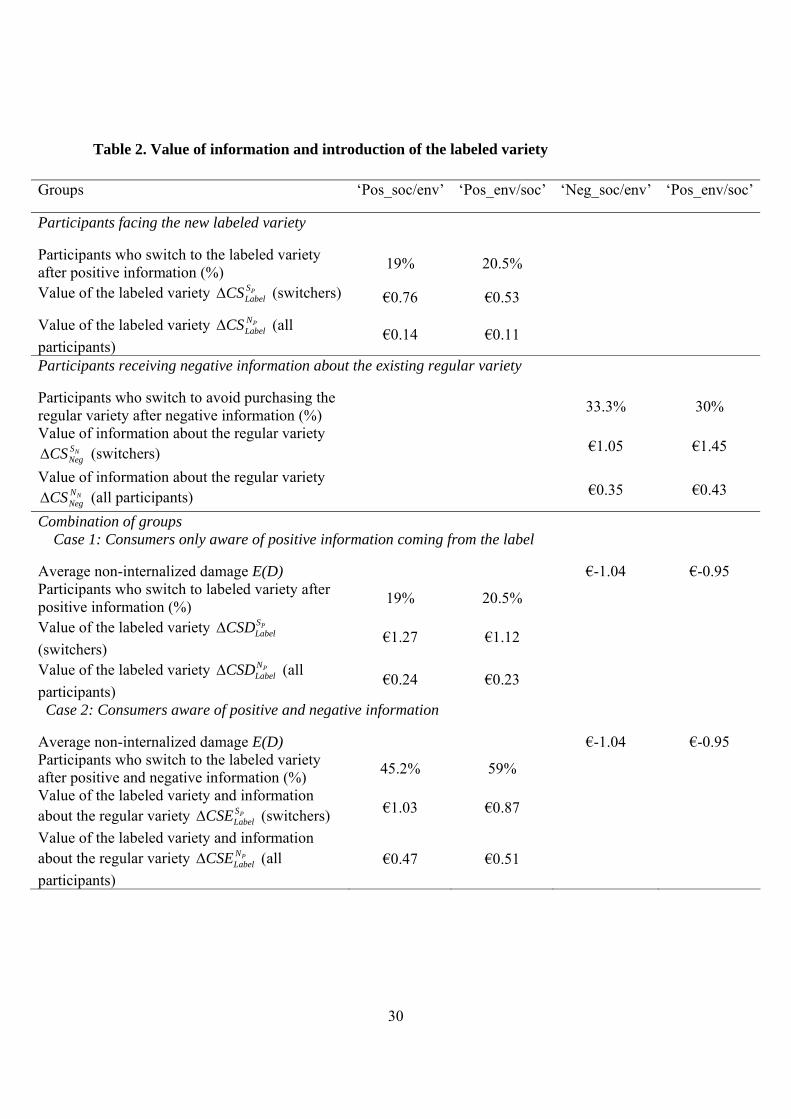
All these measures indicating the value of information (or the welfare variation linked to
more complete information) lead to the following results presented in table 2. Based on
observations across several supermarkets, we use PR = €2.2 and a price premium equal to 25%
for the varieties with a label leading to PL = €2.75 (Hervieu, 2009).11
11 Hervieu (2009) emphasizes that environmentally friendly shrimp production requires 25% more work than regular
shrimps, which leads us to assume a price increase equal to 25%. Since fair trade shrimps are not available in
France, we assume that the price premium for such shrimps is similar to the one observed for environmentally
friendly shrimps.

21
The first three lines of table 2 measure the value of information as in previous papers by
focusing on positive information related to the labeled variety. Lines 4-6 measure the value of
negative information linked to the regular variety. The welfare variation linked to the revelation
of negative information is higher than the one observed when positive information is revealed.
This result comes from the higher number of switchers stopping consumption of the regular
variety when negative information is revealed. It shows the importance of taking into account the
non-internalized damage coming from the regular variety when measuring the value of
information.
Results based on the combination of positive and negative information are presented in
the bottom part of table 2. Recall that negative information comes from the average damage E(D)
for which participants are aware or not. Case 2 corresponds to the situation of perfect
information. Both cases 1 and 2 show a relative large value of information, which is higher than
that observed when only positive information related to the labeled variety is accounted for.
Thus, by focusing only on information related to the new (labeled) variety, previous welfare
measures underestimate the value of information. Robust evaluations need to combine both
negative and positive information. Interestingly, our results also show that the two average
values of information over all participants given in the last line of table 2 are relatively high
compared to a price PR = €2.2 considered for the estimations of the surplus variation coming
from information. This suggests a high-social benefit linked to the complete revelation of
information to consumers. This benefit should be compared to regulatory costs coming from
quality monitoring and advertising efforts.
Insert table 2 here
Moreover, fully revealing negative and positive information generates higher WTP by
developed countries’ consumers that can be of benefit to producers from developing countries.
The results of the experiment could therefore be used to measure the increase in producers’
marginal income from a complete development of labels, where both labeled and regular
22
varieties would be offered everywhere in France. The simulation is as follows: In France, the
consumption of farmed tropical shrimps is 56,548,800 kg per year.12 To carry out the income
estimation, we consider the participants who switch to labeled varieties after the information
revelation. Among them, we distinguish the percentage x of participants who purchase the
regular variety before the label introduction and the percentage y of participants who do not
purchase shrimps before the label introduction. The income increase for producers comes from
these consumers changing varieties at a better price PL compared to PR and from the new
consumers purchasing goods at price PL. Ignoring any cost consideration the increase in
producers’ marginal income is defined by 56,548,800*[x*(PL - PR) + y* PL] and presented in
table 3. Negative information is not taken into account since this information is not widely
broadcasted compared to the labels. Although these estimations are imperfect, they show
significant increase in producers’ income that may cover additional label-sunk costs (not passed
into the price PL) and generate higher income compared to the existing situation.
Insert table 3 here
6. Conclusion
These results suggest that environmental and social labels have similar effects on participant
willingness-to-pay when it is first presented. However, we also highlight a fast-diminishing
interest in the second-presented characteristic. These results suggest (i) the importance of the
first/major information sent by advertising campaigns to consumers to signal new varieties, (ii)
the difficulties of developing added attributes for new varieties when one attribute dominates a
market and (iii) the possibilities of cumulating several labels to attract consumers with different
12 This volume is calculated by taking the total consumption of shrimps in France in 2008 and multiplying it by the
percentage of shrimps that are tropical (80%) and by the percentage of farmed shrimps (60%). Statistics sources:
FranceAgriMer (2008) and United Nations Food and Agriculture Organization (2009).
23
priorities regarding the conditions of production and not consumers with utilities favoring added
attributes. It also means that farmers from developing countries should carefully consider the
type of labels they should use to improve quality and capture consumer WTP.
Using welfare variation from the environmentally friendly or fair trade labels, we also
show that the absence of negative information linked to the regular variety may lead to an
underestimation of the value of information associated with the label. The consumers’ choices
are distorted since negative information linked to the regular variety is not internalized by
consumers. The segment for products with labels could be expanded. This last result underlines
that the benefit of complete information in terms of welfare and profit variations could be high
not only for French consumers but also for shrimp producers developing high-quality products.
Improving the quality of agricultural products is one way to increase income in developing
countries, even if choosing the type of labels or the advertising strategy is challenging for these
producers.
Our application is simple and based on various assumptions. In real situations,
participants are limited in their ability to collect complete information about products, and they
may be confused about different labels. Moreover, the cost of building the reputation of a new
label indicating environmentally friendly and/or fair trade products needs to be taken into
account. Some extensions also could be considered for completing the results of this paper. An
experiment in some shrimp farms in Asian countries to find out producer willingness to invest in
high-quality/labeled products may suitably complete the analysis. A second extension of this
work could consist in investigating the psychological mechanisms that drive the WTP expressed
by consumers. Do environmental and social concerns appeal to the same type of motivations?
How do consumers perceive negative and positive information when it comes to ethical
consumption? A third extension could consist in deeply studying what information should be
delivered to consumers to consider them “well-informed” with thoughtful preferences. It is likely
to include both positive and negative information sources. A new experiment could then be used
24
for computing the value of not receiving information, of receiving positive information before
negative information, and of receiving negative information before positive information.
7. References
Andersen, S., Harrison, G.W., Lau, M.I., Rutström, E.E., 2006. Elicitation Using Multiple Price
List Formats. Experimental Economics 9(4), 383-405.
Ariely, D., 2000. Controlling the Information Flow: Effects on Consumers’ Decision Making and
Preferences. Journal of Consumer Research 27(2), 233-248.
Arnot, C., Boxall, P.C., Cash, S.B., 2006. Do Ethical Consumers Care About Price? A Revealed
Preference Analysis of Fair Trade Coffee Purchases. Canadian Journal of Agricultural
Economics 54(4), 555-565.
Bernard, J.C., Bernard, D.J., 2009. What Is It About Organic Milk? An Experimental Analysis.
American Journal of Agricultural Economics 91(3), 826-836.
Blend, J.R., van Ravenswaay, E.O., 1999. Measuring Consumer Demand for Ecolabeled Apples.
American Journal of Agricultural Economics 81(5), 1072-1077.
Bougherara, D., Combris, P., 2009. Eco-labelled Food Products: What are Consumers Paying
for? European Review of Agricultural Economics 36(3), 321-341.
Camerer, C., Hogarth, R., 1999. The Effects of Financial Incentives in Experiments: A Review
and Capital-Labor-Production Framework. Journal of Risk and Uncertainty 19(1-3), 7-42.
Foster, W., Just, R.E., 1989. Measuring Welfare Effects of Product Contamination with
Consumer Uncertainty. Journal of Environmental Economics and Management 17(3), 266-
283.
Fox, J.A., Hayes, D.J., Shogren, J.F., 2002. Consumer Preferences for Food Irradiation: How
Favorable and Unfavorable Descriptions Affect Preferences for Irradiated Pork in
Experimental Auctions. Journal of Risk and Uncertainty 24(1), 75-95.
25
FranceAgriMer, 2008. Bilan Annuel 2008 – Consommation des Produits de la Pêche et de
l’Aquaculture. Montreuil-sous-Bois: Direction Marchés, Etudes et Prospective.
Gifford, K., Bernard, J.C., 2004. The Impact of Message Framing on Organic Food Purchase
Likelihood. Journal of Food Distribution Research 35(3), 19-28.
Hayes, D.J., Shogren, J.F., Youll Shin, S., Kliebenstein, J.B., 1995. Valuing Food Safety in
Experimental Auction Markets. American Journal of Agricultural Economics 77(1), 40-53.
Hervieu, S. 2009. A Madagascar, la Seule Crevette d’Elevage Bio du Monde. Le Monde, April
1st, p.4.
Hoogland, C.T., de Boer, J., Boersema, J.J., 2007. Food and sustainability: Do consumers
recognize, understand and value on-package information on production standards? Appetite
49(1), 47-57.
Huffman, W.E., Rousu, M.C., Shogren, J.F., Tegene, A., 2003. The Public Good Value of
Information from Agribusinesses on Genetically Modified Foods. American Journal of
Agricultural Economics 85(5), 1309-1315.
Huffman, W.E., Rousu, M.C., Shogren, J.F., Tegene, A., 2007. The Effects of Prior Beliefs and
Learning on Consumers’ Acceptance of Genetically Modified Foods. Journal of Economic
Behavior & Organization 63(1), 193-206.
Loureiro, M.L., Lotade, J., 2005. Do Fair Trade and Eco-labels in Coffee Wake up the Consumer
Conscience? Ecological Economics 53(1), 129-138.
Loureiro, M.L., McCluskey, J.J., Mittelhammer, R.C., 2001. Assessing Consumer Preferences
for Organic, Eco-labeled and Regular Apples. Journal of Agricultural and Resource
Economics 26(2), 404-416.
Lusk, J.L., House, L.O., Valli, C., Jaeger, S.R., Moore, M., Morrow, B., Traill, W.B., 2005.
Consumer Welfare Effects of Introducing and Labeling Genetically Modified Food.
Economics Letters 88(3), 382-388.

26
Lusk, J.L., Marette, S., 2010. Welfare Effects of Food Labels and Bans with Alternative
Willingness to Pay Measures. Applied Economic Perspectives and Policy 32(2), 319-337.
Lusk, J.L., Schroeder, T.C., 2004. Are Choice Experiments Incentive Compatible : A Test with
Quality Differentiated Beef Steaks. American Journal of Agricultural Economics 86(2), 467-
482.
Marette, S., Roosen, J., Bieberstein, A., Blanchemanche, S., Vandermoere, F., 2009. Impact of
Environmental, Societal and Health Information on Consumers’ Choices for Nanofood.
Journal of Agricultural & Food Industrial Organization 7(2), Article 11.
Nimon, W., Beghin, J.C., 1999. Are Eco-Labels Valuable? Evidence from the Apparel Industry.
American Journal of Agricultural Economics 81(4), 801-811.
Rousu, M.C., Huffman, W.E., Shogren, J.F., Tegene, A., 2004. Estimating the Public Value of
Conflicting Information: The Case of Genetically Modified Foods. Land Economics 80(1),
125-135.
Rousu, M.C., Huffman, W.E., Shogren, J.F., Tegene, A., 2007. Effects and Value of Verifiable
Information in a Controversial Market: Evidence from Lab Auctions of Genetically Modified
Food. Economic Inquiry 45(3), 409-432.
Rousu, M.C., Lusk, J.L., 2009. Valuing Information on GM Foods in a WTA Market: What
Information is Most Valuable? AgBioForum 12(2), 226-231.
Sasaki, T.D., Becker, V., Janssen, M.A., Neel, R., 2011. Does Greater Product Information
Actually Inform Consumer Decisions? The Relationship between Product Information
Quantity and Diversity of Consumer Decisions. Journal of Economic Psychology 32(3), 391-
398.
Teisl, M.F., Bockstael, N.E., Levy, A., 2001. Measuring the Welfare Effects of Nutrition
Information. American Journal of Agricultural Economics 83(1), 133-149.
United Nations Food and Agriculture Organization, 2009. Fisheries Statistical Collections –
Global Production. Rome.

27
Wansink, B., Sonka, S.T., Hasler, C.M., 2004. Front-label Health Claims: When Less is More.
Food Policy 29(6), 659-667.
Wessells, C.R., Johnston, R.J., Donath, H., 1999. Assessing Consumer Preferences for
Ecolabeled Seafood: The Influence of Species, Certifier, and Household Attributes.
American Journal of Agricultural Economics 81(5), 1084-1089.
World Bank, 2001. Shrimp Farming and the Environment – Can Shrimp Farming Be Undertaken
Sustainably? Washington, DC.
28
Table 1. Influence of information and individual characteristics on WTP differences
Model (1) (2) (3) (4) (5)
Dependent variable Difference in WTP between choice #i+1 and #i
( ij
ij WTPWTP 1 )
Specification Panel random effects
0: male 0: no
children Characteristic
1: female1:
children Positive information (0/1) 0.53a (0.12) Negative information (0/1) -0.29a (0.11) Positive x social info. (0/1) 0.45a (0.15) Positive x social x 1st info. (0/1) 0.97a (0.19) Positive x social x 1st info. (0/1) x characteristic = 0 1.00a 0.90a (0.22) (0.21) Positive x social x 1st info. (0/1) x characteristic = 1 0.93a 1.20a (0.29) (0.34) Positive x social x 2nd info. (0/1) -0.11 (0.19) Positive x social x 2nd info. (0/1) x characteristic = 0 -0.31 -0.07 (0.29) (0.22) Positive x social x 2nd info. (0/1) x characteristic = 1 0.01 -0.20 (0.24) (0.32) Positive x environmental info. (0/1) 0.61a (0.15) Positive. x envir. x 1st info. (0/1) 0.99a (0.19) Positive x envir. x 1st info. (0/1) x characteristic = 0 1.14a 1.10a (0.29) (0.22) Positive x envir. x 1st info. (0/1) x characteristic = 1 0.90a 0.74b (0.24) (0.32) Positive x envir. x 2nd info. (0/1) 0.26 (0.19) Positive x envir. x 2nd info. (0/1) x characteristic = 0 0.29 0.26 (0.22) (0.21) Positive x envir. x 2nd info. (0/1) x characteristic = 1 0.21 0.26 (0.29) (0.34) Negative x social info. (0/1) -0.10 (0.15) Negative x social x 1st info. (0/1) -0.23
29
(0.19) Negative x social x 1st info. (0/1) x characteristic = 0 -0.15 -0.40c (0.26) (0.24) Negative x social x 1st info. (0/1) x characteristic = 1 -0.31 0.04 (0.26) (0.29) Negative x social x 2nd info. (0/1) 0.03 (0.19) Negative x social x 2nd info. (0/1) x characteristic = 0 -0.07 -0.12 (0.32) (0.22) Negative x social x 2nd info. (0/1) x characteristic = 1 0.07 0.39 (0.22) (0.32) Negative x environmental info. (0/1) 0.10 (0.15) Negative. x envir. x 1st info. (0/1) -0.10 (0.19) Negative x envir. x 1st info. (0/1) x characteristic = 0 -0.28 0.02 (0.32) (0.22) Negative x envir. x 1st info. (0/1) x characteristic = 1 -0.02 -0.36 (0.22) (0.32) Negative. x envir. x 2nd info. (0/1) 0.30 (0.19) Negative x envir. x 2nd info. (0/1) x characteristic = 0 0.36 0.29 (0.26) (0.24) Negative x envir. x 2nd info. (0/1) x characteristic = 1 0.24 0.31 (0.26) (0.29) Negative x safety info (0/1) -0.58a -0.58a (0.12) (0.12) Negative x safety info. (0/1) x characteristic = 0 -0.71a -0.55a (0.15) (0.13) Negative x safety info. (0/1) x characteristic = 1 -0.48a -0.65a (0.14) (0.17) Observations 640 640 640 640 640 Pseudo-R² 0.084 0.118 0.162 0.168 0.171
a, b and c: significant at 1%, 5% and 10% respectively. Standard errors in parentheses.
30
Table 2. Value of information and introduction of the labeled variety
Groups ‘Pos_soc/env’ ‘Pos_env/soc’ ‘Neg_soc/env’ ‘Pos_env/soc’
Participants facing the new labeled variety
Participants who switch to the labeled variety after positive information (%)
19% 20.5%
Value of the labeled variety PSLabelCS (switchers) €0.76 €0.53
Value of the labeled variety PNLabelCS (all
participants) €0.14 €0.11
Participants receiving negative information about the existing regular variety
Participants who switch to avoid purchasing the regular variety after negative information (%)
33.3% 30%
Value of information about the regular variety NS
NegCS (switchers) €1.05 €1.45
Value of information about the regular variety NN
NegCS (all participants) €0.35 €0.43
Combination of groups Case 1: Consumers only aware of positive information coming from the label
Average non-internalized damage E(D) €-1.04 €-0.95 Participants who switch to labeled variety after positive information (%)
19% 20.5%
Value of the labeled variety PSLabelCSD
(switchers) €1.27 €1.12
Value of the labeled variety PNLabelCSD (all
participants) €0.24 €0.23
Case 2: Consumers aware of positive and negative information
Average non-internalized damage E(D) €-1.04 €-0.95 Participants who switch to the labeled variety after positive and negative information (%)
45.2% 59%
Value of the labeled variety and information about the regular variety PS
LabelCSE (switchers) €1.03 €0.87
Value of the labeled variety and information about the regular variety PN
LabelCSE (all
participants) €0.47 €0.51

31
Table 3. Income increase for producers (%)a
Information revealed by the label
Positive
& social
information
Positive &
environmental
information
Participants who switch to labeled varieties 19% 20.5%
Purchasing the regular variety before the label
Not purchasing shrimps before the label
9.5%
9.5%
12.8%
7.7%
Increase in producers’ marginal income 14% 11%
a: relative variation (%) compared to the total income for year without any label.
32
a: group ironmentSocial_Env
PositiveInfo includes 42 participants; group
Social_tEnvironmen
PositiveInfo : 39 participants; group
ironmentSocial_Env
NegativeInfo : 39 participants; group
Social_tEnvironmen
NegativeInfo : 40 participants.
Figure 1: Experimental designa
33
Short info.Environ. & socialconditions
Safety risk
Average WTP for shrimpswith labels for group ‘Pos_soc/env’
Average WTP for shrimpswith labels for group ‘Pos_env/soc’
Safety riskFair Trade Environmentallyfriendly
Fair TradeEnvironmentallyfriendly
1.36(1.51)
2.79(1.13)
2.77(1.14)
2.04(1.18)
2.20(1.14)
0
0.5
1
1.5
2
2.5
3
1 2 3 4 5
∆*** ∆***
1.29(1.45)
2.50(1.34)
2.85(1.07)
2.10(1.27)
2.35(1.11)
0
0.5
1
1.5
2
2.5
3
1 2 3 4 5
∆*** ∆***
Short info.Environ. & socialconditions
Negative InfoSocial condit.
Negative InfoEnvironment
Safety risk
Average WTP for shrimpswithout labels for group ‘Neg_soc/env’
Average WTP for shrimpswithout labels for group ‘Neg_env/soc’
Safety riskNegative InfoSocial condit.
Negative InfoEnvironment
Short info.Environ. & social conditions
Short info.Environ. & socialconditions
2.12(1.03)
1.77(1.18)
1.29(1.28)
1.35(1.35)
1.02(1.35)
0
0.5
1
1.5
2
2.5
1 2 3 4 5
∆** ∆*∆*
1.91(1.19)
1.36(1.44)
1.70(1.38)
1.15(1.47)
0.86(1.40)
0
0.5
1
1.5
2
2.5
1 2 3 4 5
Figure 2. Impact of information on WTP (€/100g)a
a: ∆***, ∆** and ∆* denote significant differences at the 1%, 5% and 10% level respectively as tested by the
Wilcoxon test for comparing paired samples.
34
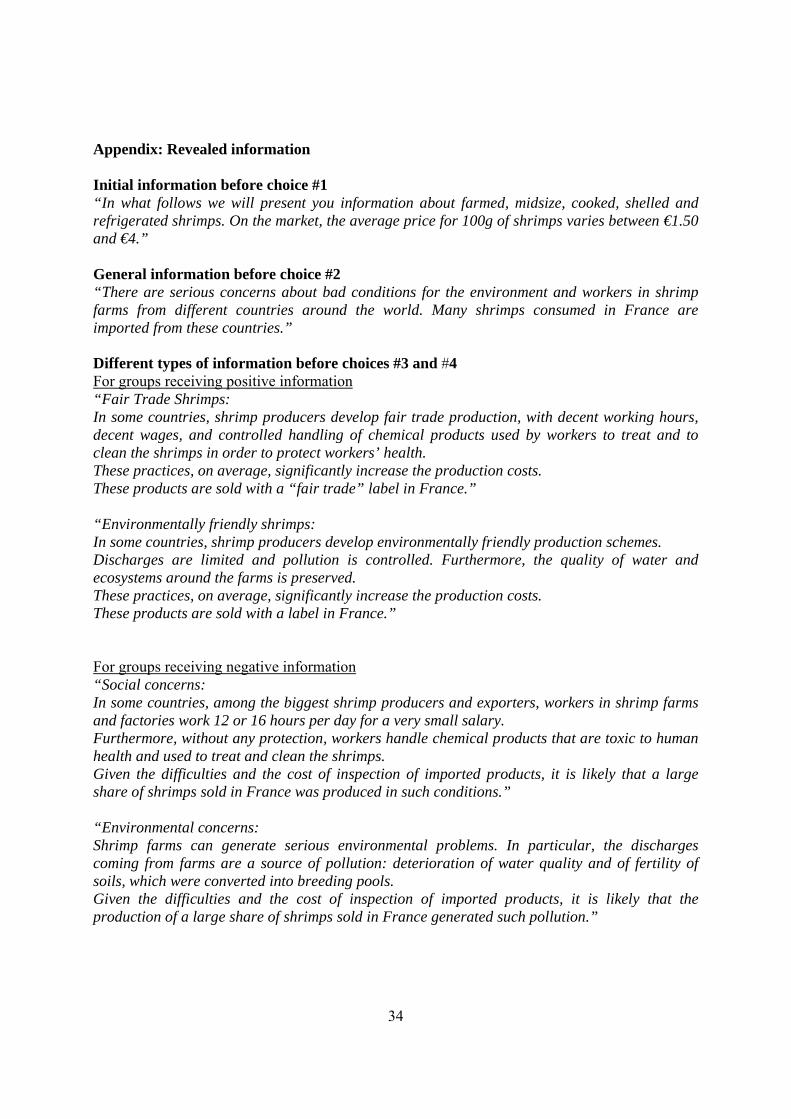
Appendix: Revealed information Initial information before choice #1 “In what follows we will present you information about farmed, midsize, cooked, shelled and refrigerated shrimps. On the market, the average price for 100g of shrimps varies between €1.50 and €4.” General information before choice #2 “There are serious concerns about bad conditions for the environment and workers in shrimp farms from different countries around the world. Many shrimps consumed in France are imported from these countries.” Different types of information before choices #3 and #4 For groups receiving positive information “Fair Trade Shrimps: In some countries, shrimp producers develop fair trade production, with decent working hours, decent wages, and controlled handling of chemical products used by workers to treat and to clean the shrimps in order to protect workers’ health. These practices, on average, significantly increase the production costs. These products are sold with a “fair trade” label in France.” “Environmentally friendly shrimps: In some countries, shrimp producers develop environmentally friendly production schemes. Discharges are limited and pollution is controlled. Furthermore, the quality of water and ecosystems around the farms is preserved. These practices, on average, significantly increase the production costs. These products are sold with a label in France.” For groups receiving negative information “Social concerns: In some countries, among the biggest shrimp producers and exporters, workers in shrimp farms and factories work 12 or 16 hours per day for a very small salary. Furthermore, without any protection, workers handle chemical products that are toxic to human health and used to treat and clean the shrimps. Given the difficulties and the cost of inspection of imported products, it is likely that a large share of shrimps sold in France was produced in such conditions.” “Environmental concerns: Shrimp farms can generate serious environmental problems. In particular, the discharges coming from farms are a source of pollution: deterioration of water quality and of fertility of soils, which were converted into breeding pools. Given the difficulties and the cost of inspection of imported products, it is likely that the production of a large share of shrimps sold in France generated such pollution.”
35
Information before choice #5 “Health concerns: Many bacteriological infections affect shrimp breeding pools. The bad production conditions (bad water quality for example) favor the growth of bacteria. To fight against these bacteria, the shrimp producers use antibiotics and other chemical products that are toxic to human health and therefore forbidden in almost all countries. Given the difficulties and the cost of inspection of imported products, it is likely that some shrimps sold in France were treated with these antibiotics and chemical products toxic to human health.”
Related Documents