Introduction Since August 2007, approximately 40 banks, a major insurance company, government sponsored enterprises (Fannie Mae and Freddie Mac), and several investment banks have either failed or required substantial government assistance. 2 Still, the financial crisis has yet to show signs of coming to an end. One may wonder, how did problems that first manifested in a relatively small part of the mortgage market lead to a contagion affecting other types of credit including credit cards, student loans, and others, and then quickly spread to threaten the liquidity and possible solvency of many financial institutions around the world? There is no easy answer to this question, but as the crisis unfolds, there are several possible explanatory factors. In this article, we examine the problems in the mortgage markets and the subsequent contagion that led to the current credit crisis, and provide a critical analysis of the possible contributing factors. 1 We would like to thank Robert Mackay for his helpful suggestions. Anmol Sinha, Max Egan, Sungi Lee, and Jesse Mark provided excellent research assistance. All errors are ours. 2 See the FDIC’s “Failed Bank List,” see: http://www.fdic.gov/bank/individual/failed/banklist.html. This paper has been published in the Journal of Structured Finance, Spring 2009. Previous topics in this subprime lending series include: n The Subprime Meltdown: A Primer n Understanding Accounting- Related Allegations n Subprime Securities Litigation: Key Players, Rising Stakes, and Emerging Trends n The Use of Economic Analysis in Predatory Lending Cases: Application to Subprime Loans 19 February 2009 How Did We Get Here? The Story of the Credit Crisis Part V of A NERA Insights Series By Dr. Faten Sabry and Dr. Chudozie Okongwu 1

Welcome message from author
This document is posted to help you gain knowledge. Please leave a comment to let me know what you think about it! Share it to your friends and learn new things together.
Transcript
Introduction
Since August 2007, approximately 40 banks, a major insurance company, government
sponsored enterprises (Fannie Mae and Freddie Mac), and several investment banks have
either failed or required substantial government assistance.2 Still, the financial crisis has yet to
show signs of coming to an end. One may wonder, how did problems that first manifested
in a relatively small part of the mortgage market lead to a contagion affecting other types of
credit including credit cards, student loans, and others, and then quickly spread to threaten the
liquidity and possible solvency of many financial institutions around the world?
There is no easy answer to this question, but as the crisis unfolds, there are several possible
explanatory factors. In this article, we examine the problems in the mortgage markets and the
subsequent contagion that led to the current credit crisis, and provide a critical analysis of the
possible contributing factors.
1 We would like to thank Robert Mackay for his helpful suggestions. Anmol Sinha, Max Egan, Sungi Lee, and
Jesse Mark provided excellent research assistance. All errors are ours.
2 See the FDIC’s “Failed Bank List,” see: http://www.fdic.gov/bank/individual/failed/banklist.html.
This paper has been
published in the Journal
of Structured Finance,
Spring 2009.
Previous topics in this
subprime lending series
include:
n The Subprime Meltdown:
A Primer
n Understanding Accounting-
Related Allegations
n Subprime Securities Litigation:
Key Players, Rising Stakes,
and Emerging Trends
n The Use of Economic Analysis
in Predatory Lending Cases:
Application to Subprime Loans
19 February 2009
How Did We Get Here?The Story of the Credit CrisisPart V of A NERA Insights Series
By Dr. Faten Sabry and Dr. Chudozie Okongwu1

2 www.nera.com
Figure 1. 1-Month Treasury Bill Rates Daily Data from 2 January 2007 through 17 September 2008
0.0
1.0
2.0
3.0
4.0
5.0
6.0
Jan-07 Mar-07 May-07 Jul-07 Sep-07 Nov-07 Jan-08 Mar-08 May-08 Jul-08 Sep-08
1-M
onth
US
T-Bi
ll Ra
te (%
)
Notes and Sources:
All data are obtained from the Federal Reserve.
The 17 September 2008 drop to 0.07% represents the lowest US Treasury yield since 1941 (Financial Times).
17 August 2007:Countrywide borrowsover $11 billion asbankruptcy fears grow.
16 March 2008:JPMorgan Chase & Co. acquires Bear Stearns.
17 September 2008:The Federal Reserve provides an emergencyloan to AIG.
8 September 2008:The federal governmenttakes over Fannie Mae and Freddie Mac.
15 September 2008:Lehman Brothers Holdings Inc. files for bankruptcy.
As we write this article, the S&P has been oscillating through a wide range, lending remains
anemic, and most of the major economies have now entered recession. On 17 September
2008, the yield on the 1-month Treasury bills dropped to almost zero, 0.07 percent to be
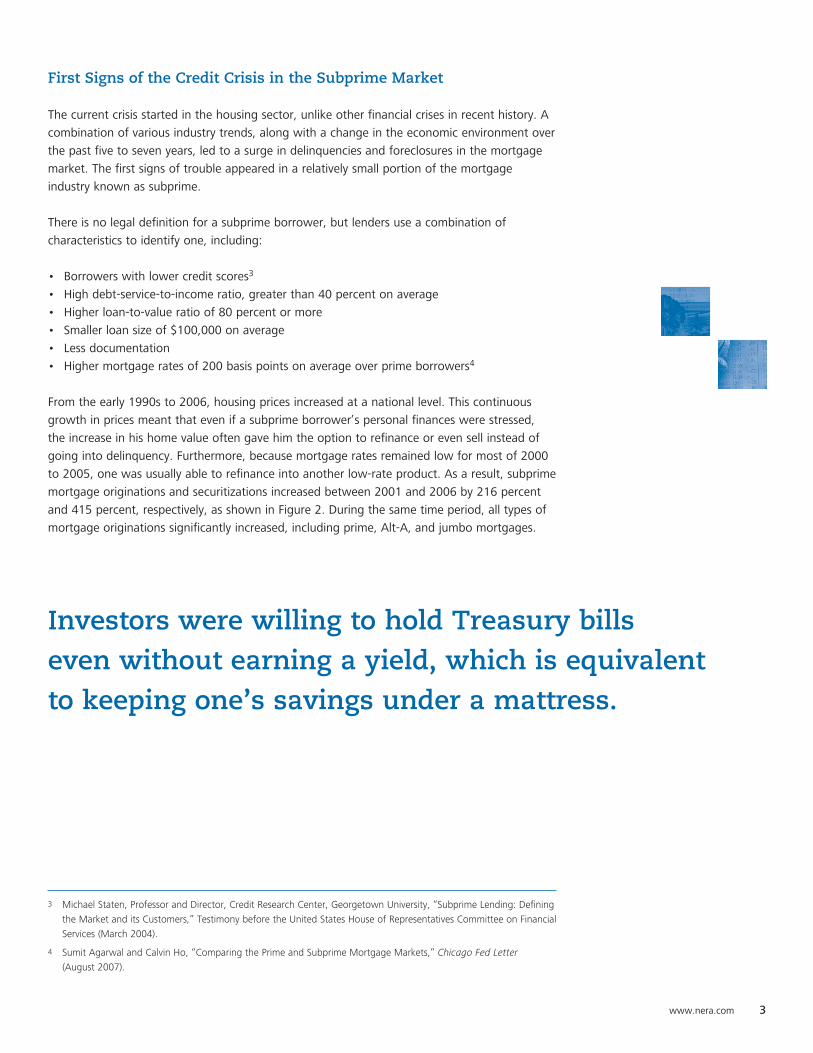
exact, a rate unseen since 1941. Investors were willing to hold Treasury bills even without
earning a yield, which is equivalent to keeping one’s savings under a mattress. The yield
on Treasury bills has been declining since January 2007 and dipped significantly around the
collapse of Bear Stearns in March 2008 and then again in September, as illustrated in Figure 1.
This level of market stress indicates extreme risk aversion and the extent of the current panic.
www.nera.com 3
3 Michael Staten, Professor and Director, Credit Research Center, Georgetown University, “Subprime Lending: Defining
the Market and its Customers,” Testimony before the United States House of Representatives Committee on Financial
Services (March 2004).
4 Sumit Agarwal and Calvin Ho, “Comparing the Prime and Subprime Mortgage Markets,” Chicago Fed Letter
(August 2007).
First Signs of the Credit Crisis in the Subprime Market
The current crisis started in the housing sector, unlike other financial crises in recent history. A
combination of various industry trends, along with a change in the economic environment over
the past five to seven years, led to a surge in delinquencies and foreclosures in the mortgage
market. The first signs of trouble appeared in a relatively small portion of the mortgage
industry known as subprime.
There is no legal definition for a subprime borrower, but lenders use a combination of
characteristics to identify one, including:
• Borrowerswithlowercreditscores3
• Highdebt-service-to-incomeratio,greaterthan40percentonaverage
• Higherloan-to-valueratioof80percentormore
• Smallerloansizeof$100,000onaverage
• Lessdocumentation
• Highermortgageratesof200basispointsonaverageoverprimeborrowers4
From the early 1990s to 2006, housing prices increased at a national level. This continuous
growth in prices meant that even if a subprime borrower’s personal finances were stressed,
the increase in his home value often gave him the option to refinance or even sell instead of
going into delinquency. Furthermore, because mortgage rates remained low for most of 2000
to 2005, one was usually able to refinance into another low-rate product. As a result, subprime
mortgage originations and securitizations increased between 2001 and 2006 by 216 percent
and 415 percent, respectively, as shown in Figure 2. During the same time period, all types of
mortgage originations significantly increased, including prime, Alt-A, and jumbo mortgages.
Investors were willing to hold Treasury bills even without earning a yield, which is equivalent to keeping one’s savings under a mattress.

4 www.nera.com
Figure 2. Subprime Mortgage Originations and MBS Issuance Annual Data from 2001 through 2006
0
100
200
300
400
500
600
700
Val
ue ($
bill
ions
)
Subprime Mortgage Originations Subprime MBS Issuance
Source: Adam Ashcraft and Til Schuermann, "Understanding the Securitization of Subprime Mortgage Credit."
Wharton Financial Institutions Center Working Paper No. 07-43; Federal Reserve Board of New York Staff
Report No. 318 (March 2008).
2001 2002 2003 2004 2005 2006
An estimated 80 percent of subprime borrowers received ARM or hybrid loans.

www.nera.com 5
5 Susan Wachter, Professor, University of Pennsylvania’s Wharton School of Business, see: http://www.npr.org/
templates/story/story.php?storyId=9096735.
6 Beginning in June 2004, the Federal Open Market Committee (FOMC) raised the target federal funds rate 17
consecutive times until September 2007.
Factors Leading to the Deterioration of Mortgages
The use of adjustable rate mortgages (ARMs), particularly for subprime borrowers, has
increased in recent years. An estimated 80 percent of subprime borrowers received ARM or
hybrid loans.5 An example of these types of loans is the so-called “2/28.” These are loans that
are sold at fixed low rates for two years and then the mortgage rate adjusts upwards. The
ability to refinance after the two years becomes especially important for subprime borrowers
who rely on the increase in the value of their houses to be able to roll into another mortgage.
However,interestratesstartedtorisein2004,andwhencombinedwiththedecelerationand
eventual decline in housing prices, this meant that subprime borrowers—ones with poor credit
history by definition—were the first to feel the impact.6 Subprime borrowers could no longer
rely on low mortgage rates and rising home prices to provide them with the opportunity
to refinance in order to extract equity or to sell at a profit. In fact, for many, the increasing
interest rate environment meant an increase in debt service. As a result of these factors, many
subprime borrowers began to have difficulty meeting their mortgage obligations, resulting in
higher rates of delinquencies and foreclosures.
Although the problem manifested itself first in the subprime sector, we now know that
delinquencies and foreclosures of prime loans have also soared. Several factors contributed
to the credit deterioration in the mortgage sector, including: 1) relatively lax underwriting
standards in recent years; 2) increased indebtedness on the part of homeowners; 3) the
combination, described above, of the availability of cheap credit and increasing housing prices
during the years 2000 to 2005; and 4) the increase in the use of non-traditional mortgage
products. These factors were not specific to subprime borrowers but affected all types of
borrowers, leading to a full blown credit crisis, as we will discuss later. In the remainder of this
section, we will discuss each of these factors in more detail.

6 www.nera.com
Relatively Lax Underwriting Standards in Recent Years
According to annual surveys conducted by the Office of the Comptroller of the Currency (OCC),
credit underwriting standards were eased during the years 2004 to 2006, as shown in Figure 3.
The OCC surveyed the examiners of the largest 78 national banks regarding their assessment of
the conditions under which credit was extended. The percentage of responders easing lending
standards that year rose from 3 percent in 2002 to 28 percent in 2006, while those keeping
lending standards the same that year rose from 56 to 65 percent during the same period. The
survey is not specific to subprime lending; rather, it focuses on broader underwriting standards.
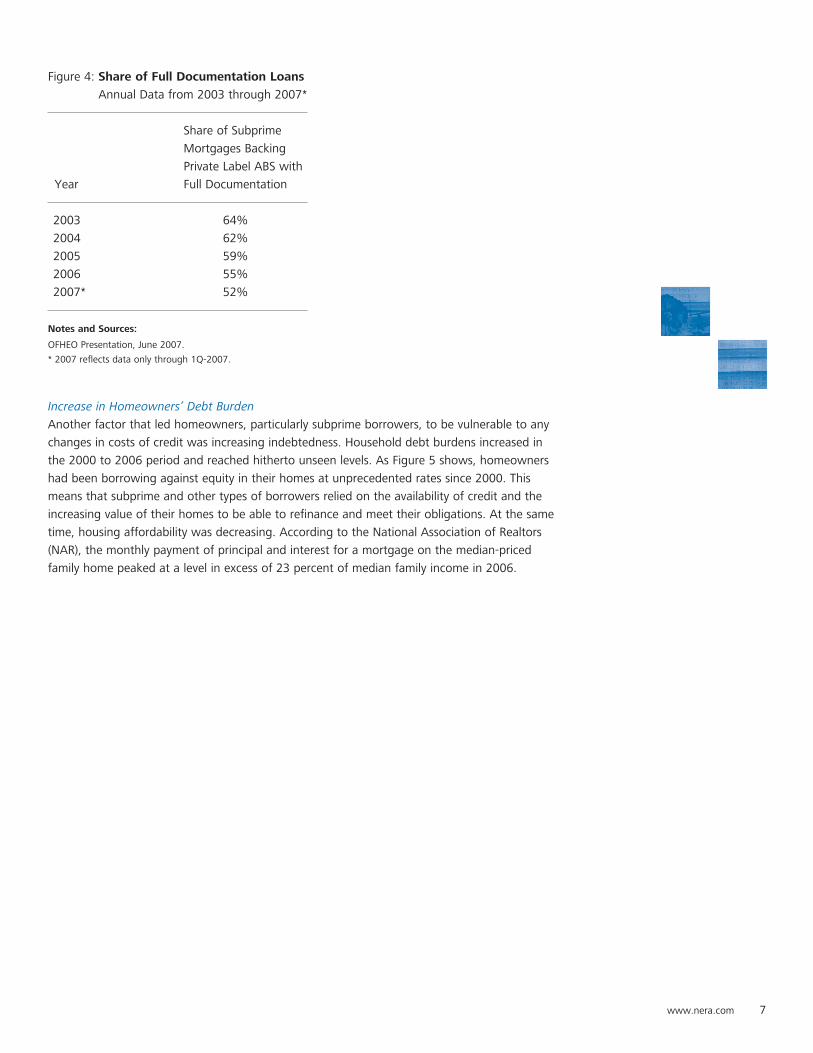
Similarly, the percentage of loans with full documentation was in decline during the same time
period, as illustrated in Figure 4.
Figure 3. Changes in Retail Credit Underwriting Standards Annual Data from 1999 through 2007
0
10
20
30
40
50
60
70
80
90
100
1999 2000 2001 2002 2003 2004 2005 2006 2007
Perc
ent
of B
anks
Sur
veye
d
Source: 2007 Survey of Credit Underwriting Practice, Office of the Comptroller of the Currency
Eased TightenedNo Change
www.nera.com 7
Figure 4: Share of Full Documentation Loans
Annual Data from 2003 through 2007*
Share of Subprime
Mortgages Backing
Private Label ABS with
Year Full Documentation
2003 64%
2004 62%
2005 59%
2006 55%
2007* 52%
Notes and Sources:
OFHEOPresentation,June2007.
* 2007 reflects data only through 1Q-2007.
Increase in Homeowners’ Debt Burden
Another factor that led homeowners, particularly subprime borrowers, to be vulnerable to any
changesincostsofcreditwasincreasingindebtedness.Householddebtburdensincreasedin
the 2000 to 2006 period and reached hitherto unseen levels. As Figure 5 shows, homeowners
had been borrowing against equity in their homes at unprecedented rates since 2000. This
means that subprime and other types of borrowers relied on the availability of credit and the
increasing value of their homes to be able to refinance and meet their obligations. At the same
time, housing affordability was decreasing. According to the National Association of Realtors
(NAR), the monthly payment of principal and interest for a mortgage on the median-priced
family home peaked at a level in excess of 23 percent of median family income in 2006.

8 www.nera.com
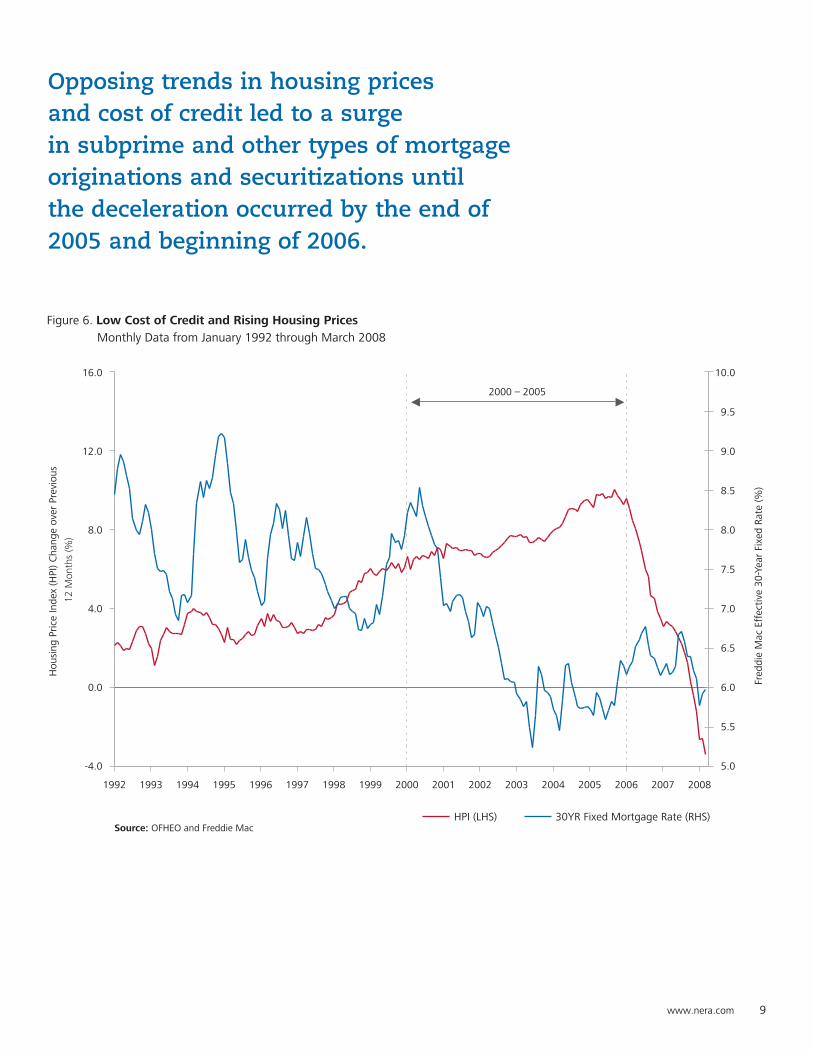
Combination of Low Cost of Credit and Increasing Housing Prices during the
Period 2000 to 2005
The increase in housing prices and the decline in the cost of credit made the prospect of
getting a mortgage seem less risky since the options of refinancing or selling the house were
both viewed as viable. As shown in Figure 6, the opposing trends in housing prices and cost of
credit are evident during the period 2000 to 2005. This led to a surge in subprime and other
types of mortgage originations and securitizations until the deceleration occurred by the end of
2005 and beginning of 2006.
Figure 5. Gross Equity Extraction Increased Significantly Since 2000 Annual Data from 1991 through 2005
Sources: Alan Greenspan and James Kennedy, "Sources and Uses of Equity Extracted from Homes,"
Finance and Economics Discussion Series, Federal Reserve Board, 2007.
0
100
200
300
400
500
600
700
800
900
1,000
1991 1992 1993 1994 1995 1996 1997 1998 1999 2000 2001 2002 2003 2004 2005
Borr
owin
g A
gain
st H
ome
Equi
ty ($
bill
ion)
www.nera.com 9
Figure 6. Low Cost of Credit and Rising Housing Prices Monthly Data from January 1992 through March 2008
Source: OFHEO and Freddie Mac
-4.0
0.0
4.0
8.0
12.0
16.0
1992 1993 1994 1995 1996 1997 1998 1999 2000 2001 2002 2003 2004 2005 2006 2007 2008
Hou
sing
Pric
e In
dex
(HPI
) Cha
nge
over
Pre
viou
s
12 M
onth
s (%
)
5.0
5.5
6.0
6.5
7.0
7.5
8.0
8.5
9.0
9.5
10.0
Fred
die
Mac
Eff
ectiv
e 30
-Yea
r Fi
xed
Rate
(%)
HPI (LHS) 30YR Fixed Mortgage Rate (RHS)
2000 – 2005
Opposing trends in housing prices and cost of credit led to a surge in subprime and other types of mortgage originations and securitizations until the deceleration occurred by the end of 2005 and beginning of 2006.

10 www.nera.com
Increase in the Use of Riskier Types of Non-Traditional Mortgage Products
In addition to the macroeconomic conditions, the same time period witnessed an increase
in the use of non-traditional mortgage products such as interest-only and negative amortization
loans.7 The latter types were not restricted to subprime borrowers, but were perceived
to be relatively riskier than the traditional mortgage products. Ben Bernanke, Chairman of the
Board of Governors of the Federal Reserve, discussed some of the risks associated with such
loans (2008):
[H]istorically,borrowerswithlittleornoequityhavebeensubstantiallymorelikelythan
others to fall behind in their payments. The large number of outstanding mortgages
with negative amortization features may exacerbate this problem.8
As illustrated in Figure 7, the share of interest-only/negative amortization mortgages increased
between 2001 and 2006, while the share of fully amortizing loans declined.
Figure 7. Share of Interest-Only/Negative Amortization Mortgages Have Increased in Non-Prime Originations Backing Private Label Securities Annual Data from 2001 through 2006
0
5
10
15
20
25
30
35
40
45
50
55
60
2001 2002 2003 2004 2005 2006
Perc
ent
of N
on-P
rime
Mor
tgag
e O
rigin
atio
ns B
acki
ng
Priv
ate
Labe
l Sec
uriti
es (%
)
Fully Amortizing ARMs Interest Only / Neg. Am. ARMs
Source: OFHEO, "Housing, Subprime, and GSE Reform: Where Are We Headed?" 18 July 2007
7 An interest-only loan is a loan in which, for a set term, the borrower pays only the interest on the principal balance,
while the principal balance remains unchanged. A negative amortization loan refers to a loan structure in which
mortgage payments are lower than the interest rate on the mortgage and so the difference is added on to the initial
principal, thereby increasing the principal.
8 Ben Bernanke, Chairman of the Board of Governors of the Federal Reserve, “Reducing Preventable Mortgage
Foreclosures,” Speech at the Independent Community Bankers of America Annual Convention, Florida (March 2008).
www.nera.com 11
The Reversal in Housing Prices and Interest Rates
Starting in 2006, several analysts began noting the slowdown in the housing market.
Forexample,astudybytheFederalReserveinNovember2006noted,“[S]ignsofahousing
market slowdown are unmistakable. New and existing home sales have been declining
since mid-2005…”9
Figure 8 illustrates the housing bubble and when it burst using the Case-Shiller Index.10
Analysts have long maintained that housing prices are expected to move in tandem with rents
and building costs, a proposition that is supported by the data as far back as 1987. Starting
in early 2000, housing prices adjusted for inflation began to increase to levels far exceeding the
trends in rent and building costs. This deviation from fundamentals—often regarded as a sign
of an asset bubble—peaked in 2005 and began to reverse in 2006. The correction is still
in progress and is a key contributing factor to the current distress in the mortgage markets.
Around the same time period of 2004 to 2006, mortgage rates began to rise from their low
levels, thus hindering the growth in originations and refinancing activities. As these alternatives
started to disappear, delinquencies and foreclosures began to surge.
9 John Duca, “Making Sense of the US Housing Slowdown,” Economic Letter—Insights from the Federal Reserve Bank
of Dallas, Vol. 1, No. 11 (November 2006).
10 The S&P Case-Shiller US National Home Price Index tracks the value of single family housing in the US and measures
changes in housing market prices given a constant level of quality—changes in the types, sizes, or physical
characteristics of the homes are specifically excluded. It utilizes a “repeat sales method” that only includes properties
that have sold at least twice, thereby capturing the true appreciated value of each specific sales unit.
Starting in early 2000, housing prices adjusted for inflation began to increase to levels far exceeding the trends in rent and building costs, a key contributing factor to the current distress in the mortgage markets.

12 www.nera.com
Figure 8. Real Home Prices vs. Real Rent and Real Building Costs Monthly Data from January 1987 through June 2008
60
80
100
120
140
160
180
200
1987 1990 1993 1996 1999 2002 2005 2008
Inde
x (J
an. 1
987
= 10
0)
S&P Case-Shiller HPI All Building Construction Cost Index Owners' Equivalent Rent*
Real Home Prices
Real Building Costs
Real Rent
Notes and Sources:
Data are from Federal Reserve Bank of St. Louis, Bloomberg, LP, Standard & Poor's, Bureau of Labor Statistics.
Monthly data were first adjusted by CPI and then rescaled to Jan. 1987=100.
* Owners' Equivalent Rent "measures the change in the implicit rent a homeowner would pay to rent, or would earn from renting, his or her home
in a competitive market" (see: http://www.bls.gov/cpi/cpifact6.htm).

www.nera.com 13
Figure 9. Prime and Subprime Delinquency Rates Quarterly Data from 1Q-2000 through 4Q-2007
Source: Bloomberg LP
1.5
1.7
1.9
2.1
2.3
2.5
2.7
2.9
3.1
3.3
3.5
2000 2001 2002 2003 2004 2005 2006 2007
Prim
e D
elin
quen
cy R
ate
(%)
8.0
9.0
10.0
11.0
12.0
13.0
14.0
15.0
16.0
17.0
18.0
Subp
rime
Del
inqu
ency
Rat
e (%
)
Prime (LHS) Subprime (RHS)
Signs of a Full Credit Crisis
In 2007, it became evident that the credit deterioration extended well beyond subprime
mortgages. Other collateral, including Alt-A and prime mortgages as well as credit cards,
automobile loans, and student loans, all showed declines in credit quality. Figure 9 shows the
surge in delinquency rates in both subprime and prime markets. This was consistent with the
size of consumers’ debt burdens, which surged in the fourth quarter of 2006 as measured by
theFederalReserve’sHouseholdDebtServiceRatio,definedas“theratioofdebtpaymentsto
disposable personal income.”11 See Figure 10.
11 The Federal Reserve, see: http://www.federalreserve.gov/releases/housedebt/.

14 www.nera.com
Figure 10. Household Debt Service Ratio Quarterly Data from 1Q-1985 through 2Q-2008
Source: Federal Reserve
10.0
10.5
11.0
11.5
12.0
12.5
13.0
13.5
14.0
14.5
15.0
1Q-1985 1Q-1987 1Q-1989 1Q-1991 1Q-1993 1Q-1995 1Q-1997 1Q-1999 1Q-2001 1Q-2003 1Q-2005 1Q-2007 2Q-2008
Hou
seho
ld D
ebt
Serv
ice
Ratio
(%)

www.nera.com 15
12 According to the International Swaps and Derivatives Association, Inc. (ISDA), the term “structured products” refers
to a variety of financial instruments that combine various cash assets and/or derivatives to provide a particular risk/
reward profile that allows investors access to broader investment opportunities. The return of a structured product
is usually derived from the performance of one or more underlying assets, including interest rates; a particular equity
or debt instrument; a basket of securities; a securities index or indices; an individual commodity or commodities;
a commodities index; an individual currency or currency basket; creditworthiness of a security or basket of securities;
or any combination thereof.
13 See The Handbook of Mortgage-Backed Securities, Frank J. Fabozzi, ed. (New York: McGraw-Hill, 2006), for a
detailed description of the securitization process.
The Role of Structured Finance
There is a controversy over the role of structured finance and other financial products in the
crisis and whether innovation may have served to magnify its impact.12 In this section, we will
briefly describe the role of various financial instruments with special emphasis on collateralized
debt obligations (CDOs), credit default swaps (CDS), structured investment vehicles (SIVs), and
the interrelationship of these with leverage and short-term borrowing. Many of these products
have been in existence for decades and have been used to increase liquidity and the availability
of credit in the financial markets. This section will focus on the conditions under which
securitized collateral may have magnified the exposure to, and losses from, the current crisis.
Securitization and Mortgage-Backed Securities
Securitization is the process of turning pools of financial obligations, whether they are
mortgages, credit cards, leases, or others, into securities. Since the early 1980s, securitization
has been a tool used to generate liquidity for lenders and to increase access to capital
for consumers and various corporations. The mortgage market is the largest to employ
securitization technology. In recent years, there has been significant growth in mortgage
securitization by the government sponsored agencies (Fannie Mae and Freddie Mac) and
non-agency actors, as well.13
In brief, the securitization process involves the creation of a special purpose entity or a trust
which becomes the owner of the loans. The trust is usually a bankruptcy-remote, special
purpose vehicle (a subsidiary of either the originator or an investment bank) that underwrites
the securities. The trust structure is used because it is exempt from taxes, allows the originator
to treat the transaction as a loan sale, and insulates investors from the liabilities of the
originator and issuer. A mortgage-backed security (MBS) is a bond whose cash flow is derived
from the principal and interest payments of mortgages.
16 www.nera.com
Fannie and Freddie guarantee the timely payment of principal and interest for a fee, so the
credit risk of the borrowers is not at issue unless the government sponsored agencies default.
However,asFannieandFreddie’ssecuritizedproducts(agencypools)arebelievedtohave
a government guarantee, default risk is not a key issue as it is for non-agency or private label
products. Non-agency pools of loans expose the investors to credit risk and hence, some form
of “credit enhancement” is required in order for these securities, including subprime MBS, to
obtain credit ratings. Such enhancement mechanisms can come from unrelated parties, or be
part of the deal structure itself. As such, they are referred to either as external or internal credit
enhancements, respectively. The most common internal forms of credit enhancements include
tranching, over collateralization, and subordination. Following a process known as credit
tranching, the securitized loans are divided into different classes according to their level of risk.
The top tranches are the AAA and AA rated bonds. Below these are the lower-rated classes.
At the lowest level is the “equity” or “first-loss” tranche, which is usually not rated.
Since MBS derive their value from the underlying collateral, it is not surprising that the value
of these securities declined as the delinquency and defaults of mortgages surged beyond
expected levels. A variety of investors hold MBS, including banks, hedge funds, insurance
companies, collateralized debt obligations, and conduits known as structured investment
vehicles. We discuss the latter two entities in more detail below.
Collateralized Debt Obligations
A CDO is a special purpose entity that holds debt as collateral and issues long-term liabilities
in the form of tranched securities.14 The underlying collateral can be corporate bonds, MBS,
asset-backed securities (ABS), other CDOs, or other products. CDOs differ in their structures
and purposes. Almost all CDOs issue multiple classes of securities that are tranched with
respect to seniority in bankruptcy and timing of repayment.15 The process of forming a CDO is
similar to the formation of an MBS as described above. There are different purposes for issuing
CDOs. Some CDOs are set up to hedge credit risk and reduce regulatory capital—known
as balance sheet CDOs—and others are designed to exploit management expertise, earn
management fees, and collect interest on high-yield assets—known as arbitrage CDOs.16
Although CDOs have existed since 1987, the market experienced significant growth during the
period2000to2006.In2004,therewasapproximately$157.4billioninglobalCDOissuance.
In2006,therewas$551.7billioninissuance,agrowthofapproximately250percent.CDOs
with structured collateral have been an increasing fraction of all CDO issuance. In 2006, CDOs
with structured finance products as the underlying collateral comprised almost 57 percent of
the global CDO issuance.17 Specifically, mortgage products have constituted a large share of
the underlying collateral:
14 There are many primers written on structured products, CDOs, CDS, and other derivatives. Our article will not discuss
the products in detail, but please see JPMorgan’s “CDO Handbook” for a detailed discussion of CDOs.
15 Christopher Flanagan and Thomas Sam, “CDO Handbook,” JPMorgan Global Structured Finance Research
(April 2002).
16 Ibid.
17 See SIFMA’s Global CDO Issuance Market Data:
http://www.sifma.org/research/pdf/SIFMA_CDOIssuanceData2008q2.pdf.

www.nera.com 17
TheFDICreportsthat81percentofthe$249billionofCDOcollateralpoolsissuedin
2005,or$200billion,wasmadeupofresidentialmortgageproducts.(FDICOutlook,
Fall 2006) Moody’s CDO Asset Exposure Report for October 2006 reveals that 39.5
percent of the collateral within the 678 deals covered by Moody’s consists of RMBS, just
over 70 percent of that in subprime and home equity loans and the other 30 percent in
primefirst-lienloans.Hence,CDOsholdalotofRMBS.18
As housing prices declined at the national level, recent vintages of the ABS CDOs experienced
significant rating downgrades because of their exposure to subprime and other non-agency
collateral: “During 2007, Moody’s downgraded 31 percent of all the ABS CDO tranches it had
rated. In some cases, these downgrades have reached to the top of the CDO capital structure:
14 percent of tranches initially rated AAA were downgraded.”19
Several factors may have led to the poor performance of CDOs and in particular the ABS CDOs.
Many analysts incorrectly assumed that housing prices would either continue to increase or
remain flat. Even when analysts ran sensitivity analyses or stress testing assuming a decline in
housing prices, the extent of the actual decline was not foreseen. The housing bubble and its
subsequent burst created a chain reaction that impacted various aspects of the valuations and
risk structures of these mortgage-related products.
Incorrect assumptions about correlation risk also contributed. Many securitized products
including CDOs are structured based on the assumption of a certain degree of diversification in
theperformanceoftheunderlyingcollateral.However,contrarytothecorrelationassumptions
underlying many CDO valuations, different types of collateral underperformed at the same
time following the decrease in housing prices. Mortgage borrowers, whether subprime
or prime, relied on the increase in housing prices to be able to refinance their houses and
other expenses, but when housing price growth started to stall at the national level in 2006,
delinquencies and defaults of prime, Alt-A, jumbo, and subprime mortgages all suffered.
Therefore, even if the valuation models had taken into account a certain degree of correlation
among the pooled assets, the decline of housing prices at the national level could and did
increase the correlation to unprecedented levels. The collateral underlying the structured CDOs
were all exposed to the same systemic shock as housing prices continued to decline. The
correlation of the performance among the pooled assets and the time-varying correlation are
key factors that complicate the valuation of CDOs.
In addition, the default triggers in some ABS CDOs may force liquidations. A trigger can divert
funds away from the junior tranches or give the holders of the senior tranches the option to
liquidate once the performance of the underlying collateral reaches a certain level. According
to the Basel Committee on Banking Supervision, “Around 50 ABS CDOs hit default triggers
before the end of 2007, with about half entering liquidation.”20
18 Joseph Mason and Josh Rosner, “How Resilient are Mortgage Backed Securities to Collateralized Debt Obligation
Market Disruptions?” Working Paper (February 2007), p. 28. Available at SSRN: http://papers.ssrn.com/sol3/papers.
cfm?abstract_id=1027472.
19 Basel Committee on Banking Supervision, “Credit Risk Transfer,” July 2008, p. 12.
20 Ibid, p. 13.

18 www.nera.com
Structured Investment Vehicles
SIVs are another type of investor in mortgage-backed securities and collateralized
debt obligations. SIVs are off-balance sheet entities that usually are set up by large financial
institutions.21 They rely on short- and medium-term borrowing by issuing asset-backed
commercial paper and medium-term notes and then use the proceeds to invest in a variety of
securities including tranches of CDOs. Because they rely on short-term financing, SIVs meet the
debt service on these obligations using the cash flow generated from their investment assets,
which are longer-term, as well as other sources such as rolling over debt and acquiring liquidity
lines from banks.
Various financial entities, including money market funds, invest in the asset-backed
commercial paper and can be indirectly exposed to the credit risk of the collateral underlying
these securities.
Short-Term Borrowing and Leverage
SIVs were not the only financial entities that relied on short-term borrowing and leverage.
Many other participants, including SIV lites, banks, hedge funds, insurance companies, and
others, followed suit. For banks in particular, short-term, collateralized borrowing was a
cheaper and easier source of funding than either borrowing long-term (generally unsecured)
or raising equity financing.22 This was due to the fact that borrowing against collateral provides
an easier means of procurement, and banks’ assets that serve as collateral are generally short-
term in nature. Moreover, many of these entities combined a reliance on short-term financing
with a high degree of leverage—in some cases exceeding 70 times capital. With such an
approach, relatively low levels of losses on the underlying collateral could and did lead to large
losses on the equity and borrowed capital, which effectively led to higher levels of leverage.
In turn, the losses led to asset sales as these participants sought to delever.
In summary, the increased use of ABS CDOs in recent years, along with the increased leverage
and reliance on short-term funding, increased the number of market participants who were
(directly or indirectly) exposed to the housing market. The market participants in question were
then exposed to a systemic risk related to the value of houses. When housing prices collapsed,
investors fled to quality, and credit disappeared together with the ability to leverage, leading
to magnified losses.
21 There are other types of conduits that invested in structured products, but we will focus the discussion on SIVs.
22 For a discussion of why short-term debt became an important source of funding for banks, see Kashyap, et al.,
“Rethinking Capital Regulation” Paper prepared for the Federal Reserve Bank of Kansas City Symposium at Jackson
Hole (August 2008).

www.nera.com 19
Credit Default Swaps
Some analysts argue that the problems were compounded by derivative exposures via
instruments such as CDS, and we assess some of the controversy over CDS. A CDS is a contract
that provides insurance against the risk of a default by a particular entity.23 The company is
known as the reference entity and a default by the company is known as a credit event.
The buyer of the insurance has the right to sell a particular bond issued by the entity at par
value when a credit event occurs. The bond is known as the reference obligation and the total
par value of the bond that can be sold is known as the swap’s notional principal.24 These
are bilateral over-the-counter agreements and are often used to spread the cost of a
credit event, such as default or bankruptcy, and enable participants to hedge against the
creditworthiness of companies or even countries.
The notional exposure of CDS is often cited as evidence that this market is far greater than
that represented by the underlying securities. But it is misleading to rely on the notional value
ofCDS.AsshowninFigure11,thenotionalamountoutstandingofCDSin2007was$62
trillion,whichisclosetotheleveloftheworldgrossdomesticproductthatyear.However,
the notional value of outstanding CDS does not represent the outstanding liabilities for several
reasons. First, parties with offsetting CDS contracts would actually offset their credit exposure
to the reference entity. The Bank for International Settlements notes that approximately 55
percent of the notional amount outstanding as of December 2007 was with reporting dealers,
for whom net exposure is a more meaningful metric.25 Second, all reference entities upon
which credit default swaps are written would have to default simultaneously for the entire
outstanding notional amount to be paid. This would mean that the primary reference entities,
including General Motors, Brazil, Daimler Chrysler, Telecom Italia, Italy, Turkey, Russia, and
others, would all have to default at the same time.26
23 John Hull and Alan White, “Valuing Credit Default Swaps I: No Counterparty Default Risk.” The Journal of Derivatives
8 (1), 29-40 (April 2000).
24 International Swaps and Derivatives Association, Inc., see: http://www.isda.org/.
25 Bank for International Settlements, “OTC derivatives market activity in the first half of 2008” (November 2008).
26 David Mengle, “Credit Derivatives: An Overview,” International Swaps and Derivatives Association (2007).

20 www.nera.com
A more appropriate estimate of exposure to CDS would be the “gross replacement value,”
akin to the market price of equities.27 The Bank for International Settlements estimates that
the gross market value of the total CDS outstanding as of December 2007 was approximately
$2trillion.28
Derivatives are meant to redistribute existing risk between market participants and allow
participants to hedge risk.29 One of the risks associated with CDS is counterparty risk, which
relates to the potential for either of the CDS parties to be unable to fulfill the terms of the
contract.However,large,aggregateexposuretothesamecounterparty,suchasAIG,may
cause disruptions in the marketplace if the viability of the protection seller is in question.
Figure 11. Notional Amount of Credit Default Swaps Outstanding Annual Data from 2001 through 2007
Source: ISDA
34,423
62,173
3,7792,192919
17,096
8,422
0
10,000
20,000
30,000
40,000
50,000
60,000
70,000
2001 2002 2003 2004 2005 2006 2007
Not
iona
l Am
ount
Out
stan
ding
($ b
illio
ns)
27 Dr. Richard Lindsey, Testimony before the Committee on Agriculture, Nutrition, and Forestry, United States Senate
(October 14, 2008).
28 Bank for International Settlements, “OTC derivatives market activity in the first half of 2008” (November 2008).
29 David Skeel and Frank Partnoy, “The Promise and Peril of Credit Derivatives.” University of Pennsylvania, Institute for
Law & Economics Research Paper No. 06-22 (2006).

www.nera.com 21
According to its second quarter 2008 SEC filing, AIG participated in the US residential
mortgage market through a variety of methods, among them the use of CDS. It provided
credit protection on the super-senior risk layer of diversified portfolios of investment-grade
corporate debt, collateralized loan obligations (CLOs), and multi-sector CDOs, as well as some
protection on tranches below the super-senior level.30 As of the second quarter of 2008, AIG
hadapproximately$440billionintotalnotionalexposureinitssuper-seniorCDSportfolioand
hadrecordedafairvalueunrealizedlossontheportfolioofapproximately$26billion.31 As of
31 July 2008, AIG estimated that a downgrade by Moody’s to “A1” and by S&P to “A+” would
allowcounterpartiestorequestapproximately$13billioninadditionalcollateral.32 The size
of AIG’s exposure as a provider of credit protection was a key factor in the Federal Reserve’s
decisiontoprovidean$85billionsecuredloantoavoidbankruptcyon16September2008.
As its reasoning, the Fed stated, “The Board determined that, in current circumstances, a
disorderly failure of AIG could add to already significant levels of financial market fragility….”33
Disruptions caused by counterparty failures may create a “domino” effect and imply multiples
of the losses on the underlying securities being transmitted to various agents in the capital
markets. While there are corresponding gains (because of the contracts’ bilateral nature),
concentrated losses can lead to the distress, and in some cases failure, of market participants.
If the market perceived a key counterparty to experience significant problems, this could lead
to novation requests as counterparties try to reduce their exposure to the troubled firm.34
The firm may then find itself facing additional collateral requirements and other problems
leading to self-fulfilling results.35
In addition, the subprime credit derivative indices, known as the ABX, are of particular
relevance to the current crisis. The ABX is comprised of a series of CDS based on twenty deals
that consist of subprime mortgages. ABX contracts are commonly used by investors to hedge
or to speculate against the risk of defaults on mortgage securities. ABX swaps offer protection
if the securities do not perform as expected in return for regular insurance-like premiums.
A decline in the price of ABX indices signifies investor belief that subprime mortgages will
suffer increased financial losses. Likewise, an increase in the ABX indices signifies investor belief
that subprime mortgages are more likely to perform better. The prices of the ABX indices can
be used to infer information about the market’s assumptions regarding default and recovery
rates of the collateral, under normal market conditions.
30 A collateralized loan obligation is a securitization of bank loans, generally commercial and industrial loans.
31 AIG’s Form 10-Q, filed on 6 August 2008, pp. 39 and 42.
32 Ibid. p. 40.
33 See the Federal Reserve Press Release (16 September 2008), http://www.federalreserve.gov/newsevents/press/
other/20080916a.htm.
34 In legal terminology, a novation is a mutual agreement among all concerned parties to substitute a new contract in
place of an existing one.
35 Dr. Richard Lindsey, Testimony before the Committee on Agriculture, Nutrition, and Forestry, United States Senate
(14 October 2008).

22 www.nera.com
AsFigure12illustrates,a$100investmentinthe07-01BBBABXindexinJanuary2007was
worth$5inSeptember2008.Thisdropinvaluesuggestssignificantlossesontheunderlying
collateral that have not yet completely materialized. The corresponding ABX AAA index also
lost more than half of its value during the same time period. There is an ongoing dispute
among economists as to the role of the ABX indices in the crisis. Gorton (2008), for example,
argues that the ABX indices provided information to the market about the subprime mortgages
that was not previously available.36 There are several other home equity indices that have
been used to hedge exposure to home equity, including the Lehman and Merrill home equity
indices; both have been available for several years. In addition, investors in subprime asset-
backed securities have access to detailed information about the performance of the collateral
underlying the securities from the periodic reports they receive from the trustees as well as
analyses from the rating agencies and other data sources.
Other economists have examined the factors leading to the significant drop in the value
of the ABX indices. The question is, to what extent does the decline in the ABX indices reflect
actual (or projections of) losses on the underlying collateral? Fender and Scheicher’s (2008)
empirical analysis shows that a declining risk appetite and increased concerns about market
liquidity have contributed to the significant drop in the ABX values.37 Their results suggest that
the drop in value of the ABX indices may not reflect actual losses on the subprime collateral.
Others wonder why there is no demand for the ABX indices if the market price does not
reflect actual or projected losses. Given the current freeze in the subprime markets and relative
difficulty in obtaining dealer marks, it is too early to fully explain the significant drop in the
value of the indices.
36 Gary Gorton, “The Subprime Panic.” Yale International Center for Finance Working Paper No. 08-25
(September 2008).
37 Ingo Fender and Martin Scheicher, “The ABX: How Do the Markets Price Subprime Mortgage Risk?” BIS Quarterly
Review (September 2008).

www.nera.com 23
Figure 12. ABX BBB and BBB- 07-01 Indices Daily Data from 19 January 2007 through 7 October 2008
0
10
20
30
40
50
60
70
80
90
100
Jan-07 Mar-07 May-07 Jul-07 Sep-07 Nov-07 Jan-08 Mar-08 May-08 Jul-08 Sep-08
Inde
x V
alue
BBB 07-01 BBB- 07-01
98.3097.47
5.405.45
Source: Markit
A $100 investment in the 07-01 BBB ABX index in January 2007 was worth $5 in September 2008. This drop in value suggests significant losses on the underlying collateral that have not yet completely materialized.

24 www.nera.com
Flight to Quality and the Contagion
As the crisis deepened and the spillover effects became evident in various parts of the financial
markets, investors fled all but the safest investments (generally Treasuries). Spreads on various
debt securities began to rise. The TED spread, two-year swap spreads, and the London inter-
bank offered rate (LIBOR) – overnight index swap (OIS) spread also reached recent highs, as
illustrated in Figure 13. The TED spread is the difference in the dollar rate for three-month
inter-bank borrowing and the US Treasury’s three-month borrowing costs. The two-year swap
spread is the cost of exchanging two-year US fixed-rate interest payments for floating rates.
The cost is expressed as the premium of the swap over comparable Treasuries. In times of
increasing uncertainty and risk-aversion, spreads rise as investors demand higher premiums for
providing fixed-rate interest payments. The two-year swap spread reached a high of 170 basis
points on 3 October 2008. Similarly, an increase in the LIBOR-OIS spread indicates a decline
in banks’ willingness to lend. It is measured as the spread between the rate banks charge for
loans in London and the OIS rate.38 The TED spread and the LIBOR-OIS spread reached highs
on 10 October 2008, of 457 basis points and 366 basis points, respectively. At the same time,
the CDS market indicated increased concerns about counterparty risk.
38 The overnight index swap (OIS) represents the market expectation of the federal funds rate. Thus, the LIBOR-OIS
spread is seen as a measure of the credit risk premium - see McAndrews et al., “The Effect of the Term Auction
Facility on the London Inter-Bank Offered Rate” Federal Reserve Bank of New York Staff Report No. 335 (July 2008).
Former Federal Reserve Chairman Alan Greenspan recently wrote in an article for The Economist that the LIBOR-OIS
spread was a measure of market perceptions of potential bank insolvency and therefore of extra capital needs. See
Alan Greenspan, “Banks Need More Capital” The Economist (18 December 2008).

www.nera.com 25
Figure 13. 2-Year Swap Spread, TED Spread, and LIBOR – Overnight Index Swap Spread Daily Data from 2 January 2007 through 20 October 2008
Source: Bloomberg LP
0
50
100
150
200
250
300
350
400
450
500
Jan-07 Apr-07 Jul-07 Oct-07 Jan-08 Apr-08 Jul-08 Oct-08
Spre
ad (B
asis
Poi
nts)
2-Year Swap Spread TED Spread LIBOR - OIS Spread

26 www.nera.com
Even Highly-Rated AAA Corporate Bonds Experienced Widening Spreads
The AAA corporate bond yield spread measures the difference between the yields on
AAA corporate bonds and risk-free assets. The spread indicates the premium that investors
require in order to invest in AAA corporate bonds. A smaller spread indicates that investors
view lending to corporations as less risky, and vice versa. As of June 2007, the spread was 70
basis points. As investors became increasingly wary of the uncertainties about prices of various
securities, the spread jumped to almost 125 basis points by August 2007 and over 200 basis
points by March 2008, as illustrated in Figure 14. Thus, the cost of borrowing to corporations
significantly increased over a relatively short period of time. The levels that the spread
reached during 2007 and 2008 are not unprecedented; they are below the levels seen, for
example,inSeptember2001.However,combinedwiththeotherconditionsofthecredit
markets, they remain a sign of investors’ risk-aversion and concern over the viability of even
highly-rated corporations.
Figure 14. Corporate Bond Yield Spreads Began to Rise Daily Data from 1 January 2004 through 22 May 2008
Source: Moody's, Federal Reserve
0
40
80
120
160
200
240
Jan-04 Jul-04 Jan-05 Jul-05 Jan-06 Jul-06 Jan-07 Jul-07 Jan-08
AA
A C
orpo
rate
Bon
d Y
ield
Spr
ead
Ove
r 10
-Yr
Trea
sury
Rat
e (B
asis
Poi
nts)

www.nera.com 27
Asset-Backed Commercial Paper was Hit in the First Part of August 2007
Investors’ flight to quality in the face of the news about subprime-related losses and the poor
performance of various collateral had a significant impact on even the most liquid part of the
markets, asset-backed commercial paper.39 Companies used this market to meet their short-
term financing needs. As the summer of 2007 began, there were indications that the mortgage
problemhadspreadbeyondsubprime.InJuly,Moody’sdowngraded$5billioninsecurities
backedbysubprimeassetsandS&Pplaced$12billiononwatchforpossibledowngrades.40
Various hedge funds including Basis Capital, Absolute Capital, and Sowood Capital either
had to halt redemptions or sell assets at fire-sale prices and close funds. In addition, German
lender IKB, Paris-based asset manager AXA IM, and Singapore-based United Overseas Bank all
reported subprime related troubles. By the first week of August, two Bear Stearns funds had
filed for bankruptcy, and academics noted, “During the week of August 6, 2007, a number
of high-profile and highly successful quantitative long/short equity hedge funds experienced
unprecedented losses.”41
The mounting losses and the speed with which they seemed to be spreading created a virtual
panic that led to a flight to quality by investors—even from the liquid asset-backed commercial
paper markets—and spurred immediate central bank action. During the first week of August
2007, the Federal Reserve as well as other central banks around the world had to interfere to
injectabout$290billionintothemarketstoensureliquidity.Figure15illustratesthedeclinein
the asset-backed commercial paper market.
The significant decline in the commercial paper market had a direct impact on the real
economy as it was a major source of short-term funding for industrial and commercial
corporations such as AT&T and General Electric. The freeze meant that funding for highly-rated
corporations had become more difficult and more expensive.
39 Asset-backed commercial paper is a short-term investment vehicle with a maturity that is typically between 90
and 180 days. The notes are backed by physical assets such as mortgages, and are generally used for short-term
financing needs.
40 Saskia Scholtes, “FT.com: Subprime Bonds in Ratings Downgrades,” Financial Times (10 July 2007).
41 Amir Khandani and Andrew Lo, “What Happened to the Quants in August 2007?” Working Paper (September 2007).
Available at SSRN: http://ssrn.com/abstract=1015987.

28 www.nera.com
Figure 15. Asset-Backed Commercial Paper Market Weekly data from January 2007 through May 2008
Source: Bloomberg LP
700
800
900
1,000
1,100
1,200
1,300
Jan-07 Feb-07 Mar-07 Apr-07 May-07 Jun-07 Jul-07 Aug-07 Sep-07 Oct-07 Nov-07 Dec-07 Jan-08 Feb-08 Mar-08 Apr-08 May-08
Ass
et-B
acke
d C
omm
erci
al P
aper
Out
stan
ding
($ b
illio
ns)
9-10 August 2007:The Fed and other Central Banks inject US $290 billion in liquidity.
12 December 2007:The Fed announces plans to inject $40 billion in the next week.
18 December 2007:The European Central Bankinjects US $500 billion.
The mounting losses and the speed with which they seemed to be spreading created a virtual panic that led to a flight to quality by investors—even from the liquid asset-backed commercial paper markets—and spurred immediate central bank action.

www.nera.com 29
LIBOR
The crisis also spread to lending between banks. As banks became concerned about the
quality of other banks’ assets and also sought to conserve their own cash (in part to deal
with other banks’ concerns regarding their quality), LIBOR rose.42 This meant that banks
became reluctant to lend to each other as they became increasingly uncertain about the
viability of their counterparties. A higher LIBOR means less liquidity in the markets. Moreover,
other rates such as the Treasury-Eurodollar spread and the LIBOR-OIS spread showed that
this panic was widespread.
Summary
The credit crisis continues as we write this article. The bubble that was brewing in the housing
market since at least 2000 finally burst in 2006. As housing prices continue to decline at the
national level, delinquencies and defaults on subprime and prime mortgages, credit cards, auto
loans, and others continue to increase. The flight to quality has led to a severe liquidity crisis
that has extended to all sectors of the world economy. The decline in the commercial paper
market has made it quite costly for large corporations to fund their short-term needs. LIBOR
remains elevated and securitization has dropped significantly in all sectors, further drying up
liquidity. Governments in all countries have taken extraordinary measures to restore order to
the markets and confidence to investors, including direct capital injections in some financial
institutions, guarantees of bad debts, and other unconventional means. Even after the credit
crisis is over, it is not clear that the financial markets will ever be the same again.
42 LIBOR is a guide for the rate banks use to lend each other.

30 www.nera.com
About NERA
NERA Economic Consulting (www.nera.com) is an international firm of economists who
understand how markets work. We provide economic analysis and advice to corporations,
governments, law firms, regulatory agencies, trade associations, and international agencies.
Our global team of more than 600 professionals operates in over 20 offices across North
America, Europe, and Asia Pacific.
NERA provides practical economic advice related to highly complex business and legal issues
arising from competition, regulation, public policy, strategy, finance, and litigation. Founded
in 1961 as National Economic Research Associates, our more than 45 years of experience
creating strategies, studies, reports, expert testimony, and policy recommendations reflects
our specialization in industrial and financial economics. Because of our commitment to deliver
unbiased findings, we are widely recognized for our independence. Our clients come to us
expecting integrity and the unvarnished truth.
Contacts For further information and questions, please contact:
Dr. Faten Sabry Dr. Chudozie Okongwu
Vice President Senior Vice President
+1 212 345 3285 +1 212 345 5003
[email protected] [email protected]
The opinions expressed herein do not necessarily represent the views of NERA Economic Consulting
or any other NERA consultant. Please do not cite without explicit permission from the authors.
© Copyright 2009
National Economic Research Associates, Inc.
Related Documents