WP/15/75 How Did Markets React to Stress Tests? Bertrand Candelon and Amadou N.R. Sy

Welcome message from author
This document is posted to help you gain knowledge. Please leave a comment to let me know what you think about it! Share it to your friends and learn new things together.
Transcript

WP/15/75
How Did Markets React to Stress Tests?
Bertrand Candelon and Amadou N.R. Sy

©2015 International Monetary Fund WP/15/75
IMF Working Paper
Monetary and Capital Markets Department
How Do Markets React to Stress Tests?
Prepared by Bertrand Candelon and Amadou N.R. Sy1
Authorized for distribution by Udaibir S. Das
April 2015
This Working Paper should not be reported as representing the views of the IMF.The views expressed in this Working Paper are those of the author(s) and do not necessarily represent those of the IMF or IMF policy. Working Papers describe research in progress by the author(s) and are published to elicit comments and to further debate.
Abstract
We use event study methods to compare the market reaction to U.S. and EU-wide stress tests performed from 2009 to 2013. Typically, stress tests have a positive impact on stressed banks’ returns. While the 2009 U.S. stress test had a large positive outcome, the impact of subsequent U.S. exercises decreased over time. The 2011 EU exercise is the only EU-wide stress test that resulted in a significant negative market reaction. Comparing past exercises suggests that the qualitative aspects of the governance of stress tests can matter more for stock market participants than technical elements, such as the level of the minimum capital adequacy threshold or the extent of data disclosure.
JEL Classification Numbers: G01, G18, G24, G28
Keywords: financial stability, macroprudential, stress tests, financial stability
Authors’ E-Mail Address: [email protected]; [email protected]
1 Bertand Candelon is professor of economics at IPAG Business School and Amadou Sy is with the IMF and Brookings Institution. We thank the staff of the Spanish Ministry of Economy and Competitiveness, the Central Bank of Slovenia, Miguel Savastano, Jacques Mistral, and numerous IMF staff for very useful suggestions and comments, Michael Pollmann for superb research assistance and Christina Golubski for editorial assistance. All errors or omissions are ours.
2
Contents Page
I. Introduction ............................................................................................................................3
II. Methodology .........................................................................................................................5
III. Results ..................................................................................................................................8A. Results for EU Stress Tests .......................................................................................8 B. Results of U.S. Stress Tests .......................................................................................9
IV. Interpretation of Results ....................................................................................................10
V. Differences in the Governance of Stress Tests ...................................................................12 A. Comparison Among EU Exercises .........................................................................13 B. Comparing the U.S. 2009 and EU 2011 Stress Tests ..............................................16
VI. Concluding Remarks .........................................................................................................18
Tables 1. U.S. and EU-wide Stress Tests (2009–2013) .........................................................................62. Average Cumulative Abnormal Returns and their Significance at the Announcement andthe Results Release of the Stress Tests ......................................................................................8 3. Market Reaction to U.S. and EU Stress Tests .......................................................................94. The Governance of Crisis Management Stress Tests ..........................................................17
Figures 1. Average CARs for Stressed Banks following the Publication of Stress Test Results .........102. Bank of Ireland Share Price .................................................................................................133. Greece: Sovereign Yield ......................................................................................................14

3
I. INTRODUCTION
In the early stages of the financial crisis, the 2009 United States Supervisory Capital Assessment Program (SCAP, or stress test) helped restore confidence by providing a public credible assessment of U.S. banks’ recapitalization needs and a credible financial backstop. The 2009 U.S. stress test was the first of a series of macroprudential stress tests aimed at restoring financial stability and was followed by comparable exercises in the European Union (EU). Bernanke (2013) emphasizes that, in retrospect, the SCAP stands out as one of the critical turning points in the financial crisis as it provided anxious investors credible information about prospective banks’ losses.
One strand of literature has examined the role of macroprudential stress tests in curbing bank opaqueness. For example, using standard event study methods and comparing the recapitalization gaps expected by the market with stress test results, Morgan, Peristiani, and Savino (2014) find that the 2009 U.S. stress test indeed produced the information demanded by the markets. They note that although the market had anticipated which banks would have capital gaps before the publication of the stress test results, market participants received more information regarding the size of the capital gaps. Petrella and Resti (2013) also use event study methods to focus on the 2011 EU-wide stress test. They find that stress tests produce valuable information for market participants and they can play a role in mitigating bank opaqueness. Goldstein and Sapra (2012) emphasize, however, that the disclosure of stress test results can achieve the macroprudential role of helping stabilize the financial system as a whole but not necessarily the microprudential role of providing market discipline for specific individual banks.
Another strand of literature has used case studies to take a closer look at the governance of stress tests in order to draw lessons for future exercises. These studies typically use the U.S. 2009 stress test as the benchmark for a “successful” exercise given its success in stabilizing markets and restoring confidence. For example, Ong and Pazarbasioglu (2013) use a design scorecard to compare the most “successful” U.S. stress tests to the EU-wide and other European macroprudential stress tests across a number of dimensions such as the governance, scope, scenario design, capital standards, and transparency. Haben, Liesegang, and Quagliariello (2013) and Schuermann (2012) also provide an in-depth comparison of the governance of the U.S. 2009 and EU 2011 stress tests.
In this paper, we put together these two strands of literature and use event study methods to compare all the macroprudential U.S. and EU-wide stress tests from 2009 to 2013. The event studies help us compare the market impact of the stress tests in the EU and the U.S. over time and across different exercises. The paper also uses the results of the event studies to compare the governance of the stress tests.
4
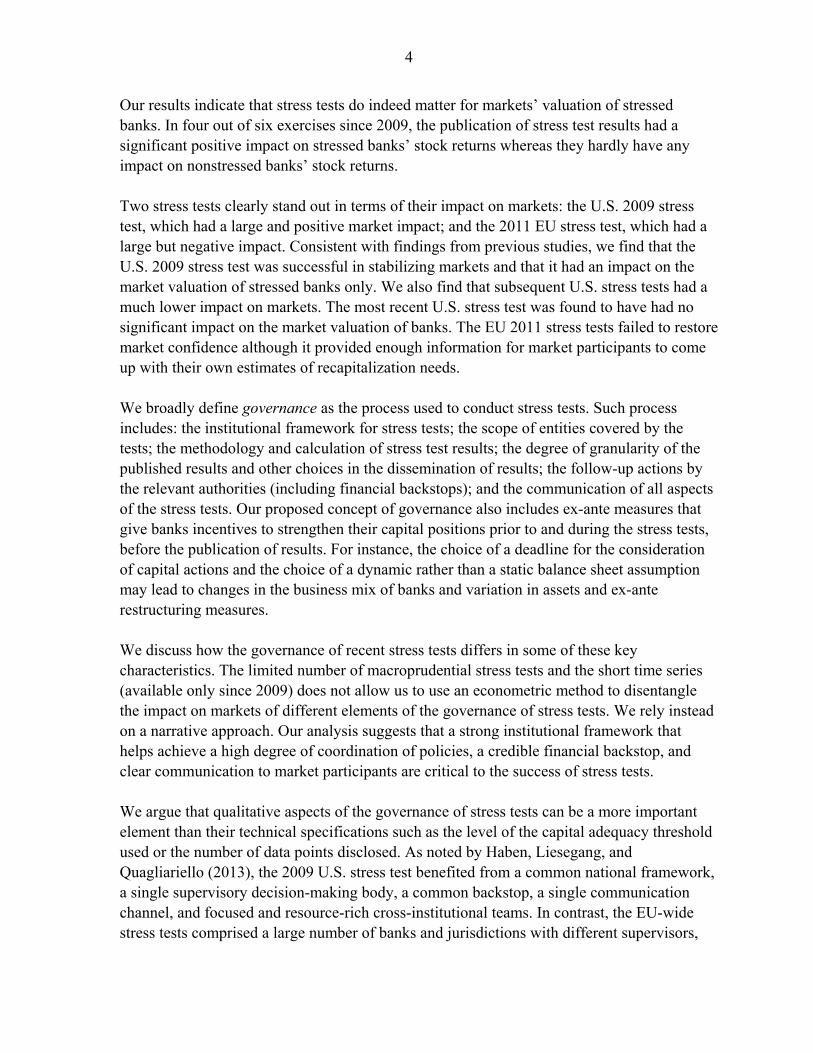
Our results indicate that stress tests do indeed matter for markets’ valuation of stressed banks. In four out of six exercises since 2009, the publication of stress test results had a significant positive impact on stressed banks’ stock returns whereas they hardly have any impact on nonstressed banks’ stock returns. Two stress tests clearly stand out in terms of their impact on markets: the U.S. 2009 stress test, which had a large and positive market impact; and the 2011 EU stress test, which had a large but negative impact. Consistent with findings from previous studies, we find that the U.S. 2009 stress test was successful in stabilizing markets and that it had an impact on the market valuation of stressed banks only. We also find that subsequent U.S. stress tests had a much lower impact on markets. The most recent U.S. stress test was found to have had no significant impact on the market valuation of banks. The EU 2011 stress tests failed to restore market confidence although it provided enough information for market participants to come up with their own estimates of recapitalization needs. We broadly define governance as the process used to conduct stress tests. Such process includes: the institutional framework for stress tests; the scope of entities covered by the tests; the methodology and calculation of stress test results; the degree of granularity of the published results and other choices in the dissemination of results; the follow-up actions by the relevant authorities (including financial backstops); and the communication of all aspects of the stress tests. Our proposed concept of governance also includes ex-ante measures that give banks incentives to strengthen their capital positions prior to and during the stress tests, before the publication of results. For instance, the choice of a deadline for the consideration of capital actions and the choice of a dynamic rather than a static balance sheet assumption may lead to changes in the business mix of banks and variation in assets and ex-ante restructuring measures. We discuss how the governance of recent stress tests differs in some of these key characteristics. The limited number of macroprudential stress tests and the short time series (available only since 2009) does not allow us to use an econometric method to disentangle the impact on markets of different elements of the governance of stress tests. We rely instead on a narrative approach. Our analysis suggests that a strong institutional framework that helps achieve a high degree of coordination of policies, a credible financial backstop, and clear communication to market participants are critical to the success of stress tests. We argue that qualitative aspects of the governance of stress tests can be a more important element than their technical specifications such as the level of the capital adequacy threshold used or the number of data points disclosed. As noted by Haben, Liesegang, and Quagliariello (2013), the 2009 U.S. stress test benefited from a common national framework, a single supervisory decision-making body, a common backstop, a single communication channel, and focused and resource-rich cross-institutional teams. In contrast, the EU-wide stress tests comprised a large number of banks and jurisdictions with different supervisors,

5
without fully consistent accounting rules, and no burden sharing agreement and common backstops. The importance of governance is also noted by Wall (2013) who suggests that the availability of a backstop enables supervisors to more severely address the problems of banks in the tail of the distribution, which allows other banks to raise capital. Comparing EU-wide stress tests among themselves provides something close to a controlled experiment. The comparison suggests that the “failure” of the 2011 EU stress test (which had a higher capital adequacy threshold and disclosed much more bank-by-bank data than the “successful” EU 2010 stress test) was mainly due to considerable governance challenges that prevented the stress tests from addressing rising market concerns about the recapitalization needs from losses in their sovereign exposures. In this regard, the U.S. 2009 stress test offers a good benchmark for the governance structure of future effective stress tests. The remainder of the paper is organized as follows. Section II details the methodology used in the analysis. Empirical results are presented in Section III, whereas their economic interpretation is developed in Section IV. The elements of the governance of stress tests are investigated in Section V while Section VI concludes.
II. METHODOLOGY
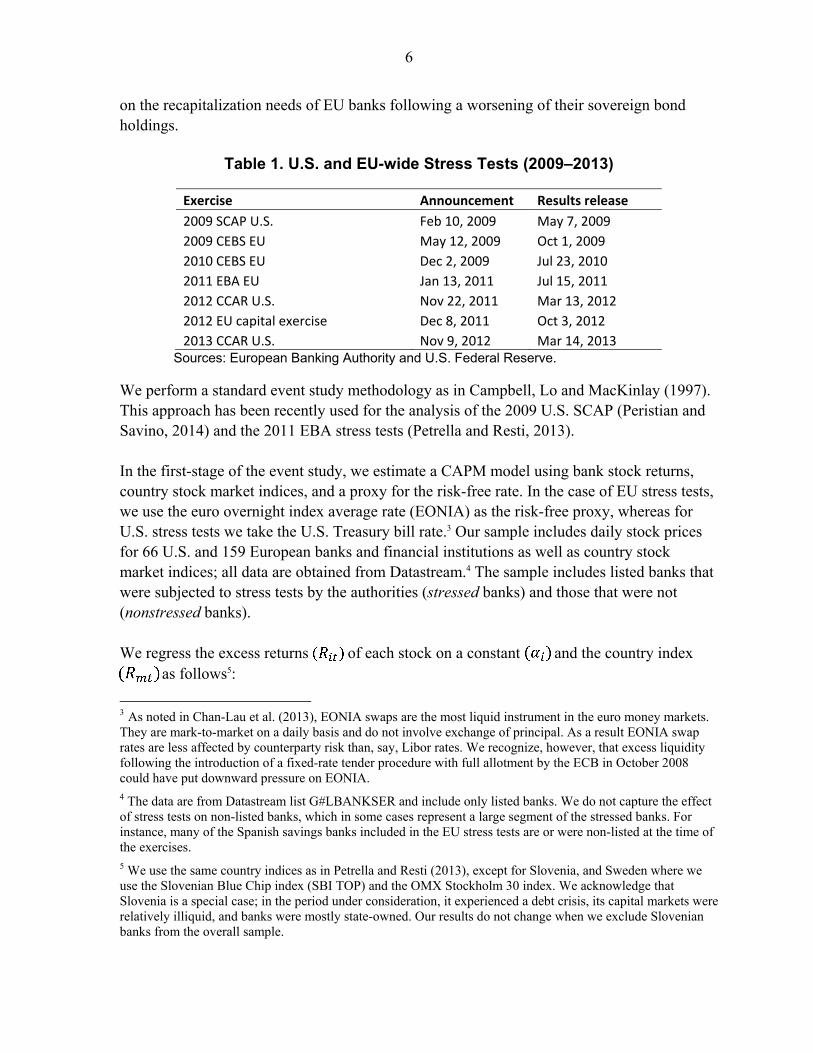
To get some insight about what aspect of stress tests matters most to markets, we first estimate and confront the market reactions to both the announcement and release of stress tests results. We then focus on the stress tests that had the most significant impact on the market in order to identify what factors of the governance of stress tests matter most. We consider as “events” both the announcement of stress test exercises and the publication of stress test results by the U.S. Federal Reserve and the European Banking Association (EBA) or its predecessor, the Committee of European Banking Supervisors (CEBS).2 All U.S. and EU-wide stress tests performed during 2009–2013 are included in our study. To be more precise, we examine three U.S. stress tests: the 2009 Supervisory Capital Assessment Program (SCAP) and the 2012 and 2013 Comprehensive Capital Analysis and Review (CCARs); and four E.U.-wide exercises: the 2009 and 2010 CEBS stress tests, the 2011 EBA stress tests, and the 2012 EU capital exercise. The dates of the announcement of the tests and the release of the results are reported in Table 1. It should be noted that, while all EU-wide stress tests had a crisis management objective, only the U.S. 2009 exercise had that objective. The main objective of the 2012 and 2013 U.S. stress tests was supervisory. Also, the 2012 EU exercise was not technically a stress test but a recapitalization exercise, as it focused only
2 For the dates of the EU-wide stress tests see http://www.eba.europa.eu/risk-analysis-and-data/eu-wide-stress-testing/2011. For U.S. stress tests, see http://www.federalreserve.gov/newsevents/reform_milestones2011.htm .
6
on the recapitalization needs of EU banks following a worsening of their sovereign bond holdings.
Table 1. U.S. and EU-wide Stress Tests (2009–2013)
Exercise Announcement Results release
2009 SCAP U.S. Feb 10, 2009 May 7, 2009
2009 CEBS EU May 12, 2009 Oct 1, 2009
2010 CEBS EU Dec 2, 2009 Jul 23, 2010
2011 EBA EU Jan 13, 2011 Jul 15, 2011
2012 CCAR U.S. Nov 22, 2011 Mar 13, 2012
2012 EU capital exercise Dec 8, 2011 Oct 3, 2012
2013 CCAR U.S. Nov 9, 2012 Mar 14, 2013 Sources: European Banking Authority and U.S. Federal Reserve.
We perform a standard event study methodology as in Campbell, Lo and MacKinlay (1997). This approach has been recently used for the analysis of the 2009 U.S. SCAP (Peristian and Savino, 2014) and the 2011 EBA stress tests (Petrella and Resti, 2013).
In the first-stage of the event study, we estimate a CAPM model using bank stock returns, country stock market indices, and a proxy for the risk-free rate. In the case of EU stress tests, we use the euro overnight index average rate (EONIA) as the risk-free proxy, whereas for U.S. stress tests we take the U.S. Treasury bill rate.3 Our sample includes daily stock prices for 66 U.S. and 159 European banks and financial institutions as well as country stock market indices; all data are obtained from Datastream.4 The sample includes listed banks that were subjected to stress tests by the authorities (stressed banks) and those that were not (nonstressed banks).
We regress the excess returns ( of each stock on a constant ( and the country index ( as follows5:
3 As noted in Chan-Lau et al. (2013), EONIA swaps are the most liquid instrument in the euro money markets. They are mark-to-market on a daily basis and do not involve exchange of principal. As a result EONIA swap rates are less affected by counterparty risk than, say, Libor rates. We recognize, however, that excess liquidity following the introduction of a fixed-rate tender procedure with full allotment by the ECB in October 2008 could have put downward pressure on EONIA. 4 The data are from Datastream list G#LBANKSER and include only listed banks. We do not capture the effect of stress tests on non-listed banks, which in some cases represent a large segment of the stressed banks. For instance, many of the Spanish savings banks included in the EU stress tests are or were non-listed at the time of the exercises. 5 We use the same country indices as in Petrella and Resti (2013), except for Slovenia, and Sweden where we use the Slovenian Blue Chip index (SBI TOP) and the OMX Stockholm 30 index. We acknowledge that Slovenia is a special case; in the period under consideration, it experienced a debt crisis, its capital markets were relatively illiquid, and banks were mostly state-owned. Our results do not change when we exclude Slovenian banks from the overall sample.

7
. (1)
The estimation window is from April 1, 2008 to January 5, 2009 and includes 200 observations.
In a second-stage, we compute abnormal returns for each bank and financial institutions by subtracting fitted values from the first stage from actual values.
. (2)
Regressions are performed considering a five day window around the event dates t, i.e. t-2, t-1, t, t+1, t+2, which are days when the supervisory authorities announce that a stress test exercise will take place in the future (announcement) and dates when they publish the results of the stress tests (results). This choice is mainly driven by the assumption that information about these events is not expected to impact the markets after one week.6
For each bank and financial institution i, we compute its abnormal returns (ARit) as well as cumulative abnormal returns (CARit), equal to the sum of the abnormal returns on the date of the event and the two preceding and two succeeding observations (five observations in total). We also considered the standardized cumulative abnormal returns (SCARit), calculated as the ratio of CARit by its standard error. We report CAARit the cumulative average of the CARit for the N banks and institutions in our sample.
For each stress test exercise, we use a dummy variable to differentiate stressed banks from nonstressed banks. One exception, however, is the 2009 EU stress test for which only aggregate stress test results were published.
We consider two tests to check if average cumulative abnormal returns (CAAR) are significant or not. First, we consider a simple t-stat and second, because the t-stat test can be biased by the changes in the volatility induced by the events, we also consider the test statistic proposed by Boehmer, Masumeci, and Poulsen (1991) . We find that the results of the simple t-stat test are comparable to those of the . For that reason, we report only the t-stats in Table 2.
6 We do not expect events to impact the markets after a week period. Robustness checks have been performedconsidering a three-day windows leading to qualitative similar results.
8
III. RESULTS
A. Results for EU Stress Tests
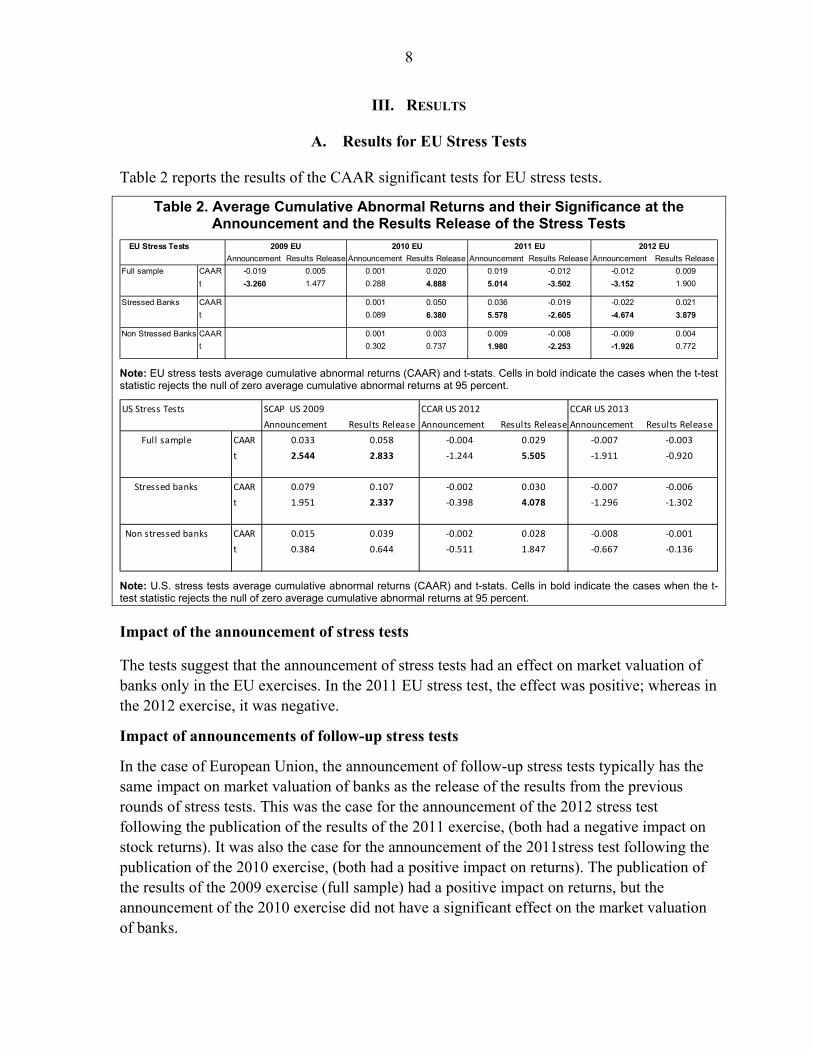
Table 2 reports the results of the CAAR significant tests for EU stress tests.
Table 2. Average Cumulative Abnormal Returns and their Significance at the Announcement and the Results Release of the Stress Tests
EU Stress Tests
Announcement Results Release Announcement Results Release Announcement Results Release Announcement Results Release
Full sample CAAR -0.019 0.005 0.001 0.020 0.019 -0.012 -0.012 0.009
t -3.260 1.477 0.288 4.888 5.014 -3.502 -3.152 1.900
Stressed Banks CAAR 0.001 0.050 0.036 -0.019 -0.022 0.021
t 0.089 6.380 5.578 -2.605 -4.674 3.879
Non Stressed Banks CAAR 0.001 0.003 0.009 -0.008 -0.009 0.004
t 0.302 0.737 1.980 -2.253 -1.926 0.772
2009 EU 2010 EU 2011 EU 2012 EU
Note: EU stress tests average cumulative abnormal returns (CAAR) and t-stats. Cells in bold indicate the cases when the t-test statistic rejects the null of zero average cumulative abnormal returns at 95 percent.
US Stress Tests SCAP US 2009 CCAR US 2012 CCAR US 2013
Announcement Results Release Announcement Results Release Announcement Results Release
Full sample CAAR 0.033 0.058 -0.004 0.029 -0.007 -0.003
t 2.544 2.833 -1.244 5.505 -1.911 -0.920
Stressed banks CAAR 0.079 0.107 -0.002 0.030 -0.007 -0.006
t 1.951 2.337 -0.398 4.078 -1.296 -1.302
Non stressed banks CAAR 0.015 0.039 -0.002 0.028 -0.008 -0.001
t 0.384 0.644 -0.511 1.847 -0.667 -0.136
Note: U.S. stress tests average cumulative abnormal returns (CAAR) and t-stats. Cells in bold indicate the cases when the t-test statistic rejects the null of zero average cumulative abnormal returns at 95 percent.
Impact of the announcement of stress tests
The tests suggest that the announcement of stress tests had an effect on market valuation of banks only in the EU exercises. In the 2011 EU stress test, the effect was positive; whereas in the 2012 exercise, it was negative.
Impact of announcements of follow-up stress tests
In the case of European Union, the announcement of follow-up stress tests typically has the same impact on market valuation of banks as the release of the results from the previous rounds of stress tests. This was the case for the announcement of the 2012 stress test following the publication of the results of the 2011 exercise, (both had a negative impact on stock returns). It was also the case for the announcement of the 2011stress test following the publication of the 2010 exercise, (both had a positive impact on returns). The publication of the results of the 2009 exercise (full sample) had a positive impact on returns, but the announcement of the 2010 exercise did not have a significant effect on the market valuation of banks.

9
Impact of the publication of results
Our tests suggest that the publication of the results of stress test results typically had a statistically significant impact on the stock returns of stressed banks but little impact on nonstressed banks. Indeed, the publication of results had no statistically significant impact on nonstressed banks in all but one exercise (2011 EU).The 2011 EU stress test is the only exercise in which the publication of results had a statistically significant negative impact on banks stocks. This was the case for both stressed and nonstressed banks.
Table 3. Market Reaction to U.S. and EU Stress Tests*
Positive CAAR Negative CAAR Stat. non significant
Stressed banks 2009 US 2013 US
2012 US
2010 EU 2011 EU
2012 EU
Non-stressed banks 2009 US
2012 US
2013 US
2011 EU 2010EU
2012 EU
Positive CAR Negative CAR
Stressed banks 2009 US
2012 US
2013 US
2011 EU 2012 EU 2010 EU
Non-stressed banks 2009 US
2012 US
2013 US
2011 EU 2012 EU 2010EU
Announcements
Results
*The names of stressed banks were not disclosed for the 2009 EU stress tests. The average cumulativeabnormal returns (CAAR) following the publication of the results of the 2009 EU stress tests are positive for the full sample.
B. Results of U.S. Stress Tests
In the stress tests done by the U.S., only the publications of the results of the tests had an impact on markets, the announcements of these stress tests did not have a statistically significant impact. Furthermore, the publication of stress test results only had an impact on the market valuation of stressed banks (Table 2).
10
The 2009 U.S. stress test is an outlier in terms of the scale of its impact on U.S. stressed banks (Table 2). The CAAR following the publication of the stress tests is statistically and economically significant. This result is consistent with the role of the 2009 U.S. stress test as a “circuit breaker” in the midst of a financial crisis.
Another interesting finding is that the impact of the publication of stress tests results in the U.S. had lower impact on the market valuation of stressed banks as time went by. While the results of the 2009 SCAP and 2012 U.S. stress tests have a positive and significant impact on the market valuation of stressed banks, the size of the impact decreased over time and the 2013 U.S. stress tests results were not significant. This pattern can be attributed to the “novelty aspect” of the 2009 stress test, especially the publication of its results, which was seen at the time as a very positive step by market participants. The benefits of publication were recognized by EU regulators and led them to publish the results of the 2010 CEBS stress test.
IV. INTERPRETATION OF RESULTS
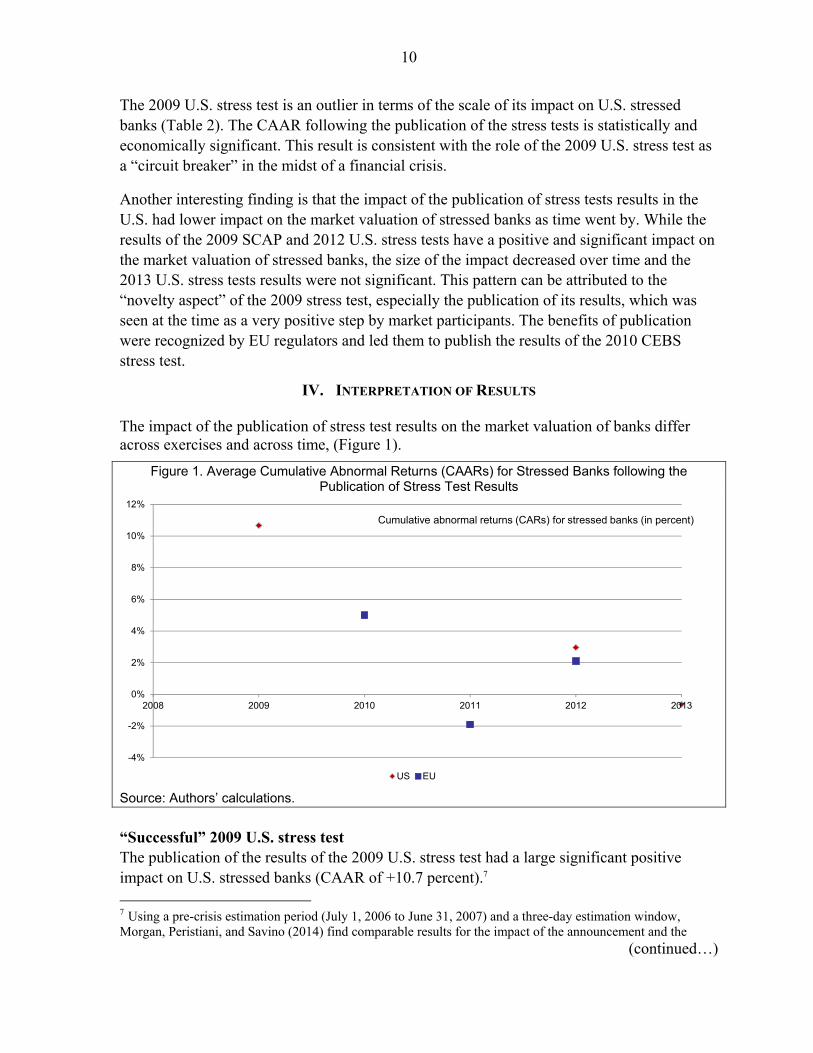
The impact of the publication of stress test results on the market valuation of banks differ across exercises and across time, (Figure 1).
Figure 1. Average Cumulative Abnormal Returns (CAARs) for Stressed Banks following the Publication of Stress Test Results
-4%
-2%
0%
2%
4%
6%
8%
10%
12%
2008 2009 2010 2011 2012 2013
US EU
Cumulative abnormal returns (CARs) for stressed banks (in percent)
Source: Authors’ calculations. “Successful” 2009 U.S. stress test The publication of the results of the 2009 U.S. stress test had a large significant positive impact on U.S. stressed banks (CAAR of +10.7 percent).7 7 Using a pre-crisis estimation period (July 1, 2006 to June 31, 2007) and a three-day estimation window, Morgan, Peristiani, and Savino (2014) find comparable results for the impact of the announcement and the
(continued…)
11
The 2011 EU stress test In contrast, the publication of 2011 EU stress tests had a negative and significant effect on the market valuation of EU banks (-1.2 percent for the full sample), which more than erased the significant positive effect of the announcement of the tests (+1.9 percent for the full sample). The effects were stronger for the sample of stressed banks both following the publication of the results (-1.9 percent) and the announcement of the tests (+3.6 percent). In comparison, the effects were significant but smaller for nonstressed EU banks (-0.8 percent for the publication of results and +0.9 percent for the announcement of the exercise).8 These results are consistent with anecdotal evidence reported by market analysts. For instance, Ahmed et al. (2011) noted t “the strong negative market reaction on the first trading day after the results were published. The Euro Stoxx 50 equity index fell 2 percent to an 11-month low. By sector, bank stocks dropped the most. The Stoxx Europe 600 banks equity index declined more than 3 percent to a two-year low with U.K., Spanish, Italian, and French banks among the worst performers.” Ten-year yields on Italian and Spanish government bonds reached their highest since the euro was introduced in 1999, and CDS spreads on Greek, Portuguese, Irish, and Spanish sovereigns widened. EU stress tests as a whole Our results suggest that the generalized common view that all EU stress tests were unsuccessful is not correct. The publication of the EU 2009 stress tests (which did not release the list of stressed banks) did not have a significant impact on the market valuation of but the announcement of these tests had a significant negative impact. As shown earlier, the results of the 2010 EU stress tests had a significant positive impact on the valuation of stressed banks. These were the only stress tests whose publication had a significant positive effect on the valuation of stressed banks (+5.0 percent). The 2010 EU stress tests did not have significant effects on EU nonstressed banks. The announcement of the 2012 EU capitalization exercise had a negative effect on both stressed and nonstressed banks. However, the publication of results had a significant positive effect on the valuation of stressed banks (and no impact on nonstressed banks).
publication of the results of the 2009 U.S. stress test. They find statistically significant positive CAR of the same order of magnitude for stressed banks and no robust impact on nonstressed banks. They do not find a robust impact of the announcement of the 2009 U.S. stress tests on stressed banks. The authors note that the announcement did not supply “much hard information” about the details of the stress tests. 8 Using a sample of 95 banks, Petrella and Resti (2013) find economically comparable CAR for the impact of the announcement of the 2011 EU stress test. However, they find no statistically significant impact following the publication of results.

12
V. DIFFERENCES IN THE GOVERNANCE OF STRESS TESTS
We define governance as encompassing the overall process used to conduct stress tests. That process includes: the institutional framework for stress tests; the scope of entities covered by the tests; the methodology and calculation of stress test results; the degree of granularity of the published results, and other choices in the dissemination of results; the planned follow up actions by the relevant authorities (including financial backstops); and the communication of all aspects of the stress tests.9 Our concept of governance also includes ex-ante measures that give banks incentives to strengthen their capital positions prior to and during the stress tests.10 For instance, the choice of a deadline for the consideration of capital actions and the choice of a dynamic rather than a static balance sheet assumption may lead to capital increases, changes in the business mix of banks, and variation in assets and restructuring measures prior to the tests. In particular, setting a deadline for the consideration of capital actions may give banks an incentive to increase their capital positions before or once the stress test exercise has started. Such actions could contribute to stress tests having a positive impact on markets. Similarly, deviating from the static balance sheet assumption and considering possible changes in the business mix and variation in assets could give an incentive for banks to take anticipatory restructuring measures, which could contribute to a positive impact on markets. The impact on markets of increased transparency of stress tests is ambiguous.11 Increased transparency, in terms of both the number of entities reviewed and the degree of granularity of the published results could increase the impact of the tests on markets. However, the impact may be either positive or negative. Under the EU stress tests, the scope of entities covered varied widely, with a few countries including all listed banks and savings banks and the majority including only the largest domestic banks (sufficient to meet the minimum threshold of 50 percent of the country’s banking assets). In contrast, under the U.S. stress tests, the entities covered always were the same (19 bank holding companies), which allowed for greater comparability of the results. The follow-up remedial actions specified by the authorities also can affect the market impact of stress tests. For instance, if the authorities require banks whose capital falls below the threshold to fill the shortfall, the credibility of the exercise may be greatly enhanced and the market impact will tend to be positive if market participants believe that the authorities can
9 See Haben, Liesegang, and Quagliariello (2013) and Ong and Pazarbasioglu (2013) for good descriptions of the EU and U.S. stress test exercises. 10 We thank the staff of the Ministry of Economy and Competitiveness of Spain for illustrating these elements of the governance of stress tests. 11 See Goldstein and Sapra (2012).
13
enforce such a requirement. This credibility may be enhanced if a similar requirement applies to banks that exceed the minimum threshold by a small amount. This was one of the main innovations of the EU 2011 exercise compared to the previous two. However, the absence of a common backstop can result in a negative market impact. Indeed, U.S. entities appeared to benefit from expectations of public support; whereas EU entities lacked a credible framework, in part because of the absence of a single EU jurisdiction.
A. Comparison Among EU Exercises
The European stress test exercises differed on a few dimensions. The 2010 and 2011 stress tests covered about the same number of banks, (comprising 65 percent of the assets in the EU banking system and at least 50 percent of bank assets for each country). As noted in Ahmed et al. (2011), the EU 2011 exercise improved on the 2010 exercise in at least three dimensions: the tests were stricter, the level of disclosure was higher; and their anticipation prompted a few banks to bring forward their plans to raise more capital. Moreover, the EU 2011 stress tests introduced a stricter capital benchmark (5 percent core Tier 1 (CT1)), as opposed to 6 percent of Tier 1 under the 2010 EU exercise). Nonetheless, as discussed, the market impact of both tests was substantially different. The publication of the results of the 2011 exercise had a significantly negative impact on the market valuation of both stressed and nonstressed banks while the 2010 stress tests had the opposite effect on stressed banks only (but no impact on nonstressed banks). Several factors seem to explain this difference.
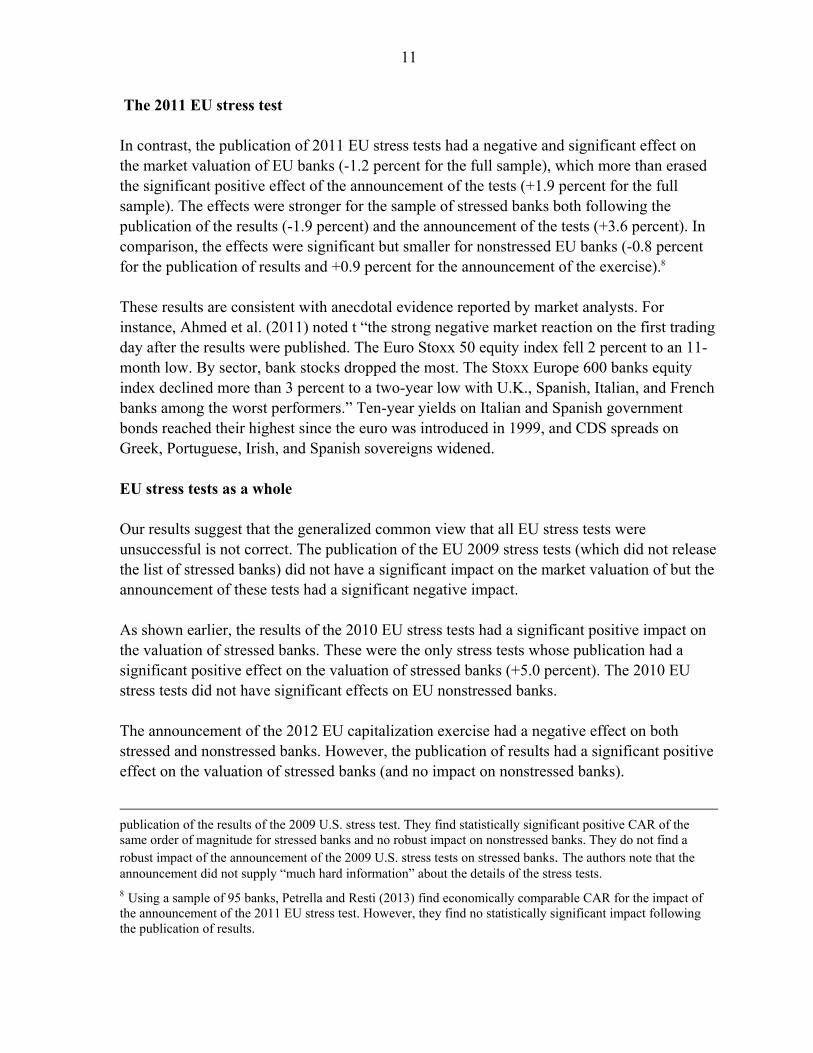
First, the credibility of 2011 EU stress test may have been affected adversely by the run on Irish banks that had passed the 2010 stress tests (see Figure 2). However, this effect does not appear to have been too large, because we find that the announcement of the 2001 EU stress test had a positive market impact. In contrast, the fact that one of the banks that had passed the 2011 EU stress tests (Dexia) required restructuring before the announcement of the 2012 EU recapitalization seems to have weighed on the negative impact on markets of this announcement.
Figure 2. Bank of Ireland Share Price
July 23, 2010 = 100, date of publication of EU2010 stress test results.
0
20
40
60
80
100
120
140
160
180
12/2/2009 12/2/2010 12/2/2011 12/2/2012 12/2/2013
Source: Datastream

14
Second, market concerns about the probability of Greece sovereign defaults, the recovery value in such an event, and the spillover to the banking sector increased after the 2010 stress tests. The yield on the Greek 10-year bond rose to 16.15 percent in July 2011 (when the EU2011 stress test results were published) from 10.34 percent in July 2010 (EU2010 results published) and 4.57 percent in October 2009 (when the results of the 2009 EU were published) (Figure 3). In addition, Ireland had to seek official aid from the IMF following banking sector losses. More generally, in 2012, market estimates of bank recapitalization needs increasingly incorporated the possibility of a government debt restructuring while regulatory estimates did not incorporate it to the same extent.
Figure 3. Greece: Sovereign Yield
Ten Year Bond Interest Rate: rolling 12-month averages
0
5
10
15
20
25
30
35
40
20
06
- J
an
20
06
- J
un
20
06
- N
ov
20
07
- A
pr
20
07
- S
ep
20
08
- F
eb
20
08
- J
ul
20
08
- D
ec
20
09
- M
ay
20
09
- O
ct
20
10
- M
ar
20
10
- A
ug
20
11
- J
an
20
11
- J
un
20
11
- N
ov
20
12
- A
pr
20
12
- S
ep
20
13
- F
eb
20
13
- J
ul
20
13
- D
ec
20
14
- M
ay
20
14
- O
ct
Source: Statistical Office of the European Communities, Haver Analytics
Third, governance challenges were evident when comparing the two stress tests. The EBA, which was in charge of the 2011 stress tests, had to cooperate and coordinate with 27 national supervisors and the ECB. Moreover, the 2010 stress tests had explicitly ruled out the possibility of a Greek sovereign debt default given the creation of the EU bailout funds.12 However, in the 2011 stress tests, stakeholders were asked to consider “plausible but severe” scenarios in the context of fast deteriorating market sentiment about sovereign risk. Accommodating market concerns about the possibility of a debt restructuring meant “changing the rules of the game” and acknowledging that “risk-free” assets had become risky, with the possibility of triggering a self-fulfilling run on banks. In the end, the EBA
12 The bailout included a EUR 110 billion joint EU-IMF fund for Greece and a EUR 440 billion European Financial Stability Fund available to all members.
15
scenarios considered haircuts on sovereign holdings in the banks’ trading books but not in their banking books.13 Fourth, the EBA disclosed very granular bank-by-bank data (about 3,400 data points per bank compared with 149 in 2010), which allowed market participants to produce with their own estimates of recapitalization needs. In the event, differences between the recapitalization needs from the stress test results and market participants’ estimates were quite large. The EBA stress tests revealed a capital shortfall of EUR 2.5 billion (down from EUR 3.5 billion in the 2010 stress tests) while market participants’ estimates of recapitalization needs were as large as EUR 100 billion (see Ahmed et al. (2011)). Fifth, neither the EU 2010 nor the EU 2011 stress tests had full-fledged back-up plans. The EU 2011 stress tests recommended that national supervisory authorities require banks whose Core Tier 1 ratio could fall below the 5 percent threshold to “promptly remedy their capital shortfall.” A recommendation was also given for banks whose Core Tier 1 ratio was slightly above the 5 percent threshold and had sizeable exposures to sovereigns under stress, “to take specific steps to strengthen their capital position,” including through restrictions on dividends, deleveraging, issuance of fresh capital, or conversion of lower-quality instruments into Core Tier 1 capital. The back-up plans of the EU 2010 stress tests were much less explicit. All the CEBS said was that, for the institutions that had failed to meet the tests’ threshold, “the competent national authorities are in close contact with these banks to assess the results of the test and their implications, in particular in terms of need for recapitalization.” Sixth, it was not until October 2011 that there was clarity about the back-up plans. At the Euro Summit., the EU heads of state agreed that three measures were needed to restore confidence in the banking sector: (i) term funding measures including guarantees on bank liabilities and a “truly coordinated approach” in the setting-up of liquidity schemes; (ii) capitalization of banks, including requiring a significantly capital ratio of 9 percent of the highest quality capital and after accounting for market valuation of sovereign debt exposures; and (iii) state aid subject to the EU special aid crisis framework. The 2012 recapitalization exercise differed from previous stress tests in that it was a one-off asset quality review, rather than a stress test. The 2012 exercise did not use a macroeconomic scenario and nor did it consider other risks than sovereign risk. Using a higher capital threshold of 9 percent Core Tier 1 ratio (rather than 5 percent in 2011) and more severe scenarios for sovereign risk, the 2012 EU capital exercise found recapitalization needs of about EUR 116 billion.14 By October 2012 (about six months following the release of the 13 In a post-mortem of 2011 EBA stress test, Kashyap Schoenholtz, and Shin (2012) note that the greater failure of the stress test may have been its lack of attention to bank funding issues. 14 http://www.voxeu.org/article/short-guide-eba-s-recapitalisation-results

16
results), more than EUR 200 billion had been injected into the European banking system mainly using retained earnings, new equity and liability management. Public backstops, including the EU and/or international support were also used. The EBA also remained involved in asset quality reviews and capital needs assessments in Spain and Cyprus. In addition, the transition of EU bank regulation to the stronger CRD IV/CRR requirements had started and the ECB Long-Term Refinancing Operations (LTRO) and later its Outright Monetary Transactions (OMT) had helped improve market sentiment. The detailed disclosure of bank data was arguably, the main contribution of the EU 2011 exercise. The information allowed the market to come up with its own recapitalization estimates, and t the large difference between those estimates and the stress tests results (in a context of a fast deteriorating market environment and concerns about spillover from the banking sector) prompted EU countries to coordinate at the highest level and agree to undertake, within five months, the 2012 recapitalization exercise.
B. Comparing the U.S. 2009 and EU 2011 Stress Tests
The U.S. 2009 stress tests succeeded in restoring market confidence, and our event study confirms that they had a significant positive impact on the market. Several recent studies (e.g., Haben, Liesegang, and Quagliariello (2013); Ong and Pazarbasioglu (2013); and to some extent Wall (2013)) have compared the U.S. and EU stress tests in a number of “technical” dimensions, including the severity of their scenarios, the nature and level of their capital adequacy thresholds and the level of disclosure of their results.15 These studies also discuss the governance of the different stress test exercises. Our review of these studies and of the episodes themselves lead us to conclude that the broad governance of stress tests matters more to restore market confidence than the technical specification of stress tests, such as the level of the minimum capital adequacy threshold or the number of data items released per bank. It should be noted that while the U.S. 2009 stress test was based on capital plans provided by the authorities at the beginning of the exercise detailing the capital measures they intended to introduce, the EU stress tests were run on a strict static balance sheet assumption, solely allowing for certain measures that had been clearly pre-committed.
15 Goldstein and Sapra (2012) offer theoretical insights on the costs and benefits of disclosing aggregate or detailed results.
17
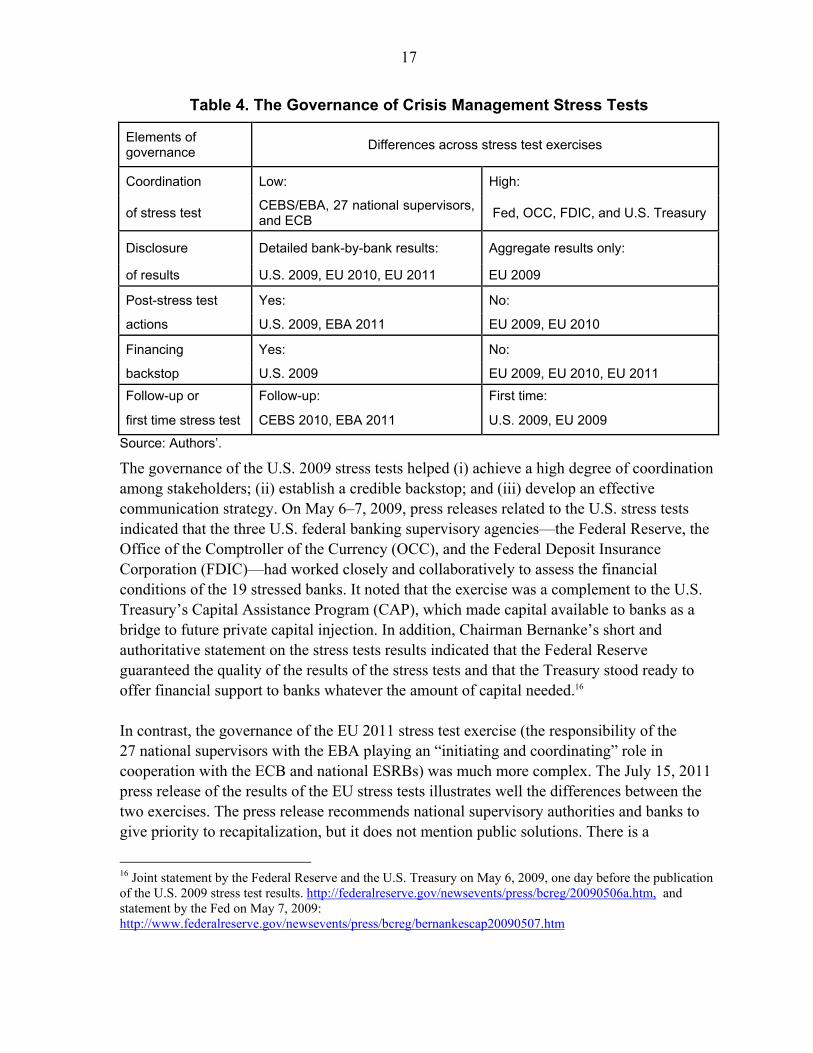
Table 4. The Governance of Crisis Management Stress Tests
Elements of governance
Differences across stress test exercises
Coordination Low: High:
of stress test CEBS/EBA, 27 national supervisors, and ECB
Fed, OCC, FDIC, and U.S. Treasury
Disclosure Detailed bank-by-bank results: Aggregate results only:
of results U.S. 2009, EU 2010, EU 2011 EU 2009
Post-stress test Yes: No:
actions U.S. 2009, EBA 2011 EU 2009, EU 2010
Financing Yes: No:
backstop U.S. 2009 EU 2009, EU 2010, EU 2011
Follow-up or Follow-up: First time:
first time stress test CEBS 2010, EBA 2011 U.S. 2009, EU 2009
Source: Authors’.
The governance of the U.S. 2009 stress tests helped (i) achieve a high degree of coordination among stakeholders; (ii) establish a credible backstop; and (iii) develop an effective communication strategy. On May 6–7, 2009, press releases related to the U.S. stress tests indicated that the three U.S. federal banking supervisory agencies—the Federal Reserve, the Office of the Comptroller of the Currency (OCC), and the Federal Deposit Insurance Corporation (FDIC)—had worked closely and collaboratively to assess the financial conditions of the 19 stressed banks. It noted that the exercise was a complement to the U.S. Treasury’s Capital Assistance Program (CAP), which made capital available to banks as a bridge to future private capital injection. In addition, Chairman Bernanke’s short and authoritative statement on the stress tests results indicated that the Federal Reserve guaranteed the quality of the results of the stress tests and that the Treasury stood ready to offer financial support to banks whatever the amount of capital needed.16 In contrast, the governance of the EU 2011 stress test exercise (the responsibility of the 27 national supervisors with the EBA playing an “initiating and coordinating” role in cooperation with the ECB and national ESRBs) was much more complex. The July 15, 2011 press release of the results of the EU stress tests illustrates well the differences between the two exercises. The press release recommends national supervisory authorities and banks to give priority to recapitalization, but it does not mention public solutions. There is a
16 Joint statement by the Federal Reserve and the U.S. Treasury on May 6, 2009, one day before the publication of the U.S. 2009 stress test results. http://federalreserve.gov/newsevents/press/bcreg/20090506a.htm, and statement by the Fed on May 7, 2009: http://www.federalreserve.gov/newsevents/press/bcreg/bernankescap20090507.htm

18
recommendation to strengthen the capital position of banks with sizeable exposures to sovereigns under stress but with no explicit recommendations on how this should be done. And finally there is even an implicit suggestion for market participants to come up with their own estimates of banks’ recapitalization needs:17 To be sure, there were important technical differences in the governance of the U.S. and EU stress tests. For instance, market concerns about risk during the U.S. 2009 stress tests were primarily of a microprudential nature, and focused on the credit risk of toxic assets and funding risks. In contrast, concerns surrounding the EU 2011 stress tests were mainly of a macroprudential nature including the interaction between sovereign risk, macroeconomic risk, and microprudential risks stemming from the banking sector. Yet, the nature of the risks in Europe was known by market participants and European supervisors alike. The reason why these risks were not incorporated in the stress tests has therefore to be found in the specific governance structure of the EU stress tests.18
VI. CONCLUDING REMARKS
Starting in 2009, a number of bank-wide stress tests have been conducted in both the United States and the European Union to restore confidence in the financial system following the 2008 global financial crisis. While the 2009 U.S. stress tests have been hailed as a success, EU-wide stress tests have generally been criticized for having failed to restore financial stability. Several studies have compared aspects of the governance of the U.S. stress tests with those of the EU stress tests to draw lessons on best practices for such exercises. The literature has so far heavily focused on the technical aspects of stress tests, such as the elaboration of scenarios or the level of disclosure of information to the public. In contrast, this paper argues that the qualitative aspects of the governance of stress tests can be key determinants of success and that most technical issues are relatively less important. An event study of the stock market reaction to the announcement and publication of all U.S. and EU-wide stress tests since 2009 yields support for this hypothesis. In line with previous studies, the results show that the U.S. 2009 stress tests had a large statistically and economically significant effect on U.S. banking stocks. However, the effect was significant only for stressed banks, not for nonstressed banks. Also, the results show that the effect of stress tests decreases over time. The event study shows that, in contrast to anecdotal evidence, not all EU stress tests were failures. The EU 2011 stress test exercise is found to have had a statistically significant
17 http://www.eba.europa.eu/risk-analysis-and-data/eu-wide-stress-testing/2011/results 18 See, for instance, Kashyap, Schoenholtz, and Shin (2011), “Why European Banks Are Stressed Out?” Wall Street Journal, 23 March 2011, http://on.wsj.com/TwlSDZ.
19
negative effect on both stressed and nonstressed banks, but other EU-wide stress tests are found to have had a significant positive impact on stressed banks. A comparison of EU-wide stress tests suggests that having more detailed disclosure of stress test results or a higher capital adequacy threshold did not help much in restoring confidence when market estimates of sovereign losses by EU banks were much higher than those reported in the EU 2011 stress tests. Instead, such a comparison points to the governance challenges that led to insufficient coordination and lack of consensus among EU members to come up with better estimates of sovereign losses and a financial backstop. The subsequent 2012 EU recapitalization exercise aimed to correct some of these challenges and the publication of its results was better received by market participants. Comparing the EU-wide stress tests with the U.S. 2009 stress tests also points to differences in the governance of the exercises as a key differentiating factor. The EU authorities faced tough questions in 2011. The definition of “unlikely but plausible” scenarios favored by market participants required to “change the rules of the game.” Sovereign assets that were classified by regulation as “riskless” needed to be reclassified as “risky” with the risk of triggering a self-fulfilling prophecy. The establishment of a financial backstop by the public sector required coordination among 27 sovereign states with different bargaining power and competing interests. Such a governance structure was at the core of the EU 2011 stress tests failure in restoring confidence. That said, the EU 2011 stress test exercise provided enough information for market participants to come up with their own estimates of recapitalization needs. These substantially larger estimates and the increasing risk of a crisis with strong spillovers between the sovereign, banking, and real sectors changed the governance structure in the EU and led to the 2012 recapitalization exercise. In a “repeated game” sense, therefore, the EU 2011 stress tests were not totally unsuccessful.
20
References Ahmed, Enam, and Andrea Appeddu, Melanie Bowler, Thomas Holinka, Juan Manuel Licari, Olga Loiseau-Aslanidi, and Zach Witton, 2011, “Europe Misses Again on Bank Stress Tests,” Regional Financial Review, Moody’s Analytics, July.
Bernanke, Ben, 2013, “Stress Testing Banks: What Have We Learned?” Speech at the "Maintaining Financial Stability: Holding a Tiger by the Tail" financial markets conference sponsored by the Federal Reserve Bank of Atlanta, Stone Mountain, Georgia, April 8, 2013.
Boehmer Ekkehart, Jim Masumeci, and Annette B. Poulsen, 1991, “Event-Study Methodology Under Conditions of Event-Induced Variance,” Journal of Financial Economics, 30:2, pp.253–272, December 1991.
Campbell, John, Andrew Lo, and Craig MacKinlay, 1997, “The Econometrics of Financial Markets,” Princeton University Press, New Jersey.
Chan-Lau Jorge, Estelle X. Liu, and Jochen M. Schmittmann, 2012, “Equity Returns in the Banking Sector in the Wake of the Great Recession and the European Sovereign Debt Crisis,” IMF Working Paper, WP/12/174, Washington D.C.
Greenlaw David, Anil K. Kashyap, Kermit Schoenholtz, Hyun. S. Shin, 2012 “Stressed Out: Macroprudential Principles for Stress Testing,” Working Paper Bo. 71, Chicago Booth Paper No. 12–08.
Goldstein Itay and Haresh Sapra, 2012, “Should Banks’ Stress Test Results Be Disclosed? An Analysis of the Costs and Benefits,” Mimeo, April, Wharton School, University of Pennsylvania and University of Chicago Booth School of Business.
Haben Piers, Caroline Liesegang, and Mario Quagliariello, 2013 “EU-wide Stress Test Versus SCAP and CCAR: Region-wide and Global Perspectives” in Comprehensive Capital Analysis Review (CCAR) and Beyond - Capital Assessment, Stress Testing and Applications, Chapter 15, Jing Zhang, Editor, Risk Books, December.
Kashyap Anil, Kermit Schoenholtz, and Hyun S. Shin, 2011, “Why European Banks Are Stressed Out?” Wall Street Journal, 23 March, http://on.wsj.com/TwlSDZ. Ong Li Lian and Ceyla Pazarbasioglu, 2013, “Credibility and Crisis Stress Testing,” IMF WP/13/178, Washington D.C. Morgan Donald, Stavros Peristiani, and Vanessa Savino, 2014, “The Information Value of the Stress Test” Journal of Money Credit and Banking, 46:7, pp. 1479–1500. Petrella, Giovanni and Andrea Resti, 2013, “Supervisors as Information Producers: Do Stress Tests Reduce Bank Opaqueness?” Journal of Banking & Finance, 37:12, pp.5406–5420. Wall, Larry, 2013, “The Adoption of Stress Testing: Why the Basel Capital Measures Were Not Enough,” Federal Reserve Bank of Atlanta, Working Paper 2013–14, December.
Related Documents