CSTEP-Note-2015-02 How Did China become the largest Solar PV Manufacturing Country? Nagalakshmi Puttaswamy and Mohd. Sahil Ali

Welcome message from author
This document is posted to help you gain knowledge. Please leave a comment to let me know what you think about it! Share it to your friends and learn new things together.
Transcript
CSTEP-Note-2015-02
How Did China become the
largest Solar PV Manufacturing
Country?
Nagalakshmi Puttaswamy and Mohd. Sahil Ali
CSTEP-Note-2015-02
© CSTEP www.cstep.in 2
The Decade of Chinese March
Globally increasing demand for solar gear and a domestic thrust on solar manufacturing have
propelled China to the top position in terms of Solar Photovoltaic (PV) manufacturing countries.
Since 2004, China’s production march on all fronts of the solar manufacturing value chain began-
poly-silicon feedstock, wafers, cells and modules. By 2008, the growth of solar industry became
formidable as the Chinese firms started reaping economies of scale in the production of purified
silicon. By then, China had become the largest PV manufacturer in the world, with 98% of its product
shipped overseas (1).
In 2009, the government identified solar manufacturing as a strategic industry and attempted to
accelerate its growth principally through a combination of low cost debt and subsidy. By 2010, China
accounted for about half of the global production of solar gear, and four out of the global top 10
solar PV cell manufacturers were Chinese (2)(3).
China’s own domestic market for PV installations gathered steam much later. Towards the end of
2007, China’s cumulative installation was only about 100 MW, representing only 1% of the total
global PV installations(4). So when the financial crisis of 2008-09 struck Europe and slowed down the
pace of PV installations, the Chinese government stimulated their domestic demand for solar gear.
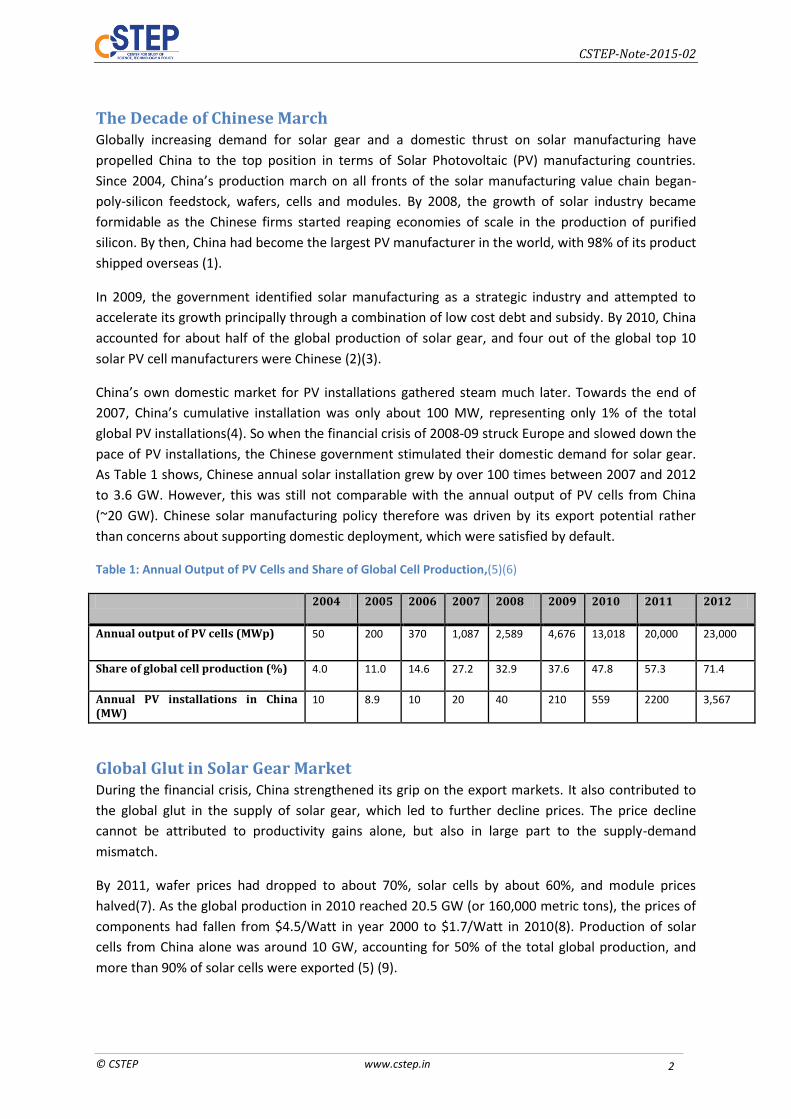
As Table 1 shows, Chinese annual solar installation grew by over 100 times between 2007 and 2012
to 3.6 GW. However, this was still not comparable with the annual output of PV cells from China
(~20 GW). Chinese solar manufacturing policy therefore was driven by its export potential rather
than concerns about supporting domestic deployment, which were satisfied by default.
Table 1: Annual Output of PV Cells and Share of Global Cell Production,(5)(6)
2004 2005 2006 2007 2008 2009 2010 2011 2012
Annual output of PV cells (MWp) 50
200 370 1,087 2,589
4,676 13,018 20,000 23,000
Share of global cell production (%) 4.0 11.0
14.6 27.2 32.9 37.6 47.8 57.3 71.4
Annual PV installations in China (MW)
10 8.9 10 20 40 210 559 2200 3,567
Global Glut in Solar Gear Market During the financial crisis, China strengthened its grip on the export markets. It also contributed to
the global glut in the supply of solar gear, which led to further decline prices. The price decline
cannot be attributed to productivity gains alone, but also in large part to the supply-demand
mismatch.
By 2011, wafer prices had dropped to about 70%, solar cells by about 60%, and module prices
halved(7). As the global production in 2010 reached 20.5 GW (or 160,000 metric tons), the prices of
components had fallen from $4.5/Watt in year 2000 to $1.7/Watt in 2010(8). Production of solar
cells from China alone was around 10 GW, accounting for 50% of the total global production, and
more than 90% of solar cells were exported (5) (9).
CSTEP-Note-2015-02
www.cstep.in © CSTEP 3
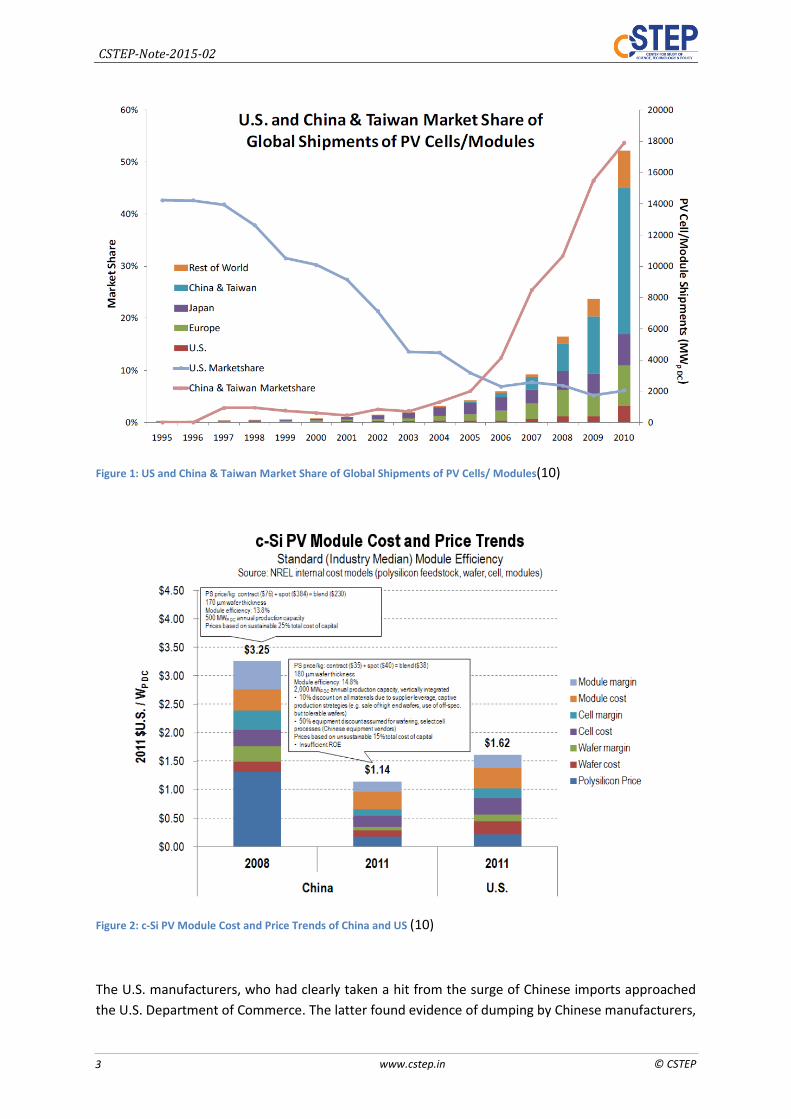
Figure 1: US and China & Taiwan Market Share of Global Shipments of PV Cells/ Modules(10)
Figure 2: c-Si PV Module Cost and Price Trends of China and US (10)
The U.S. manufacturers, who had clearly taken a hit from the surge of Chinese imports approached
the U.S. Department of Commerce. The latter found evidence of dumping by Chinese manufacturers,
CSTEP-Note-2015-02
© CSTEP www.cstep.in 4
and imposed anti-dumping and countervailing duties against them in early 2012. As a result, Chinese
PV exports to US dropped significantly and the profitability of its solar manufacturing industry
reduced from 30% in 2010 to less than 10% in 2011 (5).
In 2012, the European Union launched a dumping investigation on Chinese panels and arrived at a
similar conclusion. China and the EU reached a settlement under which Chinese exporters were
required to accept quantitative restrictions and a floor-price to imports below which anti-dumping
and anti-subsidy tariffs applied (11)(12).
Therefore, oversupply and ensuing price wars also contributed to China’s emergence as a solar
manufacturing giant. Solar panel manufacturers around the world did suffer losses as prices of solar
panels fell by three-fourths since 2008 due to demand-supply asymmetries. By the end of 2012, the
worldwide annual solar PV installed capacity had reached about 31 GW, while global production
capacity was 60 GW at least; China alone constituted 40 GW of production capacity(11)(13)(14). This
also affected state-owned banks that financed factories with low-rate loans, and provincial
governments that provided loan guarantees and land at discounted terms.
Policy Context in China
Support to Solar PV Manufacturing
The Chinese government has strongly supported the development of a world-leading solar
manufacturing industry. China's Ministry of Science and Technology (MoST) programme was created
in 1999 (MOST 1999), with an aim to support innovation by small high-tech firms. According to
MoST, an investment support of about $ 2.9 million (¥ 20 million) was provided to encourage small
technology-based firms to promote manufacturing. In addition to this, Chinese municipal
governments instated various refund policies to promote investment; China also promoted an
industrial policy with measures that included low-rate loans, tax credits, and grants. Some of these
measures are given below:
Innovation fund for small technology based firms
Refund or exemption of land fee and tax (corporate income tax, VAT and interest on loans)
by local government
Refund of electricity consumption fees
Loan guarantee by government or government-run entities
Loan and credit facilities provided by government or state banks
The National Development and Reform Commission (NDRC) programme targeted R&D development
and demonstration projects for manufacturers and R&D institutions:
Refund of import and value-added tax for R&D equipment
High tech industry development: $ 7. 3 million (¥ 50 million)
Program for R&D in 863, 973, key technologies: $ 6.2 million (¥ 42 million) (15).
According to National Renewable Energy Laboratory, China’s core cost advantage in cell
manufacturing comes largely from scale economies and vertical integration. All these factors have
provided 18-20% core cost advantage for Chinese cell manufactures (exclusive of shipping costs). In
CSTEP-Note-2015-02
www.cstep.in © CSTEP 5
the context of global glut, Chinese module prices further declined from $3.25/ Wp to $1.14/ Wp
from 2008 to 2011 (10).
Solar PV Deployment Policies
China has made a conscious effort towards accelerating solar PV installation by addressing the
financial and regulatory barriers that hampered deployment. In March 2009, the Ministry of Finance,
togetherwith the Ministry of Urban and Rural Development introduced a national PV subsidy
programme to promote the use of Building Integrated PV (BIPV) applications and rooftop systems.
This turned out to be a turning point in China’s PV market. In July 2009, the Ministry of Finance,
together with the Ministry of Science and Technology and NDRC unveiled the second national PV
subsidy package- the Golden Sun Program- designed to subsidise 6,00MW of PV demonstration
projects for the following two to three years. A competitive bidding scheme for price-discovery in
solar PV projects was also initiated under the programme. The benchmark tariffs, or ‘pre-approved
price levels’ were set on the basis of competitive bidding for specific quantities of solar PV in
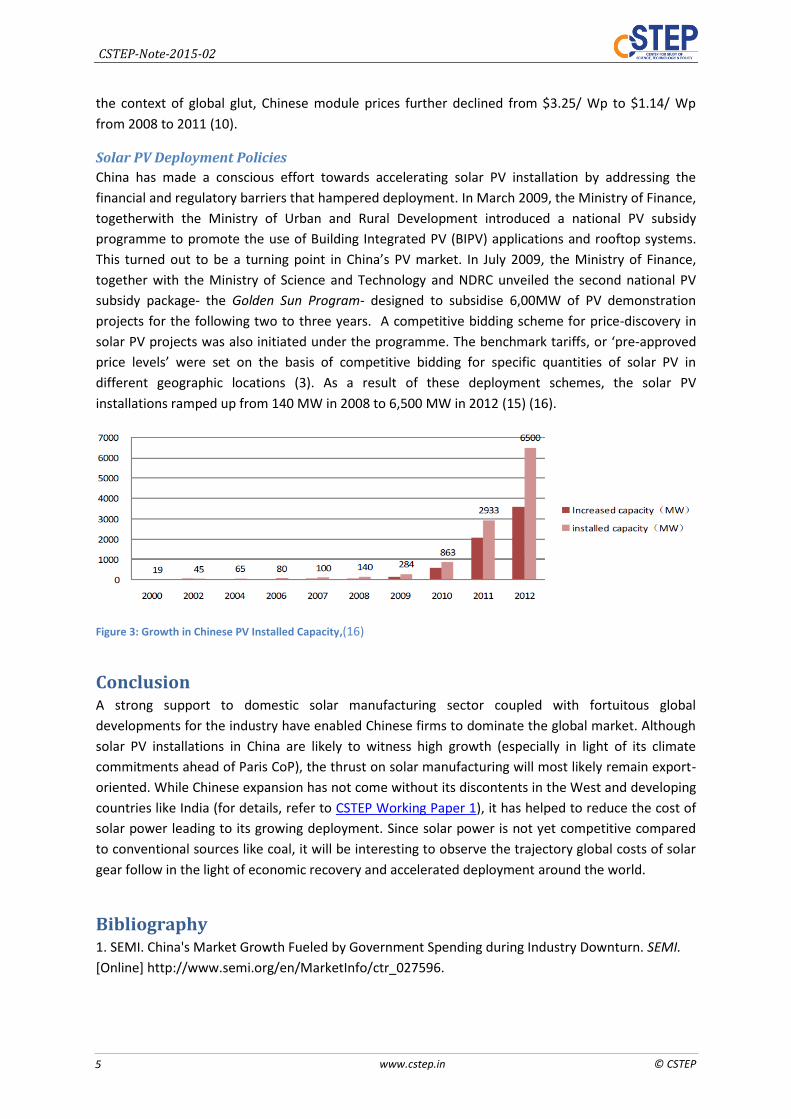
different geographic locations (3). As a result of these deployment schemes, the solar PV
installations ramped up from 140 MW in 2008 to 6,500 MW in 2012 (15) (16).
Figure 3: Growth in Chinese PV Installed Capacity,(16)
Conclusion A strong support to domestic solar manufacturing sector coupled with fortuitous global
developments for the industry have enabled Chinese firms to dominate the global market. Although
solar PV installations in China are likely to witness high growth (especially in light of its climate
commitments ahead of Paris CoP), the thrust on solar manufacturing will most likely remain export-
oriented. While Chinese expansion has not come without its discontents in the West and developing
countries like India (for details, refer to CSTEP Working Paper 1), it has helped to reduce the cost of
solar power leading to its growing deployment. Since solar power is not yet competitive compared
to conventional sources like coal, it will be interesting to observe the trajectory global costs of solar
gear follow in the light of economic recovery and accelerated deployment around the world.
Bibliography 1. SEMI. China's Market Growth Fueled by Government Spending during Industry Downturn. SEMI.
[Online] http://www.semi.org/en/MarketInfo/ctr_027596.
CSTEP-Note-2015-02
© CSTEP www.cstep.in 6
2. Jiahua Pan, Haibing Ma and Ying Zhang. Green Economy and Green Jobs in China, Current Status
and Potentials for 2020. Worldwatch Institute. [Online] 2011.
http://www.worldwatch.org/system/files/185%20Green%20China.pdf.
3. PV Group, SEMI, CPIA.China Solar Future - A Recommnended China PV Policy Roadmap. April,
2011.
4. European Photovoltaic Industry Association.Global Market Outlook for Photovoltaics untill 2016.
2012.
5. Fisher, Doris. Green industrial policies in China- the example of solar energy. [book auth.] Anna
Pegels. Green Industrial Policy in Emerging Countries. s.l. :
http://books.google.co.in/books?id=C4n8AgAAQBAJ&pg=PA77&lpg=PA77&dq=evolution+of+china%
27s+solar+PV+manufacturing+industry&source=bl&ots=l5o1-LSY2O&sig=n6NwEFzH7-f-VzeJDPjLI-
Zbhjg&hl=en&sa=X&ei=NpAFVLeXNs248gWR7ILQCg&ved=0CGIQ6AEwBzgK#v=onepage&q=evolutio,
2014.
6. Yiteng, Xing. Overview on Solar Power Development in China- Status, Polcies and Trends. Asia
solar energy forum. [Online] http://asiasolarenergyforum.org/wp-content/uploads/2013/11/Xing-
Yiteng_PRC_Overview-of-Solar-Power-in-China.pdf.
7. Solar Cell Central. Solar Markets. Solar Cell Central. [Online]
http://solarcellcentral.com/markets_page.html.
8. Sara Emilsson. The Chinese Five Year Plan- Shaping the Global Cleantech Market. CLEANTECH
FUNDING. [Online] April 2014. http://cleantechfunding.org/2014/04/03/the-chinese-five-year-plan-
shaping-the-global-cleantech-market/.
9. The Government of the People’s Republic of China. American Solar Manufacturing. 12th Five-Year
Plan for the Solar Photovoltaic Industry. [Online]
http://www.americansolarmanufacturing.org/news-releases/chinas-five-year-plan-for-solar-
translation.pdf.
10. Goodrich, Alan, James, Ted and Woodhouse, Michael.Solar PV Manufacturing Cost Analysis: U.S.
Competitveness in Global Industry. s.l. : Stanford University: Precourt Institute for Energy and NREL,
10 Oct, 2011.
11. Chen, Zenghao.China’s Socio-Economic Transition and The Development of Chinese Solar Power
Industry. 2014.
12. EUbusiness Ltd. EU imposes anti dumping measures on some Chinese solar panels. EUbusiness.
[Online] Dec 2013. http://www.eubusiness.com/news-eu/china-solar-energy.rve/.
13. MATT DAILY. Solar production glut to persist to 2015: study. REUTERS. [Online] June 2012.
http://in.reuters.com/article/2012/06/26/us-solar-forecasts-idINBRE85P10K20120626.
14. European Photovoltaic Industry Association.Global Market Outlook for Photovoltaics 2013-2017.
CSTEP-Note-2015-02
www.cstep.in © CSTEP 7
15. Thilo Grau, Molin Huo, Karsten Neuhoff.Survey of Photovoltaic Industry and Policy in Germany
and China. s.l. : Climate Policy Initiative, DIW Berlin and Tsinghua University, 2011.
16. Yiteng, Xing. Overview on Solar Power Development in China- Status, Polcies and Trends. Asia
Solar Energy Forum. [Online] http://asiasolarenergyforum.org/wp-content/uploads/2013/11/Xing-
Yiteng_PRC_Overview-of-Solar-Power-in-China.pdf.
17. The Hindu. India not to impose anti-dumping duty on solar panels: Nirmala. The Hindu. [Online]
Sept 2014. http://www.thehindu.com/business/Economy/india-not-to-impose-antidumping-duty-
on-solar-panels-nirmala/article6397475.ece.
Related Documents