IM 8 Ch 7.2.2 How Does Y Change With Respect To X CPM Materials modified by Mr. Deyo Common Core Standard: 8.EE.6 How can I use the graph to figure out which racer is faster? How can we find the unit rate for each racer? What if the line does not pass through (0, 0)?

Welcome message from author
This document is posted to help you gain knowledge. Please leave a comment to let me know what you think about it! Share it to your friends and learn new things together.
Transcript

IM 8 Ch 7.2.2 How Does Y Change With Respect To X
CPM Materials modified by Mr. Deyo
Common Core Standard: 8.EE.6
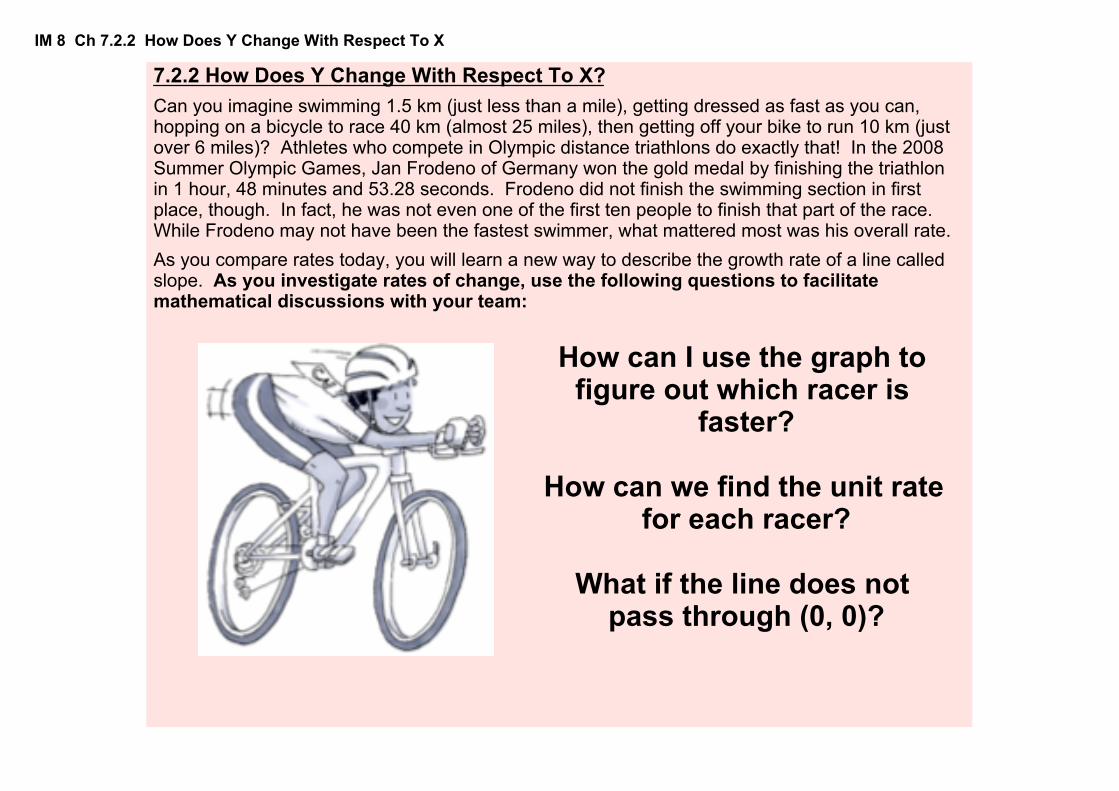
How can I use the graph to figure out which racer is
faster?
How can we find the unit rate for each racer?
What if the line does not pass through (0, 0)?

IM 8 Ch 7.2.2 How Does Y Change With Respect To X
By the end of the period, I will describe the rate of change of a line (slope) numerically, as the ratio between the vertical change and horizontal change.
I will demonstrate this by completing Four‑Square notes and by solving problems in a pair/group activity.
Learning TargetTitle: IM8 ‑ Ch. 7.2.2 How Does Y Change With Respect to X? Date:

IM 8 Ch 7.2.2 How Does Y Change With Respect To X
Home Work: Sec. 7.2.2Desc. Date Due
Review & Preview
4 Problems: 7‑49, 7‑50, 7‑52, 7‑54

IM 8 Ch 7.2.2 How Does Y Change With Respect To X

IM 8 Ch 7.2.2 How Does Y Change With Respect To X
Vocabulary1) Slope
2) Positive Slope
3) Negative Slope
4) yintercept
5) y = mx + b

IM 8 Ch 7.2.2 How Does Y Change With Respect To X
IM 8 Ch 7.2.2 How Does Y Change With Respect To X
7.2.2 How Does Y Change With Respect To X?Can you imagine swimming 1.5 km (just less than a mile), getting dressed as fast as you can, hopping on a bicycle to race 40 km (almost 25 miles), then getting off your bike to run 10 km (just over 6 miles)? Athletes who compete in Olympic distance triathlons do exactly that! In the 2008 Summer Olympic Games, Jan Frodeno of Germany won the gold medal by finishing the triathlon in 1 hour, 48 minutes and 53.28 seconds. Frodeno did not finish the swimming section in first place, though. In fact, he was not even one of the first ten people to finish that part of the race. While Frodeno may not have been the fastest swimmer, what mattered most was his overall rate.As you compare rates today, you will learn a new way to describe the growth rate of a line called slope. As you investigate rates of change, use the following questions to facilitate mathematical discussions with your team:
How can I use the graph to figure out which racer is
faster?
How can we find the unit rate for each racer?
What if the line does not pass through (0, 0)?
IM 8 Ch 7.2.2 How Does Y Change With Respect To X
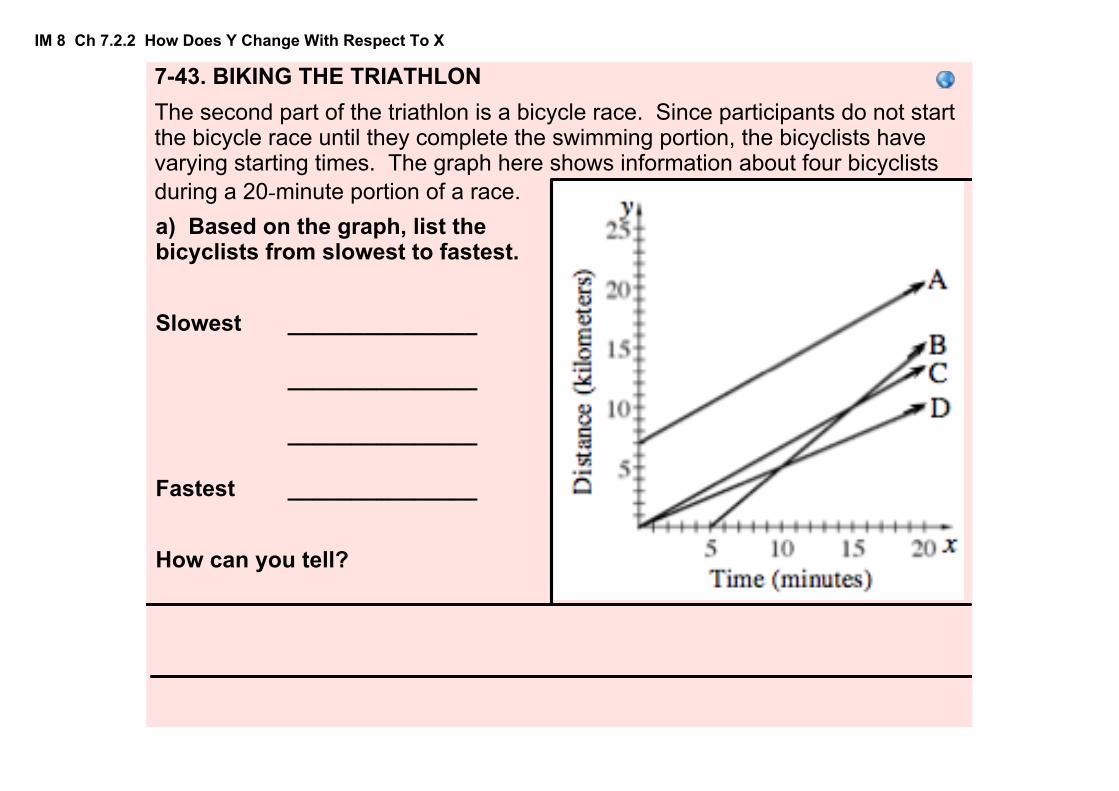
743. BIKING THE TRIATHLONThe second part of the triathlon is a bicycle race. Since participants do not start the bicycle race until they complete the swimming portion, the bicyclists have varying starting times. The graph here shows information about four bicyclists during a 20‑minute portion of a race.
https://www.desmos.com/calculator/krzwcmbnh7
a) Based on the graph, list the bicyclists from slowest to fastest.
Slowest _______________
_______________
_______________
Fastest _______________
How can you tell?

IM 8 Ch 7.2.2 How Does Y Change With Respect To X
743b,c. BIKING THE TRIATHLONLydia wants to describe each bicyclist’s rate in kilometers per minute for an article in the school paper. To do this, she sketched triangles like the one for line A on the graph at right.
https://www.desmos.com/calculator/krzwcmbnh7
b) Where do the 4 and 6 come from on Racer A’s triangle?
What do they represent?
http://www.cpm.org/pdfs/stuRes/CC3/chapter_07/CC3%20Lesson%207.2.2%20RP.pdf
c) These numbers can be written as a rate in kilometers per minute to describe the distance the bicyclist rides as time passes. The fraction
represents how the graph of the line goes up 4 units for every 6 units that it moves to the right. The number is called the slope of the line.
46
46

IM 8 Ch 7.2.2 How Does Y Change With Respect To X
743c(continued). BIKING THE TRIATHLON https://www.desmos.com/calculator/krzwcmbnh7http://www.cpm.org/pdfs/stuRes/CC3/chapter_07/CC3%20Lesson%207.2.2%20RP.pdf
c) On the Lesson 7.2.2 Resource Page, find the slope of each of the other three lines.
A:
B:
C:
D:
46

IM 8 Ch 7.2.2 How Does Y Change With Respect To X
743d. BIKING THE TRIATHLON https://www.desmos.com/calculator/krzwcmbnh7http://www.cpm.org/pdfs/stuRes/CC3/chapter_07/CC3%20Lesson%207.2.2%20RP.pdf
d) Did the slopes in part (c) confirm your ranking from slowest to fastest in part (a)?
If not, review your slopes and your comparison of rates based on the graph to find any mistakes.

IM 8 Ch 7.2.2 How Does Y Change With Respect To X
744a. Look at your “Biking The Triathlon” Resource Page from problem 7‑43. Slope can also be thought of as a unit rate. Remember that a unit rate compares the change in one quantity to a one‑unit change in another quantity. a) Find the unit rate for each of the triathlon bicyclists. Make sure you label the units.
http://www.cpm.org/pdfs/stuRes/CC3/chapter_07/CC3%20Lesson%207.2.2%20RP.pdf
A:
B:
C:
D:
46 =
=
=
=
23

IM 8 Ch 7.2.2 How Does Y Change With Respect To X
744b) Write each of the bicyclists' rates as a decimal rounded to the nearest one‑hundredth of a kilometer per minute.
http://www.cpm.org/pdfs/stuRes/CC3/chapter_07/CC3%20Lesson%207.2.2%20RP.pdf
A:
B:
C:
D:
23 =__.____
=__.____
=__.____
=__.____When you order the bicyclists’ rates, do you get the same results as in problem 743?

IM 8 Ch 7.2.2 How Does Y Change With Respect To X
745.While comparing the rates from problem 743, a study team is struggling to decide how to tell which athlete is moving faster.
Leo thinks that because athlete A’s line is highest on the graph, he is traveling faster.
Kara disagrees. “He starts first, but racer B is moving faster."
Look at the graph of bicyclists A and B above and discuss this with your team. Explain your reasoning.
Which person do you agree with?

IM 8 Ch 7.2.2 How Does Y Change With Respect To X
746. In Chapter 4 (problems 48 through 410), you looked at how tile patterns grow. You examined how the growth rate could be seen in the table, graph, and rule for the pattern. One of the patterns that you looked at and its graph are shown here.
a) What is the growth rate for this pattern?
How can you tell?
b) What is the slope of the line on the graph?
How does this value compare to the growth rate for the pattern?

IM 8 Ch 7.2.2 How Does Y Change With Respect To X
747. Mr. Regnier’s class has been struck with hiccups! Three of the students track their number of hiccups over time. Assume each student hiccups at a constant rate.
a) Which student has the most hiccups per minute? Justify your answer.
b) Find the slope that describes the rate of hiccups for each student. What does the slope tell you about each student?
c) If you graphed a line for the student who hiccups 4 times per minute, would the line be steeper, less steep, or the same steepness as the line in the graph for Student II? Explain your reasoning.
Student I
Student II
Student III
=__.__
=__.__
=__.__
287

IM 8 Ch 7.2.2 How Does Y Change With Respect To X
748. Additional Challenge: CHANGING LINESLupe is a manager of an assembly line at a manufacturing company that makes cars. The speed at which the cars are usually built is represented by the graph.
a) Build 200 cars every 4 hours.
b) Build 75 cars every hour.
c) Build 500 cars every 5 hours.
d) Decrease the time it takes to make each car.
Lupe has decided to increase the number of cars built each day and has written directions for her employees. How would each of her directions below change the number of cars built each day? Explain how you know.

IM 8 Ch 7.2.2 How Does Y Change With Respect To X
749. Compare the graphs of lines A, B, and C
a) Which line has the greatest slope? Justify your answer.
b) What is the yvalue of line A when x = 2?
http://homework.cpm.org/cpmhomework/homework/category/CC/textbook/CC3/chapter/Ch7/lesson/7.2.2/problem/749
c) Compare the slopes of lines B and C.

IM 8 Ch 7.2.2 How Does Y Change With Respect To X
750. Lydia drew a graph of four athletes in the final part of the triathlon, the 10 km run. She found the slope of each runner’s line. Her results are listed below.
Runner A: slope =
Runner B: slope =
Runner C: slope =
Runner D: slope =
http://homework.cpm.org/cpmhomework/homework/category/CC/textbook/CC3/chapter/Ch7/lesson/7.2.2/problem/750
26
37
5 12 4 10
List the runners from slowest to fastest.
___, ___, ___, ___Slowest Fastest

IM 8 Ch 7.2.2 How Does Y Change With Respect To X
751. If a car is parked on the side of the road and not moving, what is its speed?
What would it look like on a graph of time and distance?
http://homework.cpm.org/cpmhomework/homework/category/CC/textbook/CC3/chapter/Ch7/lesson/7.2.2/problem/751

IM 8 Ch 7.2.2 How Does Y Change With Respect To X
752. The class advisor was helping students plan an endofyear trip. The students were surveyed about their choices. The results are shown in the circle graph. http://homework.cpm.org/cpmhomework/homework/category/CC/textbook/CC3/
chapter/Ch7/lesson/7.2.2/problem/752
a) What percent of the students chose the water park?
b) Which two results are very close?
c) Write a recommendation to the class advisor regarding what the next step would be.

IM 8 Ch 7.2.2 How Does Y Change With Respect To X
753. Solve this problem by defining a variable, writing an equation, and solving it. Write your solution in a sentence.
_______ students attended the fall play.
http://homework.cpm.org/cpmhomework/homework/category/CC/textbook/CC3/chapter/Ch7/lesson/7.2.2/problem/753
The number of students attending the fall play was 150 fewer than three times the number of adults. Together, students and adults purchased 1778 tickets. How many students attended the fall play?

IM 8 Ch 7.2.2 How Does Y Change With Respect To X
754. The figures below are similar. Use the information given about the lengths of the sides to solve for x and y.
http://homework.cpm.org/cpmhomework/homework/category/CC/textbook/CC3/chapter/Ch7/lesson/7.2.2/problem/754
x = y =
Related Documents