Journal of Theoretical Biology 249 (2007) 422–436 How affinity influences tolerance in an idiotypic network Emma Hart a, , Hugues Bersini b , Francisco C. Santos b a School of Computing, Napier University, Edinburgh, Scotland, UK b IRIDIA, CoDE, CP 194/6, Universite´Libre de Bruxelles, Avenue Franklin Roosevelt 50, 1050 Brussels, Belgium Received 27 October 2006; received in revised form 6 June 2007; accepted 20 July 2007 Available online 8 August 2007 Abstract Idiotypic network models give one possible justification for the appearance of tolerance for a certain category of cells while maintaining immunization for the others. In this paper, we provide new evidence that the manner in which affinity is defined in an idiotypic network model imposes a definite topology on the connectivity of the potential idiotypic network that can emerge. The resulting topology is responsible for very different qualitative behaviour of the network. We show that using a 2D shape-space model with affinity based on complementary regions, a cluster-free topology results that clearly divides the space into distinct zones; if antigens fall into a zone in which there are no available antibodies to bind to, they are tolerated. On the other hand, if they fall into a zone in which there are highly concentrated antibodies available for binding, then they will be eliminated. On the contrary, using a 2D shape space with an affinity function based on cell similarity, a highly clustered topology emerges in which there is no separation of the space into isolated tolerant and non-tolerant zones. Using a bit-string shape space, both similar and complementary affinity measures also result in highly clustered networks. In the networks whose topologies exhibit high clustering, the tolerant and intolerant zones are so intertwined that the networks either reject all antigen or tolerate all antigen. We show that the distribution and topology of the antibody network defined by the complete set of nodes and links—an autonomous feature of the system—therefore selects which antigens are tolerated and which are eliminated. r 2007 Elsevier Ltd. All rights reserved. Keywords: Idiotypic immune networks; Affinity functions; Complex networks 1. Introduction One of the key aspects of the idiotypic network first proposed by Jerne is the manner in which the affinity between clones is defined, this affinity ultimately giving rise to the network itself. Jerne himself specifically addressed this issue in his Nobel lecture in 1984 (Jerne, 1985) in which he compared this affinity with the matching problem between pieces of sentence (for example referring to Chomsky’s work on universal grammar). Jerne’s suspicion was that the manner in which affinity was defined would determine the properties of the resultant networks of connected clones. The key role played by the definition of the pair-wise affinities between the components of a network has been apparent in many proposed models which simulate the ontogenesis of the immune network, e.g., De Boer and Perelson (1991), Calenbuhr et al. (1995) and Detours et al. (1996). However, the work of Varela and Coutinho (Varela and Coutinho, 1991; Varela et al., 1988) pushes this concept even further in making a clear link between the affinity and the topology of the resulting network connectivity. Despite the lack of empirical data relating to the connectivity matrix which made it impos- sible to make any definitive statement on the analytical nature of the topology, it is evident that Varela did not see the connectivity of the network as simply random like in an Erdo¨s graph (Bolloba´s, 2001), but rather well structured and playing a key role in the functionality of the system. For instance, he discussed the topology of this connectivity as a possible cause or signature of some auto-immune diseases whose treatment was inspired by this new network perspective. He showed, again using very scant data, that people suffering from auto-immune disease could present a less densely connected network than healthy ARTICLE IN PRESS www.elsevier.com/locate/yjtbi 0022-5193/$ - see front matter r 2007 Elsevier Ltd. All rights reserved. doi:10.1016/j.jtbi.2007.07.019 Corresponding author. Tel.: +44 131 4552783; fax: +44 131 455 2727. E-mail addresses: [email protected] (E. Hart), [email protected] (H. Bersini), [email protected] (F.C. Santos).

Welcome message from author
This document is posted to help you gain knowledge. Please leave a comment to let me know what you think about it! Share it to your friends and learn new things together.
Transcript
ARTICLE IN PRESS
0022-5193/$ - se
doi:10.1016/j.jtb
�CorrespondE-mail addr
(H. Bersini), fsa
Journal of Theoretical Biology 249 (2007) 422–436
www.elsevier.com/locate/yjtbi
How affinity influences tolerance in an idiotypic network
Emma Harta,�, Hugues Bersinib, Francisco C. Santosb
aSchool of Computing, Napier University, Edinburgh, Scotland, UKbIRIDIA, CoDE, CP 194/6, Universite Libre de Bruxelles, Avenue Franklin Roosevelt 50, 1050 Brussels, Belgium
Received 27 October 2006; received in revised form 6 June 2007; accepted 20 July 2007
Available online 8 August 2007
Abstract
Idiotypic network models give one possible justification for the appearance of tolerance for a certain category of cells while
maintaining immunization for the others. In this paper, we provide new evidence that the manner in which affinity is defined in an
idiotypic network model imposes a definite topology on the connectivity of the potential idiotypic network that can emerge. The resulting
topology is responsible for very different qualitative behaviour of the network. We show that using a 2D shape-space model with affinity
based on complementary regions, a cluster-free topology results that clearly divides the space into distinct zones; if antigens fall into a
zone in which there are no available antibodies to bind to, they are tolerated. On the other hand, if they fall into a zone in which there are
highly concentrated antibodies available for binding, then they will be eliminated. On the contrary, using a 2D shape space with an
affinity function based on cell similarity, a highly clustered topology emerges in which there is no separation of the space into isolated
tolerant and non-tolerant zones. Using a bit-string shape space, both similar and complementary affinity measures also result in highly
clustered networks. In the networks whose topologies exhibit high clustering, the tolerant and intolerant zones are so intertwined that the
networks either reject all antigen or tolerate all antigen. We show that the distribution and topology of the antibody network defined by
the complete set of nodes and links—an autonomous feature of the system—therefore selects which antigens are tolerated and which are
eliminated.
r 2007 Elsevier Ltd. All rights reserved.
Keywords: Idiotypic immune networks; Affinity functions; Complex networks
1. Introduction
One of the key aspects of the idiotypic network firstproposed by Jerne is the manner in which the affinitybetween clones is defined, this affinity ultimately giving riseto the network itself. Jerne himself specifically addressedthis issue in his Nobel lecture in 1984 (Jerne, 1985) in whichhe compared this affinity with the matching problembetween pieces of sentence (for example referring toChomsky’s work on universal grammar). Jerne’s suspicionwas that the manner in which affinity was defined woulddetermine the properties of the resultant networks ofconnected clones. The key role played by the definition ofthe pair-wise affinities between the components of anetwork has been apparent in many proposed models
e front matter r 2007 Elsevier Ltd. All rights reserved.
i.2007.07.019
ing author. Tel.: +44 131 4552783; fax: +44 131 455 2727.
esses: [email protected] (E. Hart), [email protected]
[email protected] (F.C. Santos).
which simulate the ontogenesis of the immune network,e.g., De Boer and Perelson (1991), Calenbuhr et al. (1995)and Detours et al. (1996). However, the work of Varela andCoutinho (Varela and Coutinho, 1991; Varela et al., 1988)pushes this concept even further in making a clear linkbetween the affinity and the topology of the resultingnetwork connectivity. Despite the lack of empirical datarelating to the connectivity matrix which made it impos-sible to make any definitive statement on the analyticalnature of the topology, it is evident that Varela did not seethe connectivity of the network as simply random like in anErdos graph (Bollobas, 2001), but rather well structuredand playing a key role in the functionality of the system.For instance, he discussed the topology of this connectivityas a possible cause or signature of some auto-immunediseases whose treatment was inspired by this new networkperspective. He showed, again using very scant data,that people suffering from auto-immune disease couldpresent a less densely connected network than healthy
ARTICLE IN PRESS
1Note that the usefulness of shape space as a concept for modelling
protein interaction has been challenged by Carneiro and Stewart
(Carneiro et al. (1996)) who take the view that interactions between
proteins (both idiotypic and otherwise) are essentially a relational
phenomenon and that therefore the affinity between molecules cannot
be predicted from the characteristics of the two isolated molecules. They
therefore propose a model in which affinities are generated by a procedure
based on random assignment which implies no intrinsic topology in the
resulting matrices.
E. Hart et al. / Journal of Theoretical Biology 249 (2007) 422–436 423
ones. This reduction in connectivity could decrease thenetwork effect and thereby provoke homeostatic failure byperturbing the emergent regulatory effect of this network.
The quest to understand the structure and functionalityof all types of biological networks continues, but is makinggreat advances with new experimental techniques whichfacilitate the study of large sets of empirical data, forexample protein-interaction networks. Further advance-ments in our knowledge and understanding are being madeby a new generation of physicists enthusiastic about small-world effects and scale-free topology (Barabasi and Albert,1999; Sole et al., 2002). This paper carries on this questwith new and very unexpected findings, first presented in apreliminary form in Hart et al. (2006).
1.1. Background: affinity measures in idiotypic networks
The study of the effects of affinity between cells wasfacilitated by the notion of shape space introduced byPerelson (1989) as a method for representing biologicalmolecules and therefore capturing affinities between them.This affords the modeller a variety of alphabets andtherefore spaces in which to study the interaction of cells.The most common choices are to adopt a bit-stringuniverse or an n-dimensional real (or integer) valued space.In practice, the bit-string model is predominantly used as itoffers a rich diversity in the manner in which strings caninteract; a number of affinity functions have been proposedwhich are physiologically plausible based on findingcomplementary matching regions between two strings(Perelson, 1989).
However, a low-dimensional integer representation ofcells offers some advantages in that interactions betweencells can be visualized and therefore analysed. Although itis perhaps more natural to define affinity between two cellsin for example a 2D integer-space in terms of theirproximity and therefore similarity to each other, affinityin terms of complementarity can also be defined in such auniverse. Stewart and Coutinho (2004), propose a modelbased on a simplified version of shape space in whichpoints on a 2D grid represented a pair of perfectlycomplementary shapes with maximal affinity. Their simplemodel showed that a self-sustaining network could arise asa result which they propose correspond to molecular self.Furthermore, they go on to show that external antigens aretolerated by this network, i.e. they are assimilated into themolecular self by the network.
In related work, Bersini (2002) proposed a shape-spacemodel implemented in 2D in which affinity was based uponcomplementary matching between cells by supposing that acell exerts a domain of affinity in a zone which is situated inregion obtained by reflecting the cell through the centre ofsymmetry of the space. It was shown that this led to amodel in which regions of tolerance and intoleranceemerged naturally from the dynamics of the idiotypicnetwork, without need for pre-defining cells as being of aparticular type. This model was later explored in greater
depth by Hart in Hart and Ross (2005a, b), and Hart(2005) and later Dilger in Dilger and Strangfield (2006)which confirmed that these zones exist and furthermoreshowed that the shape of the zones, and therefore thesubsequent properties of the network could be controlledby altering the shape of the domain of affinity exerted by acell.1
In this paper, we show that contrary to opinion, thedefinition of affinity imposes a very definite topology on anemerging network, which has subsequent important con-sequences for the properties that we can expect a networkto exhibit. The paper is organized as follows. First, twodifferent network models are introduced, in 2D and in abit-string universe. We then show how the 2D model withcomplementary matching gives rise to tolerant and intol-erant zones in the shape space. This is then contrasted tothe bit-string shape space with an affinity function basedon Hamming distance in which tolerance cannot beobtained. We explain the anomalous results we find byfirst analysing a 2D model with a similarity-based affinityfunction which can be visualized in a straightforwardmanner. This indicates that the topology of the networkdefined by the affinity function plays a key role in thedynamics. Finally, we confirm our hypothesis by directlyinvestigating the dynamics of network growth on a rangeof potential topologies.
2. Description of network models
In this section, we describe the 2D and bit-stringmodels in which we obtain our results. In as far aspossible, the models are equivalent in the manner in whichpotential cells are introduced, and in the methods by whicha cell stimulates (or is stimulated by) other cells. Thedifferences lie only in the representation of cells used, andtherefore the manner in which affinity between cells iscalculated.
2.1. 2D shape-space model
The following 2D shape-space model was first proposedby Bersini (2002) and subsequently adopted in furtherwork by Hart and Ross (2005a, b), and Hart (2005) inwhich the effect of the shape of the cell recognition regionwas explored. The shape space is defined on a 2D integer-grid of dimension X ;Y . A cell is specified by a positionðx; yÞ on the grid. The potential network therefore consistsof a possible X � Y cells. Cells can be considered as

ARTICLE IN PRESSE. Hart et al. / Journal of Theoretical Biology 249 (2007) 422–436424
connected nodes on a graph if one cell is stimulated byanother cell. The manner in which one cell stimulatesanother depends on the affinity function defined. If affinityis defined as complementary, then two cells A and B have anon-zero affinity if B lies within a circular region of radius r
centred on the point ðX � x;Y � yÞ. On the other hand, ifaffinity is defined between similar cells, then A and B have anon-zero affinity if B lies within a circular region of radius r
centred on A itself. For all cells that lie within a distance r
of one of the four boundaries of the shape space, then partof their circular recognition region will fall outside of theshape space, ðX ;Y Þ. Any region outwith the shape space issimply ignored, i.e., there are no periodic boundaryconditions. (The choice of concentration values given fornew antibodies and antigens in the algorithm below wasdetermined through empirical investigation. This is dis-cussed in detail in Section 3.1.) Using these definitions, thefollowing algorithm can be used to simulate the growth onan idiotypic network in which there are potential interac-tions between both antibodies and antibodies, andantibodies and antigens:
1.
Generate at random a new antibody ðx; yÞ and add withconcentration 10.2.
(Possibly) add a new antigen with coordinates ðxa; yaÞand concentration 1000.
3. Calculate the stimulation SAb of each antibody. 4. If LoSAboU , increase the concentration of the anti-body by 1, otherwise decrease it by 1.
5. Calculate the stimulation SAg of each antigen. 6. If LoSAg, decrease the concentration of the antigen Acsuch that Ac Ac � SAg=ðL � f Þ, where f is simply ascaling factor.
7.
Remove any cells (antibody or antigen) with concentra-tion 0.Stimulation of antibodies and antigens is calculatedaccording to the equations below, where SAb represents thetotal stimulation of an antibody Ab and SAg represents thetotal stimulation of an antigen Ag. The affinity betweenany two cells represented in a 2D shape space by points i
and j is given by Eq. (1). (Note that the equation holdsgiven that r4Dði; j0Þ, otherwise the affinity is zero.) Theterm Dði; j0Þ represents the Euclidean distance in shapespace between the cells, where j0 is the complement ofpoint j, on which the recognition region of j is centred.(In the similarity model, j ¼ j0.) The term Ci represents theconcentration of cell i. r represents the radius of thecircular recognition region surrounding each complemen-tary point. The total affinity exerted by a cell representedby a point in shape space i is influenced by theconcentration of the cell i, and is given by Eq. (1).According to this equation, affinity is maximal when Dði; j0Þis zero, i.e., j0 lies exactly at the centre of the complemen-tary region. The affinity decreases as Dði; j0Þ increases, thatis, cells lying closer to the centre of the circular recognitionregion provide more stimulation than those further away.
If Dði; j0Þ4r then i exerts no affinity on j0:
affinityði; jÞ ¼ Ciðr�Dði; j0ÞÞ
if Dði; j0Þpr; ¼ 0 otherwise ð1Þ
SAb ¼X
antibodies E
affinityðE;AbÞ
þX
antigens A
affinityðA;AbÞ, ð2Þ
SAg ¼X
antibodies E
affinityðE;AbÞ. (3)
2.2. Bit-string model
Except for the definition of clone identity, the bit-stringmodel closely follows the previous description given for the2D shape space, maintaining a complementarity-basedaffinity rule. Instead of a point in a plane, each cell is nowidentified by a binary bit-string of N bits and the affinity acell i exerts on another cell j is defined by the followingequation:
affinityði; jÞ ¼ 100 � Ci � ðHDði; jÞ � TÞ=ðNbits � TÞ (4)
with Ci being the concentration of the cell i, HD thehamming distance between the two bitstrings and T,the affinity threshold, playing an equivalent role of theparameter r in the 2D shape-space model, provided that(HDði; jÞ � TÞ is positive, otherwise the affinity is 0.Like before, the total affinity (field) received by a cell i,
Si, is obtained by summing the affinity for all cells presentin the system, given that this affinity can either be positiveor null, as in Eqs. (2) and (3). As in the 2D scenario,antibodies can be stimulated by antigens and antibodies,while antigens interact only with antibodies, and not withother antigens.Keeping the system as similar as possible to the 2D
shape-space model, the algorithm is as follows:
1.
Generate at random a new antibody cell (bit-string)having an affinity field between L and U, withconcentration 75.2.
(Possibly) add a new antigen with concentration 100. 3. Calculate the stimulation SAb received by each antibody. 4. If LoSAboU , increase the concentration of the anti-body by 1, otherwise decrease it by 1.
5. Calculate the stimulation SAg received by each antigenaccordingly.
6. If LoSAg, decrease the concentration by 1. 7. Remove any cells whose concentration has reached 0.Regarding the idiotypic network as just a graph, we maysay that a cell A is connected with a cell B, if the hammingdistance between A and B is higher than this threshold T.A high T value imposes a system where an almost perfectcomplementarity is needed for stimulation, whereas a low
ARTICLE IN PRESSE. Hart et al. / Journal of Theoretical Biology 249 (2007) 422–436 425
T tolerates very poor complementarity for the network topop up. Each combination of parameters gives rise todifferent stabilized networks. The size of the stable networkwill depend primarily on the threshold level ðTÞ and the sizeof the window (U and L). Low specificity (low T) leads topotential networks in which the nodes have potentiallyhigh connectivity; this high connectivity, however, leads tonodes becoming easily over-stimulated (exceeding theupper limit) which in turn leads to a decrease in theirconcentration. At very low T, a network never pops up asno cells can be sustained for long enough. The opposite canalso happen. When almost perfect complementarity isneeded for stimulation (very high T), the average degree ofthe network will be so low that nodes cannot be stimulatedbeyond the lower stimulation limit. So, for an idiotypicnetwork to pop up, an optimal individual averagestimulation value must be found in the algorithm.A similar phenomenon is observed in the 2D model asthe radius r is increased; in fact, the recognition radius of acell r in the 2D model can be seen as playing a similar roleto the threshold value T in the bit-string model in that bothparameters regulate the number of potential matches thatany cell can make in each model. In 2D, when r is low, theprobability of cell finding another cell lying within itsrecognition zone to provide stimulation is low, and anetwork is unable to pop-up due to the low average degree.At the other end of the spectrum, when r is large, every cellis stimulated by every other cell; all cells become over-stimulated and are suppressed, preventing the emergence ofa self-sustaining network. Therefore, as with the bit-stringmodel, there is a balance to be found between r, and alsothe concentration at which cells are added (see Eq. (2)).
2.3. A comment on the proposed model
It should be noted that the model proposed above is infact a continuation of a whole series of idiotypic networkmodels that have been proposed in the past by manyauthors, e.g. Stewart and Coutinho (2004), Calenbuhr et al.(1995), Detours et al. (1996), and many others such as DeBoer and Perelson. All of these models in fact implement anumber of common features (although they differ in theexact mechanisms by which these features are implemented):
1.
The idea of a shape space: either 2D or binary. 2. The notion that both antibodies and antigens grow ordecrease in concentration depending on how they bindto each other, i.e whether the binding is from antibodyto antibody, or antibody–antigen. Each antibody i
receives a field of affinity exerted by all others anddefined as the sum over the whole existing set of theirconcentration multiplied by a degree of match betweeneach element of the set and antibody i. The networkarises as the result of the connections existing betweenmatching antibodies.
3.
If the field received by a cell is too high, this causes adecrease in concentration of the received antibody orantigen. For the antibody, this decrease is a compromisebetween the stimulation that makes them proliferate (i.e.they are produced by the B lymphocytes) and theirmutual binding that causes them to die. For the antigen,the decrease is due to the effect of the binding only.
4.
If the field received is too low, this also causes a decreasein the concentration of the received antibody.5.
In between these two thresholds (too low and too high)the effect of the field for the receiving antibody is anincrease in concentration as the B-lymphocyte produc-tion exceeds the binding.The model presented in this paper is the simplestinstance of such a scenario. However, it has been shownby the authors quoted above that such a simplification doesnot modify the relevant phenomenology, and therefore weutilize this simplified model in order to investigate some ofthe deeper issues concerning the topology that can arise ina connected network.
3. Experimental results
We first perform a simple set of experiments in which thebit-string and 2D models are run for 10,000 iterations inthe absence of any antigens. Following this, a set of 50randomly generated antigens are presented to the networkand evolution continued for a further 2000 iterations.In order to be consistent with work reported previously
in Hart (2005), 2D experiments are performed on a grid ofsize 100� 100, resulting in 10,000 potential cells. Thevalues of the lower limit L and upper limit U are fixed atL ¼ 100 and U ¼ 10; 000. Antibody cells are added to thesimulation with concentration 10; antigen cells are addedwith concentration 1000. In the simulations with bit-strings, we consider strings of length 13, creating a space of8192 possible cells, a potential repertoire size of similar sizeto the 2D shape space. The lower limit L and upper limit U
take, respectively, values 5000 and 10,000. Unless other-wise stated, the scaling factor f is set to 100 in allexperiments.Initial experiments performed with both network models
give surprising results (shown in Figs. 1 and 2) which canbe summarized as follows:
�
The network obtained via the 2D model is always able totolerate a subset of antigens.
� The network obtained via the bit-string model isintolerant of all antigens for the majority of the thresholdrange (when T410 the network collapses as a result of alack of connections).
3.1. Exploration of parameter space
Experimentation shows that these results hold over awide range of parameters for each model. Fig. 1 presentsthe results of an investigation of the main parameters of the2D model, in particular the recognition radius r, the

ARTICLE IN PRESS
Antigen Concentration
repertoire size
antigens
antigens
antigens
repertoire size
repertoire size
repertoire size
antigens
Size
of
antib
ody
repe
rtoi
reSi
ze o
f an
tibod
y re
pert
oire
Size
of
antib
ody
repe
rtoi
re
% to
lera
ted
antig
en
Antibody concentration
% to
lera
ted
antig
en
% to
lera
ted
antig
en
Lower threshold LUpper threshold U
Recognition Radius
45
9000
0
8000
0
7000
0
6000
0
5000
0
4000
0
3000
0
2000
0
0
20
40
60
80
100
50 100 150 200 250 300 350 400 450 500
0
500
1000
1500
2000
1000
00
100
80
60
40
20
0
0
20
40
60
80
100
050
00
1000
0
1500
0
2000
0
2500
0
3000
0
3500
0
4000
00
500
1000
1500
2000
0
20
40
60
80
100
10 15 20 25 30 35 40 45 500200400600800100012001400160018002000
0
20
40
60
80
100
5 10 15 20 25 30 35 40
1000
00
Fig. 1. Figures show exploration of parameter space of 2D model with complementary affinity function. In all experiments shown, the scaling factor f
which influence the decrease in antigen concentration is set to 100. Graphs show the % of antigens tolerated by the network following presentation of a set
of 50 random antigens to a network evolved in the absence of antigen for 10,000 iterations. The tolerance is plotted as a function of: (top left) radius of
recognition region (top right) concentration of added antigens (middle left) value of the lower stimulation threshold L (below which concentration of
antibodies is reduced) (middle right) value of upper stimulation threshold U (above which the concentration of antibodies is reduced), (bottom centre)
concentration of added antibodies. In each diagram, all parameters other than the one being explored are fixed at r ¼ 15, L ¼ 10, U ¼ 10; 000, initialconcentration antigen ¼ 100, initial concentration antibody ¼ 10, scaling factor f ¼ 100.
E. Hart et al. / Journal of Theoretical Biology 249 (2007) 422–436426
concentration of added antigens, Ac, and the lower andupper limits L and U of the stimulation thresholds. Theultimate outcome of any simulation is determined by acomplex interplay between these parameters. In essence, inorder for a network to emerge, then a balance must befound which allows a number of antibodies to maintain alevel of stimulation which lies between the two thresholdlimits. Insufficient stimulation causes antibodies to beeliminated almost immediately; excess stimulation similarlycauses antibodies to be suppressed. In both cases, anetwork cannot be maintained and therefore any antigens
to which the system is exposed remain in the systemindefinitely.Fig. 1 shows, however, that there is a wide range of
parameters over which a stable network can emerge. Forexample, the network is stable over a wide range of valuesof r, springing into existence when r410. Behaviour as afunction of antigen concentration is as expected; at highdoses, even though a proportion of antigens are recognizedby the network, and correspondingly reduce in concentra-tion, they cannot be completely eliminated in the timeallowed during the experiment, hence 100% tolerance is

ARTICLE IN PRESS
1 2 3 4 5 6 7 8 9 10 11 12Threshold
0
20
40
60
80
100
tole
rate
d an
tigen
s %
1 2 3 4 5 6 7 8 9 10 11 12
Threshold
0
50
100
150
200
250
size
of
the
repe
rtoi
re
1 2 3 4 5 6 7 8 9 10 11 12Threshold
0
5
10
15
20
Ave
rage
Deg
ree,
<k>
1 2 3 4 5 6 7 8 9 10 11 12
Threshold
0
0.2
0.4
0.6
0.8
1
Clu
ster
Coe
ffic
ient
, C
Fig. 2. Bit-string model with complementary affinity function: graphs show % of tolerated antigens as the recognition threshold of cells varies (top left),
the size of the repertoire (top right), the average degree of the biggest connected component of the network (bottom left) and the average cluster coefficient
of the network (bottom right). The network is intolerant for almost all values of the threshold. When T410, the network cannot survive and the repertoire
is basically constituted by antigens. (initial concentration (Abs) ¼ 20; initial concentration (Ags) ¼ 90; number of iterations: 107; average over 20
simulations; Upper limit: 1000; lower limit: 500; a random set of antigens is introduced every 103 iterations after a transient period of 104 iterations.
E. Hart et al. / Journal of Theoretical Biology 249 (2007) 422–436 427
observed. The lower threshold limit L affects the stimula-tion level at which antibodies are suppressed. When it risesover 150, an abrupt change in network behaviour isobserved, and the repertoire is no longer maintained, againallowing any added antigen to be tolerated. Correspond-ingly, if the upper threshold U is reduced, a similartransition occurs, and no network emerges. The finaldiagram in Fig. 1 shows the response of the network as theconcentration at which new antibodies are added isincreased. Although this has little effect on the emergenceof a stable network and the corresponding behaviour ofthat network to presented antigens, it has a profoundinfluence on the size of the repertoire. In the remainder ofthis paper, for the 2D model, the following set ofparameters is used in the experiments described, unlessstated otherwise: (r ¼ 15, f ¼ 100, L ¼ 100, U ¼ 10; 000,new Agconc ¼ 100, new Abconc ¼ 10). These parameters arechosen as being representative of the range of parametersover which a stable network can emerge. However, as thediscussion above shows, the model is relatively robust tochanges in these values.
In contrast to this, experimentation with the bit-stringmodel shows very different results. For threshold Tp10,the network shows zero tolerance to antigens. At greaterthresholds, the network cannot survive, and the repertoireis constituted entirely by antigens (see Fig. 2, top left). Awide-ranging exploration of the parameter space of the bit-
string model was performed before coming to thisconclusion; experimental results are not given for the fullinvestigation as they show little of interest. The resultsshown in Fig. 2 are typical of those obtained with allcombinations of parameters. Therefore, we conclude thatthe bit-string model used in conjunction with a comple-mentary affinity function does not produce similar resultsto the 2D model used with a complementary affinityfunction. This suggests that different network dynamicsemerge due to the intrinsic features of the model, that is thenode definitions and binding rules used.
3.2. Further analysis of results
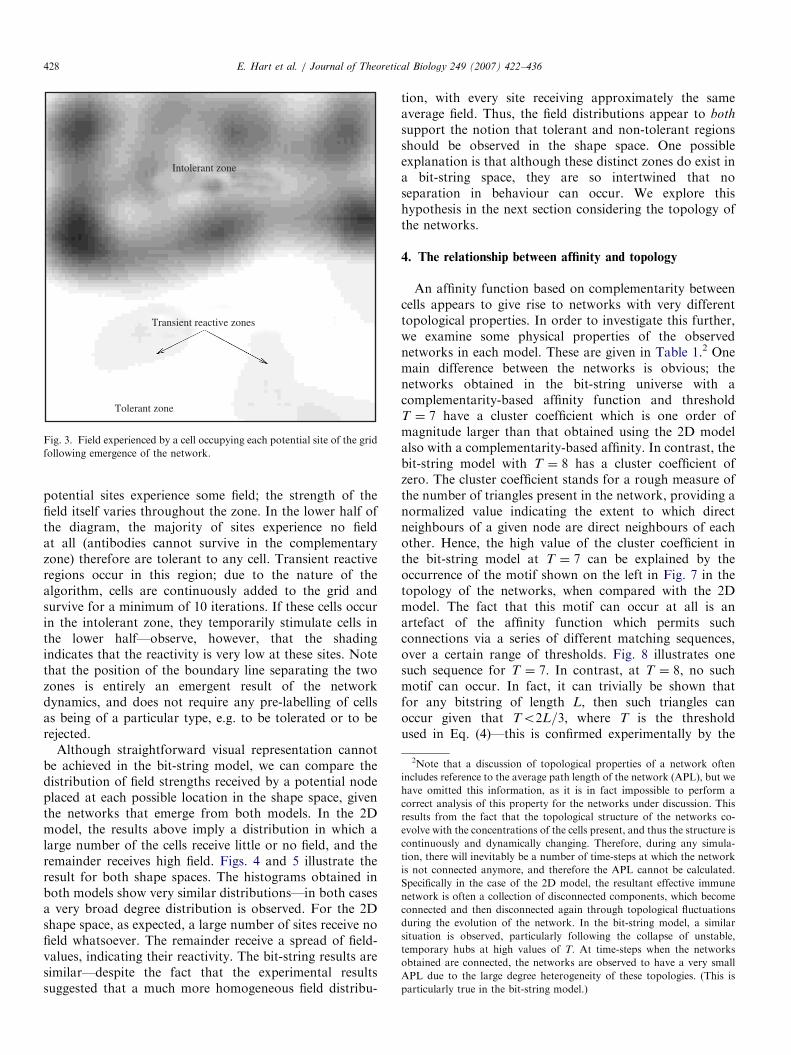
Following a cell’s birth, its ultimate outcome, i.e.whether it is tolerized or immunized, is determined by thelevel of stimulation or field strength it receives from cellscurrently sustained in the network. Therefore, an analysisof the field at all potential locations in the shape spaceought to indicate local tolerant and reactive zones. This isstraightforward to visualize in 2D; Fig. 3 shows thepotential field received by a hypothetical cell occupyingeach of the potential sites on the grid given the existingnetwork after 10,000 iterations. This field is calculatedaccording to Eq. (2). Darker shading indicates higher field,and vice versa. Two distinct zones are apparent. The tophalf of the diagram clearly shows a zone in which all
ARTICLE IN PRESS
Intolerant zone
Transient reactive zones
Tolerant zone
Fig. 3. Field experienced by a cell occupying each potential site of the grid
following emergence of the network.
2Note that a discussion of topological properties of a network often
includes reference to the average path length of the network (APL), but we
have omitted this information, as it is in fact impossible to perform a
correct analysis of this property for the networks under discussion. This
results from the fact that the topological structure of the networks co-
evolve with the concentrations of the cells present, and thus the structure is
continuously and dynamically changing. Therefore, during any simula-
tion, there will inevitably be a number of time-steps at which the network
is not connected anymore, and therefore the APL cannot be calculated.
Specifically in the case of the 2D model, the resultant effective immune
network is often a collection of disconnected components, which become
connected and then disconnected again through topological fluctuations
during the evolution of the network. In the bit-string model, a similar
situation is observed, particularly following the collapse of unstable,
temporary hubs at high values of T. At time-steps when the networks
obtained are connected, the networks are observed to have a very small
APL due to the large degree heterogeneity of these topologies. (This is
particularly true in the bit-string model.)
E. Hart et al. / Journal of Theoretical Biology 249 (2007) 422–436428
potential sites experience some field; the strength of thefield itself varies throughout the zone. In the lower half ofthe diagram, the majority of sites experience no fieldat all (antibodies cannot survive in the complementaryzone) therefore are tolerant to any cell. Transient reactiveregions occur in this region; due to the nature of thealgorithm, cells are continuously added to the grid andsurvive for a minimum of 10 iterations. If these cells occurin the intolerant zone, they temporarily stimulate cells inthe lower half—observe, however, that the shadingindicates that the reactivity is very low at these sites. Notethat the position of the boundary line separating the twozones is entirely an emergent result of the networkdynamics, and does not require any pre-labelling of cellsas being of a particular type, e.g. to be tolerated or to berejected.
Although straightforward visual representation cannotbe achieved in the bit-string model, we can compare thedistribution of field strengths received by a potential nodeplaced at each possible location in the shape space, giventhe networks that emerge from both models. In the 2Dmodel, the results above imply a distribution in which alarge number of the cells receive little or no field, and theremainder receives high field. Figs. 4 and 5 illustrate theresult for both shape spaces. The histograms obtained inboth models show very similar distributions—in both casesa very broad degree distribution is observed. For the 2Dshape space, as expected, a large number of sites receive nofield whatsoever. The remainder receive a spread of field-values, indicating their reactivity. The bit-string results aresimilar—despite the fact that the experimental resultssuggested that a much more homogeneous field distribu-
tion, with every site receiving approximately the sameaverage field. Thus, the field distributions appear to both
support the notion that tolerant and non-tolerant regionsshould be observed in the shape space. One possibleexplanation is that although these distinct zones do exist ina bit-string space, they are so intertwined that noseparation in behaviour can occur. We explore thishypothesis in the next section considering the topology ofthe networks.
4. The relationship between affinity and topology
An affinity function based on complementarity betweencells appears to give rise to networks with very differenttopological properties. In order to investigate this further,we examine some physical properties of the observednetworks in each model. These are given in Table 1.2 Onemain difference between the networks is obvious; thenetworks obtained in the bit-string universe with acomplementarity-based affinity function and thresholdT ¼ 7 have a cluster coefficient which is one order ofmagnitude larger than that obtained using the 2D modelalso with a complementarity-based affinity. In contrast, thebit-string model with T ¼ 8 has a cluster coefficient ofzero. The cluster coefficient stands for a rough measure ofthe number of triangles present in the network, providing anormalized value indicating the extent to which directneighbours of a given node are direct neighbours of eachother. Hence, the high value of the cluster coefficient inthe bit-string model at T ¼ 7 can be explained by theoccurrence of the motif shown on the left in Fig. 7 in thetopology of the networks, when compared with the 2Dmodel. The fact that this motif can occur at all is anartefact of the affinity function which permits suchconnections via a series of different matching sequences,over a certain range of thresholds. Fig. 8 illustrates onesuch sequence for T ¼ 7. In contrast, at T ¼ 8, no suchmotif can occur. In fact, it can trivially be shown thatfor any bitstring of length L, then such triangles canoccur given that To2L=3, where T is the thresholdused in Eq. (4)—this is confirmed experimentally by the

ARTICLE IN PRESS
field experienced by cell
freq
uenc
y
S<U L<S<U S>U
freq
uenc
y
Stimulation received by an antibody at site
freq
uenc
y
Stimulation received by an antigen at site
S<L S>L
0
200
400
600
800
1000
1200
1400
0 50 100 150 200 250
0
1000
2000
3000
4000
5000
6000
0
1000
2000
3000
4000
5000
6000
Fig. 4. The diagrams examine the field that would be experienced by a potential cell (antibody or antigen) placed at each of the possible 10,000 sites on the
100� 100 grid given an existing evolved network. In these diagrams, S, stimulation, L, lower limit (100) and U , upper limit (10,000). The upper left
diagram depicts the number of antibodies, which if occupying these sites, would have a total stimulation which (a) lies in the window LoSoU and
therefore increase in concentration, and (b) falls outside this window and would decrease in concentration (the field is calculated according to Eq. (2)). The
upper right diagram depicts the situation should each potential site be occupied by an antigen, and shows the number of antigens which would decrease in
concentration ðLoSÞ, or remain unaltered (field calculated according to Eq. (3)). The lower diagram shows the full distribution of field strengths of cells
placed at each potential site (in order to facilitate plotting, the concentration term in Eq. (2) is assumed to be 1 for all cells).
Fig. 5. Field experienced by every potential bit-string in the bit-string space, following emergence of the network, for four different affinity thresholds.
E. Hart et al. / Journal of Theoretical Biology 249 (2007) 422–436 429
relationship between threshold and cluster coefficientshown in Fig. 2, bottom right, which shows zero clustercoefficient for TX8.
The presence of this motif would explain the observedresults; any antigen can always find itself with two kinds ofresponding antibodies closely located in the bit-string

ARTICLE IN PRESS
10 100
k
0.01
0.1d
(k)
1 10 100
k
0.01
0.1
T = 7 T = 8
Fig. 6. Final degree distribution dðkÞ for the bit-string model with T ¼ 7 and 8. dðkÞ ¼ Nk=N where Nk gives the number of nodes with k connections
(degree) and N the total number of nodes. The figure illustrates an important point: at both thresholds, the observed distributions are similar, exhibiting
high levels of heterogeneity. However, the internal structure of the networks at T ¼ 8 and T ¼ 8 is completely different, with the former exhibiting high
levels of clustering, while the latter has zero cluster coefficient. The existence of this kind of random network with hubs is very unstable because hubs
cannot remain in network for a long time. After appearing they will get over-stimulated and will collapse immediately after.
Table 1
Network properties of shape spaces with varying affinity measures (2D
results obtained with r ¼ 15 and with T ¼ 7, 8 for the bit-string model)
2D complementary 2D similar Bit-string model
T ¼ 7 T ¼ 8
Number of nodes 167.8 102.42 209.7 153.2
Maximum degree 29.4 18.17 158.8 113.5
Average degree 4.7 8.52 10.9 5.2
Cluster Coeff. 0.022 0.792 0.13 0.0
This corresponds to a space of size 10,000 in 2D and of 8192 in the bit-
string model. The values of r ¼ 15 and T ¼ 7 are chosen such that the
number or potential matching pairs in each model is as close as possible.
Results with T ¼ 8 are also included to illustrate the difference in the
network structure when the threshold level prevents the formation of
clusters. Each value results from an averaging over 20 simulations. The
degree of a node is defined as the number of connections existing between
a node and other nodes. The cluster coefficient of the network is calculated
by averaging over all vertices, the fraction of vertices adjacent to a given
vertex that are adjacent to each other. Therefore, its possible values range
from 0 to 1, with 1 indicating that all the neighbouring nodes are
connected to one another.
Fig. 7. (a) Motif obtained using similarity-based affinity metric. (b) Motif
obtained using complementary-based affinity metric.
HD = 8
A
B C
1001 1001 1001 1
0110 1001 0110 1 1001 0110 0110 0
9
HD = 9
HD = 9
Fig. 8. The figure shows an actual example of a triangular motif that
could be obtained in a network where nodes are represented by bit-strings
of length 13, with threshold T ¼ 7. A non-zero affinity exists between all
pairs of cells with HD47. In this example, A connects with B, as the
hamming distance HD ¼ 9. Similarly, a connection exists with A and C
(HD ¼ 8), and also with B and C (HD ¼ 9).
E. Hart et al. / Journal of Theoretical Biology 249 (2007) 422–436430
space, one in high and the other in low concentration. Atthe end, the response of the network to any antigenintrusion just depends on the initial concentration of thisantigen and therefore no longer on the position of this
antigen, as the space has been uniformly filled up with alltypes of antibodies.In contrast, in the network obtained in 2D, there is a
high incidence of the motif shown in the right hand side ofFig. 7, creating the conditions for a zero cluster coeffi-cient—if a stimulates b and b stimulates c, then c cannotstimulate a. This automatically creates a bi-partidestructure which does not allow any creation of loopsamong sets of three nodes. It is clear that a networkcomposed predominantly of motifs of this type willnecessarily have cluster coefficient close to 0. In fact, thevalue obtained in the 2D space used is slightly larger thanzero (see Table 1) as clustering can occur between cellslocated very close to the centre of the space, whereðX � x;Y � yÞ is approximately equal to ðx; yÞ. Thenetwork topology therefore prevents clusters, but facilitatesthe emergence of chains of cells which are able to separate
ARTICLE IN PRESSE. Hart et al. / Journal of Theoretical Biology 249 (2007) 422–436 431
the space into distinct regions. Therefore, the location ofany antigen in shape space will determine whether it istolerated or eliminated. Thus, we hypothesize that anaffinity function which tolerates the existence of atriangular motif as observed in the bit-string universe willresult in a topology in which it is impossible to separatedistinct zones of high reactivity from those of lowreactivity, therefore resulting in a network which reactsidentically to any presented antigen. On the other hand, anaffinity function which supports the emergence of the ‘‘V’’shaped motif obtained with the 2D model will result in atopology which clearly separates reactive zones from non-reactive zones. In the following sections, we present somesupporting evidence for this argument.
The cluster coefficient is just one indicator of thetopology of a network, and appears to provide somejustification for the existence of intertwined tolerant andreactive zones as outlined above. Clearly, however, thereare other factors which could also result in mixed zones inwhich it is impossible to separate tolerant from reactivebehaviours. This is apparent from Fig. 2 which shows thatthe bit-string network is still unable to tolerate any antigenswhen the threshold X8, despite the fact that the clustercoefficients of such networks are zero. However, othertypes of motifs could also occur in these networks whichpotentially may result in the same end result, i.e. that thereis intermingling of zones of high and low field. Forexample, it is likely that a number of closed loop motifs, ofthe form A2B2C2D2E2A exist which result in thesame effect. The main message of this paper remains thesame, however; the topology of network impacts itsbehaviour. The clustering coefficient is one of a numberof ways in which topology can be defined, and appears toexplain the 2D results and provide partial explanation inthe bit-string case.
A further insight into network topology can be gleanedby examining the average degree of the obtained networks.Fig. 6 compares the degree distribution of two bit-stringnetworks at T ¼ 7 and 8. Both show a high heterogeneityin terms of degree, and similar distributions, despite thefact the network with T ¼ 8 has a completely differentinternal structure. The existence of nodes with such highdegree shows that hubs can appear in the immune-network
(f=100)% to
lera
ted
antig
ens
recognition radius
015 20 25 30 35 40 45 505
100
80
60
40
20
10
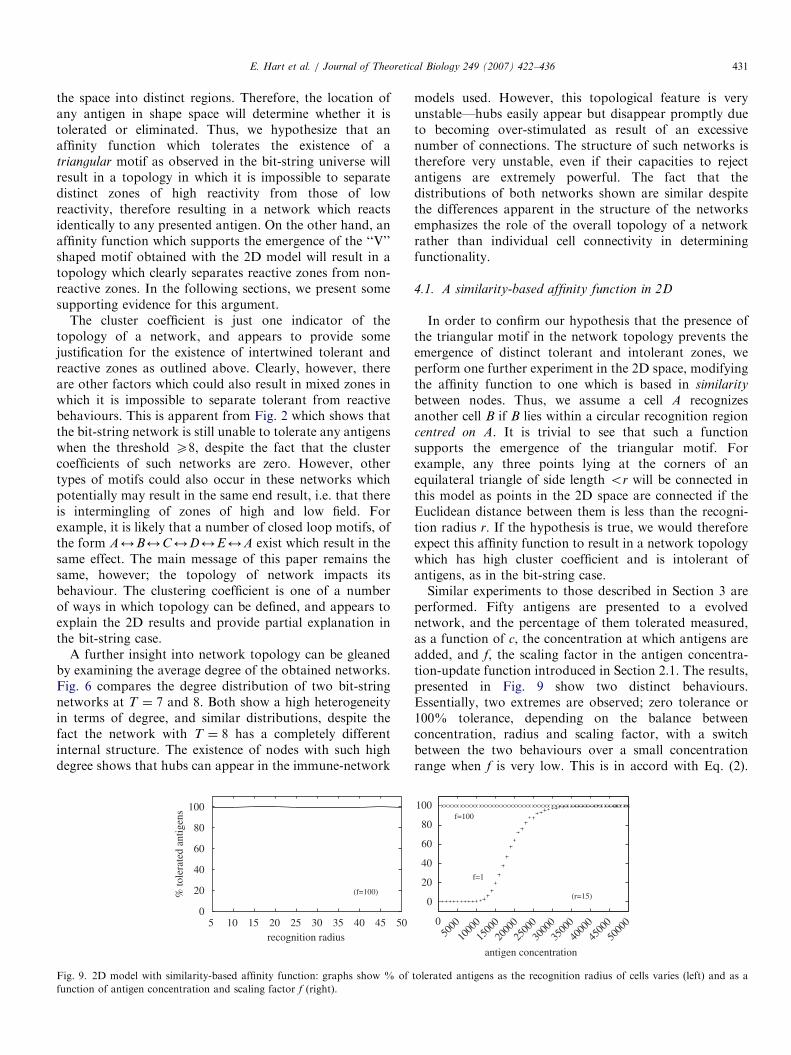
Fig. 9. 2D model with similarity-based affinity function: graphs show % of
function of antigen concentration and scaling factor f (right).
models used. However, this topological feature is veryunstable—hubs easily appear but disappear promptly dueto becoming over-stimulated as result of an excessivenumber of connections. The structure of such networks istherefore very unstable, even if their capacities to rejectantigens are extremely powerful. The fact that thedistributions of both networks shown are similar despitethe differences apparent in the structure of the networksemphasizes the role of the overall topology of a networkrather than individual cell connectivity in determiningfunctionality.
4.1. A similarity-based affinity function in 2D
In order to confirm our hypothesis that the presence ofthe triangular motif in the network topology prevents theemergence of distinct tolerant and intolerant zones, weperform one further experiment in the 2D space, modifyingthe affinity function to one which is based in similarity
between nodes. Thus, we assume a cell A recognizesanother cell B if B lies within a circular recognition regioncentred on A. It is trivial to see that such a functionsupports the emergence of the triangular motif. Forexample, any three points lying at the corners of anequilateral triangle of side length or will be connected inthis model as points in the 2D space are connected if theEuclidean distance between them is less than the recogni-tion radius r. If the hypothesis is true, we would thereforeexpect this affinity function to result in a network topologywhich has high cluster coefficient and is intolerant ofantigens, as in the bit-string case.Similar experiments to those described in Section 3 are
performed. Fifty antigens are presented to a evolvednetwork, and the percentage of them tolerated measured,as a function of c, the concentration at which antigens areadded, and f, the scaling factor in the antigen concentra-tion-update function introduced in Section 2.1. The results,presented in Fig. 9 show two distinct behaviours.Essentially, two extremes are observed; zero tolerance or100% tolerance, depending on the balance betweenconcentration, radius and scaling factor, with a switchbetween the two behaviours over a small concentrationrange when f is very low. This is in accord with Eq. (2).
f=1
(r=15)
f=100
antigen concentration
0
20
40
60
80
100
050
00
1000
0
1500
0
2000
0
2500
0
3000
0
3500
0
4000
0
4500
0
5000
0
tolerated antigens as the recognition radius of cells varies (left) and as a
ARTICLE IN PRESS
S>US<L L<S<U
freq
uenc
y
0100020003000400050006000700080009000
10000
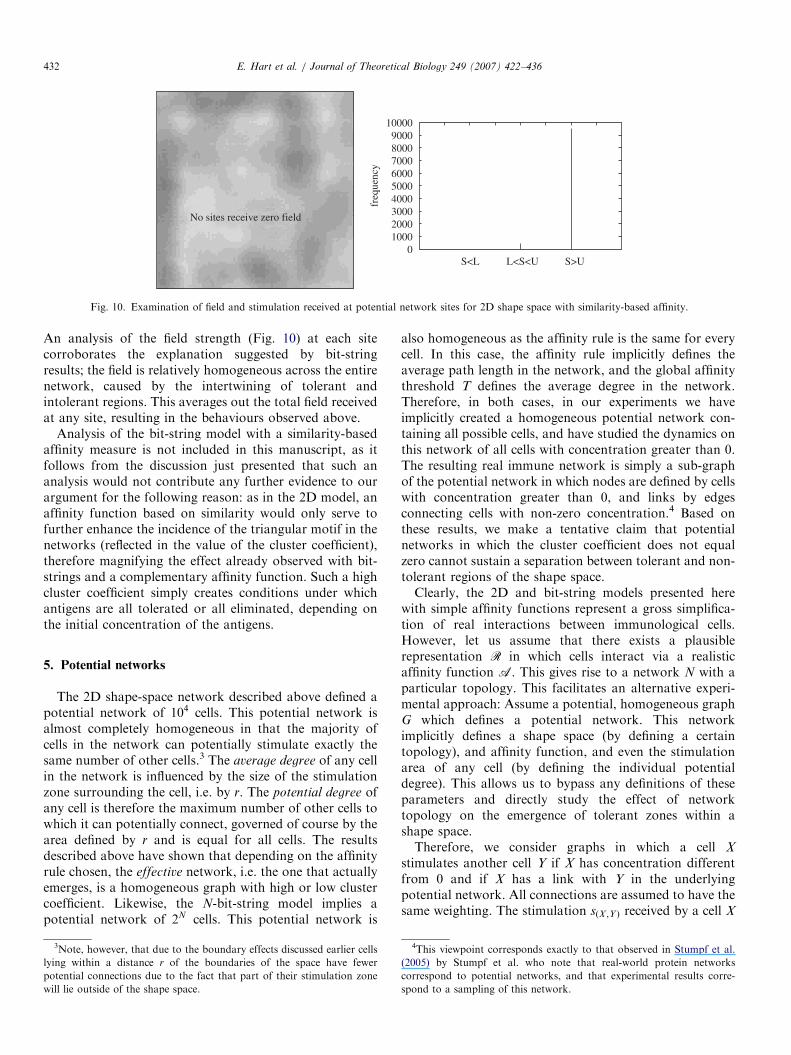
No sites receive zero field
Fig. 10. Examination of field and stimulation received at potential network sites for 2D shape space with similarity-based affinity.
E. Hart et al. / Journal of Theoretical Biology 249 (2007) 422–436432
An analysis of the field strength (Fig. 10) at each sitecorroborates the explanation suggested by bit-stringresults; the field is relatively homogeneous across the entirenetwork, caused by the intertwining of tolerant andintolerant regions. This averages out the total field receivedat any site, resulting in the behaviours observed above.
Analysis of the bit-string model with a similarity-basedaffinity measure is not included in this manuscript, as itfollows from the discussion just presented that such ananalysis would not contribute any further evidence to ourargument for the following reason: as in the 2D model, anaffinity function based on similarity would only serve tofurther enhance the incidence of the triangular motif in thenetworks (reflected in the value of the cluster coefficient),therefore magnifying the effect already observed with bit-strings and a complementary affinity function. Such a highcluster coefficient simply creates conditions under whichantigens are all tolerated or all eliminated, depending onthe initial concentration of the antigens.
5. Potential networks
The 2D shape-space network described above defined apotential network of 104 cells. This potential network isalmost completely homogeneous in that the majority ofcells in the network can potentially stimulate exactly thesame number of other cells.3 The average degree of any cellin the network is influenced by the size of the stimulationzone surrounding the cell, i.e. by r. The potential degree ofany cell is therefore the maximum number of other cells towhich it can potentially connect, governed of course by thearea defined by r and is equal for all cells. The resultsdescribed above have shown that depending on the affinityrule chosen, the effective network, i.e. the one that actuallyemerges, is a homogeneous graph with high or low clustercoefficient. Likewise, the N-bit-string model implies apotential network of 2N cells. This potential network is
3Note, however, that due to the boundary effects discussed earlier cells
lying within a distance r of the boundaries of the space have fewer
potential connections due to the fact that part of their stimulation zone
will lie outside of the shape space.
also homogeneous as the affinity rule is the same for everycell. In this case, the affinity rule implicitly defines theaverage path length in the network, and the global affinitythreshold T defines the average degree in the network.Therefore, in both cases, in our experiments we haveimplicitly created a homogeneous potential network con-taining all possible cells, and have studied the dynamics onthis network of all cells with concentration greater than 0.The resulting real immune network is simply a sub-graphof the potential network in which nodes are defined by cellswith concentration greater than 0, and links by edgesconnecting cells with non-zero concentration.4 Based onthese results, we make a tentative claim that potentialnetworks in which the cluster coefficient does not equalzero cannot sustain a separation between tolerant and non-tolerant regions of the shape space.Clearly, the 2D and bit-string models presented here
with simple affinity functions represent a gross simplifica-tion of real interactions between immunological cells.However, let us assume that there exists a plausiblerepresentation R in which cells interact via a realisticaffinity function A. This gives rise to a network N with aparticular topology. This facilitates an alternative experi-mental approach: Assume a potential, homogeneous graphG which defines a potential network. This networkimplicitly defines a shape space (by defining a certaintopology), and affinity function, and even the stimulationarea of any cell (by defining the individual potentialdegree). This allows us to bypass any definitions of theseparameters and directly study the effect of networktopology on the emergence of tolerant zones within ashape space.Therefore, we consider graphs in which a cell X
stimulates another cell Y if X has concentration differentfrom 0 and if X has a link with Y in the underlyingpotential network. All connections are assumed to have thesame weighting. The stimulation sðX ;Y Þ received by a cell X
4This viewpoint corresponds exactly to that observed in Stumpf et al.
(2005) by Stumpf et al. who note that real-world protein networks
correspond to potential networks, and that experimental results corre-
spond to a sampling of this network.

ARTICLE IN PRESSE. Hart et al. / Journal of Theoretical Biology 249 (2007) 422–436 433
from Y is zero if X does not have a link with Y in thepotential network, and is equal to a � CY otherwise, wherea is simply a pre-defined constant and CY is Y’sconcentration. Depending on the total amount of stimula-tion received by X, its concentration will either increase ordecrease, just like in the previous models. If the totalstimulation is between a lower and a higher stimulationthresholds its concentration will increase by one, anddecrease also by one unit otherwise. The ability of theevolving network to tolerate antigens is measured byexposing the network to a set of 50 randomly generatedantigens every 1000 iterations. The antigens are permittedto remain in the network for a period of 1000 iterations. Atthe end of this period, the number which have non-zeroconcentration is recorded, and these antigens are consid-ered as tolerated. These remaining antigens are thenremoved from the network before a new set of 50 antigensis added again.
Therefore, for a potential network of 104 nodes, at eachtime-step:
�
Introduce a new antibody cell by randomly choosing anempty node (Ci ¼ 0) from the potential network andassign it a concentration Ci40. �Fig. 11. This scheme illustrates a bi-partide equivalent of a regular graph
corresponding to the complementarity affinity rule. In this example the
Calculate the total stimulation of each cell with non-zeroconcentration, summing the stimulation received fromeach first neighbour in the potential network.
average degree is 4 (see main text). The ring made of circles on the top is
� the complement of the ring formed of square on the bottom.Update the concentration of each cell as before, usingthe usual stimulation window.
� Every 1000 generations, record the number of toleratedantigens. Following this, remove them from the networkand then add a new set of 50 random antigens.
5.1. Results in homogeneous potential networks
In this section, we study the topological effects on theemergence of tolerance assuming a homogeneous graph inwhich all nodes share the same potential degree. Weconsider potential networks of the same size as before—104
nodes. To tackle the main differences between the studiedaffinity functions in terms of a potential network approach,we study two kinds of regular graphs: a regular ringof size N and a bi-partide regular network made of tworings of size N=2 (see Fig. 11) with an average degree hki.The former case corresponds to an affinity functionbased on the similarity between cells. This creates apotential network where triangles or loops are oftenpresent. In the latter case, we create a regular networkthat can pictured as two parallel rings of nodes—ringA and B. Nodes belonging to the first ring can only beconnected with nodes of ring B and vice versa. Forinstance, for an average degree of 4, a node i belonging tothe ring A will be connected to the node at the positioni � 1, i � 2, i þ 1 and i þ 2 of the ring B. In this way, weproduce the bi-partide equivalent of a regular network,with exactly the same spatial constraints and averagedegree, but implicitly defining two groups of interacting
cells in a bi-partide fashion. The cluster coefficient will betrivially equal to zero in this case, where in the normalregular network will be given by ð3k � 6Þ=ð4k � 4Þ, with k
standing for the average degree of the network (Dorogot-sev and Mendes, 2003). This bi-partide regular graphcorresponds to the complementarity affinity function,which has been shown to give rise to two perfectly distinctareas in terms of tolerating antigens, contrary to thesimilarity rule (see previous sections). The results forthis simplified model are shown in Fig. 12. They canbe compared directly to the previous results in 2D inwhich we plot radius vs % tolerated antigens, as thepotential average degree is topologically equivalentto the radius of stimulation. It shows that the existenceof a bi-partide topology defining the set of all possible/potential interactions promotes the emergence of highlevels of tolerance for most of the values of hki. Thisresult corroborates with the previous results obtained withthe 2D shape-space model and validates the simplificationand abstraction introduced here. This emphasizes our mainpoint, i.e. that the existence of a non-null value for thecluster coefficient emerges acts as an important deterrentfor the existence of tolerance zones in the shape space, atleast when homogeneous potential networks are consid-ered. Moreover, Fig. 12 shows three regions (regarding hki)limited by abrupt transitions. The first one occurs when the
ARTICLE IN PRESS
200 400 600 800
0
5
10
15
20
25
30
% to
lera
ted
antig
ens
regular PN
bipartide regular PN
200 400 600 800
0
1000
2000
3000
4000
5000
size
of
the
repe
rtoi
re
200 400 600 800
potential average degree
0
50
100
150
200
effe
ctiv
e av
erag
e de
gree
unstable immune network
self-sustained system of ABs
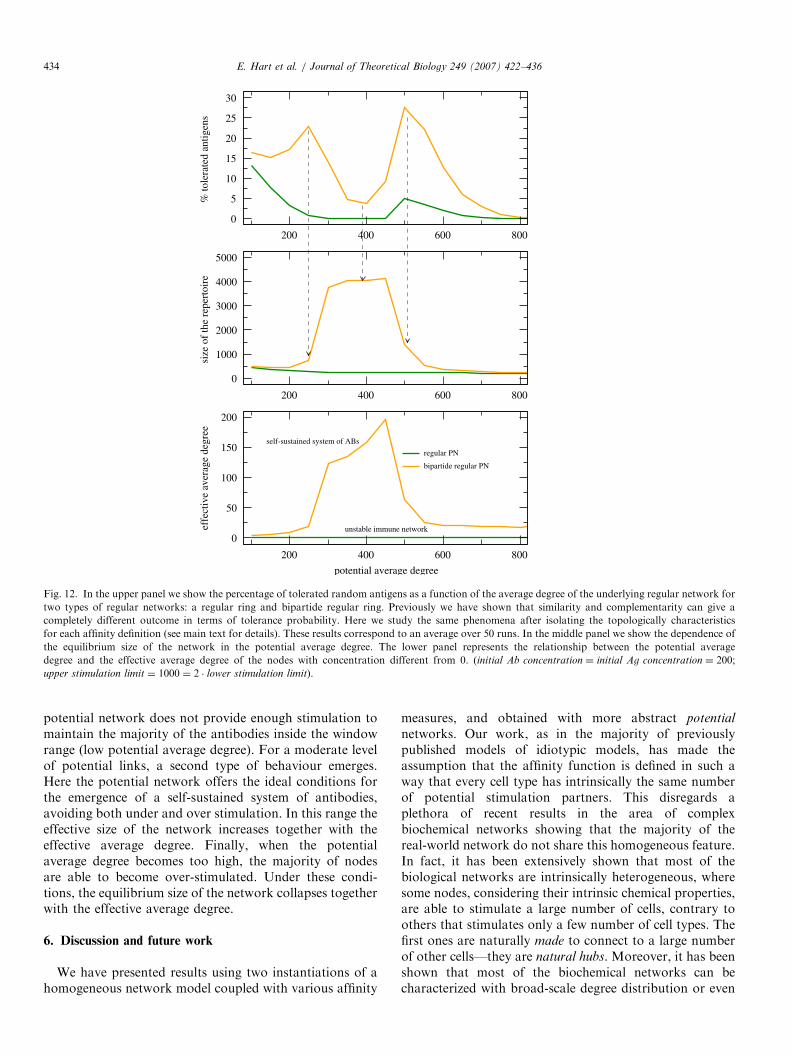
Fig. 12. In the upper panel we show the percentage of tolerated random antigens as a function of the average degree of the underlying regular network for
two types of regular networks: a regular ring and bipartide regular ring. Previously we have shown that similarity and complementarity can give a
completely different outcome in terms of tolerance probability. Here we study the same phenomena after isolating the topologically characteristics
for each affinity definition (see main text for details). These results correspond to an average over 50 runs. In the middle panel we show the dependence of
the equilibrium size of the network in the potential average degree. The lower panel represents the relationship between the potential average
degree and the effective average degree of the nodes with concentration different from 0. (initial Ab concentration ¼ initial Ag concentration ¼ 200;
upper stimulation limit ¼ 1000 ¼ 2 � lower stimulation limit).
E. Hart et al. / Journal of Theoretical Biology 249 (2007) 422–436434
potential network does not provide enough stimulation tomaintain the majority of the antibodies inside the windowrange (low potential average degree). For a moderate levelof potential links, a second type of behaviour emerges.Here the potential network offers the ideal conditions forthe emergence of a self-sustained system of antibodies,avoiding both under and over stimulation. In this range theeffective size of the network increases together with theeffective average degree. Finally, when the potentialaverage degree becomes too high, the majority of nodesare able to become over-stimulated. Under these condi-tions, the equilibrium size of the network collapses togetherwith the effective average degree.
6. Discussion and future work
We have presented results using two instantiations of ahomogeneous network model coupled with various affinity
measures, and obtained with more abstract potential
networks. Our work, as in the majority of previouslypublished models of idiotypic models, has made theassumption that the affinity function is defined in such away that every cell type has intrinsically the same numberof potential stimulation partners. This disregards aplethora of recent results in the area of complexbiochemical networks showing that the majority of thereal-world network do not share this homogeneous feature.In fact, it has been extensively shown that most of thebiological networks are intrinsically heterogeneous, wheresome nodes, considering their intrinsic chemical properties,are able to stimulate a large number of cells, contrary toothers that stimulates only a few number of cell types. Thefirst ones are naturally made to connect to a large numberof other cells—they are natural hubs. Moreover, it has beenshown that most of the biochemical networks can becharacterized with broad-scale degree distribution or even

ARTICLE IN PRESSE. Hart et al. / Journal of Theoretical Biology 249 (2007) 422–436 435
by a scale-free degree distribution, recently popularizedby their remarkable robustness properties. Therefore,although our results provide a novel connection betweenthe topological characteristics of a network (resulting fromthe affinity measure) and its ability to tolerate or immunizeantigens, a natural extension to this work would thereforebe to consider the emergence of effective networks onheterogeneous potential graphs, and furthermore, potentialgraphs exhibiting scale-free (or nearly scale-free) degreedistributions. Heterogeneity in a network may offer thepotential for certain types of antigen (depending on theirdegree and position in the global interaction network) tobecome topologically protected against antibodies, whichare not able to destroy them, therefore increasing theglobal level of tolerance. Moreover, heterogeneity effectsalso play an important role in determining the equilibriumsize of the repertoire, which in turn influences the capacityof an idiotypic immune network to tolerate antigens.Therefore, this avenue of research is clearly ripe for furtherexploration.
In addition, we have alluded to the existence of theaffinity A which has biologically plausibility and at thesame time results in a network with the topologicalproperties required to create tolerant and immunizingzones in a network. Therefore, in conjunction withcontinuing studies of abstract potential networks, it mayalso be fruitful to continue with the search for an affinitymeasure which gives rise to the identified motifs. The vastamount of biological data now available pertaining toprotein–protein interaction networks no doubt holds cluesto such measures, though clearly it remains a non-trivialtask to make use of this data in this way.
7. Conclusion
We have shown the role played by the affinity functionand the corresponding potential network (the networkdefined by all possible cells and all possible interactions) indefining whether or not it is possible for tolerant andintolerant zones to co-exist in a idiotypic immune net-works. We showed that affinity functions assumingconnections between complementary regions of the shapespace promotes the emergence of tolerant areas of theshape space, contrary to configurations based on stimula-tion of cells with similar properties. We also identified thetopological features inherent in both definitions by definingan abstract model to describe an generalized way ofdefining affinity among cells jumping over a explicitdefinition of an affinity equation. Under this approach, ithas been shown that a null cluster coefficient and thebipartide topology resulting from the manner in whichpotential networks are organized in the complementarityscenario creates the possibility of two distinct zones beingable to co-exist.
Ever since the idea of networks in immunology(essentially with idiotypic networks) was first postulated,the topology of these networks has always raised a great
deal of interest. However, the majority of previoussimulations have never addressed the nature of the bindingin such detail, particularly in terms of its impact on thefinal outcome of a simulation, i.e. the structure of theresulting network. We have shown for the first time thatthe topology of a potential network—defined by the choiceof affinity function—influences the effective network thatactually emerges, and that the effective network in turninfluences one of the network’s essential capabilities: toseparate zones of tolerance from immunization zones. Inaddition, the results offer further support to the notion thatintrinsic features of biological nodes create non-trivialshape spaces which require careful analysis, in conjunctionwith the sampling dynamics responsible for the emergenceof the effective network. While previous authors have oftenarbitrarily selected affinity functions, this paper intends toshow that this choice is far from neutral. Although we haveselected to define binding functions at the extrema of thepotential spectrum (i.e. binding occurs if antibodies havesymmetrical or equal profile) in order to illustrate ourpoint, many more intermediary functions could have beenstudied without changing the essential message of thispaper. There is now a wealth of literature concerningprotein networks and their topology. This paper lendsfurther weight to the growing evidence that the topology ofa biological network plays a key role in understanding itsbehaviour, by presenting experimental evidence showingthat this phenomena is indeed true in the case of idiotypicnetworks.
Acknowledgements
FCS acknowledges the support of COMP2SYS, a MarieCurie Early Stage Training Site, funded by the EC throughthe HRM activity.
References
Barabasi, L., Albert, A., 1999. Emergence of scaling in random networks.
Science 286, 509–512.
Bersini, H., 2002. Self-assertion vs self-recognition: a tribute to Francisco
Varela. In: Proceedings of ICARIS 2002, pp. 107–112.
Bollobas, B., 2001. Random graphs, second ed. Cambridge Studies in
Advanced Mathematics, Cambridge University Press, Cambridge.
Calenbuhr, V., Bersini, H., Stewart, J., Varela, F., 1995. Natural tolerance
in a simple immune network. J. Theor. Biol. 177, 199–213.
Carneiro, J., Coutinho, A., Stewart, J., 1996. A model of the immune
network with b-t cell cooperation II—The simulation of ontogenesis.
J. Theor. Biol. 182, 531–547.
De Boer, R., Perelson, A., 1991. Size and connectivity as emergent
properties of a developing immune network. J. Theor. Biol. 149,
381–424.
Detours, V., Sulzer, B., Perelson, A., 1996. Size and connectivity of the
immune system are independent of the discreteness of the affinity
distribution. J. Theor. Biol. 183, 409–416.
Dilger, W., Strangfield, S., 2006. Properties of the bersini experiment
on self-assertion. In: Cattolico, M., (Ed.), Proceedings of the Genetic
and Evolutionary Computation Conference, GECCO 2006. ACM,
pp. 95–102.

ARTICLE IN PRESSE. Hart et al. / Journal of Theoretical Biology 249 (2007) 422–436436
Dorogotsev, S., Mendes, J., 2003. Evolution of Networks: From
Biological Nets to the Internet and WWW. Oxford University Press,
Oxford.
Hart, E., 2005. Not all balls are round: an investigation of alternative
recognition-region shapes. In: Artificial Immune Systems, Proceedings
of ICARIS 2005, pp. 29–42.
Hart, E., Ross, P., 2005a. Studies on the implications of shape-space
models for idiotypic networks. In: Artificial Immune Systems,
Proceedings of ICARIS 2004, pp. 413–426
Hart, E., Ross, P., 2005b. The impact of the shape of antibody recognition
regions on the emergence of idiotypic networks. Int. J. Unconventional
Comput 1 (3), 281–313.
Hart, E., Bersini, H., Santos, F., 2006. Tolerance vs intolerance: how
affinity defines topology in an idiotypic network. In: Artificial Immune
Systems, Proceedings of ICARIS 2006, pp. 109–121.
Jerne, N., 1985. The generative grammar of the immune system.
Science 4 (4).
Perelson, A., 1989. Immune network theory. Immunol. Rev. 10, 5–36.
Sole, R., Pastor-Satorras, R., Smith, E., Kepler, T., 2002. A model of
large-scale proteome evolution. Adv. Complex Syst. 5, 43–54.
Stewart, J., Coutinho, A., 2004. The affirmation of self: a new perspective
on the immune system. Artif. Life 10, 261–276.
Stumpf, M., Wiuf, C., May, R., 2005. Subnets of scale-free networks are
not scale-free: sampling properties of networks. Proc. Natl Acad. Sci.
USA 102 (12), 4221–4224.
Varela, F., Coutinho, A., 1991. Second generation immune network.
Immunol. Today 12 (5), 159–166.
Varela, F., Coutinho, A., Dupire, B., Vaz, N., 1988. Cognitive networks:
immune, neural and otherwise. Theor. Immunol. Ser. Sci. Complexity
2, 359–375.
Related Documents