Housing: What’s Next New College of Florida April 18, 2012 David Crowe Chief Economist

Housing: What's Next?
Mar 06, 2016
David Crowe's Presentation at GIC and New College "Housing: What's Next?" Conference
Welcome message from author
This document is posted to help you gain knowledge. Please leave a comment to let me know what you think about it! Share it to your friends and learn new things together.
Transcript

Housing: What’s Next
New College of Florida
April 18, 2012
David Crowe
Chief Economist

Builder Sentiment Up since September 2011 NAHB/Wells Fargo Housing Market Index
25
0
10
20
30 Index

What Else?

• GDP growth improving:
• 11H1=0.8%, 11H2=2.3%
• Employment gains improving:
• 11Q2=97K, 11Q4=137K, Feb=227K
• Unemployment dropped:
• Sept=9.0%, Mar=8.2%
• U-6 Sept=16.2%, Mar=14.5%
• New unemployment claims falling:
• Sept 4wk avg=418K, Recent 4wk avg=368.5K
• Consumer confidence recovering:
• Sept=46.4, Mar=70.2
• Small business optimism increased:
• Sept=88.9, Mar=92.5
Improving Signs - Macro

• Mortgage distress remains high but is falling and is concentrated:
• Seriously Delinquent: 09Q4=9.7%, 11Q4=7.7%
• 5 states have 53% of foreclosures, 12 states have 72%
• NAHB/Wells Fargo Housing Market Index up 11 points in seven months:
• Sept=14; Apr=25
• Housing starts 3-month moving average up 9 consecutive months:
• Apr=553K, Jan=706K, Feb=698K
• Single-family permits 3-month moving average up 10 consecutive months:
• Apr=390K, Feb=472K
• New and existing single-family home sales up from Sept
• New> Sept=302K, Feb=313K, Existing> Sept=3,800K, Feb=4,060K
• Improving Markets Index up 7 consecutive months:
• Sept=12, Apr=101
Improving Signs - Housing

0.0%
0.5%
1.0%
1.5%
2.0%
2.5%
103
104
105
106
107
108
109
110
111
112
113
114
20
02
20
03
20
04
20
05
20
06
20
07
20
08
20
09
20
10
20
11
% Chg HHLDS # HHLDS Linear (# HHLDS) Linear (# HHLDS)
Number of Households
Percentage Change
(million households)
1 to 2 million gap
Household Shortfall Demographic Trends Are Positive

Housing Fundamentals Remain Good Mortgage Rates
5.2
0
2
4
6
8
10
12
14
16
18
20
78 80 82 84 86 88 90 92 94 96 98 00 02 04 06 08 10 12
Percent
Fixed-Rate
Adjustable-Rate
3.2

2.0
2.5
3.0
3.5
4.0
4.5
5.0
5.5
6.0
90 91 92 93 94 95 96 97 98 99 00 01 02 03 04 05 06 07 08 09 10 11
U.S.
House Prices Below Long-term Averages House Price-to-Income Ratio
Long-term 3.2
Peak 4.7
Current 3.2
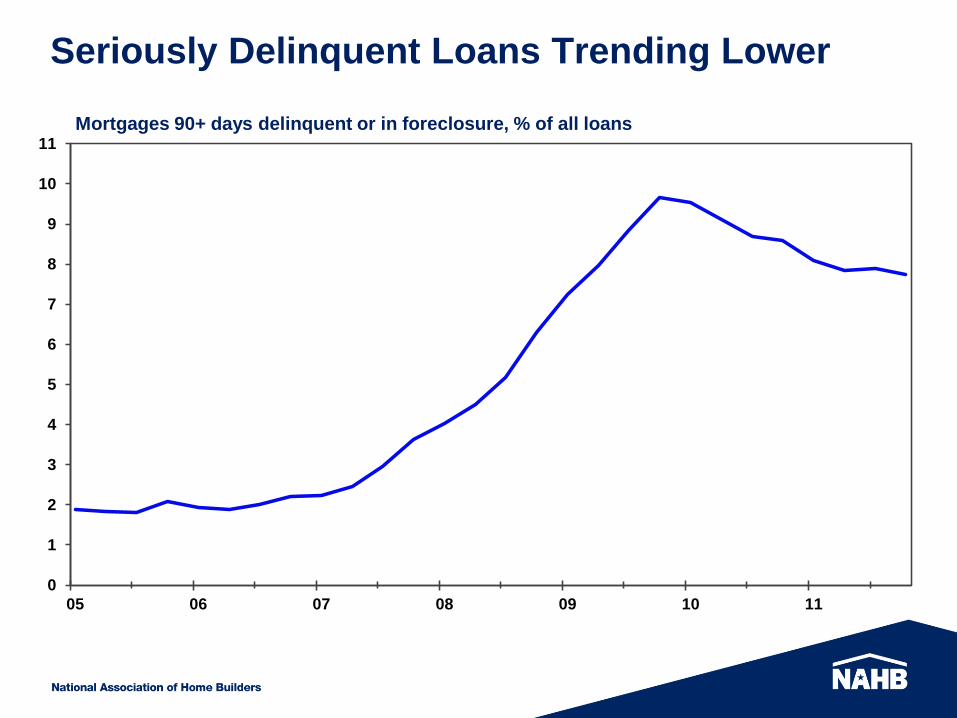
Seriously Delinquent Loans Trending Lower
0
1
2
3
4
5
6
7
8
9
10
11
05 06 07 08 09 10 11
Mortgages 90+ days delinquent or in foreclosure, % of all loans

But Delinquency Inventory Varies by State
0
1
2
3
4
5
6
7
8
9
10
11
12
13
14
15
16
17
18
19
20
FL
NJ
MD IL
DE
CT
WA
CA
NY RI
UT IN
OR
DC
SC
GA
NC
PA MI
NV
NM HI
LA
VA
ME
MA
TN
MN
WI
OH
AZ
NH
MO
CO
MS
AL
KY ID TX IA
OK
KS
VT
AR
WV
WY
NE
MT
SD
AK
ND
Six states with
more than one
year’s inventory
of distressed
24 states with
less than six
months inventory
of distressed
Foreclosure inventory plus 90-day+ delinquencies
U.S. = 8.4 months
Foreclosure inventory plus 90-day+ delinquencies month’s supply at annual sales rate

Markets Are Local

Increase in Employment Greater Than
National Average
Change in Employment
Below U.S. average
0.6% to < 0.9%
0.9% to < 1.3%
1.3% to < 1.8%
1.8% or greater

Increase in Building Permits Greater
Than National Average
Change in Building permits
Below U.S. average
6.7% to < 11.7%
11.7% to < 18.3%
18.3% to < 31.2%
31.2% or greater

Change in House Prices Relative to U.S.
Change in House prices
Below U.S. average
-4.2% to < -2.8%
-2.8% to < -1.7%
-1.7% to < -0.6%
-0.6% and greater

NAHB/First American Improving Markets Index
– The Number of Markets is Improving
12
23
30
41
76
98 99 101
0
20
40
60
80
100
120
Sep 11 Oct 11 Nov 11 Dec 11 Jan 12 Feb 12 Mar 12 Apr 12

AR Little Rock FL Tampa MD Cumberland NC Charlotte OH Springfield TX College Station
CA Fresno GA Rome Hagerstown Goldsboro OK Tulsa Dallas
CA Merced IA Ames ME Lewiston Greensboro OR Corvallis Laredo
CO Boulder Des Moines MI Detroit Greenville OR Portland Longview
Denver Dubuque Flint Rocky Mount PA Altoona McAllen
Fort Collins Iowa City Grand Rapids Winston-Salem Erie Midland
Greeley Sioux City Lansing ND Bismarck Lancaster Odessa
CT New Haven Waterloo Monroe Fargo Pittsburgh San Antonio
DC Washington ID Boise City Muskegon Grand Forks Williamsport Tyler
FL Cape Coral Coeur d’Alene Saginaw NE Lincoln SC Charleston Victoria
Crestview IN Elkhart MN Minneapolis NJ Ocean City Spartanburg UT Provo
Deltona Evansville MO Columbia NY Buffalo SD Sioux Falls St. George
Jacksonville Indianapolis Jefferson City Glens Falls TN Chattanooga VT Burlington
North Port Lafayette Joplin Rochester Kingsport WV Huntington
Orlando KY Louisville Kansas City Utica Nashville WY Casper
Panama City LA Lake Charles MS Jackson OH Columbus TX Amarillo Cheyenne
Punta Gorda
Monroe NC Burlington Dayton Brownsville
101 Improving Metropolitan Areas

Improving Markets 101 Improving Metropolitan Areas

Forecast

Real GDP Growth – Hesitated but Improving
-10%
-8%
-6%
-4%
-2%
0%
2%
4%
6%
8%
10%
90 91 92 93 94 95 96 97 98 99 00 01 02 03 04 05 06 07 08 09 10 11 12 13
Q/Q Percent Change, SAAR

Sales Dipped, But Due to Recover New and Existing Single-Family Home Sales
0
1
2
3
4
5
6
7
8
0.0
0.2
0.4
0.6
0.8
1.0
1.2
1.4
1.6
90 92 94 96 98 00 02 04 06 08 10 12
Million
Existing (R)
New (L)
Million

Single-Family Starts – Waiting for Job Recovery
0
200
400
600
800
1,000
1,200
1,400
1,600
1,800
2,000
90 91 92 93 94 95 96 97 98 99 00 01 02 03 04 05 06 07 08 09 10 11 12 13
Thousands
Trough to Current:
Mar 09 = 353,000
Feb 12 = 457,000
+28%
1995-2003 1,256,000
2010 471,000
2011 433,000 -8%
2012 506,000 17%
2013 660,000 30%

Multifamily Housing Starts Healthy Response from Growth in Renters
0
150
300
450
600
90 91 92 93 94 95 96 97 98 99 00 01 02 03 04 05 06 07 08 09 10 11 12 13
Thousands
Trough to Current:
4th Q 09 = 82,000
4th Q 11 = 204,000
149%
1995-2003 331,000
2010 114,000
2011 177,000 55%
2012 216,000 22%
2013 235,000 9%

Residential Remodeling – Continuous Improvement
Owner-Occupied Improvements
60
70
80
90
100
110
120
130
140
150
93 94 95 96 97 98 99 00 01 02 03 04 05 06 07 08 09 10 11 12 13
YR 4Q/4Q Chg
2011 3.5%
2012 12.0%
2013 7.9%
Billions 2005 $, SAAR
Source: U.S. Census Bureau, NAHB Economic and Housing Forecast.

Long Road Back to Normal* for
Single-Family Housing Starts – Q4 2013
* Normal is the average from Q1 2000 to Q4 2003
* Normal Production is measured as Single-
Family housing starts between Q1 2000 and
Q4 2003
Single-Family Housing Starts
Relative to Normal
Less than 51%
51% to 60%
60% to 67%
67% to 76%
Greater than 76%

Questions?
Answers:
www.housingeconomics.com
eyeonhousing.wordpress.com
Related Documents