CHAPTER 1 Introduction 1.1. INTRODUCTION TO GHANA Housing is beginning to be a vital issue in government policy in Ghana, at least insofar as there is now an emerging shelter strategy.* Though government policy pro- nouncements suggest a shift to an enabling approach, the bulk of public sector funds probably continue to be spent on completed units for the few middle-class urban households. In any case, there appears to be little recognition of the credibility of renting and multi-occupancy as alternative tenure options, in spite of the fact that Ghanaian urban housing is still dominated by these two modes of occupancy. Not surprisingly, many of the housing-specific interventions devised by the state recently have failed to impact positively on the poor. With a per capita GNP value in the region of US$400, Ghana is listed as a low- income economy under the World Bank system of classification (World Bank, 1992: 214). The average rate of inflation over the 1980s was estimated at 42.5% by the World Bank (1992: 218), with a peak rate of 142% for late 1983 (Roe, 1991: 527). Recent performance has been disappointing with a deficit of C144.7 billion (C = cedis; C1000 = £1 in 1992–1993) for 1992—or 5.2% of the GDP. Much of this has resulted from the government’s handling of the economy in the run-up to the 1992 elections, when monetary policy was permitted to slip out of control in the gov- ernment’s bid to pacify a distraught electorate. 1.1.1. Accra Accra is Ghana’s capital city, principal administrative centre and the sole entry point for air travellers. The native population are from the Ga people, but like most capital cities, Accra today is very much a cosmopolitan centre. Ocial statistics put the city’s population at about 1.5 million in 1995, but many demographers and social analysts contend this is on the low side. Whatever the precise figure, most local scholars agree that the city’s population is growing at a faster rate (3.4% per annum) than the city’s managers have been able to cope with. This is not particularly surprising, given the continuing primacy of Accra, and its consequent attraction to the country’s internal migrants. *The emerging shelter strategy hardly mentions renting and multihabitation, let alone recognises their value. Housing Supply in Ghana 255

Welcome message from author
This document is posted to help you gain knowledge. Please leave a comment to let me know what you think about it! Share it to your friends and learn new things together.
Transcript
CHAPTER 1
Introduction
1.1. INTRODUCTION TO GHANA
Housing is beginning to be a vital issue in government policy in Ghana, at least
insofar as there is now an emerging shelter strategy.* Though government policy pro-
nouncements suggest a shift to an enabling approach, the bulk of public sector funds
probably continue to be spent on completed units for the few middle-class urban
households. In any case, there appears to be little recognition of the credibility of
renting and multi-occupancy as alternative tenure options, in spite of the fact that
Ghanaian urban housing is still dominated by these two modes of occupancy. Not
surprisingly, many of the housing-speci®c interventions devised by the state recently
have failed to impact positively on the poor.
With a per capita GNP value in the region of US$400, Ghana is listed as a low-
income economy under the World Bank system of classi®cation (World Bank, 1992:
214). The average rate of in¯ation over the 1980s was estimated at 42.5% by the
World Bank (1992: 218), with a peak rate of 142% for late 1983 (Roe, 1991: 527).
Recent performance has been disappointing with a de®cit of C144.7 billion
(C = cedis; C1000 = £1 in 1992±1993) for 1992Ðor 5.2% of the GDP. Much of this
has resulted from the government's handling of the economy in the run-up to the
1992 elections, when monetary policy was permitted to slip out of control in the gov-
ernment's bid to pacify a distraught electorate.
1.1.1. Accra
Accra is Ghana's capital city, principal administrative centre and the sole entry
point for air travellers. The native population are from the Ga people, but like most
capital cities, Accra today is very much a cosmopolitan centre. O�cial statistics put
the city's population at about 1.5 million in 1995, but many demographers and social
analysts contend this is on the low side.
Whatever the precise ®gure, most local scholars agree that the city's population is
growing at a faster rate (3.4% per annum) than the city's managers have been able
to cope with. This is not particularly surprising, given the continuing primacy of
Accra, and its consequent attraction to the country's internal migrants.
*The emerging shelter strategy hardly mentions renting and multihabitation, let alone recognises theirvalue.
Housing Supply in Ghana 255
The city's infrastructure (especially its arterial roads, drainage, water supply and
housing) is, in most parts, in a state of distress. Only 30.8% of the city's households
have the use of ¯ush toilets. Almost as many rely on removable buckets for domestic
sanitation. Less than 20% have functioning indoor plumbing (GSS, 1995). During
peak periods, especially in the mornings, many households are unable to draw water
from their taps, due to the sheer strain on the water network. Even more alarming is
the fact that the piped water supplied to the western half of the city is routinely con-
taminated with various bacterial agents. Along the main arterial roads and around
the central sections of the city, slow queues of vehicles are now common, owing to a
signi®cant increase in the volume of road tra�c.
In July 1995, many lives were lost in ¯oods attributed by environmental analysts
to blockage of the unmaintained urban drainage system by litter and silt, and non-
enforcement of building regulations. Since then, the Accra Metropolitan Assembly
has intensi®ed e�orts to clean up the city's landscape. Through generous Western
and Arab support, major investments are also underway to rehabilitate Accra's ailing
water, electricity, street and drainage networks.
According to data from the 1991/92 round of the Ghana Living Standards Survey
(GLSS), only 17.6% of Accra households own their homes, and 43.0% rent. As
many as 48.2% occupy rent-free accommodation. The tenure status of the remaining
1.3% is ambiguous. More than one-half (52.7%) of Accra households have use of
one room only: over 40% of these one-room households consist of four or more
members. Only 14.2% occupy three or more rooms (GSS, 1995).
1.1.2. Kumasi
Kumasi is the second largest city in Ghana and capital of the former Asante
Empire. Predominant in the city are the Akans, a group of people sharing the Twi
language, dominated by the local Asantes. The population statistics for the city are
subject to some disagreement. One of the authors estimates that in 1990 there were
about 800 000 (extrapolated from Tipple's 1986 data), but the 1984 Census (showing
a very low 490 000 in 1984) suggests that there were only about 600 000 people in the
city in 1990.*
Housing in Kumasi is dominated by compounds (57% of houses in 1986) which,
when complete, are roughly square on plan with a mean of about 12 rooms per
storey opening o� a central courtyard. As over 70% of households occupy one
room, and mean occupancy rates in the city are in excess of 3 persons per room,
single storey compounds tend to accommodate over 30 people. Multi-storey com-
pounds (16% of houses) contain a mean of 17 rooms (Malpezzi et al., 1990).
Non-compound housing tends to be in the form either of bungalows or two-storey
buildings set in relatively spacious plots or of apartment buildings of two or three
storeys. There is also a small government sector of relatively small, single household
dwellings. Though non-compound types constitute 43% of houses, their small size
*There is a general consensus that the census ®gures are low for urban areas.
256 Progress in Planning
relative to compounds reduces the number of people for whom they provide accom-
modation.
The compound/non-compound dichotomy in Kumasi tends to divide housing into
distinctly di�ering accommodation (Tipple and Willis, 1991; Tipple and Korboe,
1993; Korboe, 1992b), although there is nothing inherent in the compound form to
generate this. However, the communal life encouraged by the compound may suit
the poorer households as it improves the e�ciency of survival strategies such as
informal child care and mutual assistance in times of need. Households in the com-
pound houses tend to occupy single rooms and have particularly poor access to ser-
vices.
In 1986, only 12% of households in Kumasi (almost all of whom are in non-com-
pound housing) had a toilet which was not shared with other households and 30%
had no access to a toilet in the house (and most of these were in compounds). Even
when a house has a toilet and it is shared (as most are), the utility it provides may be
very low. In areas such as Mossi Zongo and Atonsu, each tap is shared by 102 per-
sons, or 24 households, and each toilet by 156 persons, or 31 households (Korboe,
1992b). Owners have tended to have much better access to services than other tenure
groups; 46% having exclusive use of a toilet and only 14% having none (Malpezzi et
al., 1990).
Further details on housing conditions in Kumasi can be found in Hellen et al.
(1991), Malpezzi et al. (1990), Tipple and Willis (1991) and Willis et al. (1990).
1.1.3. Berekum
According to Berekum's oral history, the town was established in the late 18th cen-
tury as a hunting-post settlement by an Asante chief. Thus, many of Berekum's `indi-
genes' see themselves as originating from Ashanti.
In the 1940s and 1950s, Berekum boasted a relatively large number of successful
cocoa planters, many of whom backed Busia's opposition United Party against
Nkrumah's Convention People's Party. According to McCaskie (1991: 512), these
``[capitalist cocoa farmers] . . .were opposed to the CPP's state-controlled cocoa-mar-
keting system''. The Berekum Traditional Council reports that many of the more suc-
cessful and powerful citizens ¯ed Berekum and other Brong towns under persecution
from Nkrumah. Most, but certainly not all, of them returned after Nkrumah's down-
fall in 1966.
In descending order, the main occupations are farming, trading and woodworking.
Both food crops and cash crops are grown. In the food crop sector, there is about an
even mix of subsistence and market-scale operations. With the continuing trend of
falling real earnings from cocoa, many cocoa planters have converted to food crop
production in recent years. The shift to food crop farming is made more inevitable
by the fact that many of the older cocoa plantations have been inherited (inevitably)
by joint heirs who have subdivided the original pro®table farms into holdings too
small to be pro®table as cocoa farms. In spite of the shift reported above, there
remains a signi®cant number of indigenes with substantial cocoa farms in the
Housing Supply in Ghana 257
Ashanti and Western Regions. It may be that far-o� farms are less attractive for
relocation, hence a lower rate of e�ective subdivision.
The 1984 population census, deemed by local demographers to have under-enum-
erated urban populations gave Berekum's population as 22 264. We are informed by
community leaders that many of the larger properties in town belong to absentee
cocoa farmers and that a fair proportion of high-cost newly built houses belong to
so-called `Burgers' (a generic expression, derived from Hamburger, referring to
Ghanaian expatriates in Germany).
1.2. INTRODUCTION TO SUPPLY ISSUES
The components of housing supplyÐland, ®nance, building materials, labour, in-
frastructure, and the regulatory frameworkÐare dealt with brie¯y below in order to
establish the context within which housing developers work in urban Ghana. It has
been argued by many academics and sta� at the World Bank (1993) that the e�ec-
tiveness of housing supply is so closely tied up with these components that, by
enabling the e�cient supply of each (and the minimum disturbance caused by the
regulatory framework in reaching its ends), the supply side will be able to cope with
demand. While there are obvious problems with this argument for people at and
below the margin of a�ordability, the health of each component is, indeed, pertinent
to our discussion here and we will spend some time on them.
1.2.1. Land
The means of land allocation and leasing conditions in Ghana are well documen-
ted elsewhere (for example, Bentsi-Enchill, 1964; Ollennu, 1962). Most land in
Kumasi and Berekum is owned by stools, the symbols of authority of land-holding
kin-groups (abusua), under the allodial right of the Golden Stool of Asante. The allo-
cation of land for lease is in the hands of chiefs under the Asantehene's Lands O�ce
who can alienate land to members of the stool (as of right) or strangers in exchange
for a tribute, known as drink money (biri nsa) which, in Kumasi, now represents a
market value. Land title registration and document processing procedures are still
centralized in Accra.
For land in Accra, the owning bodies are represented by chiefs (Mantsemei), fetish
priests (wulomei), quarter heads (akutseiatsemei) and family heads (HUDA, 1990).
While there are some areas where stools gained the rights to allocate land (particu-
larly in Labadi), most quarter heads have remained in control of their land. There
are also some land-owning families. This rather complicated set of, often overlap-
ping, land allocating entities, has led to many very clouded titles with the subsequent
delays in development, legal costs, and multiple payment for the right of use of the
land. Recently, as part of the new stress on urban management, the land registration
system in Accra is being overhauled as a precursor to a national land registry.
258 Progress in Planning
In both Kumasi and Accra there has also been a `modern' sector, where land is al-
located through freehold or leasehold and administered directly by the government's
Lands Department.* In Kumasi, access to the few state-managed plots is becoming
very di�cult, even for the in¯uential. Although, o�cially, all of Kumasi's state-con-
trolled plots have already been allocated, some vacancies exist in the signi®cant num-
ber of allocated plots which have not yet been built on. Land law{ allows the
repossession of such plots for subsequent reallocation, but because de facto title
holders tend to command in¯uence, public servants charged with the responsibility of
administering state lands have di�culty re-entering such plots.
Each of the three urban centres under study has only an insigni®cant number of
freeholds. For Accra, records at the Lands Commission Secretariat indicate that free-
holds account for less than 0.1% of the total land area. State-controlled land is just
under 13%.
Speculation does not appear to be practised on a very large scale in Accra,
although it was more common in the 1970s. An average speculator tends to hold
only two or three plots and concentrates on the choicest locations and government
land (East Legon is particularly notorious in this respect). The prevalence of land liti-
gation in Ghana is likely to be a major deterrent. The few real estate developers who
are active are substantially expanding their acquisitions, even in the face of an o�cial
ban on grants of Accra stool lands since February 1991. Hearsay evidence suggests
that a small number of foreign nationals, mainly Arabs, are speculating on a small
scale in land.
Plots in Ghana are large by international standards. In established settlements in
Kumasi, such as Asokwa, Ayigya, Ridge and Patasi, the survey team found typical
plot measurements of 50� 70 m, 40� 66 m, 30� 40 m and 33�36 m (between 1200
and 3500 m2). Plot sizes of 26� 40 m, 30� 33 m and 26� 33 m (970±1040 m2) are
becoming increasingly common in less established parts of the city where chiefs are
carving out smaller, but still substantial, plots to maximize their gains.
In Kumasi, plots will typically have un-built space around 82±86% for villas (¯oor
space indices of 14±18%).{ Even at Suntreso, a government-built low income estate
with plot sizes only half as large as standard plots in the city, only 55 m2 of built
area were constructed on plots of 400 m2.
In Accra, the Tesano CFC Estates (low-density, middle-class housing) has net plot
sizes of 57� 33 m (about 1880 m2) and only four plots per hectare. The combined
e�ect of large plots and small built areas is low-density urban sprawl, resulting in
higher infrastructure costs and, therefore, a negative impact on prospects for servi-
cing.
Berekum's allocation system is unlike the other two and appears to be particularly
equitable. A written application (stating the broad purpose) together with a passport-
sized photograph must be submitted to the Traditional Council. The potential lessee
*There are no new freeholds currently being granted in Accra.{Speci®cally the Administration of Lands Act and the Conveyancing Decree (Act 123 of 1962 and NRC
Decree 275 of 1973 respectively).{Computed from data obtained from 43 randomly selected villa sites, supported by a small selection of
architects' designs at the Faculty of Environment and Development Studies at UST.
Housing Supply in Ghana 259
is then required to attend an interview to justify his application. Only if an appli-
cation is approved is the applicant made to pay the (token) fee (this is very unlike
the system in Ashanti and most other Ghanaian stool land areas). The fee for a 99-
year lease is a ®xed C25 000 (£25), irrespective of the applicant's place of origin, or
the location or size of the plot (plots average 26� 33 m, 958 m2). Out of the standard
fee, C4000 goes to the surveyor as remuneration, C9000 is paid to the District assem-
bly for development purposes and C12 000 is paid into the Traditional Council
account to pay expenses, and tributes to the paramount chief (omanhene), the queen
mother and divisional chiefs.
Administering the system is a Joint Allocation Committee comprising two mem-
bers of the Berekum District Assembly (essentially an elected body), four members of
the Traditional Council (i.e. chiefs), the Planning O�cer for Berekum, and the
Registrar of the Berekum Traditional Council (ex-o�cio). Each applicant is entitled
to one plot. If an applicant is deemed too young (under 20 years), the application is
deferred. A few applicants are rejected, mostly on account of drunkenness and this
holds for life. Traditional Council plots are now only available on the periphery of
Berekum. Central plots are more expensive, at a minimum of C400 000 and are only
accessible through native speculators.
Commercialization of community and ancestral land in Ghana is becoming
increasingly common; from pure tribute before the 1960s, drink money has become a
notional market price in modern times. In areas where the demand for residential
land has outstripped the pace at which the planning authority prepares its sector lay-
outs, land-holding chiefs are resorting to preparing their own (parallel) layouts.
While the frustration of such land-holders is understandable, the practice worsens an
already confused situation in which land documentation is grossly inadequate and
litigation rife.
Ministry of Works and Housing records show land litigation cases in Ghana conti-
nuing to rise. From 13 000 recorded in 1991, to 16 000 by March 1993. Among the
main reasons adduced by Lands Commission o�cials are:
. the complexity of title transfer and processing procedures;
. joint inheritance practices, and the resulting need to negotiate with several parties
rather than with one owner;
. multiple allocations by chiefs: such practices are essentially fraudulent, since chiefs
have accurate information on the status of plots within their jurisdiction;
. in some cases, litigation arises because of boundary disputes (Ghana lacks an e�-
cient cadastre).
1.2.1.1. Squatting. In most developing countries, squatting has been an alternativehousing supply strategy for many of the poor. In Ghana, however, it is very rare,owing mainly to the close watch kept on land by local chiefs and, perhaps, a fear of¯outing supernaturally underpinned laws of land occupation (Korboe, 1993a;Konadu-Agyemang, 1991; Tipple, 1984). There is a well-known informal settlementnear Accra, Ashaiman, which was acquired and partially developed by the state (as
260 Progress in Planning
temporary? dormitory housing for the workforce employed to construct the Tematownship and as a resettlement camp for households displaced in the creation of theindustrial town). Because it is government-owned land, it attracted others whomoved in as squatters. Elsewhere, however, there is little government land and squat-ting is largely restricted to high income households with in¯uence. In Kumasi, high-cost squatter housing may be found at Adiembra, where the state claims to haveacquired (but not paid the relevant compensation in respect of) a large parcel of landintended for a `working class' (TUC) housing estate.
The 4th Republican government has recently approved the regularization of titles
to in¯uential invaders of state land in the Kwashiman area of Accra on a site orig-
inally intended for a stadium. Within the same period, low-income households were
being evicted from public land at Agbogbloshie (also in Accra), where some 400
houses were a�ected in the dawn swoop of 31 July 1993. However, the households in
question were not squatters (invaders) in the regular sense as the Accra Metropolitan
Authority seeks to portray. Rather, they were people whose lands had been compul-
sorily acquired in the 1960s under authority of the Accra Industrial Estate
(Acquisition of Lands) Ordinance No. 28 of 1956. Since the relevant compensation
was paid by the state at the time of acquisition, and the land subsequently allocated
to Accra Brewery Ltd for industrial development, the a�ected households were
deemed to have lost their rights to the land.
In discussing prices of land, we are referring to the amount of drink money paid
for a lease of 99 years which provides rights of surface user (usufruct) to a holder
from outside the lineage in whom the land is vested. In Kumasi, unserviced plots in
so-called ®rst class residential areas* attract lease prices of C2.5±4.0m; second class{attract C1.5±2.0m; and third class{ command C600 000±800 000. Some areas are es-
pecially attractive. The old colonial layout in the Ridge area fetch C5±6m per plot.
In June, 1993, sub-leases on serviced peripheral plots (at Atasomanso) were being
granted for C3m (Parakuo Estates Ltd, Kumasi); serviced plots at Kentenkrono were
C2.5m.
In Accra (August 1993), Ofankor plots (state plots o�ered on `kalabule'} terms)
were priced at C3±4m, although, for well-connected people, they could be obtained
o�cially through the Lands Commission for C1.8m plus C80 000/acre annual ground
rent; similarly government land at East Legon was on o�er at C12±15m kalabule for
half acre plots. At Airport West and East Cantonments estates, government plots
were available at as much as C20±25m through kalabule. Stool land at South
Ofankor was in excess of C2m for half an acre; Abofu plots (near Achimota Forest)
were C5m for 33� 33 m); at East Legon it was C7±10m for 25 m� 33 m to
*1st class includes: Asokwa and New Amakom, Atasomanso, Adiembra, Adiebeba, Ahodwo, AyigyaWest, Bomso, Danyame, Fankyinbra, Nhyiaeso, Patasi, Ridge, West Kwadaso.
{2nd class includes: Old Amakom, Asafo, Bimpeh Hill, Ayeduase, Anwomaso, Asokore Mampong,Kentinkrono, Dichemso Extension, Chirapatre, Gyinyase, Kwadaso, Manhyia Extension, New Tafo,Suntreso, Santasi.
{3rd class includes: Aboabo, Abrepo, Ahinsan, Akorem, Asuoyeboa, Old Atasomanso, Old Ayigya, Boadi,Emena, Breman, Bohyen, Asawasi, Old Tafo, Pankrono, Oforikrom.
}The term kalabule was commonly used before the 1981 Revolution to refer to the black market operatingin every conceivable good available and the high cedi prices of those goods. Its pejorative implicationhas, perhaps, heightened since Ghanaians have become used to life without a black market.
Housing Supply in Ghana 261
33� 33 m; at Amasaman: C600 000±C1m; and in the Kaneshie highway area, marshy
plots of 33� 46 m cost C3m.
These `prices' are very high for Ghana, but not in international terms. The see-
mingly astronomical (in Ghanaian terms) C25 million (C25m) is £25 000 (at 1993
conversion rates) and this `buys' over 1000 m2 of prime residential land on which
would be built a house worth £50 000±100 000 or more. The more usual C2m (£2000)
plot would be the basis for a house costing in excess of C20m (£20 000). Thus, land
cost is only 10% of building cost.
1.2.2. Finance
The World Bank recently reported that, among the countries for which it had rel-
evant data, Ghana had the highest house-price to income ratio (World Bank, 1989:
ii). In this context, it is particularly serious that formal sector housing ®nance is vir-
tually non-existent, indeed the formal ®nancing sector is relatively poorly developed.
It is reported* that only 10% of the nation's money supply (estimated at C88 bil-
lionУ88mÐin March 1993) is immediately available to the formal banking system
(about £9m). Thus, though people may be poor on average, there is a substantial
volume of cash in the informal sector which could be utilized for development pur-
poses. By devising truly encouraging interventions, it may be possible to attract such
latent capital for low-income housing investment. However, to date, government
intervention in housing ®nance has been ine�ective in serving the vast majority of
people.
As the highest interest rate reported for deposits over the period was only 16%, it
is not surprising that the savings/GDP ratio never rose above 4.34% (Osei, 1993).
GDP is reported to have grown at some 3% per annum over the same period. While
there have been de®nite improvements in economic performance since the mid-1980s,
when the government adopted tough adjustment measures as a pre-requisite for
further donor lending, these have been dampened somewhat by the double burden of
debt servicing and deteriorating terms of trade.
The major thrust of government housing ®nance currently is the Home Finance
Company (HFC). Lending portfolios of other public housing ®nance institutions
(Bank for Housing and Construction and the First Ghana Building Society) are
altogether negligible.
Incorporated in mid-1990, HFC administers three main schemes at present:
1. The 5-year pilot scheme (1991±1995) for which applicants are required to purchase
their housing new from registered real estate developers. Budgetary provision has
been made for some 3000 dwellings under this scheme at a concessionary real
interest rate of only 3.5% indexed to in¯ation. A 20% down-payment is required.
*According to Bank of Ghana sources referred to by the Managing Director of the Home FinanceCompany during a presentation at National Shelter Strategy Seminar, Accra, 4th, March, 1994.
262 Progress in Planning
2. The non-resident scheme under which expatriate Ghanaians, particularly those in
Western Europe, are being encouraged to own homes in Ghana. The real interest
rate for this category is 4.5%.
3. The uncompleted house scheme which allows applicants to take loans for complet-
ing outstanding works. Again, the real interest rate is 4.5%.
By 26 July 1993, applications under the pilot scheme (1) totalled 884 (worth C5.00
or C5.6m each), of which 800 had been approved (worth C4.443 or C5.5m each) and
disbursements had been made to 339 (worth C2.029 or C6m each). The gap between
approvals and disbursements is due wholly to developer delivery shortfalls. The bor-
rowers were all public servants, owing to the certi®able income requirement in the
collateral clause, and about 90% had institutional assistance from organizations such
as the Ghana National Petroleum Corporation, the Ghana National Procurement
Agency, the American-owned Volta Aluminium Company, and the Posts and
Telecommunications Corporation. No speci®c rationing mechanisms are applied
except those implicit in the points above.
The in¯ation rate used for interest determination is that declared by the Statistical
Service in its combined CPIs. From project take-o� in October 1991 up to July 1993,
the rate applied has averaged about 18% per annum, thus loans are charged for at
21±23% per annum.
HFC is seen by its o�cials primarily as a viable ®nancial enterprise; they have no
delusions of its being a major lender for low-income housing activity. Policy-makers,
on the other hand, have often advertised HFC as the long-awaited solution to the
problems of low-income housing ®nance. The extent of subsidy on HFC loans can be
judged through comparison with other loans. In July 1993, the bank rates for bor-
rowing ranged between 29 and 38%, with the lowest values reserved for agricultural
investments and the highest values applicable to the construction sector.
Registered private developers (the only suppliers whose products are acceptable to
the HFC) in search of economic viability ®nd it necessary to build for upper sectors
of the market. Thus, their houses are only a�ordable to public corporations and indi-
viduals with very high incomes. It is an open secret that a sizeable proportion of
such money comes from overseas employment and from dubious local and foreign
sources. Thus, the subsidized interest rates, paid for by the public purse, are redistri-
buting income from the poor majority to the fortunate few.
None of the above is available for the majority who develop in any informal way;
through not being one of the few registered real estate developers (members of
GREDA), through not having more than a traditional land lease (as land held thus
cannot be used as collateral), through not having planning permission, or any of the
other common disquali®ers from the formal sector which a�ect most housing actually
occupied by the poor.
1.2.2.1. Subsidies. Rent Controls are probably the main subsidy a�ecting poor resi-dents; a subsidy carried by landlords. PNDC Law 138 of 1986 forbids landlordsfrom raising rents without prior approval of the Ministry of Works and Housing. LI1318 of 6 March 1986, which raised o�cial rental levels 10-fold but still ®xed themat very low levels (C300 for a sandcrete room in a shared house), had a tenure of
Housing Supply in Ghana 263
one year and has therefore expired, in theory. However, the rent courts continue todetermine cases on the basis of rent levels stipulated in that legislative instrument. Ina tenancy adjudication at the Accra Rent O�ce in 1993, for example, it was ruledthat the landlord had no right to charge more than C410 for chamber-and-hall ac-commodation (a suite of two rooms) (Daily Graphic, 30 August 1993: 1). The land-lord had demanded C5000 from the tenant.
Rent controls have certainly in¯uenced the supply of rental accommodation, but
probably not as much as previously thought (e.g. in Malpezzi et al., 1990; Tipple and
Willis, 1991), because of the non-pecuniary nature of most rental housing supply in
Ghana. In emphasizing the `peace of mind' aspect of supply motivation, many of the
landlords in our sample compare to those in Mexico City, of whom Gilbert (1993:
53) states: ``landlords are not greatly concerned about the low rents they receive
because their main reason for building is to own property.''
1.2.2.2. Rents and advance rents. In this low rent regime, in which mortgage ®nancingis lacking for all but the wealthiest urban dwellers, advance rent has, since the mid1980s, become an important way for owners to raise money to invest in extendingtheir houses. A large numbers of months' rent are now demanded both from newtenants and from those who are currently in residence as a substitute for subsequentmonthly payments. The authors also found evidence that landlords are increasinglyasking prospective tenants to build the required rooms (or else advance the full con-struction capital), the cost of which is then amortized against monthly rent values.
According to the Rent O�cer in Kumasi, interviewed in July 1993, the monthly
rent payable on single rooms is generally in the region of C2000.* Landlords and
tenants simply negotiate satisfactory rent levels. The Rent O�cer holds the view that
it is not unreasonable to evict tenants who insist on paying rents at the unrealistic
levels prescribed in PNDCL 138/LI 1318 (both of 1986), because the legislation has
actually expired even though it is still being applied by some authorities. According
to a few accommodation agents who have now set up in Kumasi, advance payments
are about 3 years rent or about C250 000 for single rooms and C1.5±3.6m for self-
contained accommodation.{Korboe's (Korboe, 1992a) prediction that housing could become more marketable
if it made economic sense seems to be supported by the rate at which residential
rooms are being converted to commercial use (service workshops, retail and whole-
sale outlets, etc.) in areas that have recently become accessible (as a result of the
road improvement programme). In areas such as Asafo and Ashanti New Town
where demand is high, there are many reports of eviction to allow such conversions
to be e�ected; in family houses along principal streets, some rooms have been
swapped so that street-side rooms are now held by the more prosperous who are
able to invest in commercial ventures. Often, these members would convert their
rooms to commercial uses and rent rooms elsewhere. General house improvements
are sometimes provided by would-be converters as a means of encouraging the co-op-
eration of resident members and unwilling family heads.
*This is C500 higher than our data show (see later).{This is twice the levels claimed in our data.
264 Progress in Planning
1.2.3. Building materials
During the 1970s and early 1980s, there were grave problems in obtaining building
materials. In 1980, for example, cement could be obtained at a government-con-
trolled (subsidized) price through o�cial channels which were very slow (but open to
corrupt payments), or through the black market at about 20 times the controlled
price. In either case, shortage was endemic. Now, however, although it is reported by
the World Bank (1990: 44) that there is (or, at least, was at the time of that study) a
routine shortfall in cement supply, building materials can be obtained reasonably
easily and there are many retail outlets in the major towns. In general, cementitious
products and components (sandcrete building blocks and in situ concrete elements)
are favoured by builders and house-owners alike, but they are not wet-cured; rather,
they are deliberately exposed to the sun to speed the drying process which consider-
ably reduces their strength.
The majority of sandcrete blocks are produced by small-scale entrepreneurs using
labour-intensive production methods and moving from site to site. Often, the sand
used is contaminated with pieces of polythene, stones, roots and other vegetable mat-
ter, and the mixing process is less than thorough. Mixes are weak by textbook stan-
dards. The standard mix required by regulation is 1 part cement to 6 parts sand, but
some use 1 to 9 so that one 50-kilo bag of cement is used to produce 25, 125 mm
blocks (i.e. 125 mm thick�300 mm high� 450 mm long). More commonly, the
cement is stretched even further to get about 35, 125 mm blocks from a bag of
cement at 1 part cement to 12 parts sand. Though most blocks are compacted satis-
factorily in purpose-built manual presses imported from overseas, a few manufac-
turers simply pat the damp mix into shape in wooden moulds. In such instances,
compaction pressures can be very low indeed. Notwithstanding the inadequacy of
curing practices and the routine presence of contaminants in sandcrete mixes, the
blocks produced have, so far, proved quite adequate for low-strength applications
such as simple, single-storey house construction.
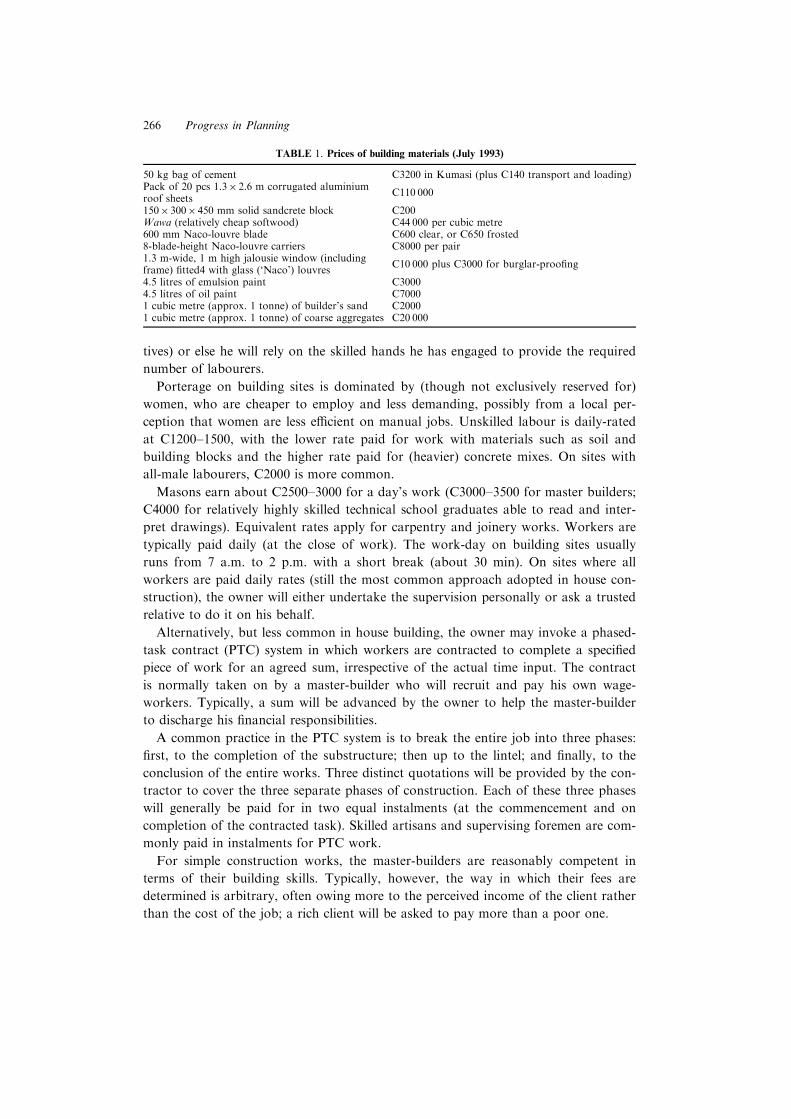
Corrugated aluminium has replaced corrugated galvanized iron as the roof clad-
ding material of choice. The micro-concrete tile has been popular since its introduc-
tion in the late 1980s, but its use is restricted to high-cost housing because its weight
implies a need for more elaborate wood framing. As timber is increasingly valuable
as an export, sawn timber for extensive rafters and purlins has become rather expens-
ive in recent times. Ultimately, this has led to a situation whereby, for low-income
households at least, the micro-concrete tile roof is not a realistic alternative to the
traditional metal roof (Table 1).
1.2.4. Labour
Construction labour is relatively easy for a house-owner to obtain. Skilled labour
is typically engaged by recommendation. In the case of unskilled labourers, the pro-
spective builder will either advertise his need verbally (through friends and/or rela-
Housing Supply in Ghana 265
tives) or else he will rely on the skilled hands he has engaged to provide the required
number of labourers.
Porterage on building sites is dominated by (though not exclusively reserved for)
women, who are cheaper to employ and less demanding, possibly from a local per-
ception that women are less e�cient on manual jobs. Unskilled labour is daily-rated
at C1200±1500, with the lower rate paid for work with materials such as soil and
building blocks and the higher rate paid for (heavier) concrete mixes. On sites with
all-male labourers, C2000 is more common.
Masons earn about C2500±3000 for a day's work (C3000±3500 for master builders;
C4000 for relatively highly skilled technical school graduates able to read and inter-
pret drawings). Equivalent rates apply for carpentry and joinery works. Workers are
typically paid daily (at the close of work). The work-day on building sites usually
runs from 7 a.m. to 2 p.m. with a short break (about 30 min). On sites where all
workers are paid daily rates (still the most common approach adopted in house con-
struction), the owner will either undertake the supervision personally or ask a trusted
relative to do it on his behalf.
Alternatively, but less common in house building, the owner may invoke a phased-
task contract (PTC) system in which workers are contracted to complete a speci®ed
piece of work for an agreed sum, irrespective of the actual time input. The contract
is normally taken on by a master-builder who will recruit and pay his own wage-
workers. Typically, a sum will be advanced by the owner to help the master-builder
to discharge his ®nancial responsibilities.
A common practice in the PTC system is to break the entire job into three phases:
®rst, to the completion of the substructure; then up to the lintel; and ®nally, to the
conclusion of the entire works. Three distinct quotations will be provided by the con-
tractor to cover the three separate phases of construction. Each of these three phases
will generally be paid for in two equal instalments (at the commencement and on
completion of the contracted task). Skilled artisans and supervising foremen are com-
monly paid in instalments for PTC work.
For simple construction works, the master-builders are reasonably competent in
terms of their building skills. Typically, however, the way in which their fees are
determined is arbitrary, often owing more to the perceived income of the client rather
than the cost of the job; a rich client will be asked to pay more than a poor one.
TABLE 1. Prices of building materials (July 1993)
50 kg bag of cement C3200 in Kumasi (plus C140 transport and loading)Pack of 20 pcs 1.3� 2.6 m corrugated aluminiumroof sheets
C110 000
150� 300� 450 mm solid sandcrete block C200Wawa (relatively cheap softwood) C44 000 per cubic metre600 mm Naco-louvre blade C600 clear, or C650 frosted8-blade-height Naco-louvre carriers C8000 per pair1.3 m-wide, 1 m high jalousie window (includingframe) ®tted4 with glass (`Naco') louvres
C10 000 plus C3000 for burglar-proo®ng
4.5 litres of emulsion paint C30004.5 litres of oil paint C70001 cubic metre (approx. 1 tonne) of builder's sand C20001 cubic metre (approx. 1 tonne) of coarse aggregates C20 000
266 Progress in Planning
Artisan training is provided in two main ways. One route is through the polytech-
nics, technical schools and, in theory, the Junior Secondary Schools (JSSs). More
commonly, however, skills are simply acquired through apprenticeship.
1.2.5. Infrastructure
In most newly developing areas of Accra, Berekum, Kumasi and virtually all other
Ghanaian towns (with the exception, perhaps, of the planned port city of Tema), ser-
vicing lags behind building development. Currently, only eight of the country's 110
district capitals have comprehensive piped water networks (Economist Information
Unit, 1993: 16). At city level, the Ghana Water and Sewerage Corporation (GWSC)
is responsible for the treatment and supply of water as well as for drainage and sani-
tation. In the rest of the country (outside the three cities and a few of the other re-
gional capitals), responsibility for drainage and sanitation is divested to District
administrations.
As a means of improving overall access to basic servicing, the Ministry of Works
and Housing is seriously considering establishing an Infrastructure Fund from which
real estate developers can borrow. According to ministerial o�cials, such borrowing
is intended to serve primarily as bridging ®nance (rather than a gift) to help develo-
pers overcome some of their cash-¯ow problems. Lending to the real estate sector
would be at concessionary rates. It is not entirely clear how the seed capital would
be raised, except that the Ministry expects support from the World Bank, the
Ministry of Finance and local authorities. In the case of roads and drains, costs
would be recovered through property rates payable to the local authorities.
As usual, the stated emphasis is on low-income households, but the eventual out-
come is likely to be very di�erent. Just as existing ®nancial concessions to the real
estate lobby have failed to produce the anticipated low-cost housing units, the pri-
mary bene®ciary of this additional incentive is likely to be the formal sector develo-
per. Should this occur, the concession would be regressive, considering that the state
would not only be foregoing valuable revenue, but also taxing the poor to further
enrich the already wealthy realtor. If the broad plan should be pursued, therefore,
some redesign would be necessary to address this anomaly.
1.2.5.1. Water supply. Accra receives its water from two main catchments: the Kpongand Weija dams. These provide a daily output of 180 million and 86 million litres re-spectively, against an estimated 364 million litres of demand (GWSC ®gures).
In parts of Accra (e.g. Odorkor, Dansoman, Korle-Bu and Osu), supplies are only
reliable late at night or sometimes at dawn, forcing people to keep unsocial hours in
order to get a bucketful. Even in some more fortunate areas, water will only run
from upstairs taps when all those at ground ¯oor level have been turned o�. A simi-
lar situation prevails in parts of Kumasi as well.
It is reported for Kumasi that each water connection is shared by 46 persons (or
10 households) and that 58% of households have on-site connections (Kumasi
Health Education Project: KHEP, 1993). The situation is obviously worse in
Housing Supply in Ghana 267
Berekum. For a signi®cant proportion of the population also, contamination is a real
risk as a result of inappropriate water storage practices, which themselves betray the
unreliability of supply.
Statistics of persons per tap do not fully re¯ect the level of adequacy because
pressure is often low and taps can be dry for days, especially in elevated locations
and in poorer areas where the branch mains are inadequately sized. A multiplicity of
long private connections, improperly laid pipes and exposed lines easily su�ering
damage, are common in poorer areas and render supplies prone to contamination.
In Berekum, the water supply network is restricted to so-called primary lines. The
maximum connection length permitted from these is 400 ft, beyond which pressure
tends to drop to ine�cient levels. It is not surprising, therefore, that the overwhelm-
ing majority of houses in Berekum are without water connections. Gross pumping
capacity of the two mechanized boreholes is 27 000 l hour, the high-level tank holds
230 000 l. The town has 12 operational standpipes for which attendants have been
appointed. At these, water is sold for C10 per 18 l bucket. The GWSC revenue at-
tendant, regarded as a registered vendor, receives payments from drawers on a pay-
as-you-draw basis. Peak drawing periods are: 5.30±8.00 a.m. and 5.00±7.00 p.m.;
although pressure at night is adequate, the standpipes are locked between 9 p.m. and
5 a.m. As it is markedly more pro®table to sell through registered vendors, there
appears to be little incentive for GWSC (Berekum) to extend connections to unser-
viced houses.
GWSC in Berekum is reportedly unable to ®nance the purchase and installation of
meters for all service outlets. Thus, ¯at rates are applied depending on water-consum-
ing facilities and estimated number of persons. It is no secret that, with unmetered
supplies tending to be cheaper than metered ones, some owners of serviced houses
resell water to the public at a pro®table C10 per bucket; others permit unlimited
access to speci®c households for ®xed monthly fees.
During an observation of a public standpipe in Berekum, there were 46 buckets at
the standpipe at 6.20 a.m. and it took 1.5 min to ®ll a bucket under normal pressure
conditions. At 9.00 a.m., there were 22 buckets in the queue and it took nearly 5 min
to ®ll an average-sized bucket; clearly, search costs for water are high (in terms of
time). When one of the two functional boreholes is out of order, some of the town's
taps remain dry for a full week. Also, taps sited on high ground only have water
when the town's high-level tank is full. Under GWSC's Immediate Action Plan
funded by the ODA, Berekum is receiving two additional boreholes to supplement
the two functioning ones.
Key problems identi®ed by GWSC are the need to renew cast iron distribution
lines and the multiplicity of independent connections (incomprehensive networking)
which result in serious pressure losses. In spite of the inadequacy of potable water
supplies, about half of Ghana's treated water is lost through leaks and burst pipes,
according to the MoWH, which has instructed GWSC to address the leakage pro-
blem or else be denied approval for future tari� increases.
In urban areas, Ghana Water and Sewerage Corporation (GWSC) has discontin-
ued day-to-day management of state-owned standpipes, mainly because of misuse
and di�culties in recovering costs. As we have seen in Berekum, the practice of
268 Progress in Planning
water vending by small-scale private entrepreneurs has been formalized in place of
direct state control. There are 13 registered vendors in Accra (all in low-income hous-
ing areas). According to the Commercial Manager, this approach represents the
Corporation's new strategy for servicing low-income urban settlements.
Water charges are based on an increasing block tari� (IBT) system, costs per gal-
lon rise as consumption increases at the meter. Charges vary from C0.414 for the
®rst 13 600 l to C2.038 for after 900 000 l per month. This discriminates against
sharers and is particularly inappropriate since it is the urban poor, typically residing
in multi-occupied properties, who are penalized. Unmetered premises pay the mini-
mum monthly charge of C1279 per month (£1.28).
1.2.5.2. Sanitation. It is common for rubbish tips to be used as toilets by children byday and some adults by night. In some parts of Accra where houses lack sanitation,people relieve themselves into polythene bags and deposit these into the communityrefuse skips. Thus, the boundary between refuse disposal and excreta removal israther fuzzy.
In some urban areas, WCs are ®tted draining into individual septic tanks, but
many households in urban Ghana still depend on the daily removal of raw excreta
from the home through the bucket conservancy system. In Kumasi, KHEP (1993)
estimates that 40% of households rely wholly on public latrines, mainly of the aqua-
privy type, but undergoing conversion to a locally developed version of the
Ventilated Indirect Pit (VIP) type known as the Kumasi VIP or KVIP. The health
e�ects of the poor system is demonstrated in morbidity data in which it is estimated
that there are over 100 000 cases of sanitation-related diseases reported in Kumasi
per year, of which about 1000 are cases of cholera (KHEP, 1993).
Berekum public latrines are mostly aqua-privies, though there are a few KVIPs. A
short observation of an hour in the early morning (6.25±7.25 a.m. on Friday 2 April
1993), showed the following behaviour. The 20 squat-holes (16 for adults; 4 for chil-
dren) were used by 154 people (both sexes) after an average waiting time of 7 min;
average time spent inside the building was 6 min. In addition, an average of 8 people
per minute emptied chamber pots at one KVIP.*
KVIPs are proving unsuitable as public conveniences as they ®ll up within a week
of emptying and, thus, cannot be used to render the waste harmless through com-
posting. Many are being converted to simple pits with a provision for desludging,
while some disused KVIPs were being used as disposal points for the emptying of
chamber pots.
In the last few years, charges have been introduced for the use of public latrines as
part of a privatization package. There has been a considerable improvement in con-
ditions within the latrines in Kumasi (Christie and Harris, 1992), and in services pro-
vided as a result of this, e.g. free sections for children, although other parts of the
private operation of sanitation have been more problematic. Demand for sanitation
is still high, especially in peripheral areas. At Anloga, Kumasi, the demand is evident
*The stench from such latrines is particularly o�ensive and, under moderate wind conditions, could besmelt up to 400 metres away!
Housing Supply in Ghana 269
from the high patronage at the private enterprise wooden latrines built over the Sisai
stream. Charges are similar to the regular public latrines (C10 per visit), but excre-
ment simply drops into the stream in which children can be found bathing and,
further downstream, some poorer members of the unsuspecting population at Atonsu
obtain drinking water from the same stream. Gari (a `cereal' made from grated cas-
sava) is also prepared by groups of women some 30 m from two of the latrines. This
is particularly hazardous given that gari is a ®nished product, ready to eat once it
leaves the banks of the Sisai stream.*
The monthly fee charged by conservancy contractors for servicing bucket latrines
is C2000 in Accra; C3000 in Kumasi. The fee charged by conservancy contractors for
desludging aqua-privies in Kumasi is C2000 per session, but the e�uent is simply
allowed to spill out around the back of the latrine.
In some towns, landlords have been ordered to provide higher levels of servicing
to their tenants, but with no parallel measures adopted to increase their incomes
from renting. The following example, from Sunyani (near Berekum), illustrates this
situation:
The Sunyani District Assembly has given all landlords at Sunyani up to the end of this year to provideplaces of convenience in their houses or face prosecution at the law courts. The assembly, which held itssecond ordinary meeting of the year at Sunyani on Thursday, said the facilities should either be KVIPs orwater closets . . .The house noted that the public place of convenience in the town . . .cannot cope with [the]growing population and the best solution is for every household (sic) to provide its own facility. (DailyGraphic, 13 July 1993: 3)
An insigni®cant proportion of Accra and Kumasi houses, and none of those in
Berekum, are connected to main sewers. Furthermore, though there have been sug-
gestions that water-borne systems should be ®tted in both large cities, there is insu�-
cient water to service them. Perversely, water closets in use in Ghana tend to have
large cisterns which use more than 12 litres of water at each ¯ush. All WCs which
exist outside the very limited areas served by sewers, are connected to on-site septic
tanks and soak-away pits.
1.2.5.3. Refuse disposal. Under the `pay-as-you-dump' refuse levy system which wasadopted by the Accra Metropolitan Authority on 1 July 1993 (Daily Graphic, 13 July1993: 3), each trip to the city's communal refuse skips is intended to attract a fee ofC20. With refuse workers reporting reductions in the volumes of refuse deposited inthe community skips, it is probable that there has been an increase in ¯y-tipping bychildren (who are traditionally responsible for transporting refuse to approved dumpsites). While the move towards cost recovery is undeniably laudable, this mode oflevy collection is already encouraging people to store uncovered domestic refuse forlonger periods. A levy that is subsumed within property rates would not penalize themost e�cient, would not encourage the deliberate accumulation of domestic refuse,and would be more di�cult to evade.
In most Ghanaian settlements known to the authors, domestic refuse is generally
uncovered, ¯y-tipping is common and organized collection from public disposal sites
is infrequent. Uncovered drains tend to be used for waste disposal. During a 10 min
*The potential for food carrying health hazards from one site to the whole city is considerable. See alsoHellen et al. (1991).
270 Progress in Planning
observation of Berekum refuse tip (an organized open type) beginning at 6.15 a.m.,
102 tippers visited it, of whom 80 were children. At the other end of the scale, in
some high-cost parts of Accra, private refuse removal contractors are charging
C2000 a month for a twice-weekly donkey-cart service which is proving pro®table
even at four houses per hectare.
1.2.5.4. Storm and waste water drainage. Apart from along the few major streets anda minority of residential roads, planned drainage is virtually absent in Kumasi, Bere-kum and Accra. Where drains exist, they are exposed and tend to be used for the dis-posal of litter and, thus, become blocked. Erosion of roads and pathways is a seriousproblem for access and safety; also it leads, in turn, to weakened house foundations.Standing water in blocked drainage ditches and eroded holes allows the breeding ofmosquitos and other disease vectors.
1.2.5.5. Electricity. As is the case with water, the supply of electrical power is notentirely satisfactory, though it is perhaps the more satisfactory of the two; indeedmost houses have a supply. In certain parts of Kumasi (particularly those close tothe industrial area), supplies are more erratic than average and can be lost in windyconditions. At Dichemso, for example, residents experience power failures almost ona daily basis: supply is typically lost from 7 p.m. to 9 or 10 p.m.
With both water and electricity, prospective customers are required to pay the full
cost of connecting their homes from the nearest mains/sub-mains. Major faults are
usually attended to within 48 h.
1.2.6. The regulatory system
The Town and Country Planning Ordinance (Cap 84 of 1945) is still the principle
planning law guiding physical development in urban Ghana. It has been amended by
The Local Government Law (PNDC Law 207 of 1988) and this has in turn been
superseded by the Local Government Act (Act 462 of 1993). The Local Planning
Authority (that is the local District Assembly) has the power to make plans, regulate
land uses, receive applications for permission to develop land and erect buildings,
remove structures which contravene regulations, and levy ®nes for people who con-
travene the laws. As with so many planning codes, the Ghanaian one is powerful to
control, but not capable of enabling, housing investment.
Despite several e�orts to introduce revised building regulations which would be
relevant throughout the country in urban areasÐnotably the Draft Ghana Building
Code in 5 parts (BRRI, 1979)Ðthe old codes still apply and are speci®c to cities.
Building in Kumasi, for example, is still regulated by the Public Health Board
Regulations of 1939 and the Kumasi Outline Town Planning Scheme, 1945 (Fry and
Drew, 1945). In them, minimum sites for plots are set at 232 m2 in central Kumasi,
335 m2 in the new areas being developed then as island plots (i.e. with no back
lanes), and 446 m2 (say 22.3� 20 m) elsewhere. Maximum plot coverage is a half
(two-thirds on the `island' plots). In the Kumasi Outline Town Planning Scheme,
most of the city was included in an area designated `B' in which plots should be no
Housing Supply in Ghana 271
smaller than 450 m2 with a maximum coverage of 30%. The outlying villages could
be developed with plots of 370 m2 and 60% maximum coverage.
In reality, it seems that one-third coverage is used as a rule of thumb by building
inspectors and planning o�cers. Covered space is de®ned to include enclosed open
spaces such as courtyards so that compound houses do not qualify and are, there-
fore, illegal. However, enforcement tends to be more subjective. In Accra, greater
care is taken over the scrutiny of drawings for new housing than in Kumasi or
Berekum. However, once underway, construction tends not to be scrutinized and
only the worst practices and most unsafe structural arrangements are commented
upon by the building inspectors. Impressionistic evidence points to a mixture of petty
corruption and incompetence as the reasons for this poor performance by the build-
ing inspectorate. In areas where compounds are common, the Statutory Planning
Committee tends to turn a blind eye to new compound development. O�cers in the
Kumasi Metropolitan Planning O�ce told us that they did not approve of com-
poundsÐnot only on the grounds of plot coverage, but also because they are not in
favour of multi-occupation. In the current circumstances of great need and within
Ghanaian culture, this seems to be a retrogressive attitude, but one that is all too
common in planning authorities in Africa.
A potentially serious issue arises for the potential builder who wishes to proceed in
advance of gaining land title, a process which takes many years to ®nally accomplish.
A development permit cannot be obtained until land title is secured and the lack of
this permit causes the full weight of the enforcement procedure to descend on the
`culprit'. The structure receives a visit from the building inspectors who paint `Stop
work immediately, by order' or `Produce permit' in red on the uncompleted struc-
ture. At this point, the owner is expected to `dash them small' (to give a payment)
before construction can proceed.
Thus the regulatory system, as currently practised, contains many of the problems
recognized as bottlenecks to housing supply: it is inhospitable to the housing that
most people can a�ord to own, it is not transparent, it depends on ful®lling subjec-
tive criteria (side-payments, in¯uence, etc.), and it imposes costs on the process either
through delays or through side-payments.
1.2.7. The need to increase supply
The Global Strategy for Shelter to the Year 2000 (UNCHS, 1990) calls for a policy
framework in each country which is capable of enabling the provision of housing for
all. This involves scaling up the supply mechanisms so that they eradicate the serious
shortages which exist and supply housing for the newly independent households
being formed through marriage, and the new population being born in, and mi-
grating to, urban areas. Ghana's population is estimated at 16.4 million (Population
Reference Bureau: PRB, 1993) with growth forecasts for the rest of the century in
the region of 3.1% per annum.
In recent research by the authors, the usefulness of the compound for low income
households (Korboe, 1993a), and the issue of family houses (Amole et al., 1993;
272 Progress in Planning
Korboe, 1992a) have been discussed. Each has called for a re-examination of the
compound form as it possesses much of worth in a society where most households
cannot a�ord a whole house (be it compound or tiny bungalow), and where all
houses are liable to be inherited by a group of people holding them in common but
having rights of use of parts of them.
The housing supply issue for Kumasi, and much of Sub-Saharan Africa, is further
complicated by the fact that housing is generally not sold (see Tipple, 1984). When
an individual begins to build, he/she is not starting a project which can be aborted if
the money is required for an emergency or if the project becomes too expensive.*
The builder is permanently committed to the house and so are his/her heirs.{Elsewhere, the motivations behind house building in urban Ghana have been
suggested to be mainly concerned with status and security for old age (Tipple and
Willis, 1992a; Korboe, 1992b).
Who, then is supplying new housing or extensions? What are they building? Do
would-be house-owners have a di�cult time in assembling the necessary inputs and
succeeding in the supply process? What problems are they encountering? These and
other issues have been the basis for a survey of house-owners in three centres in
Ghana, carried out by the Centre for Architectural Research and Development
Overseas, University of Newcastle upon Tyne, and the Department of Housing and
Planning Research, University of Science and Technology, Kumasi, and sponsored
by the Leverhulme Trust. In it, we surveyed owners who have built since 1987
(referred to below as recent builders), owners of long standing who have extended
since 1987 (recent extenders), owners of long standing who have not extended since
1987 (non-recent extenders), and renters (Table 2).
The rather sparse literature on housing supply suggests that it is more di�cult in
the late 1980s and early 1990s than it was in the 1960s and 1970s (Gilbert, 1993;
Aina, 1988; Amis, 1988; Tipple and Willis, 1992b; Diko and Tipple, 1992; Korboe,
1993a; Wikan, 1990). Gone are the days of free land on the periphery of cities. Even
in Latin America, invasions resulting in self-improving neighbourhoods (Turner,
1976) are a thing of the past. Indeed, Gilbert (1993) found that peripheral squatters
in his Latin American sample now tend to be those households who cannot a�ord to
rent rooms in serviced neighbourhoods and are forced into shack ownership. The
even more sparse literature on extension activity gives few leads as to who extends
their housing rather than moving or building again.
As squatting is not an option in Ghana (Tipple, 1984; Konadu-Agyemang, 1991;
Korboe, 1992b), we would expect recent builders to be better o� than recent exten-
ders and non-recent extenders (both longer term owners) and much better o� than
renters. Intuitively, we would expect recent builders to be building better accommo-
dation for themselves than they currently occupy, but we could not suggest whether
they would be better or worse housed than renters before they move to the new
*Which, incidentally, is one of the pillars built by John Turner (1976) upon which sites and servicesschemes stand.
{There are a few developers who build houses to sell while incomplete, and a small group of developersbuilding for sale. However, the majority of Ghanaians have their own housing built through local con-tractors and will only sell in absolute extremis.
Housing Supply in Ghana 273
house. From observation of Kumasi, we would expect them to take many years to
complete the house, to build villas rather than compounds, and for those who build
compounds to have lower incomes and lower quality ®nal accommodation (in terms
of number of rooms available to their own households, and access to services) than
builders of other house types.
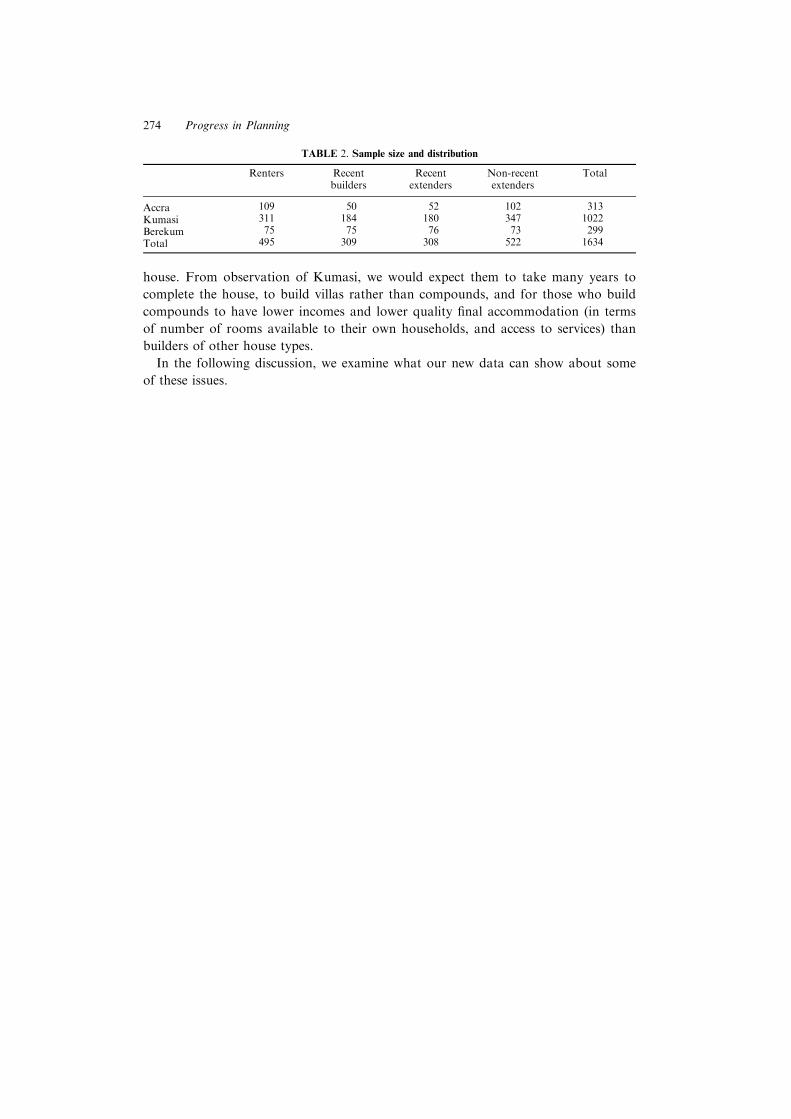
In the following discussion, we examine what our new data can show about some
of these issues.
TABLE 2. Sample size and distribution
Renters Recentbuilders
Recentextenders
Non-recentextenders
Total
Accra 109 50 52 102 313
Kumasi 311 184 180 347 1022
Berekum 75 75 76 73 299
Total 495 309 308 522 1634
274 Progress in Planning
CHAPTER 2
Who is supplying
In examining who the suppliers of houses are currently, it might be useful ®rst to
clarify who the non-suppliers are; who it is who have never become owners, who are
not making the decision to become owners or, if they own already, to extend. These
are the renters.
2.1. THE NON-SUPPLIERS : RENTERS
From earlier work on Kumasi (e.g. Malpezzi et al., 1990; Tipple and Willis, 1991),
we would expect that, in comparison with owners, renters would have smaller house-
holds with lower household income,* but higher per capita income. As we will see in
the analysis below, this is found to be the case. Renter households have a mean of
3.7 persons in Accra, 5.0 in Kumasi and 4.4 in Berekum. These small households
demonstrate that renters tend to be in an earlier stage of their lives than average, es-
pecially in Accra. However, as the household heads are in younger adulthood than
owners, it might be expected that they would have more children under 16 per adult
than owners. In fact, our sample have fewer, particularly in Accra where they have a
mean of only 1.5 children per renter household and only 0.6 children per adult.{As expected from earlier work, our sampled renters mostly occupy only one room
per household, typically in a multihabited house (usually in compound form) in
which they share services with all households.{ Their means are between 1.13 and
1.37 rooms (all have a median of 1 room) and their mean household occupancy rates
exceed three people per room in each location (median occupancy rates are between
three and four people per room), Kumasi being particularly crowded. We would also
expect that renters in our sample would pay relatively little in rent. As can be seen in
Table 3, despite the apparent collapse of the rent control regime operated until the
late 1980s, monthly rents are very low at only C1900 (£1.9) in Accra, C2400 (£2.4) in
Kumasi, and C1400 (£1.4) in Berekum. Rents per room are also very small (less than
C1500±£1.50 per month).
*As explained later, expenditure is used as a proxy for income. In this paper, whenever reference is madeto income, the data are from the questions on expenditure.
{Grown-up children will tend to stay in their parents' house when it is di�cult to ®nd suitably pricedalternative accommodation. When large rent advances are demanded, the process is even more con-strained.
{Of the 310 renters sampled in the three cities, 50% share and 40% have no access to a kitchen.Equivalent ®gures for bathroom (87% and 5%), toilet (55% and 39%) and water supply (50% and45%) demonstrate the rarity of exclusive servicing for renters.
Housing Supply in Ghana 275
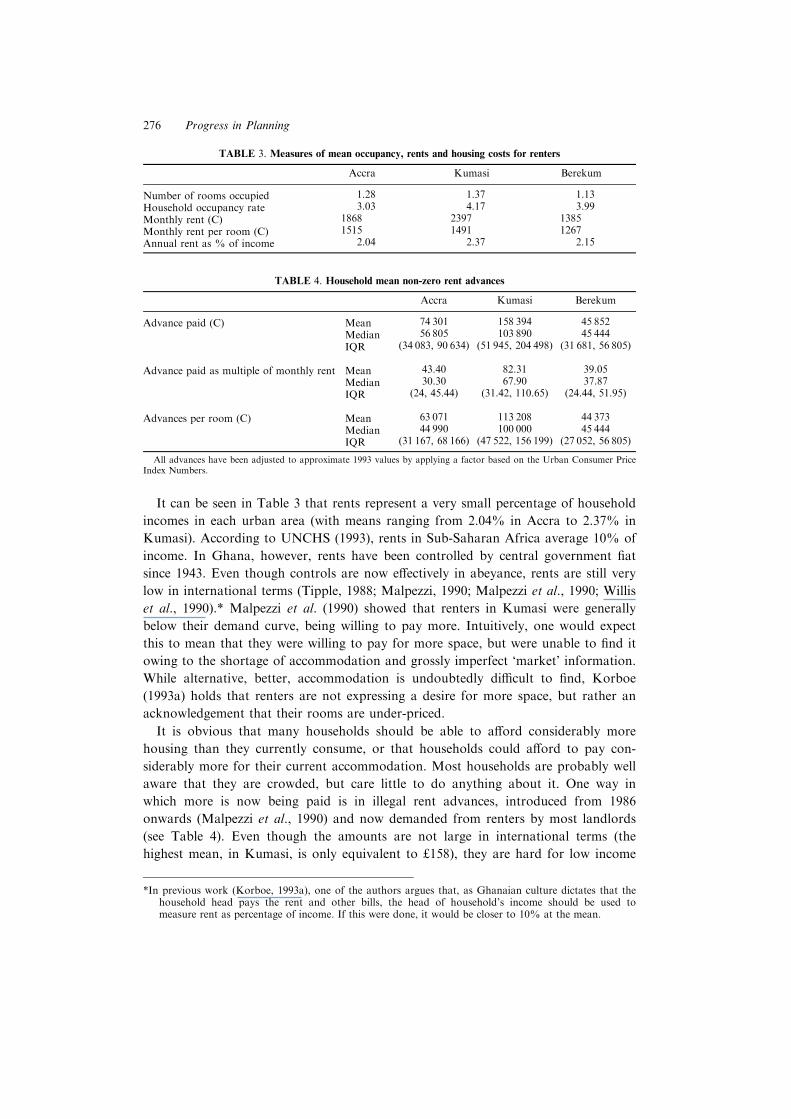
It can be seen in Table 3 that rents represent a very small percentage of household
incomes in each urban area (with means ranging from 2.04% in Accra to 2.37% in
Kumasi). According to UNCHS (1993), rents in Sub-Saharan Africa average 10% of
income. In Ghana, however, rents have been controlled by central government ®at
since 1943. Even though controls are now e�ectively in abeyance, rents are still very
low in international terms (Tipple, 1988; Malpezzi, 1990; Malpezzi et al., 1990; Willis
et al., 1990).* Malpezzi et al. (1990) showed that renters in Kumasi were generally
below their demand curve, being willing to pay more. Intuitively, one would expect
this to mean that they were willing to pay for more space, but were unable to ®nd it
owing to the shortage of accommodation and grossly imperfect `market' information.
While alternative, better, accommodation is undoubtedly di�cult to ®nd, Korboe
(1993a) holds that renters are not expressing a desire for more space, but rather an
acknowledgement that their rooms are under-priced.
It is obvious that many households should be able to a�ord considerably more
housing than they currently consume, or that households could a�ord to pay con-
siderably more for their current accommodation. Most households are probably well
aware that they are crowded, but care little to do anything about it. One way in
which more is now being paid is in illegal rent advances, introduced from 1986
onwards (Malpezzi et al., 1990) and now demanded from renters by most landlords
(see Table 4). Even though the amounts are not large in international terms (the
highest mean, in Kumasi, is only equivalent to £158), they are hard for low income
TABLE 3. Measures of mean occupancy, rents and housing costs for renters
Accra Kumasi Berekum
Number of rooms occupied 1.28 1.37 1.13
Household occupancy rate 3.03 4.17 3.99
Monthly rent (C) 1868 2397 1385
Monthly rent per room (C) 1515 1491 1267
Annual rent as % of income 2.04 2.37 2.15
TABLE 4. Household mean non-zero rent advances
Accra Kumasi Berekum
Advance paid (C) Mean 74 301 158 394 45 852
Median 56 805 103 890 45 444
IQR (34 083, 90 634) (51 945, 204 498) (31 681, 56 805)
Advance paid as multiple of monthly rent Mean 43.40 82.31 39.05
Median 30.30 67.90 37.87
IQR (24, 45.44) (31.42, 110.65) (24.44, 51.95)
Advances per room (C) Mean 63 071 113 208 44 373
Median 44 990 100 000 45 444
IQR (31 167, 68 166) (47 522, 156 199) (27 052, 56 805)
All advances have been adjusted to approximate 1993 values by applying a factor based on the Urban Consumer PriceIndex Numbers.
*In previous work (Korboe, 1993a), one of the authors argues that, as Ghanaian culture dictates that thehousehold head pays the rent and other bills, the head of household's income should be used tomeasure rent as percentage of income. If this were done, it would be closer to 10% at the mean.
276 Progress in Planning
households to gather together. In addition, they are paid not only by movers, but
also by sitting tenants in place of monthly rents. Many employees are now making
their contribution towards housing as periodic payments to cope with advances
rather than through monthly amounts.
Advance rent payments have been seen by Malpezzi et al. (1990) and Willis et al.
(1990) as a means of increasing the net present value of the very low rents in a period
of high in¯ation at a time when public opinion is unready to accept substantial
increases in rent to bring them closer to a market value. The receipt of advance rent for
several rooms by an owner can raise su�cient capital for adding to or improving on
servicing (e.g. a water supply) or the addition of a room. Korboe (1993a) found that
some renters volunteered rent advances in order to assist the landlords with repairs or
improvements. None of these behaviour patterns suggests rapacious landlords exploit-
ing powerless tenants, but there are undoubtedly some occurrences of this.
The percentage of renter households in our sample who actually paid advances
varies from 61% in Kumasi to 76% in Berekum. It can be seen from Table 4 that
non-zero advances vary from C46 000 or 39 months' rent at the mean in Berekum to
C158 000 and 82 months' rent in Kumasi.
We ®nd mean rents in Accra (see Table 3) to be 78% of those in Kumasi, while
rents per room are only slightly higher (102% of Kumasi values). Advances, which
are a sign of market pressure being applied (albeit imperfectly) to controlled rents,
are, however, considerably lower in Accra. Mean values for total advances, advances
per room, and advances as multiples of monthly rent in Accra are all between 50%
and 70% of those in Kumasi. These low levels of rent and advances in Accra are
counter-intuitive. Hearsay and frequent press reports in Ghana tell us that housing is
particularly di�cult to obtain in Accra, landlords are especially grasping, and
advances are set at impossibly high levels. However, our data give little support to
these assertions except in the narrow band at the top end of the market which pull
the mean value up 30% above the median.*
Why should rent advances be lower in Accra than in Kumasi? Is it a function of
the nearness of the seat of government acting as a check on illegal advances being
charged? It could be, but this is highly unlikely. Is it that the samples are very di�er-
ent? Our data on income appear to suggest similar samples. Is it that owners are
more generous with their tenants, waiving increases or reducing demands out of eth-
nic fellow-feeling; after all 26% of tenants in the Accra sample did not pay advances?
This idea is supported by Korboe (1992b, 1993a), who argues that the provision of
rental accommodation is often not related to pro®t-making. Thus, economic model-
ling is unlikely to prove reliable in predicting rental behaviour. Generosity would,
perhaps, be expected to be more in¯uential in Kumasi, where the Akan culture is
more homogeneous, than in Accra. The counter-argument would be that Kumasi has
always been a centre for cut-throat trading (kalabule) and, as renters su�er higher
levels of crowding there than in Accra, the bid price for accommodation is likely to
*As with so much hearsay evidence in Ghana, even among some academics, the band of opportunity inwhich the educated elite operate does not necessarily re¯ect reality for the poorer sections of the popu-lation who predominate.
Housing Supply in Ghana 277
be higher. Whatever reasons can be suggested, the conclusion is inescapable: rent
advances payable in new housing occupied by low income households in Accra are
lower than those in comparable areas in Kumasi.
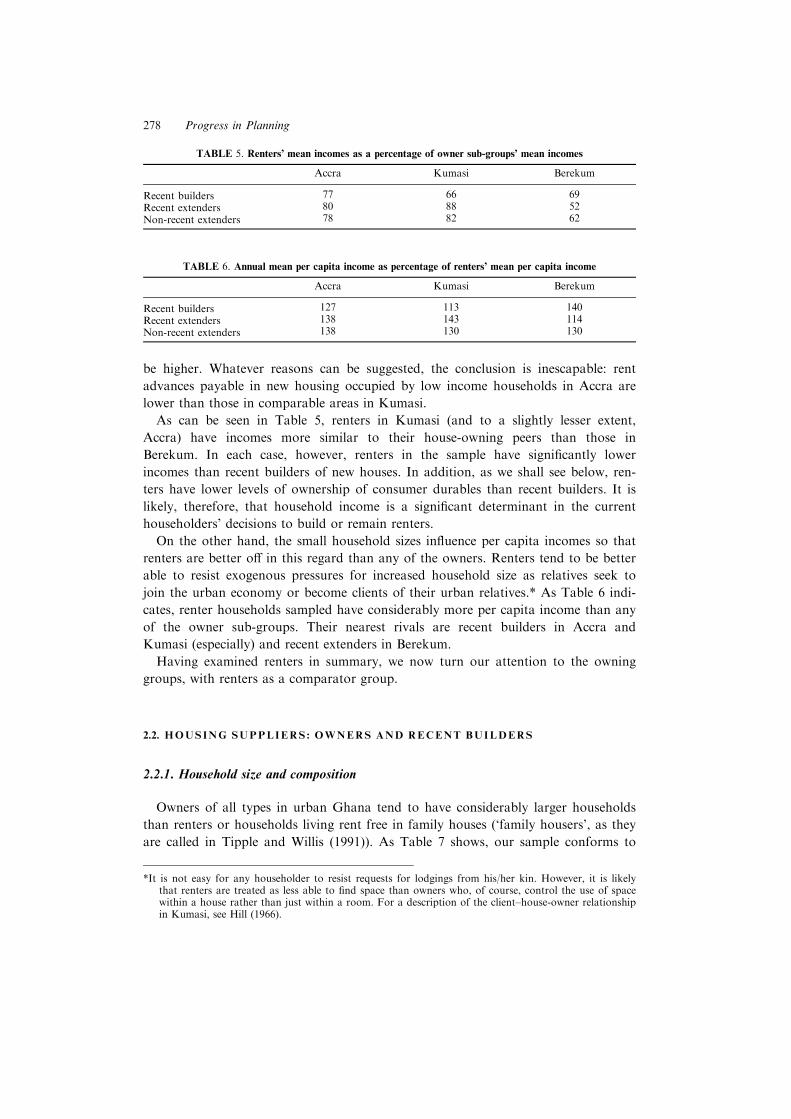
As can be seen in Table 5, renters in Kumasi (and to a slightly lesser extent,
Accra) have incomes more similar to their house-owning peers than those in
Berekum. In each case, however, renters in the sample have signi®cantly lower
incomes than recent builders of new houses. In addition, as we shall see below, ren-
ters have lower levels of ownership of consumer durables than recent builders. It is
likely, therefore, that household income is a signi®cant determinant in the current
householders' decisions to build or remain renters.
On the other hand, the small household sizes in¯uence per capita incomes so that
renters are better o� in this regard than any of the owners. Renters tend to be better
able to resist exogenous pressures for increased household size as relatives seek to
join the urban economy or become clients of their urban relatives.* As Table 6 indi-
cates, renter households sampled have considerably more per capita income than any
of the owner sub-groups. Their nearest rivals are recent builders in Accra and
Kumasi (especially) and recent extenders in Berekum.
Having examined renters in summary, we now turn our attention to the owning
groups, with renters as a comparator group.
2.2. HOUSING SUPPLIERS : OWNERS AND RECENT BUILDERS
2.2.1. Household size and composition
Owners of all types in urban Ghana tend to have considerably larger households
than renters or households living rent free in family houses (`family housers', as they
are called in Tipple and Willis (1991)). As Table 7 shows, our sample conforms to
TABLE 5. Renters' mean incomes as a percentage of owner sub-groups' mean incomes
Accra Kumasi Berekum
Recent builders 77 66 69
Recent extenders 80 88 52
Non-recent extenders 78 82 62
TABLE 6. Annual mean per capita income as percentage of renters' mean per capita income
Accra Kumasi Berekum
Recent builders 127 113 140
Recent extenders 138 143 114
Non-recent extenders 138 130 130
*It is not easy for any householder to resist requests for lodgings from his/her kin. However, it is likelythat renters are treated as less able to ®nd space than owners who, of course, control the use of spacewithin a house rather than just within a room. For a description of the client±house-owner relationshipin Kumasi, see Hill (1966).
278 Progress in Planning
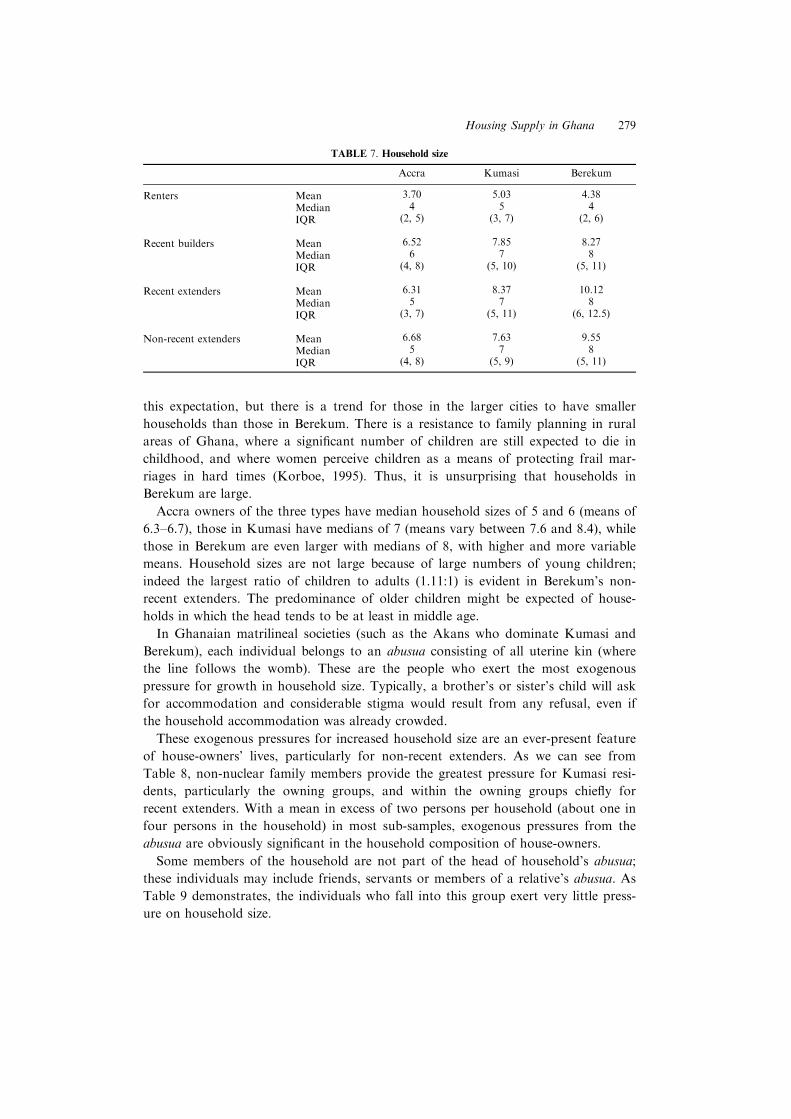
this expectation, but there is a trend for those in the larger cities to have smaller
households than those in Berekum. There is a resistance to family planning in rural
areas of Ghana, where a signi®cant number of children are still expected to die in
childhood, and where women perceive children as a means of protecting frail mar-
riages in hard times (Korboe, 1995). Thus, it is unsurprising that households in
Berekum are large.
Accra owners of the three types have median household sizes of 5 and 6 (means of
6.3±6.7), those in Kumasi have medians of 7 (means vary between 7.6 and 8.4), while
those in Berekum are even larger with medians of 8, with higher and more variable
means. Household sizes are not large because of large numbers of young children;
indeed the largest ratio of children to adults (1.11:1) is evident in Berekum's non-
recent extenders. The predominance of older children might be expected of house-
holds in which the head tends to be at least in middle age.
In Ghanaian matrilineal societies (such as the Akans who dominate Kumasi and
Berekum), each individual belongs to an abusua consisting of all uterine kin (where
the line follows the womb). These are the people who exert the most exogenous
pressure for growth in household size. Typically, a brother's or sister's child will ask
for accommodation and considerable stigma would result from any refusal, even if
the household accommodation was already crowded.
These exogenous pressures for increased household size are an ever-present feature
of house-owners' lives, particularly for non-recent extenders. As we can see from
Table 8, non-nuclear family members provide the greatest pressure for Kumasi resi-
dents, particularly the owning groups, and within the owning groups chie¯y for
recent extenders. With a mean in excess of two persons per household (about one in
four persons in the household) in most sub-samples, exogenous pressures from the
abusua are obviously signi®cant in the household composition of house-owners.
Some members of the household are not part of the head of household's abusua;
these individuals may include friends, servants or members of a relative's abusua. As
Table 9 demonstrates, the individuals who fall into this group exert very little press-
ure on household size.
TABLE 7. Household size
Accra Kumasi Berekum
Renters Mean 3.70 5.03 4.38
Median 4 5 4
IQR (2, 5) (3, 7) (2, 6)
Recent builders Mean 6.52 7.85 8.27
Median 6 7 8
IQR (4, 8) (5, 10) (5, 11)
Recent extenders Mean 6.31 8.37 10.12
Median 5 7 8
IQR (3, 7) (5, 11) (6, 12.5)
Non-recent extenders Mean 6.68 7.63 9.55
Median 5 7 8
IQR (4, 8) (5, 9) (5, 11)
Housing Supply in Ghana 279
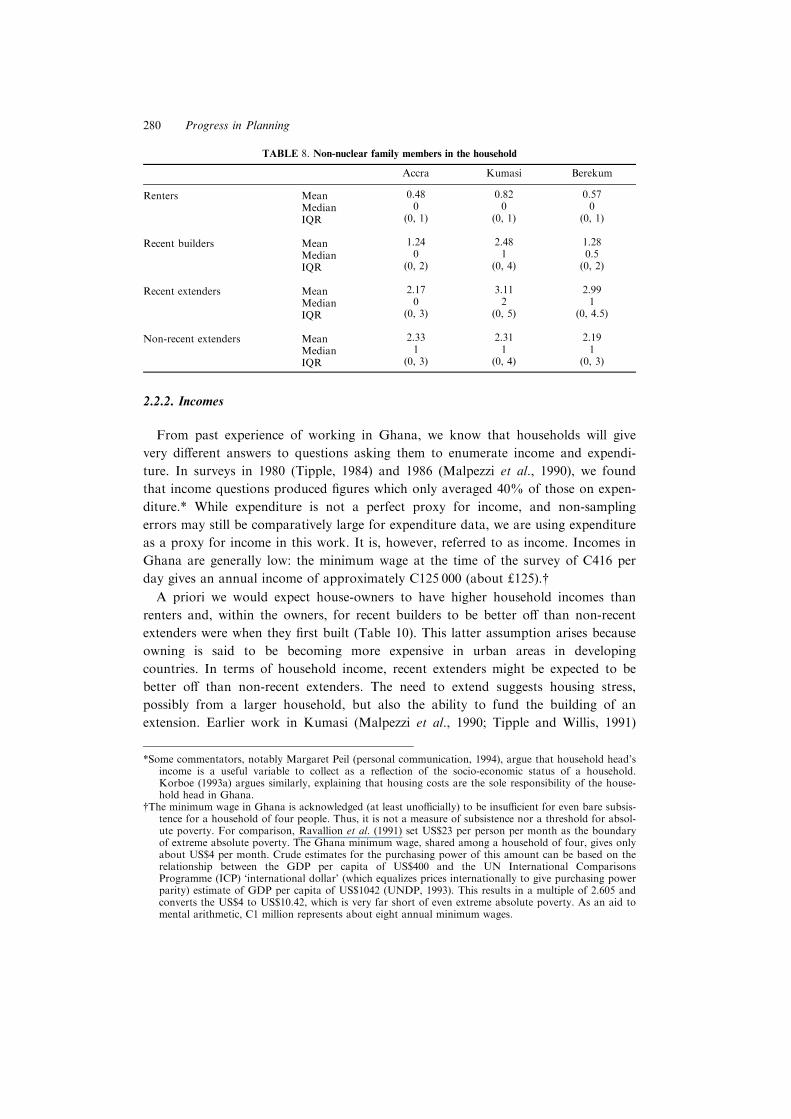
2.2.2. Incomes
From past experience of working in Ghana, we know that households will give
very di�erent answers to questions asking them to enumerate income and expendi-
ture. In surveys in 1980 (Tipple, 1984) and 1986 (Malpezzi et al., 1990), we found
that income questions produced ®gures which only averaged 40% of those on expen-
diture.* While expenditure is not a perfect proxy for income, and non-sampling
errors may still be comparatively large for expenditure data, we are using expenditure
as a proxy for income in this work. It is, however, referred to as income. Incomes in
Ghana are generally low: the minimum wage at the time of the survey of C416 per
day gives an annual income of approximately C125 000 (about £125).{A priori we would expect house-owners to have higher household incomes than
renters and, within the owners, for recent builders to be better o� than non-recent
extenders were when they ®rst built (Table 10). This latter assumption arises because
owning is said to be becoming more expensive in urban areas in developing
countries. In terms of household income, recent extenders might be expected to be
better o� than non-recent extenders. The need to extend suggests housing stress,
possibly from a larger household, but also the ability to fund the building of an
extension. Earlier work in Kumasi (Malpezzi et al., 1990; Tipple and Willis, 1991)
TABLE 8. Non-nuclear family members in the household
Accra Kumasi Berekum
Renters Mean 0.48 0.82 0.57
Median 0 0 0
IQR (0, 1) (0, 1) (0, 1)
Recent builders Mean 1.24 2.48 1.28
Median 0 1 0.5
IQR (0, 2) (0, 4) (0, 2)
Recent extenders Mean 2.17 3.11 2.99
Median 0 2 1
IQR (0, 3) (0, 5) (0, 4.5)
Non-recent extenders Mean 2.33 2.31 2.19
Median 1 1 1
IQR (0, 3) (0, 4) (0, 3)
*Some commentators, notably Margaret Peil (personal communication, 1994), argue that household head'sincome is a useful variable to collect as a re¯ection of the socio-economic status of a household.Korboe (1993a) argues similarly, explaining that housing costs are the sole responsibility of the house-hold head in Ghana.
{The minimum wage in Ghana is acknowledged (at least uno�cially) to be insu�cient for even bare subsis-tence for a household of four people. Thus, it is not a measure of subsistence nor a threshold for absol-ute poverty. For comparison, Ravallion et al. (1991) set US$23 per person per month as the boundaryof extreme absolute poverty. The Ghana minimum wage, shared among a household of four, gives onlyabout US$4 per month. Crude estimates for the purchasing power of this amount can be based on therelationship between the GDP per capita of US$400 and the UN International ComparisonsProgramme (ICP) `international dollar' (which equalizes prices internationally to give purchasing powerparity) estimate of GDP per capita of US$1042 (UNDP, 1993). This results in a multiple of 2.605 andconverts the US$4 to US$10.42, which is very far short of even extreme absolute poverty. As an aid tomental arithmetic, C1 million represents about eight annual minimum wages.
280 Progress in Planning
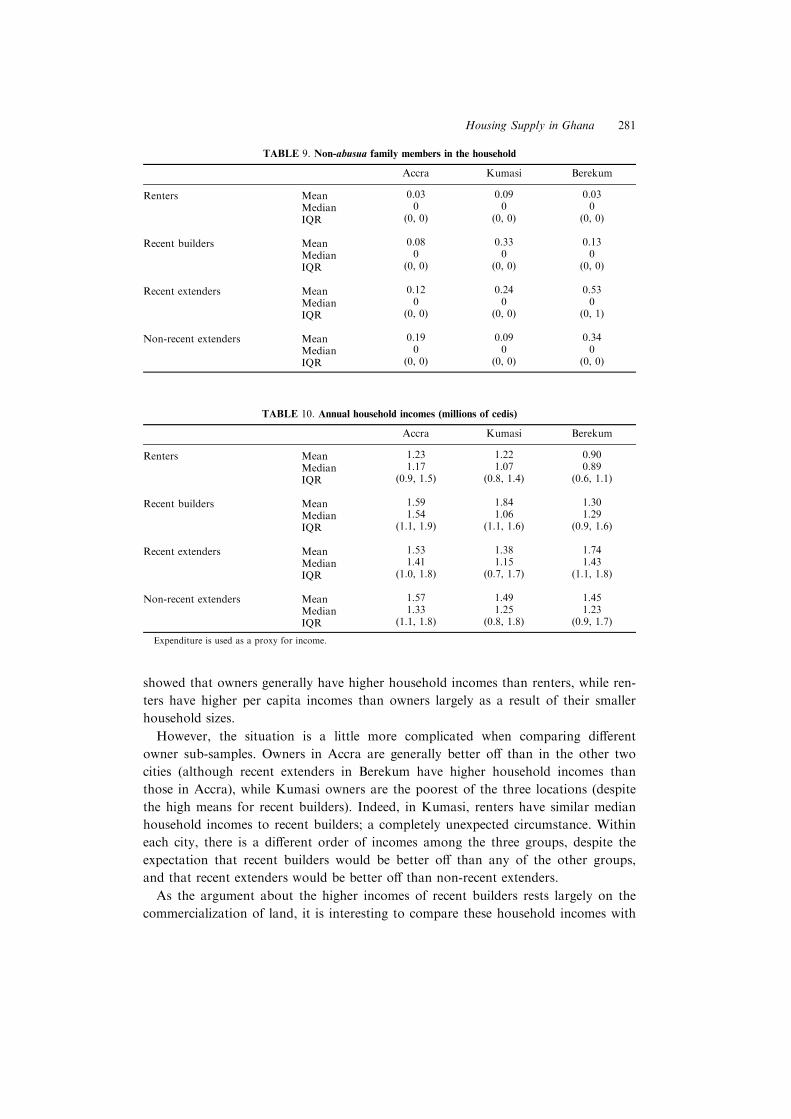
showed that owners generally have higher household incomes than renters, while ren-
ters have higher per capita incomes than owners largely as a result of their smaller
household sizes.
However, the situation is a little more complicated when comparing di�erent
owner sub-samples. Owners in Accra are generally better o� than in the other two
cities (although recent extenders in Berekum have higher household incomes than
those in Accra), while Kumasi owners are the poorest of the three locations (despite
the high means for recent builders). Indeed, in Kumasi, renters have similar median
household incomes to recent builders; a completely unexpected circumstance. Within
each city, there is a di�erent order of incomes among the three groups, despite the
expectation that recent builders would be better o� than any of the other groups,
and that recent extenders would be better o� than non-recent extenders.
As the argument about the higher incomes of recent builders rests largely on the
commercialization of land, it is interesting to compare these household incomes with
TABLE 10. Annual household incomes (millions of cedis)
Accra Kumasi Berekum
Renters Mean 1.23 1.22 0.90
Median 1.17 1.07 0.89
IQR (0.9, 1.5) (0.8, 1.4) (0.6, 1.1)
Recent builders Mean 1.59 1.84 1.30
Median 1.54 1.06 1.29
IQR (1.1, 1.9) (1.1, 1.6) (0.9, 1.6)
Recent extenders Mean 1.53 1.38 1.74
Median 1.41 1.15 1.43
IQR (1.0, 1.8) (0.7, 1.7) (1.1, 1.8)
Non-recent extenders Mean 1.57 1.49 1.45
Median 1.33 1.25 1.23
IQR (1.1, 1.8) (0.8, 1.8) (0.9, 1.7)
Expenditure is used as a proxy for income.
TABLE 9. Non-abusua family members in the household
Accra Kumasi Berekum
Renters Mean 0.03 0.09 0.03
Median 0 0 0
IQR (0, 0) (0, 0) (0, 0)
Recent builders Mean 0.08 0.33 0.13
Median 0 0 0
IQR (0, 0) (0, 0) (0, 0)
Recent extenders Mean 0.12 0.24 0.53
Median 0 0 0
IQR (0, 0) (0, 0) (0, 1)
Non-recent extenders Mean 0.19 0.09 0.34
Median 0 0 0
IQR (0, 0) (0, 0) (0, 0)
Housing Supply in Ghana 281
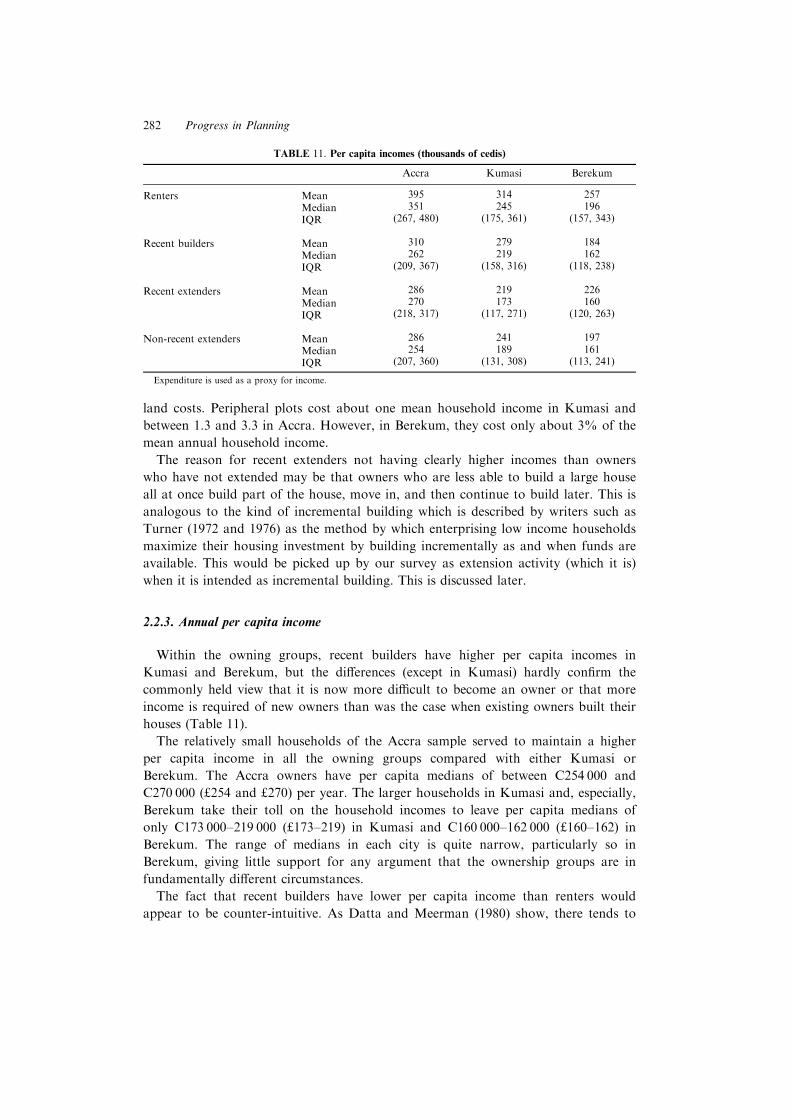
land costs. Peripheral plots cost about one mean household income in Kumasi and
between 1.3 and 3.3 in Accra. However, in Berekum, they cost only about 3% of the
mean annual household income.
The reason for recent extenders not having clearly higher incomes than owners
who have not extended may be that owners who are less able to build a large house
all at once build part of the house, move in, and then continue to build later. This is
analogous to the kind of incremental building which is described by writers such as
Turner (1972 and 1976) as the method by which enterprising low income households
maximize their housing investment by building incrementally as and when funds are
available. This would be picked up by our survey as extension activity (which it is)
when it is intended as incremental building. This is discussed later.
2.2.3. Annual per capita income
Within the owning groups, recent builders have higher per capita incomes in
Kumasi and Berekum, but the di�erences (except in Kumasi) hardly con®rm the
commonly held view that it is now more di�cult to become an owner or that more
income is required of new owners than was the case when existing owners built their
houses (Table 11).
The relatively small households of the Accra sample served to maintain a higher
per capita income in all the owning groups compared with either Kumasi or
Berekum. The Accra owners have per capita medians of between C254 000 and
C270 000 (£254 and £270) per year. The larger households in Kumasi and, especially,
Berekum take their toll on the household incomes to leave per capita medians of
only C173 000±219 000 (£173±219) in Kumasi and C160 000±162 000 (£160±162) in
Berekum. The range of medians in each city is quite narrow, particularly so in
Berekum, giving little support for any argument that the ownership groups are in
fundamentally di�erent circumstances.
The fact that recent builders have lower per capita income than renters would
appear to be counter-intuitive. As Datta and Meerman (1980) show, there tends to
TABLE 11. Per capita incomes (thousands of cedis)
Accra Kumasi Berekum
Renters Mean 395 314 257
Median 351 245 196
IQR (267, 480) (175, 361) (157, 343)
Recent builders Mean 310 279 184
Median 262 219 162
IQR (209, 367) (158, 316) (118, 238)
Recent extenders Mean 286 219 226
Median 270 173 160
IQR (218, 317) (117, 271) (120, 263)
Non-recent extenders Mean 286 241 197
Median 254 189 161
IQR (207, 360) (131, 308) (113, 241)
Expenditure is used as a proxy for income.
282 Progress in Planning
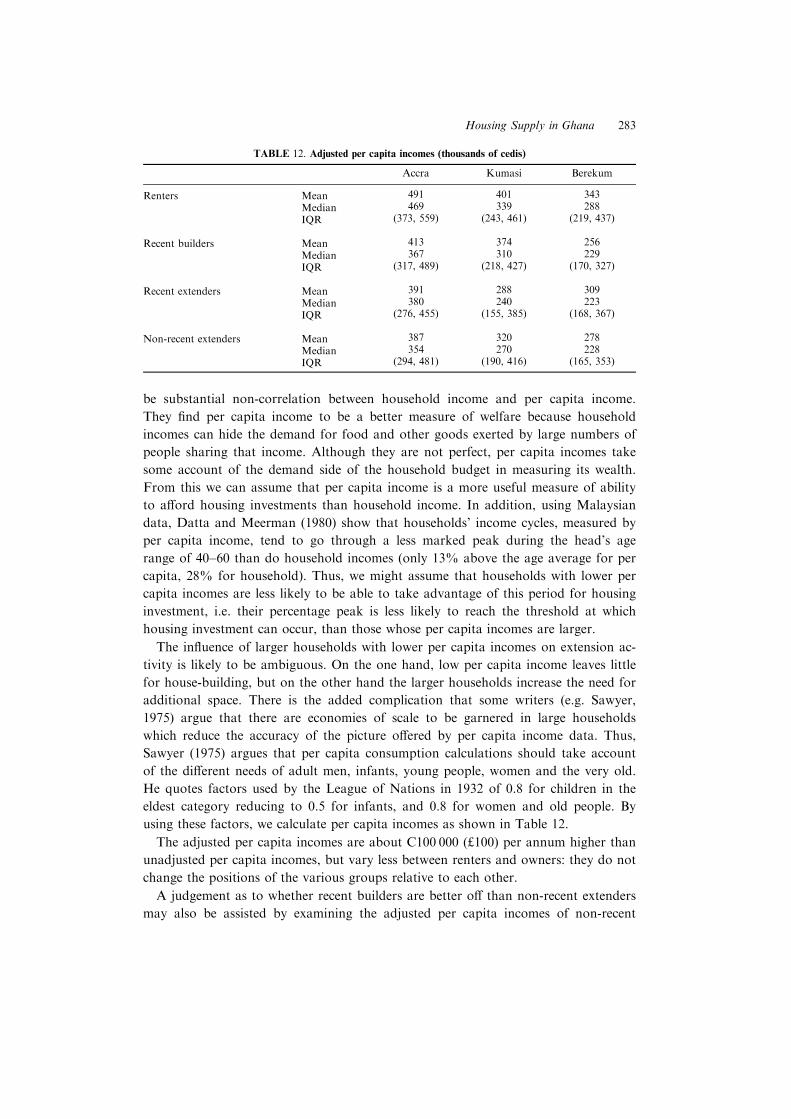
be substantial non-correlation between household income and per capita income.
They ®nd per capita income to be a better measure of welfare because household
incomes can hide the demand for food and other goods exerted by large numbers of
people sharing that income. Although they are not perfect, per capita incomes take
some account of the demand side of the household budget in measuring its wealth.
From this we can assume that per capita income is a more useful measure of ability
to a�ord housing investments than household income. In addition, using Malaysian
data, Datta and Meerman (1980) show that households' income cycles, measured by
per capita income, tend to go through a less marked peak during the head's age
range of 40±60 than do household incomes (only 13% above the age average for per
capita, 28% for household). Thus, we might assume that households with lower per
capita incomes are less likely to be able to take advantage of this period for housing
investment, i.e. their percentage peak is less likely to reach the threshold at which
housing investment can occur, than those whose per capita incomes are larger.
The in¯uence of larger households with lower per capita incomes on extension ac-
tivity is likely to be ambiguous. On the one hand, low per capita income leaves little
for house-building, but on the other hand the larger households increase the need for
additional space. There is the added complication that some writers (e.g. Sawyer,
1975) argue that there are economies of scale to be garnered in large households
which reduce the accuracy of the picture o�ered by per capita income data. Thus,
Sawyer (1975) argues that per capita consumption calculations should take account
of the di�erent needs of adult men, infants, young people, women and the very old.
He quotes factors used by the League of Nations in 1932 of 0.8 for children in the
eldest category reducing to 0.5 for infants, and 0.8 for women and old people. By
using these factors, we calculate per capita incomes as shown in Table 12.
The adjusted per capita incomes are about C100 000 (£100) per annum higher than
unadjusted per capita incomes, but vary less between renters and owners: they do not
change the positions of the various groups relative to each other.
A judgement as to whether recent builders are better o� than non-recent extenders
may also be assisted by examining the adjusted per capita incomes of non-recent
TABLE 12. Adjusted per capita incomes (thousands of cedis)
Accra Kumasi Berekum
Renters Mean 491 401 343
Median 469 339 288
IQR (373, 559) (243, 461) (219, 437)
Recent builders Mean 413 374 256
Median 367 310 229
IQR (317, 489) (218, 427) (170, 327)
Recent extenders Mean 391 288 309
Median 380 240 223
IQR (276, 455) (155, 385) (168, 367)
Non-recent extenders Mean 387 320 278
Median 354 270 228
IQR (294, 481) (190, 416) (165, 353)
Housing Supply in Ghana 283
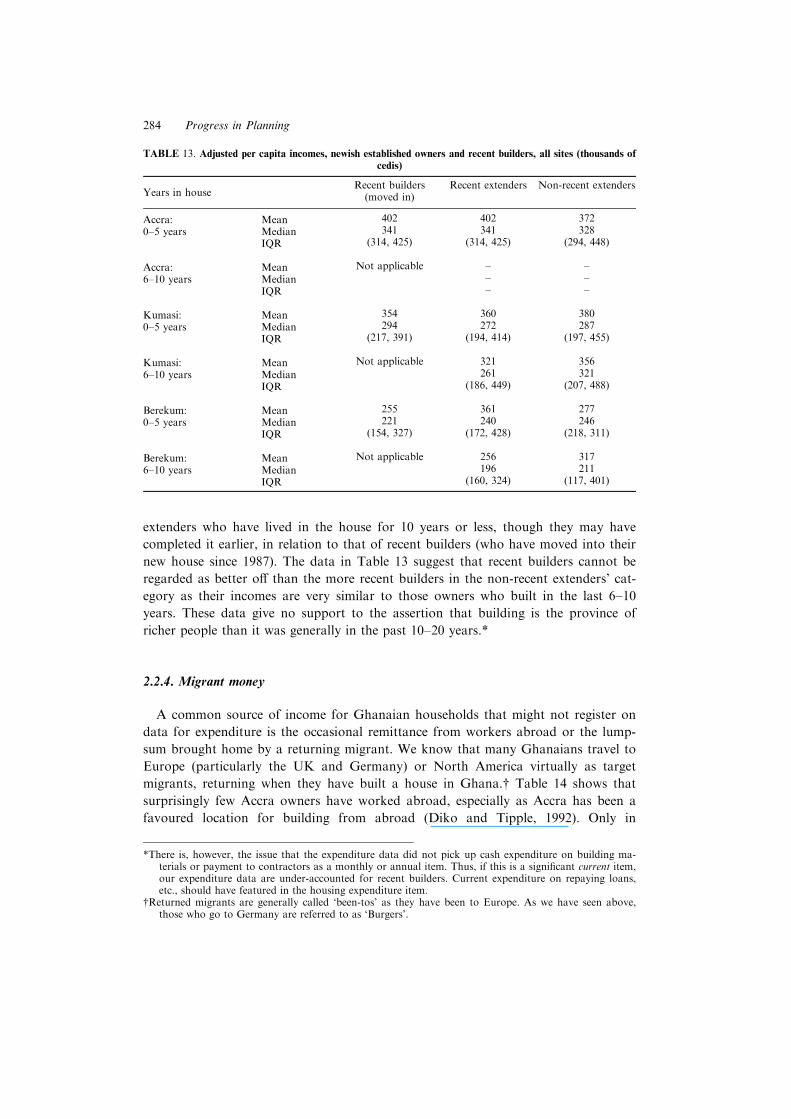
extenders who have lived in the house for 10 years or less, though they may have
completed it earlier, in relation to that of recent builders (who have moved into their
new house since 1987). The data in Table 13 suggest that recent builders cannot be
regarded as better o� than the more recent builders in the non-recent extenders' cat-
egory as their incomes are very similar to those owners who built in the last 6±10
years. These data give no support to the assertion that building is the province of
richer people than it was generally in the past 10±20 years.*
2.2.4. Migrant money
A common source of income for Ghanaian households that might not register on
data for expenditure is the occasional remittance from workers abroad or the lump-
sum brought home by a returning migrant. We know that many Ghanaians travel to
Europe (particularly the UK and Germany) or North America virtually as target
migrants, returning when they have built a house in Ghana.{ Table 14 shows that
surprisingly few Accra owners have worked abroad, especially as Accra has been a
favoured location for building from abroad (Diko and Tipple, 1992). Only in
TABLE 13. Adjusted per capita incomes, newish established owners and recent builders, all sites (thousands ofcedis)
Years in houseRecent builders
(moved in)Recent extenders Non-recent extenders
Accra: Mean 402 402 372
0±5 years Median 341 341 328
IQR (314, 425) (314, 425) (294, 448)
Accra: Mean Not applicable ± ±
6±10 years Median ± ±
IQR ± ±
Kumasi: Mean 354 360 380
0±5 years Median 294 272 287
IQR (217, 391) (194, 414) (197, 455)
Kumasi: Mean Not applicable 321 356
6±10 years Median 261 321
IQR (186, 449) (207, 488)
Berekum: Mean 255 361 277
0±5 years Median 221 240 246
IQR (154, 327) (172, 428) (218, 311)
Berekum: Mean Not applicable 256 317
6±10 years Median 196 211
IQR (160, 324) (117, 401)
*There is, however, the issue that the expenditure data did not pick up cash expenditure on building ma-terials or payment to contractors as a monthly or annual item. Thus, if this is a signi®cant current item,our expenditure data are under-accounted for recent builders. Current expenditure on repaying loans,etc., should have featured in the housing expenditure item.
{Returned migrants are generally called `been-tos' as they have been to Europe. As we have seen above,those who go to Germany are referred to as `Burgers'.
284 Progress in Planning
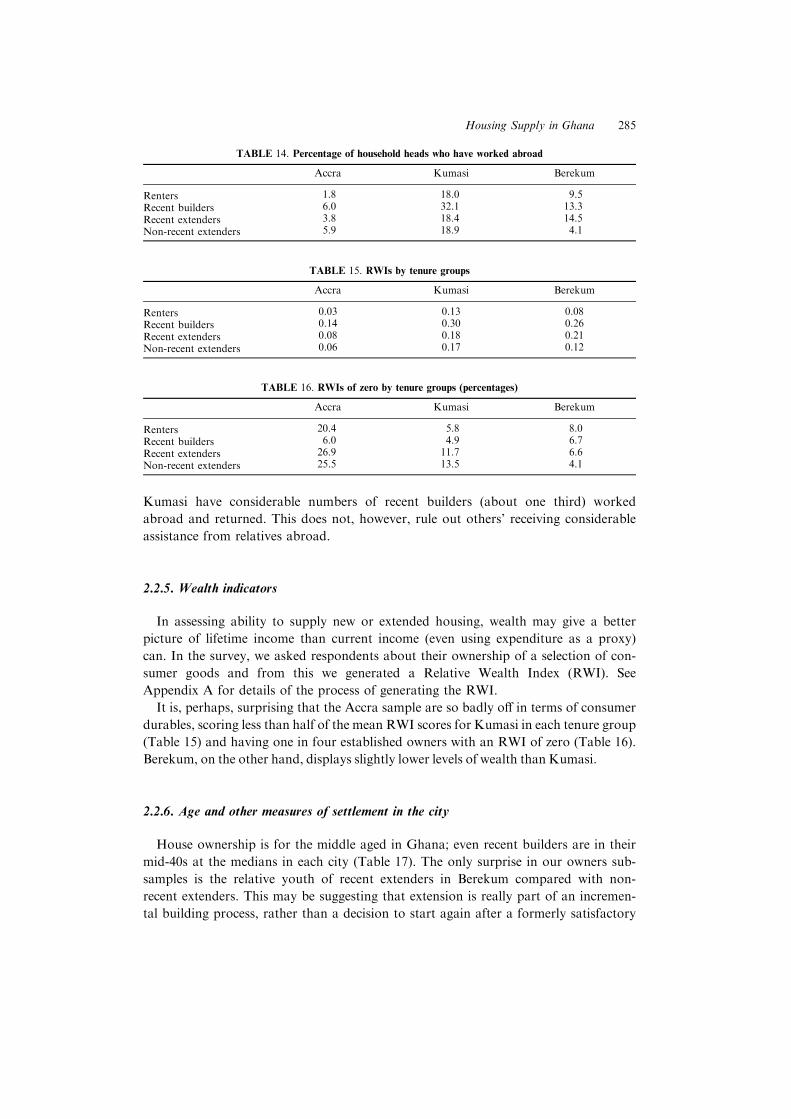
Kumasi have considerable numbers of recent builders (about one third) worked
abroad and returned. This does not, however, rule out others' receiving considerable
assistance from relatives abroad.
2.2.5. Wealth indicators
In assessing ability to supply new or extended housing, wealth may give a better
picture of lifetime income than current income (even using expenditure as a proxy)
can. In the survey, we asked respondents about their ownership of a selection of con-
sumer goods and from this we generated a Relative Wealth Index (RWI). See
Appendix A for details of the process of generating the RWI.
It is, perhaps, surprising that the Accra sample are so badly o� in terms of consumer
durables, scoring less than half of the mean RWI scores for Kumasi in each tenure group
(Table 15) and having one in four established owners with an RWI of zero (Table 16).
Berekum, on the other hand, displays slightly lower levels of wealth than Kumasi.
2.2.6. Age and other measures of settlement in the city
House ownership is for the middle aged in Ghana; even recent builders are in their
mid-40s at the medians in each city (Table 17). The only surprise in our owners sub-
samples is the relative youth of recent extenders in Berekum compared with non-
recent extenders. This may be suggesting that extension is really part of an incremen-
tal building process, rather than a decision to start again after a formerly satisfactory
TABLE 14. Percentage of household heads who have worked abroad
Accra Kumasi Berekum
Renters 1.8 18.0 9.5
Recent builders 6.0 32.1 13.3
Recent extenders 3.8 18.4 14.5
Non-recent extenders 5.9 18.9 4.1
TABLE 15. RWIs by tenure groups
Accra Kumasi Berekum
Renters 0.03 0.13 0.08
Recent builders 0.14 0.30 0.26
Recent extenders 0.08 0.18 0.21
Non-recent extenders 0.06 0.17 0.12
TABLE 16. RWIs of zero by tenure groups (percentages)
Accra Kumasi Berekum
Renters 20.4 5.8 8.0
Recent builders 6.0 4.9 6.7
Recent extenders 26.9 11.7 6.6
Non-recent extenders 25.5 13.5 4.1
Housing Supply in Ghana 285
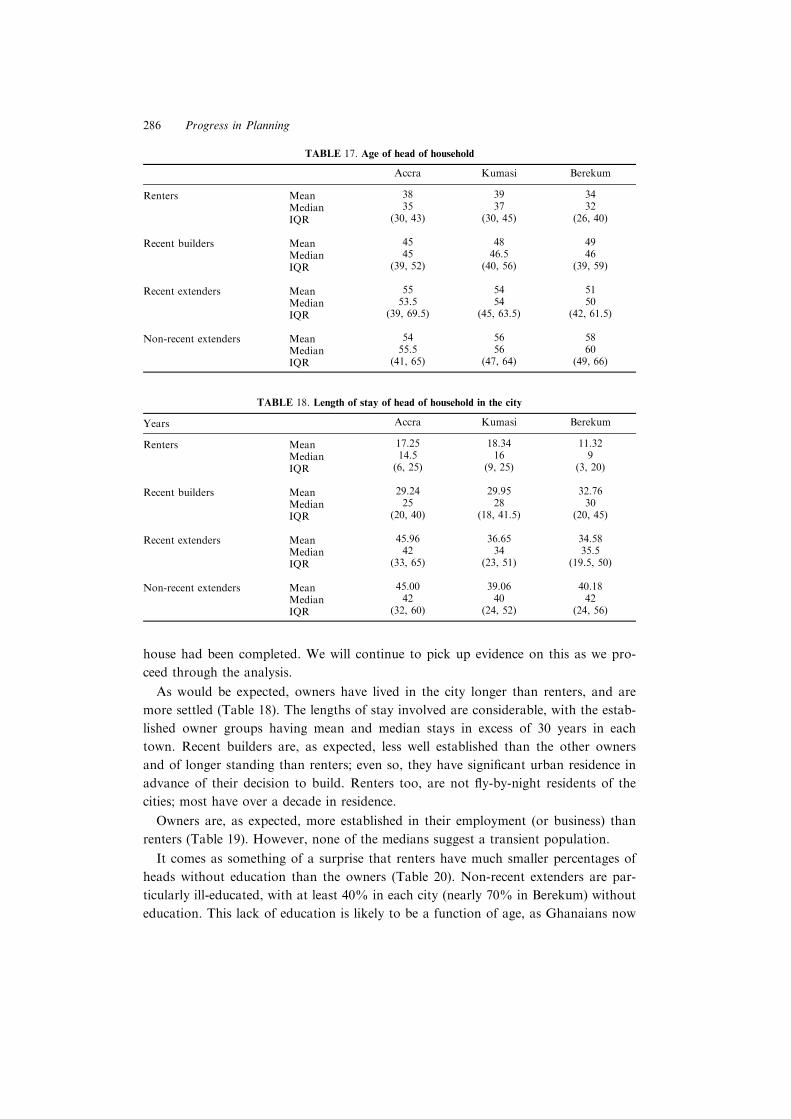
house had been completed. We will continue to pick up evidence on this as we pro-
ceed through the analysis.
As would be expected, owners have lived in the city longer than renters, and are
more settled (Table 18). The lengths of stay involved are considerable, with the estab-
lished owner groups having mean and median stays in excess of 30 years in each
town. Recent builders are, as expected, less well established than the other owners
and of longer standing than renters; even so, they have signi®cant urban residence in
advance of their decision to build. Renters too, are not ¯y-by-night residents of the
cities; most have over a decade in residence.
Owners are, as expected, more established in their employment (or business) than
renters (Table 19). However, none of the medians suggest a transient population.
It comes as something of a surprise that renters have much smaller percentages of
heads without education than the owners (Table 20). Non-recent extenders are par-
ticularly ill-educated, with at least 40% in each city (nearly 70% in Berekum) without
education. This lack of education is likely to be a function of age, as Ghanaians now
TABLE 18. Length of stay of head of household in the city
Years Accra Kumasi Berekum
Renters Mean 17.25 18.34 11.32
Median 14.5 16 9
IQR (6, 25) (9, 25) (3, 20)
Recent builders Mean 29.24 29.95 32.76
Median 25 28 30
IQR (20, 40) (18, 41.5) (20, 45)
Recent extenders Mean 45.96 36.65 34.58
Median 42 34 35.5
IQR (33, 65) (23, 51) (19.5, 50)
Non-recent extenders Mean 45.00 39.06 40.18
Median 42 40 42
IQR (32, 60) (24, 52) (24, 56)
TABLE 17. Age of head of household
Accra Kumasi Berekum
Renters Mean 38 39 34
Median 35 37 32
IQR (30, 43) (30, 45) (26, 40)
Recent builders Mean 45 48 49
Median 45 46.5 46
IQR (39, 52) (40, 56) (39, 59)
Recent extenders Mean 55 54 51
Median 53.5 54 50
IQR (39, 69.5) (45, 63.5) (42, 61.5)
Non-recent extenders Mean 54 56 58
Median 55.5 56 60
IQR (41, 65) (47, 64) (49, 66)
286 Progress in Planning
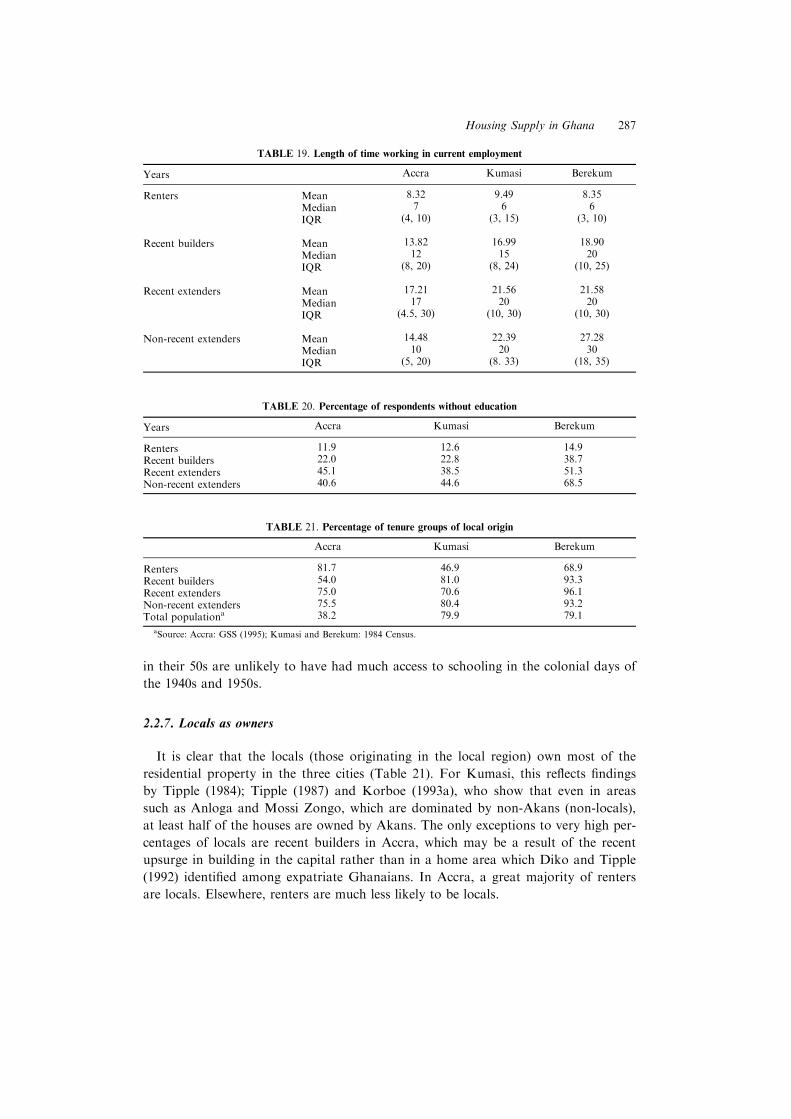
in their 50s are unlikely to have had much access to schooling in the colonial days of
the 1940s and 1950s.
2.2.7. Locals as owners
It is clear that the locals (those originating in the local region) own most of the
residential property in the three cities (Table 21). For Kumasi, this re¯ects ®ndings
by Tipple (1984); Tipple (1987) and Korboe (1993a), who show that even in areas
such as Anloga and Mossi Zongo, which are dominated by non-Akans (non-locals),
at least half of the houses are owned by Akans. The only exceptions to very high per-
centages of locals are recent builders in Accra, which may be a result of the recent
upsurge in building in the capital rather than in a home area which Diko and Tipple
(1992) identi®ed among expatriate Ghanaians. In Accra, a great majority of renters
are locals. Elsewhere, renters are much less likely to be locals.
TABLE 20. Percentage of respondents without education
Years Accra Kumasi Berekum
Renters 11.9 12.6 14.9
Recent builders 22.0 22.8 38.7
Recent extenders 45.1 38.5 51.3
Non-recent extenders 40.6 44.6 68.5
TABLE 21. Percentage of tenure groups of local origin
Accra Kumasi Berekum
Renters 81.7 46.9 68.9
Recent builders 54.0 81.0 93.3
Recent extenders 75.0 70.6 96.1
Non-recent extenders 75.5 80.4 93.2
Total populationa 38.2 79.9 79.1
aSource: Accra: GSS (1995); Kumasi and Berekum: 1984 Census.
TABLE 19. Length of time working in current employment
Years Accra Kumasi Berekum
Renters Mean 8.32 9.49 8.35
Median 7 6 6
IQR (4, 10) (3, 15) (3, 10)
Recent builders Mean 13.82 16.99 18.90
Median 12 15 20
IQR (8, 20) (8, 24) (10, 25)
Recent extenders Mean 17.21 21.56 21.58
Median 17 20 20
IQR (4.5, 30) (10, 30) (10, 30)
Non-recent extenders Mean 14.48 22.39 27.28
Median 10 20 30
IQR (5, 20) (8. 33) (18, 35)
Housing Supply in Ghana 287

CHAPTER 3
What is being supplied
It has already been mentioned that the survey of new builders included both those
households who had moved into their new houses and those who had yet to move
in. Rather than treat these as a single sample of new builders, valuable insights can
be provided by comparing the two groups. The best opportunity for comparison
exists in Kumasi where the split between the groups was 139 respondents already in
their new house to 44 not moved in. In Accra the split was 29 to 21, but in Berekum
only two households of the 75 recent builders had not moved into the new house.
3.1. THE NEW HOUSES
Current housing policy in Ghana centres on encouraging individuals to build for-
mal-sector bungalows. As we have seen in Chapter 1, the Home Finance
Corporation (HFC) ®nancing presupposes GREDA developments, and direct govern-
ment policy refers to single household housing and encourages ownership through
both rhetoric and the ambivalent relationship government has with landlords. Such
single household bungalows would provide three, or at most four, habitable rooms
per house. It is obvious from Table 22 that current owners and builders in the newer
areas of the three cities provide more rooms per house than those implied in current
policies.
As we would expect in an urban culture traditionally dominated by compounds,
the houses in the samples were generally large with median sizes of between ®ve and
10 habitable rooms (Table 22). It is not customary for urban owner households to
occupy the whole house (see below), and often rooms will be let to tenants; indeed
owners rarely occupy more than half of the houses sampled (see later and Table 23).
Thus, most houses in each category will have rooms for rental, while all of the
houses sampled in the survey of renters, of course, contain at least one tenant.
The fact that both recent extenders and non-recent extenders live in similar sized
houses in Accra and Kumasi, and recent extenders live in smaller ones in Berekum,
suggests that the extension is part of an on-going incremental building process rather
than an after-thought to alter a completed house.
In Kumasi we were able to analyze the type of house recently built with reference
to the characteristics of the builder. The most interesting feature is the di�erence
between builders of compounds and those building other house types. The compound
is the traditional building form, it re¯ects traditional values and habits of communal
living. It is also relatively cheap and tends to breach building and planning regu-
Housing Supply in Ghana 289
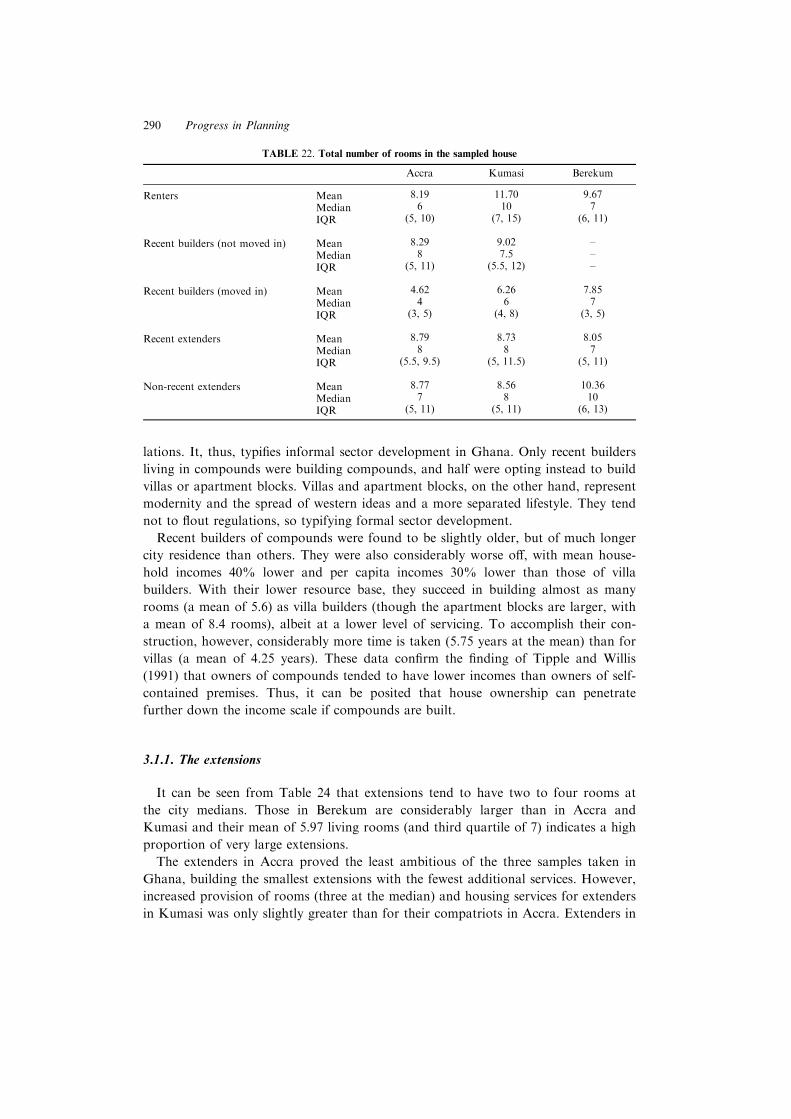
lations. It, thus, typi®es informal sector development in Ghana. Only recent builders
living in compounds were building compounds, and half were opting instead to build
villas or apartment blocks. Villas and apartment blocks, on the other hand, represent
modernity and the spread of western ideas and a more separated lifestyle. They tend
not to ¯out regulations, so typifying formal sector development.
Recent builders of compounds were found to be slightly older, but of much longer
city residence than others. They were also considerably worse o�, with mean house-
hold incomes 40% lower and per capita incomes 30% lower than those of villa
builders. With their lower resource base, they succeed in building almost as many
rooms (a mean of 5.6) as villa builders (though the apartment blocks are larger, with
a mean of 8.4 rooms), albeit at a lower level of servicing. To accomplish their con-
struction, however, considerably more time is taken (5.75 years at the mean) than for
villas (a mean of 4.25 years). These data con®rm the ®nding of Tipple and Willis
(1991) that owners of compounds tended to have lower incomes than owners of self-
contained premises. Thus, it can be posited that house ownership can penetrate
further down the income scale if compounds are built.
3.1.1. The extensions
It can be seen from Table 24 that extensions tend to have two to four rooms at
the city medians. Those in Berekum are considerably larger than in Accra and
Kumasi and their mean of 5.97 living rooms (and third quartile of 7) indicates a high
proportion of very large extensions.
The extenders in Accra proved the least ambitious of the three samples taken in
Ghana, building the smallest extensions with the fewest additional services. However,
increased provision of rooms (three at the median) and housing services for extenders
in Kumasi was only slightly greater than for their compatriots in Accra. Extenders in
TABLE 22. Total number of rooms in the sampled house
Accra Kumasi Berekum
Renters Mean 8.19 11.70 9.67
Median 6 10 7
IQR (5, 10) (7, 15) (6, 11)
Recent builders (not moved in) Mean 8.29 9.02 ±
Median 8 7.5 ±
IQR (5, 11) (5.5, 12) ±
Recent builders (moved in) Mean 4.62 6.26 7.85
Median 4 6 7
IQR (3, 5) (4, 8) (3, 5)
Recent extenders Mean 8.79 8.73 8.05
Median 8 8 7
IQR (5.5, 9.5) (5, 11.5) (5, 11)
Non-recent extenders Mean 8.77 8.56 10.36
Median 7 8 10
IQR (5, 11) (5, 11) (6, 13)
290 Progress in Planning
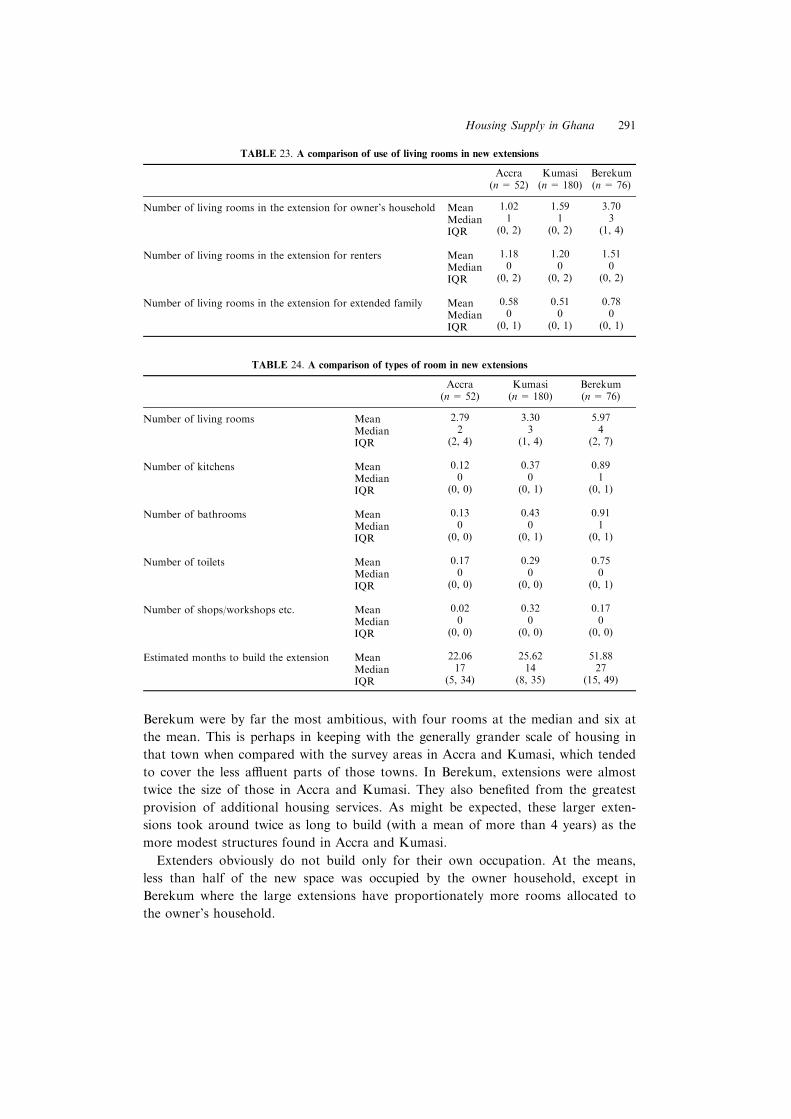
Berekum were by far the most ambitious, with four rooms at the median and six at
the mean. This is perhaps in keeping with the generally grander scale of housing in
that town when compared with the survey areas in Accra and Kumasi, which tended
to cover the less a�uent parts of those towns. In Berekum, extensions were almost
twice the size of those in Accra and Kumasi. They also bene®ted from the greatest
provision of additional housing services. As might be expected, these larger exten-
sions took around twice as long to build (with a mean of more than 4 years) as the
more modest structures found in Accra and Kumasi.
Extenders obviously do not build only for their own occupation. At the means,
less than half of the new space was occupied by the owner household, except in
Berekum where the large extensions have proportionately more rooms allocated to
the owner's household.
TABLE 23. A comparison of use of living rooms in new extensions
Accra(n= 52)
Kumasi(n= 180)
Berekum(n= 76)
Number of living rooms in the extension for owner's household Mean 1.02 1.59 3.70
Median 1 1 3
IQR (0, 2) (0, 2) (1, 4)
Number of living rooms in the extension for renters Mean 1.18 1.20 1.51
Median 0 0 0
IQR (0, 2) (0, 2) (0, 2)
Number of living rooms in the extension for extended family Mean 0.58 0.51 0.78
Median 0 0 0
IQR (0, 1) (0, 1) (0, 1)
TABLE 24. A comparison of types of room in new extensions
Accra(n= 52)
Kumasi(n= 180)
Berekum(n= 76)
Number of living rooms Mean 2.79 3.30 5.97
Median 2 3 4
IQR (2, 4) (1, 4) (2, 7)
Number of kitchens Mean 0.12 0.37 0.89
Median 0 0 1
IQR (0, 0) (0, 1) (0, 1)
Number of bathrooms Mean 0.13 0.43 0.91
Median 0 0 1
IQR (0, 0) (0, 1) (0, 1)
Number of toilets Mean 0.17 0.29 0.75
Median 0 0 0
IQR (0, 0) (0, 0) (0, 1)
Number of shops/workshops etc. Mean 0.02 0.32 0.17
Median 0 0 0
IQR (0, 0) (0, 0) (0, 0)
Estimated months to build the extension Mean 22.06 25.62 51.88
Median 17 14 27
IQR (5, 34) (8, 35) (15, 49)
Housing Supply in Ghana 291
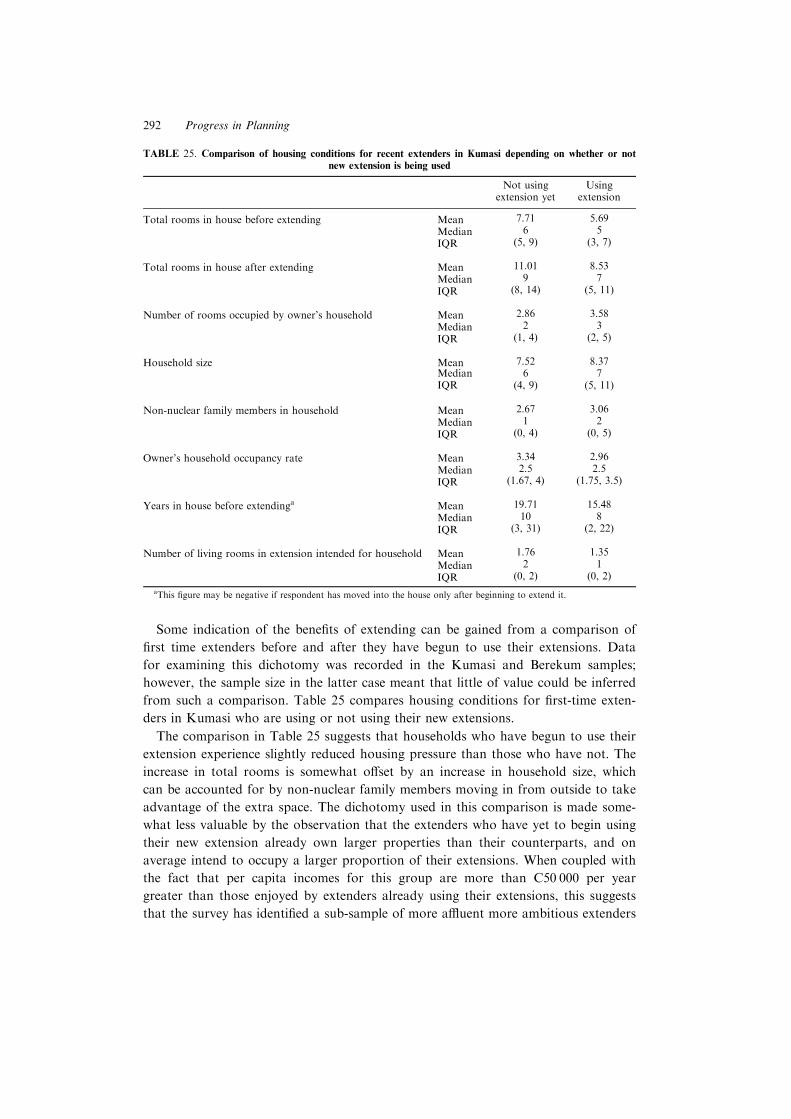
Some indication of the bene®ts of extending can be gained from a comparison of
®rst time extenders before and after they have begun to use their extensions. Data
for examining this dichotomy was recorded in the Kumasi and Berekum samples;
however, the sample size in the latter case meant that little of value could be inferred
from such a comparison. Table 25 compares housing conditions for ®rst-time exten-
ders in Kumasi who are using or not using their new extensions.
The comparison in Table 25 suggests that households who have begun to use their
extension experience slightly reduced housing pressure than those who have not. The
increase in total rooms is somewhat o�set by an increase in household size, which
can be accounted for by non-nuclear family members moving in from outside to take
advantage of the extra space. The dichotomy used in this comparison is made some-
what less valuable by the observation that the extenders who have yet to begin using
their new extension already own larger properties than their counterparts, and on
average intend to occupy a larger proportion of their extensions. When coupled with
the fact that per capita incomes for this group are more than C50 000 per year
greater than those enjoyed by extenders already using their extensions, this suggests
that the survey has identi®ed a sub-sample of more a�uent more ambitious extenders
TABLE 25. Comparison of housing conditions for recent extenders in Kumasi depending on whether or notnew extension is being used
Not usingextension yet
Usingextension
Total rooms in house before extending Mean 7.71 5.69
Median 6 5
IQR (5, 9) (3, 7)
Total rooms in house after extending Mean 11.01 8.53
Median 9 7
IQR (8, 14) (5, 11)
Number of rooms occupied by owner's household Mean 2.86 3.58
Median 2 3
IQR (1, 4) (2, 5)
Household size Mean 7.52 8.37Median 6 7IQR (4, 9) (5, 11)
Non-nuclear family members in household Mean 2.67 3.06
Median 1 2
IQR (0, 4) (0, 5)
Owner's household occupancy rate Mean 3.34 2.96
Median 2.5 2.5
IQR (1.67, 4) (1.75, 3.5)
Years in house before extendinga Mean 19.71 15.48
Median 10 8
IQR (3, 31) (2, 22)
Number of living rooms in extension intended for household Mean 1.76 1.35
Median 2 1
IQR (0, 2) (0, 2)
aThis ®gure may be negative if respondent has moved into the house only after beginning to extend it.
292 Progress in Planning
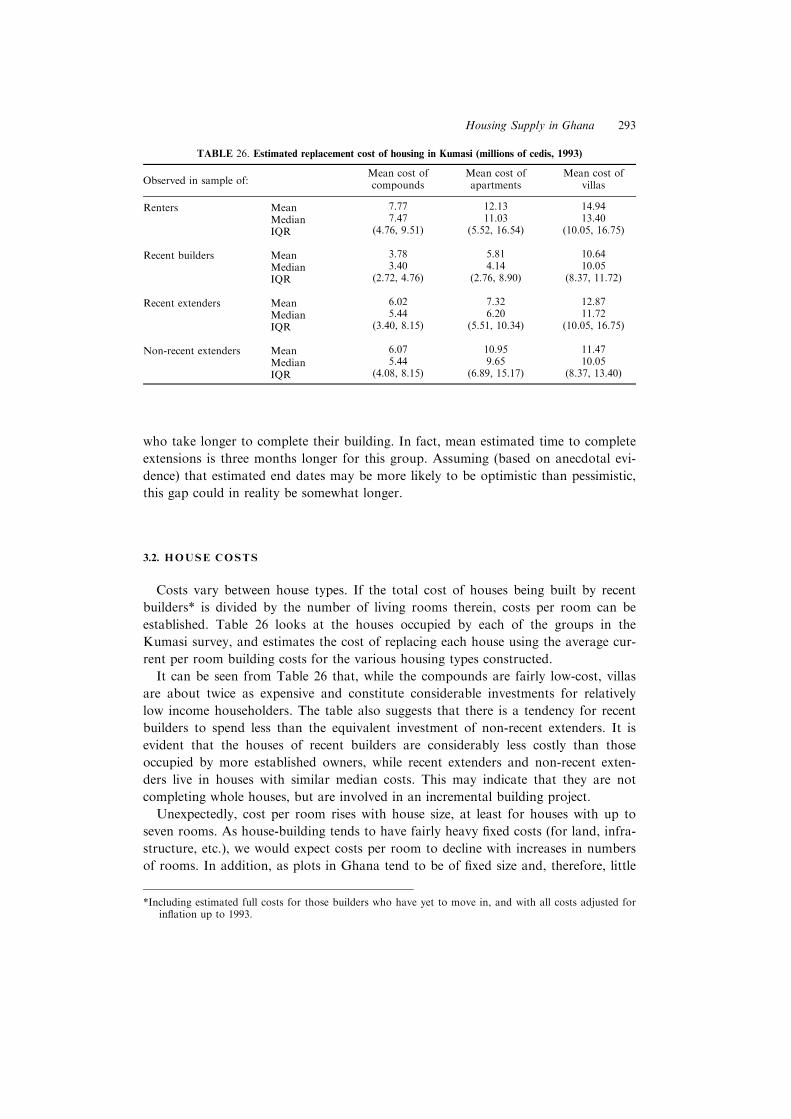
who take longer to complete their building. In fact, mean estimated time to complete
extensions is three months longer for this group. Assuming (based on anecdotal evi-
dence) that estimated end dates may be more likely to be optimistic than pessimistic,
this gap could in reality be somewhat longer.
3.2. HOUSE COSTS
Costs vary between house types. If the total cost of houses being built by recent
builders* is divided by the number of living rooms therein, costs per room can be
established. Table 26 looks at the houses occupied by each of the groups in the
Kumasi survey, and estimates the cost of replacing each house using the average cur-
rent per room building costs for the various housing types constructed.
It can be seen from Table 26 that, while the compounds are fairly low-cost, villas
are about twice as expensive and constitute considerable investments for relatively
low income householders. The table also suggests that there is a tendency for recent
builders to spend less than the equivalent investment of non-recent extenders. It is
evident that the houses of recent builders are considerably less costly than those
occupied by more established owners, while recent extenders and non-recent exten-
ders live in houses with similar median costs. This may indicate that they are not
completing whole houses, but are involved in an incremental building project.
Unexpectedly, cost per room rises with house size, at least for houses with up to
seven rooms. As house-building tends to have fairly heavy ®xed costs (for land, infra-
structure, etc.), we would expect costs per room to decline with increases in numbers
of rooms. In addition, as plots in Ghana tend to be of ®xed size and, therefore, little
TABLE 26. Estimated replacement cost of housing in Kumasi (millions of cedis, 1993)
Observed in sample of:Mean cost ofcompounds
Mean cost ofapartments
Mean cost ofvillas
Renters Mean 7.77 12.13 14.94
Median 7.47 11.03 13.40
IQR (4.76, 9.51) (5.52, 16.54) (10.05, 16.75)
Recent builders Mean 3.78 5.81 10.64
Median 3.40 4.14 10.05
IQR (2.72, 4.76) (2.76, 8.90) (8.37, 11.72)
Recent extenders Mean 6.02 7.32 12.87
Median 5.44 6.20 11.72
IQR (3.40, 8.15) (5.51, 10.34) (10.05, 16.75)
Non-recent extenders Mean 6.07 10.95 11.47
Median 5.44 9.65 10.05
IQR (4.08, 8.15) (6.89, 15.17) (8.37, 13.40)
*Including estimated full costs for those builders who have yet to move in, and with all costs adjusted forin¯ation up to 1993.
Housing Supply in Ghana 293
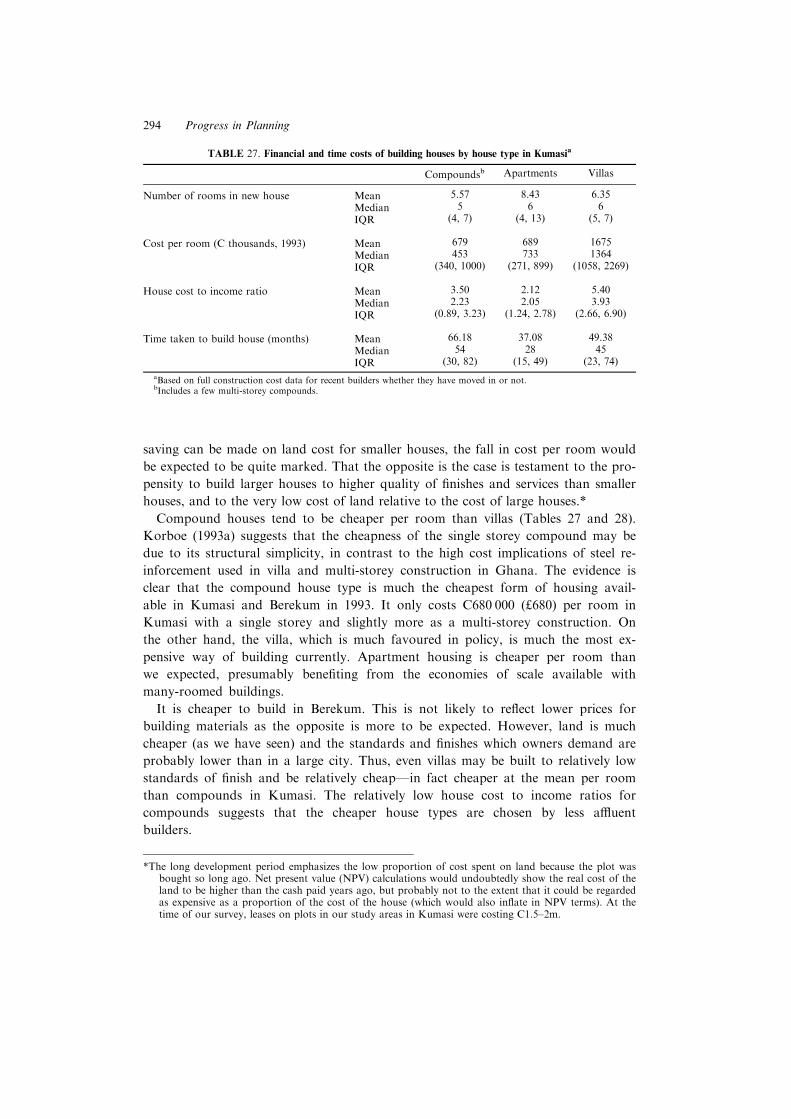
saving can be made on land cost for smaller houses, the fall in cost per room would
be expected to be quite marked. That the opposite is the case is testament to the pro-
pensity to build larger houses to higher quality of ®nishes and services than smaller
houses, and to the very low cost of land relative to the cost of large houses.*
Compound houses tend to be cheaper per room than villas (Tables 27 and 28).
Korboe (1993a) suggests that the cheapness of the single storey compound may be
due to its structural simplicity, in contrast to the high cost implications of steel re-
inforcement used in villa and multi-storey construction in Ghana. The evidence is
clear that the compound house type is much the cheapest form of housing avail-
able in Kumasi and Berekum in 1993. It only costs C680 000 (£680) per room in
Kumasi with a single storey and slightly more as a multi-storey construction. On
the other hand, the villa, which is much favoured in policy, is much the most ex-
pensive way of building currently. Apartment housing is cheaper per room than
we expected, presumably bene®ting from the economies of scale available with
many-roomed buildings.
It is cheaper to build in Berekum. This is not likely to re¯ect lower prices for
building materials as the opposite is more to be expected. However, land is much
cheaper (as we have seen) and the standards and ®nishes which owners demand are
probably lower than in a large city. Thus, even villas may be built to relatively low
standards of ®nish and be relatively cheapÐin fact cheaper at the mean per room
than compounds in Kumasi. The relatively low house cost to income ratios for
compounds suggests that the cheaper house types are chosen by less a�uent
builders.
TABLE 27. Financial and time costs of building houses by house type in Kumasia
Compoundsb Apartments Villas
Number of rooms in new house Mean 5.57 8.43 6.35
Median 5 6 6
IQR (4, 7) (4, 13) (5, 7)
Cost per room (C thousands, 1993) Mean 679 689 1675
Median 453 733 1364
IQR (340, 1000) (271, 899) (1058, 2269)
House cost to income ratio Mean 3.50 2.12 5.40
Median 2.23 2.05 3.93
IQR (0.89, 3.23) (1.24, 2.78) (2.66, 6.90)
Time taken to build house (months) Mean 66.18 37.08 49.38
Median 54 28 45
IQR (30, 82) (15, 49) (23, 74)
aBased on full construction cost data for recent builders whether they have moved in or not.bIncludes a few multi-storey compounds.
*The long development period emphasizes the low proportion of cost spent on land because the plot wasbought so long ago. Net present value (NPV) calculations would undoubtedly show the real cost of theland to be higher than the cash paid years ago, but probably not to the extent that it could be regardedas expensive as a proportion of the cost of the house (which would also in¯ate in NPV terms). At thetime of our survey, leases on plots in our study areas in Kumasi were costing C1.5±2m.
294 Progress in Planning
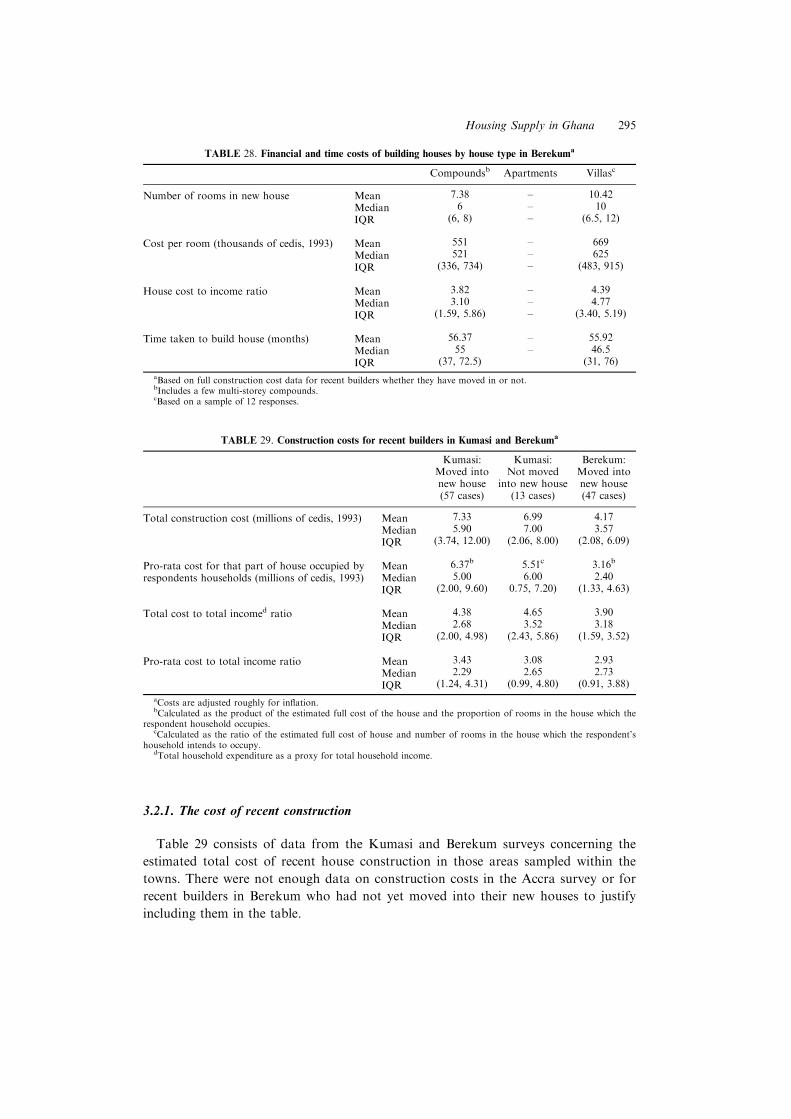
3.2.1. The cost of recent construction
Table 29 consists of data from the Kumasi and Berekum surveys concerning the
estimated total cost of recent house construction in those areas sampled within the
towns. There were not enough data on construction costs in the Accra survey or for
recent builders in Berekum who had not yet moved into their new houses to justify
including them in the table.
TABLE 29. Construction costs for recent builders in Kumasi and Berekuma
Kumasi:Moved intonew house(57 cases)
Kumasi:Not moved
into new house(13 cases)
Berekum:Moved intonew house(47 cases)
Total construction cost (millions of cedis, 1993) Mean 7.33 6.99 4.17
Median 5.90 7.00 3.57
IQR (3.74, 12.00) (2.06, 8.00) (2.08, 6.09)
Pro-rata cost for that part of house occupied by Mean 6.37b 5.51c 3.16b
respondents households (millions of cedis, 1993) Median 5.00 6.00 2.40
IQR (2.00, 9.60) 0.75, 7.20) (1.33, 4.63)
Total cost to total incomed ratio Mean 4.38 4.65 3.90
Median 2.68 3.52 3.18
IQR (2.00, 4.98) (2.43, 5.86) (1.59, 3.52)
Pro-rata cost to total income ratio Mean 3.43 3.08 2.93
Median 2.29 2.65 2.73
IQR (1.24, 4.31) (0.99, 4.80) (0.91, 3.88)
aCosts are adjusted roughly for in¯ation.bCalculated as the product of the estimated full cost of the house and the proportion of rooms in the house which the
respondent household occupies.cCalculated as the ratio of the estimated full cost of house and number of rooms in the house which the respondent's
household intends to occupy.dTotal household expenditure as a proxy for total household income.
TABLE 28. Financial and time costs of building houses by house type in Berekuma
Compoundsb Apartments Villasc
Number of rooms in new house Mean 7.38 ± 10.42
Median 6 ± 10
IQR (6, 8) ± (6.5, 12)
Cost per room (thousands of cedis, 1993) Mean 551 ± 669
Median 521 ± 625
IQR (336, 734) ± (483, 915)
House cost to income ratio Mean 3.82 ± 4.39
Median 3.10 ± 4.77
IQR (1.59, 5.86) ± (3.40, 5.19)
Time taken to build house (months) Mean 56.37 ± 55.92
Median 55 ± 46.5
IQR (37, 72.5) (31, 76)
aBased on full construction cost data for recent builders whether they have moved in or not.bIncludes a few multi-storey compounds.cBased on a sample of 12 responses.
Housing Supply in Ghana 295
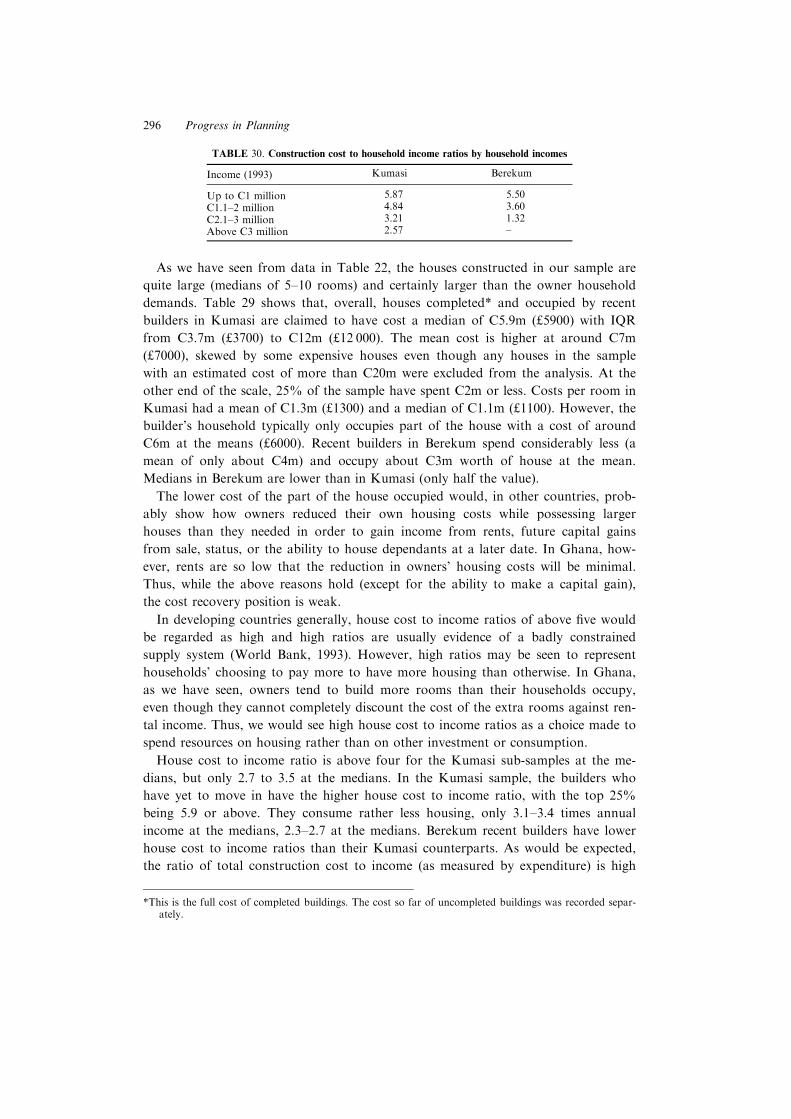
As we have seen from data in Table 22, the houses constructed in our sample are
quite large (medians of 5±10 rooms) and certainly larger than the owner household
demands. Table 29 shows that, overall, houses completed* and occupied by recent
builders in Kumasi are claimed to have cost a median of C5.9m (£5900) with IQR
from C3.7m (£3700) to C12m (£12 000). The mean cost is higher at around C7m
(£7000), skewed by some expensive houses even though any houses in the sample
with an estimated cost of more than C20m were excluded from the analysis. At the
other end of the scale, 25% of the sample have spent C2m or less. Costs per room in
Kumasi had a mean of C1.3m (£1300) and a median of C1.1m (£1100). However, the
builder's household typically only occupies part of the house with a cost of around
C6m at the means (£6000). Recent builders in Berekum spend considerably less (a
mean of only about C4m) and occupy about C3m worth of house at the mean.
Medians in Berekum are lower than in Kumasi (only half the value).
The lower cost of the part of the house occupied would, in other countries, prob-
ably show how owners reduced their own housing costs while possessing larger
houses than they needed in order to gain income from rents, future capital gains
from sale, status, or the ability to house dependants at a later date. In Ghana, how-
ever, rents are so low that the reduction in owners' housing costs will be minimal.
Thus, while the above reasons hold (except for the ability to make a capital gain),
the cost recovery position is weak.
In developing countries generally, house cost to income ratios of above ®ve would
be regarded as high and high ratios are usually evidence of a badly constrained
supply system (World Bank, 1993). However, high ratios may be seen to represent
households' choosing to pay more to have more housing than otherwise. In Ghana,
as we have seen, owners tend to build more rooms than their households occupy,
even though they cannot completely discount the cost of the extra rooms against ren-
tal income. Thus, we would see high house cost to income ratios as a choice made to
spend resources on housing rather than on other investment or consumption.
House cost to income ratio is above four for the Kumasi sub-samples at the me-
dians, but only 2.7 to 3.5 at the medians. In the Kumasi sample, the builders who
have yet to move in have the higher house cost to income ratio, with the top 25%
being 5.9 or above. They consume rather less housing, only 3.1±3.4 times annual
income at the medians, 2.3±2.7 at the medians. Berekum recent builders have lower
house cost to income ratios than their Kumasi counterparts. As would be expected,
the ratio of total construction cost to income (as measured by expenditure) is high
TABLE 30. Construction cost to household income ratios by household incomes
Income (1993) Kumasi Berekum
Up to C1 million 5.87 5.50
C1.1±2 million 4.84 3.60
C2.1±3 million 3.21 1.32
Above C3 million 2.57 ±
*This is the full cost of completed buildings. The cost so far of uncompleted buildings was recorded separ-ately.
296 Progress in Planning
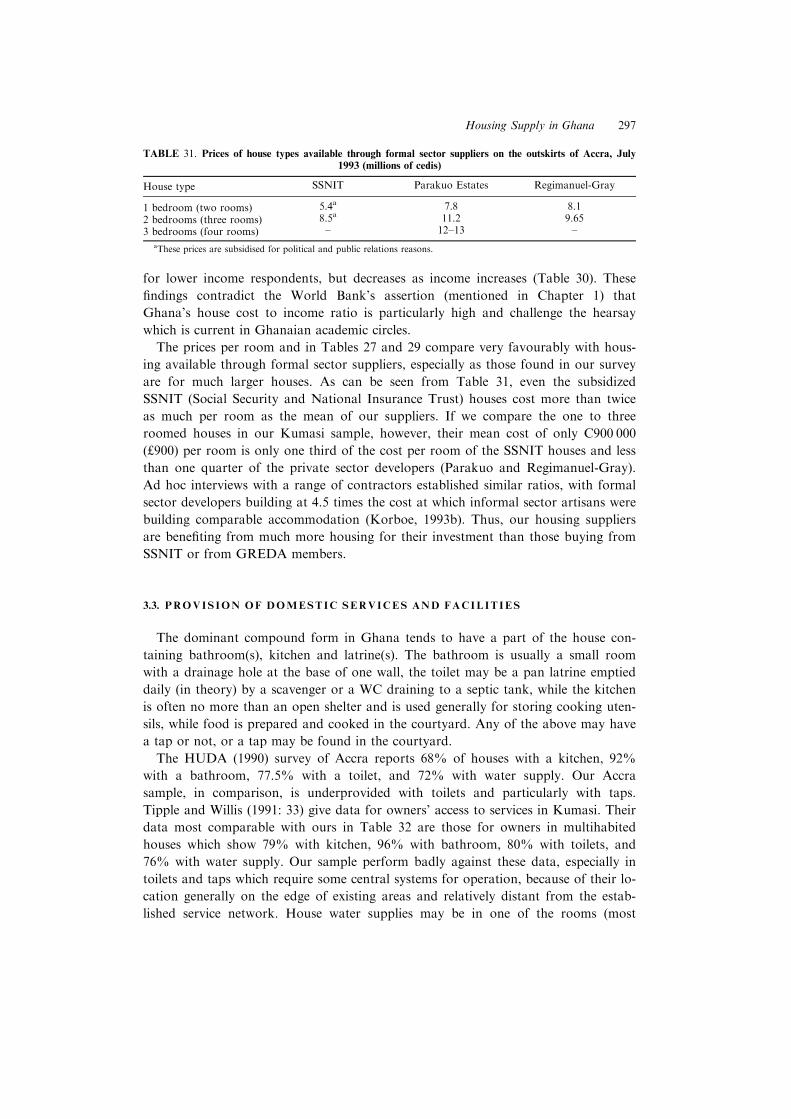
for lower income respondents, but decreases as income increases (Table 30). These
®ndings contradict the World Bank's assertion (mentioned in Chapter 1) that
Ghana's house cost to income ratio is particularly high and challenge the hearsay
which is current in Ghanaian academic circles.
The prices per room and in Tables 27 and 29 compare very favourably with hous-
ing available through formal sector suppliers, especially as those found in our survey
are for much larger houses. As can be seen from Table 31, even the subsidized
SSNIT (Social Security and National Insurance Trust) houses cost more than twice
as much per room as the mean of our suppliers. If we compare the one to three
roomed houses in our Kumasi sample, however, their mean cost of only C900 000
(£900) per room is only one third of the cost per room of the SSNIT houses and less
than one quarter of the private sector developers (Parakuo and Regimanuel-Gray).
Ad hoc interviews with a range of contractors established similar ratios, with formal
sector developers building at 4.5 times the cost at which informal sector artisans were
building comparable accommodation (Korboe, 1993b). Thus, our housing suppliers
are bene®ting from much more housing for their investment than those buying from
SSNIT or from GREDA members.
3.3. PROVIS ION OF DOMESTIC SERVICES AND FACILIT IES
The dominant compound form in Ghana tends to have a part of the house con-
taining bathroom(s), kitchen and latrine(s). The bathroom is usually a small room
with a drainage hole at the base of one wall, the toilet may be a pan latrine emptied
daily (in theory) by a scavenger or a WC draining to a septic tank, while the kitchen
is often no more than an open shelter and is used generally for storing cooking uten-
sils, while food is prepared and cooked in the courtyard. Any of the above may have
a tap or not, or a tap may be found in the courtyard.
The HUDA (1990) survey of Accra reports 68% of houses with a kitchen, 92%
with a bathroom, 77.5% with a toilet, and 72% with water supply. Our Accra
sample, in comparison, is underprovided with toilets and particularly with taps.
Tipple and Willis (1991: 33) give data for owners' access to services in Kumasi. Their
data most comparable with ours in Table 32 are those for owners in multihabited
houses which show 79% with kitchen, 96% with bathroom, 80% with toilets, and
76% with water supply. Our sample perform badly against these data, especially in
toilets and taps which require some central systems for operation, because of their lo-
cation generally on the edge of existing areas and relatively distant from the estab-
lished service network. House water supplies may be in one of the rooms (most
TABLE 31. Prices of house types available through formal sector suppliers on the outskirts of Accra, July1993 (millions of cedis)
House type SSNIT Parakuo Estates Regimanuel-Gray
1 bedroom (two rooms) 5.4a 7.8 8.1
2 bedrooms (three rooms) 8.5a 11.2 9.65
3 bedrooms (four rooms) ± 12±13 ±
aThese prices are subsidised for political and public relations reasons.
Housing Supply in Ghana 297
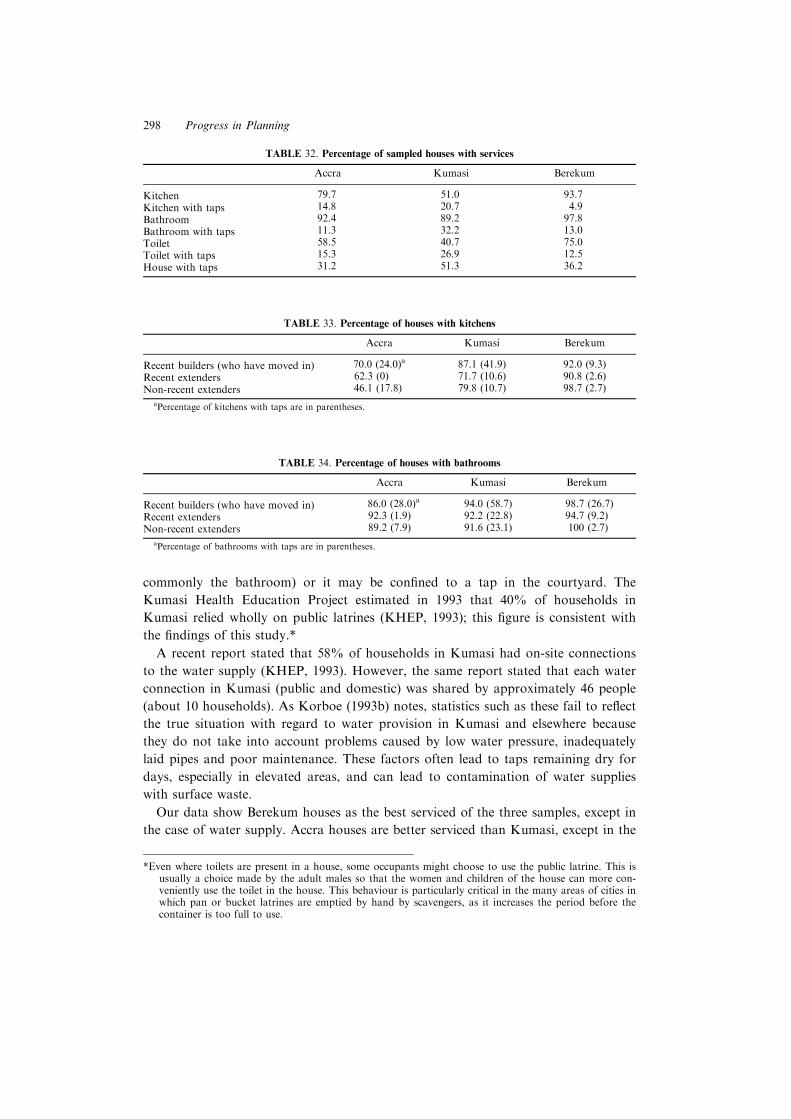
commonly the bathroom) or it may be con®ned to a tap in the courtyard. The
Kumasi Health Education Project estimated in 1993 that 40% of households in
Kumasi relied wholly on public latrines (KHEP, 1993); this ®gure is consistent with
the ®ndings of this study.*
A recent report stated that 58% of households in Kumasi had on-site connections
to the water supply (KHEP, 1993). However, the same report stated that each water
connection in Kumasi (public and domestic) was shared by approximately 46 people
(about 10 households). As Korboe (1993b) notes, statistics such as these fail to re¯ect
the true situation with regard to water provision in Kumasi and elsewhere because
they do not take into account problems caused by low water pressure, inadequately
laid pipes and poor maintenance. These factors often lead to taps remaining dry for
days, especially in elevated areas, and can lead to contamination of water supplies
with surface waste.
Our data show Berekum houses as the best serviced of the three samples, except in
the case of water supply. Accra houses are better serviced than Kumasi, except in the
TABLE 32. Percentage of sampled houses with services
Accra Kumasi Berekum
Kitchen 79.7 51.0 93.7
Kitchen with taps 14.8 20.7 4.9
Bathroom 92.4 89.2 97.8
Bathroom with taps 11.3 32.2 13.0
Toilet 58.5 40.7 75.0
Toilet with taps 15.3 26.9 12.5
House with taps 31.2 51.3 36.2
TABLE 33. Percentage of houses with kitchens
Accra Kumasi Berekum
Recent builders (who have moved in) 70.0 (24.0)a 87.1 (41.9) 92.0 (9.3)
Recent extenders 62.3 (0) 71.7 (10.6) 90.8 (2.6)
Non-recent extenders 46.1 (17.8) 79.8 (10.7) 98.7 (2.7)
aPercentage of kitchens with taps are in parentheses.
TABLE 34. Percentage of houses with bathrooms
Accra Kumasi Berekum
Recent builders (who have moved in) 86.0 (28.0)a 94.0 (58.7) 98.7 (26.7)
Recent extenders 92.3 (1.9) 92.2 (22.8) 94.7 (9.2)
Non-recent extenders 89.2 (7.9) 91.6 (23.1) 100 (2.7)
aPercentage of bathrooms with taps are in parentheses.
*Even where toilets are present in a house, some occupants might choose to use the public latrine. This isusually a choice made by the adult males so that the women and children of the house can more con-veniently use the toilet in the house. This behaviour is particularly critical in the many areas of cities inwhich pan or bucket latrines are emptied by hand by scavengers, as it increases the period before thecontainer is too full to use.
298 Progress in Planning
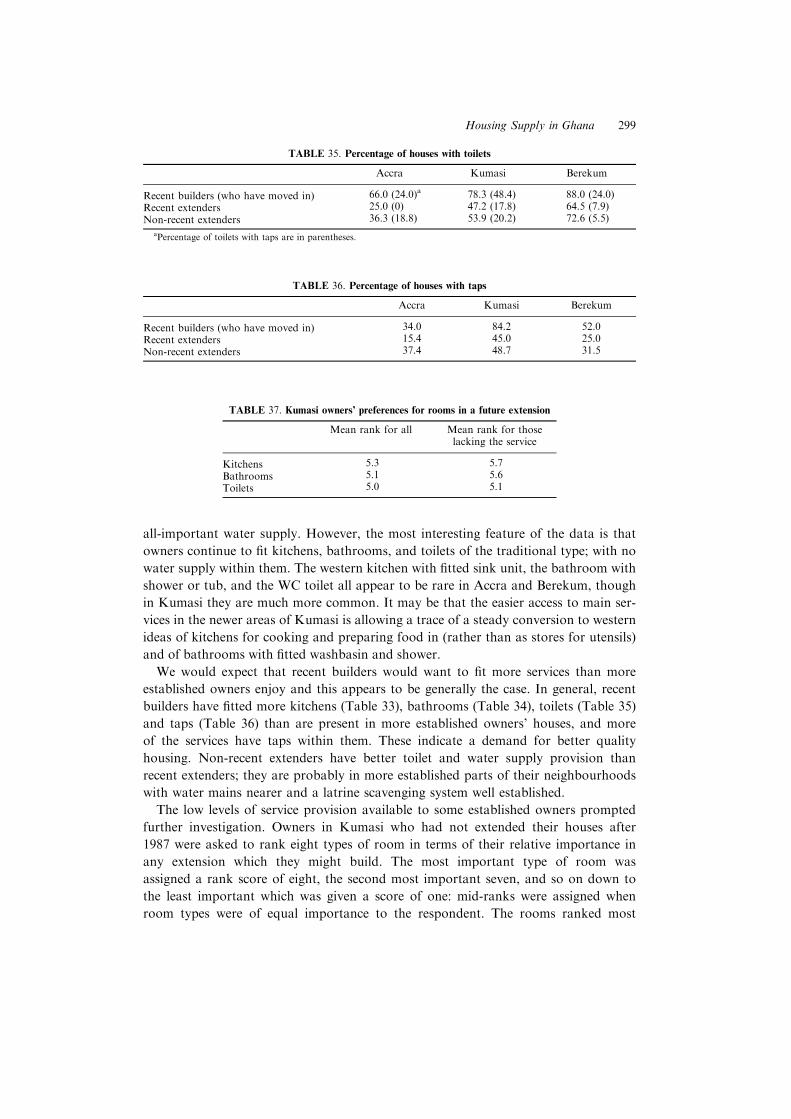
all-important water supply. However, the most interesting feature of the data is that
owners continue to ®t kitchens, bathrooms, and toilets of the traditional type; with no
water supply within them. The western kitchen with ®tted sink unit, the bathroom with
shower or tub, and the WC toilet all appear to be rare in Accra and Berekum, though
in Kumasi they are much more common. It may be that the easier access to main ser-
vices in the newer areas of Kumasi is allowing a trace of a steady conversion to western
ideas of kitchens for cooking and preparing food in (rather than as stores for utensils)
and of bathrooms with ®tted washbasin and shower.
We would expect that recent builders would want to ®t more services than more
established owners enjoy and this appears to be generally the case. In general, recent
builders have ®tted more kitchens (Table 33), bathrooms (Table 34), toilets (Table 35)
and taps (Table 36) than are present in more established owners' houses, and more
of the services have taps within them. These indicate a demand for better quality
housing. Non-recent extenders have better toilet and water supply provision than
recent extenders; they are probably in more established parts of their neighbourhoods
with water mains nearer and a latrine scavenging system well established.
The low levels of service provision available to some established owners prompted
further investigation. Owners in Kumasi who had not extended their houses after
1987 were asked to rank eight types of room in terms of their relative importance in
any extension which they might build. The most important type of room was
assigned a rank score of eight, the second most important seven, and so on down to
the least important which was given a score of one: mid-ranks were assigned when
room types were of equal importance to the respondent. The rooms ranked most
TABLE 35. Percentage of houses with toilets
Accra Kumasi Berekum
Recent builders (who have moved in) 66.0 (24.0)a 78.3 (48.4) 88.0 (24.0)
Recent extenders 25.0 (0) 47.2 (17.8) 64.5 (7.9)
Non-recent extenders 36.3 (18.8) 53.9 (20.2) 72.6 (5.5)
aPercentage of toilets with taps are in parentheses.
TABLE 36. Percentage of houses with taps
Accra Kumasi Berekum
Recent builders (who have moved in) 34.0 84.2 52.0
Recent extenders 15.4 45.0 25.0
Non-recent extenders 37.4 48.7 31.5
TABLE 37. Kumasi owners' preferences for rooms in a future extension
Mean rank for all Mean rank for thoselacking the service
Kitchens 5.3 5.7
Bathrooms 5.1 5.6
Toilets 5.0 5.1
Housing Supply in Ghana 299
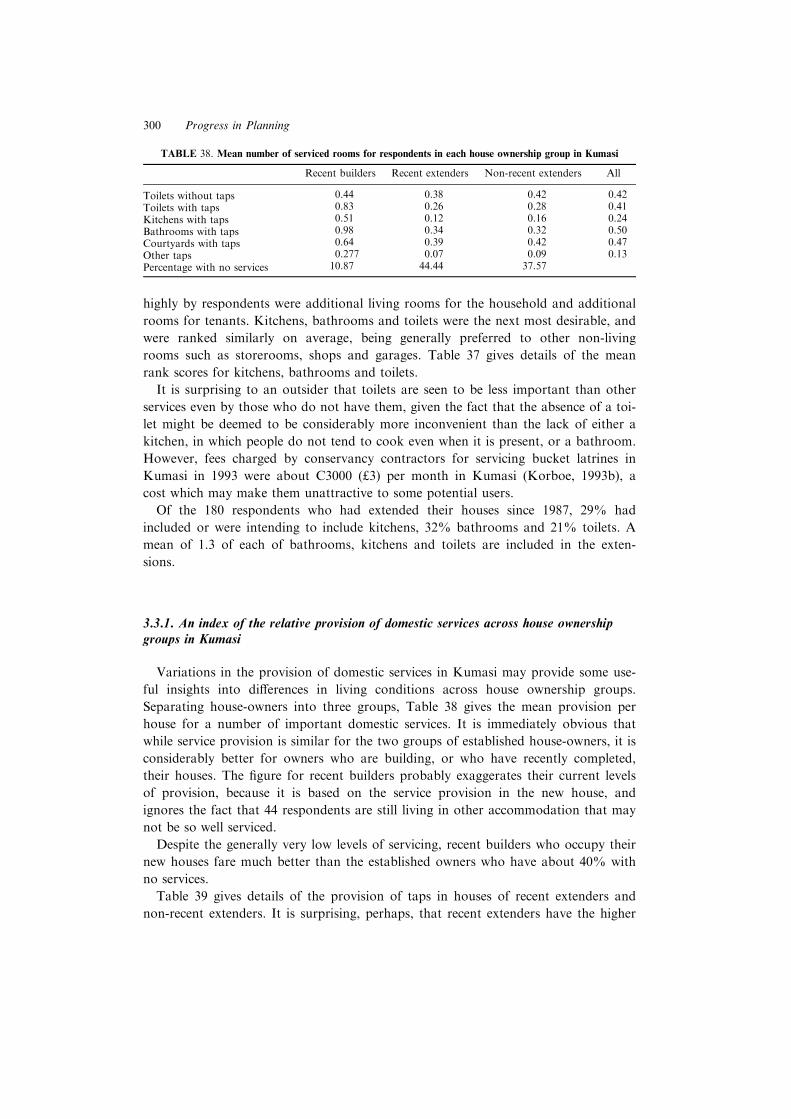
highly by respondents were additional living rooms for the household and additional
rooms for tenants. Kitchens, bathrooms and toilets were the next most desirable, and
were ranked similarly on average, being generally preferred to other non-living
rooms such as storerooms, shops and garages. Table 37 gives details of the mean
rank scores for kitchens, bathrooms and toilets.
It is surprising to an outsider that toilets are seen to be less important than other
services even by those who do not have them, given the fact that the absence of a toi-
let might be deemed to be considerably more inconvenient than the lack of either a
kitchen, in which people do not tend to cook even when it is present, or a bathroom.
However, fees charged by conservancy contractors for servicing bucket latrines in
Kumasi in 1993 were about C3000 (£3) per month in Kumasi (Korboe, 1993b), a
cost which may make them unattractive to some potential users.
Of the 180 respondents who had extended their houses since 1987, 29% had
included or were intending to include kitchens, 32% bathrooms and 21% toilets. A
mean of 1.3 of each of bathrooms, kitchens and toilets are included in the exten-
sions.
3.3.1. An index of the relative provision of domestic services across house ownershipgroups in Kumasi
Variations in the provision of domestic services in Kumasi may provide some use-
ful insights into di�erences in living conditions across house ownership groups.
Separating house-owners into three groups, Table 38 gives the mean provision per
house for a number of important domestic services. It is immediately obvious that
while service provision is similar for the two groups of established house-owners, it is
considerably better for owners who are building, or who have recently completed,
their houses. The ®gure for recent builders probably exaggerates their current levels
of provision, because it is based on the service provision in the new house, and
ignores the fact that 44 respondents are still living in other accommodation that may
not be so well serviced.
Despite the generally very low levels of servicing, recent builders who occupy their
new houses fare much better than the established owners who have about 40% with
no services.
Table 39 gives details of the provision of taps in houses of recent extenders and
non-recent extenders. It is surprising, perhaps, that recent extenders have the higher
TABLE 38. Mean number of serviced rooms for respondents in each house ownership group in Kumasi
Recent builders Recent extenders Non-recent extenders All
Toilets without taps 0.44 0.38 0.42 0.42
Toilets with taps 0.83 0.26 0.28 0.41
Kitchens with taps 0.51 0.12 0.16 0.24
Bathrooms with taps 0.98 0.34 0.32 0.50
Courtyards with taps 0.64 0.39 0.42 0.47
Other taps 0.277 0.07 0.09 0.13
Percentage with no services 10.87 44.44 37.57
300 Progress in Planning
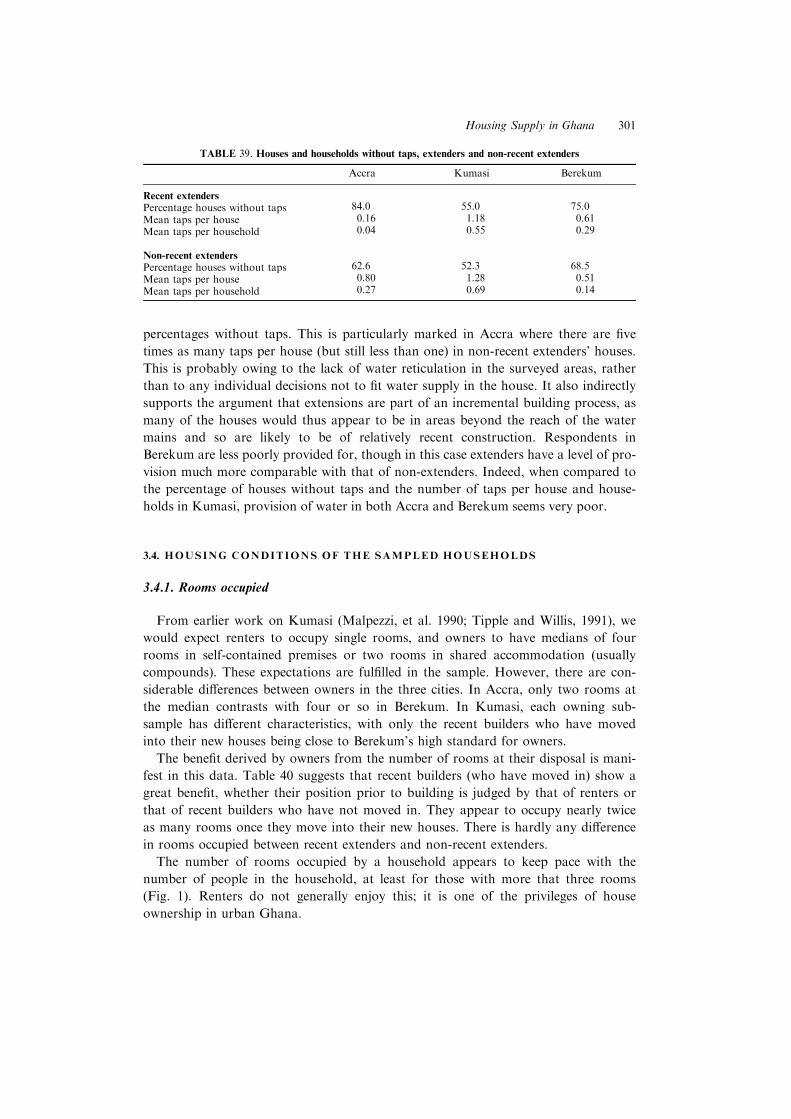
percentages without taps. This is particularly marked in Accra where there are ®ve
times as many taps per house (but still less than one) in non-recent extenders' houses.
This is probably owing to the lack of water reticulation in the surveyed areas, rather
than to any individual decisions not to ®t water supply in the house. It also indirectly
supports the argument that extensions are part of an incremental building process, as
many of the houses would thus appear to be in areas beyond the reach of the water
mains and so are likely to be of relatively recent construction. Respondents in
Berekum are less poorly provided for, though in this case extenders have a level of pro-
vision much more comparable with that of non-extenders. Indeed, when compared to
the percentage of houses without taps and the number of taps per house and house-
holds in Kumasi, provision of water in both Accra and Berekum seems very poor.
3.4. HOUSING CONDIT IONS OF THE SAMPLED HOUSEHOLDS
3.4.1. Rooms occupied
From earlier work on Kumasi (Malpezzi, et al. 1990; Tipple and Willis, 1991), we
would expect renters to occupy single rooms, and owners to have medians of four
rooms in self-contained premises or two rooms in shared accommodation (usually
compounds). These expectations are ful®lled in the sample. However, there are con-
siderable di�erences between owners in the three cities. In Accra, only two rooms at
the median contrasts with four or so in Berekum. In Kumasi, each owning sub-
sample has di�erent characteristics, with only the recent builders who have moved
into their new houses being close to Berekum's high standard for owners.
The bene®t derived by owners from the number of rooms at their disposal is mani-
fest in this data. Table 40 suggests that recent builders (who have moved in) show a
great bene®t, whether their position prior to building is judged by that of renters or
that of recent builders who have not moved in. They appear to occupy nearly twice
as many rooms once they move into their new houses. There is hardly any di�erence
in rooms occupied between recent extenders and non-recent extenders.
The number of rooms occupied by a household appears to keep pace with the
number of people in the household, at least for those with more that three rooms
(Fig. 1). Renters do not generally enjoy this; it is one of the privileges of house
ownership in urban Ghana.
TABLE 39. Houses and households without taps, extenders and non-recent extenders
Accra Kumasi Berekum
Recent extendersPercentage houses without taps 84.0 55.0 75.0
Mean taps per house 0.16 1.18 0.61
Mean taps per household 0.04 0.55 0.29
Non-recent extendersPercentage houses without taps 62.6 52.3 68.5
Mean taps per house 0.80 1.28 0.51
Mean taps per household 0.27 0.69 0.14
Housing Supply in Ghana 301
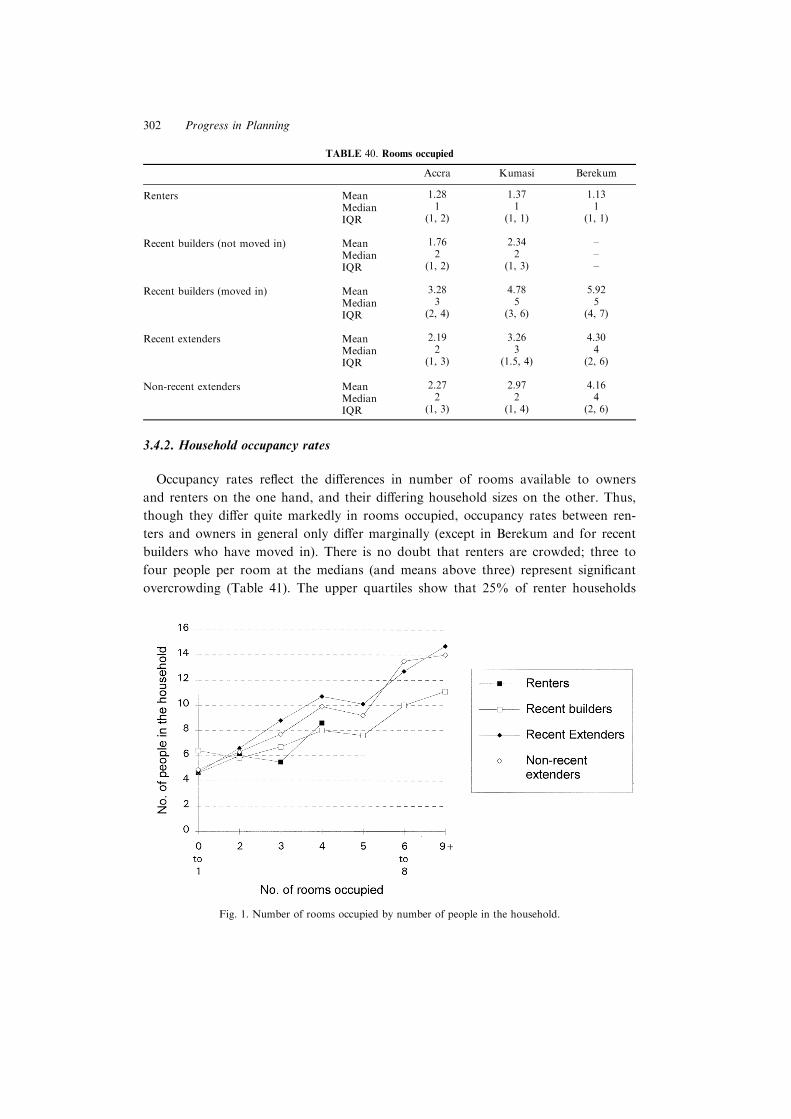
3.4.2. Household occupancy rates
Occupancy rates re¯ect the di�erences in number of rooms available to owners
and renters on the one hand, and their di�ering household sizes on the other. Thus,
though they di�er quite markedly in rooms occupied, occupancy rates between ren-
ters and owners in general only di�er marginally (except in Berekum and for recent
builders who have moved in). There is no doubt that renters are crowded; three to
four people per room at the medians (and means above three) represent signi®cant
overcrowding (Table 41). The upper quartiles show that 25% of renter households
Fig. 1. Number of rooms occupied by number of people in the household.
TABLE 40. Rooms occupied
Accra Kumasi Berekum
Renters Mean 1.28 1.37 1.13
Median 1 1 1
IQR (1, 2) (1, 1) (1, 1)
Recent builders (not moved in) Mean 1.76 2.34 ±
Median 2 2 ±
IQR (1, 2) (1, 3) ±
Recent builders (moved in) Mean 3.28 4.78 5.92
Median 3 5 5
IQR (2, 4) (3, 6) (4, 7)
Recent extenders Mean 2.19 3.26 4.30
Median 2 3 4
IQR (1, 3) (1.5, 4) (2, 6)
Non-recent extenders Mean 2.27 2.97 4.16
Median 2 2 4
IQR (1, 3) (1, 4) (2, 6)
302 Progress in Planning
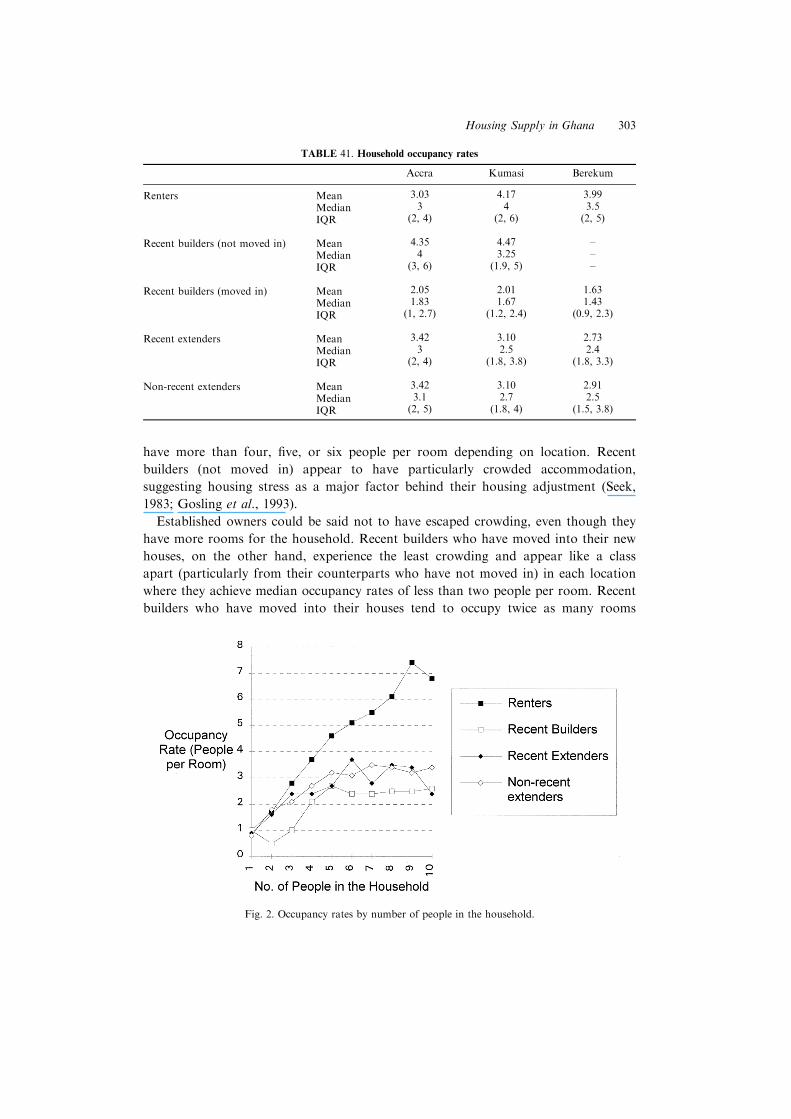
have more than four, ®ve, or six people per room depending on location. Recent
builders (not moved in) appear to have particularly crowded accommodation,
suggesting housing stress as a major factor behind their housing adjustment (Seek,
1983; Gosling et al., 1993).
Established owners could be said not to have escaped crowding, even though they
have more rooms for the household. Recent builders who have moved into their new
houses, on the other hand, experience the least crowding and appear like a class
apart (particularly from their counterparts who have not moved in) in each location
where they achieve median occupancy rates of less than two people per room. Recent
builders who have moved into their houses tend to occupy twice as many rooms
TABLE 41. Household occupancy rates
Accra Kumasi Berekum
Renters Mean 3.03 4.17 3.99
Median 3 4 3.5
IQR (2, 4) (2, 6) (2, 5)
Recent builders (not moved in) Mean 4.35 4.47 ±
Median 4 3.25 ±
IQR (3, 6) (1.9, 5) ±
Recent builders (moved in) Mean 2.05 2.01 1.63
Median 1.83 1.67 1.43
IQR (1, 2.7) (1.2, 2.4) (0.9, 2.3)
Recent extenders Mean 3.42 3.10 2.73
Median 3 2.5 2.4
IQR (2, 4) (1.8, 3.8) (1.8, 3.3)
Non-recent extenders Mean 3.42 3.10 2.91
Median 3.1 2.7 2.5
IQR (2, 5) (1.8, 4) (1.5, 3.8)
Fig. 2. Occupancy rates by number of people in the household.
Housing Supply in Ghana 303
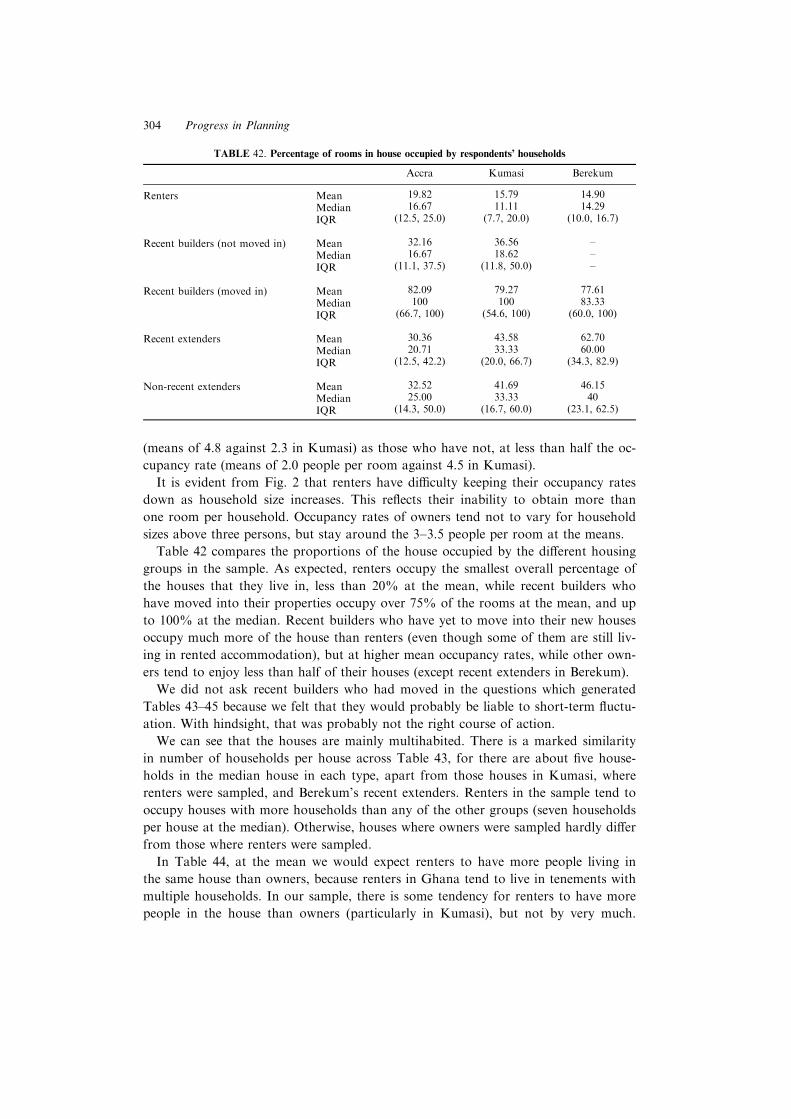
(means of 4.8 against 2.3 in Kumasi) as those who have not, at less than half the oc-
cupancy rate (means of 2.0 people per room against 4.5 in Kumasi).
It is evident from Fig. 2 that renters have di�culty keeping their occupancy rates
down as household size increases. This re¯ects their inability to obtain more than
one room per household. Occupancy rates of owners tend not to vary for household
sizes above three persons, but stay around the 3±3.5 people per room at the means.
Table 42 compares the proportions of the house occupied by the di�erent housing
groups in the sample. As expected, renters occupy the smallest overall percentage of
the houses that they live in, less than 20% at the mean, while recent builders who
have moved into their properties occupy over 75% of the rooms at the mean, and up
to 100% at the median. Recent builders who have yet to move into their new houses
occupy much more of the house than renters (even though some of them are still liv-
ing in rented accommodation), but at higher mean occupancy rates, while other own-
ers tend to enjoy less than half of their houses (except recent extenders in Berekum).
We did not ask recent builders who had moved in the questions which generated
Tables 43±45 because we felt that they would probably be liable to short-term ¯uctu-
ation. With hindsight, that was probably not the right course of action.
We can see that the houses are mainly multihabited. There is a marked similarity
in number of households per house across Table 43, for there are about ®ve house-
holds in the median house in each type, apart from those houses in Kumasi, where
renters were sampled, and Berekum's recent extenders. Renters in the sample tend to
occupy houses with more households than any of the other groups (seven households
per house at the median). Otherwise, houses where owners were sampled hardly di�er
from those where renters were sampled.
In Table 44, at the mean we would expect renters to have more people living in
the same house than owners, because renters in Ghana tend to live in tenements with
multiple households. In our sample, there is some tendency for renters to have more
people in the house than owners (particularly in Kumasi), but not by very much.
TABLE 42. Percentage of rooms in house occupied by respondents' households
Accra Kumasi Berekum
Renters Mean 19.82 15.79 14.90
Median 16.67 11.11 14.29
IQR (12.5, 25.0) (7.7, 20.0) (10.0, 16.7)
Recent builders (not moved in) Mean 32.16 36.56 ±
Median 16.67 18.62 ±
IQR (11.1, 37.5) (11.8, 50.0) ±
Recent builders (moved in) Mean 82.09 79.27 77.61
Median 100 100 83.33
IQR (66.7, 100) (54.6, 100) (60.0, 100)
Recent extenders Mean 30.36 43.58 62.70
Median 20.71 33.33 60.00
IQR (12.5, 42.2) (20.0, 66.7) (34.3, 82.9)
Non-recent extenders Mean 32.52 41.69 46.15
Median 25.00 33.33 40
IQR (14.3, 50.0) (16.7, 60.0) (23.1, 62.5)
304 Progress in Planning
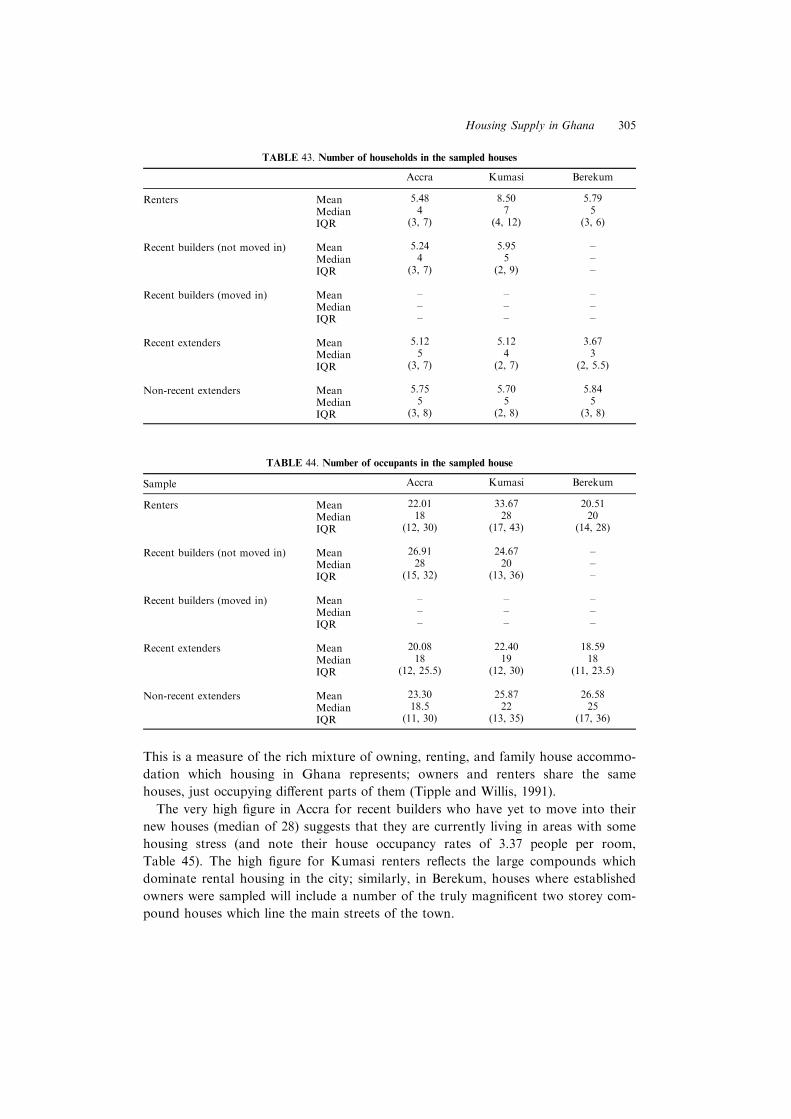
This is a measure of the rich mixture of owning, renting, and family house accommo-
dation which housing in Ghana represents; owners and renters share the same
houses, just occupying di�erent parts of them (Tipple and Willis, 1991).
The very high ®gure in Accra for recent builders who have yet to move into their
new houses (median of 28) suggests that they are currently living in areas with some
housing stress (and note their house occupancy rates of 3.37 people per room,
Table 45). The high ®gure for Kumasi renters re¯ects the large compounds which
dominate rental housing in the city; similarly, in Berekum, houses where established
owners were sampled will include a number of the truly magni®cent two storey com-
pound houses which line the main streets of the town.
TABLE 43. Number of households in the sampled houses
Accra Kumasi Berekum
Renters Mean 5.48 8.50 5.79
Median 4 7 5
IQR (3, 7) (4, 12) (3, 6)
Recent builders (not moved in) Mean 5.24 5.95 ±
Median 4 5 ±
IQR (3, 7) (2, 9) ±
Recent builders (moved in) Mean ± ± ±
Median ± ± ±
IQR ± ± ±
Recent extenders Mean 5.12 5.12 3.67
Median 5 4 3
IQR (3, 7) (2, 7) (2, 5.5)
Non-recent extenders Mean 5.75 5.70 5.84
Median 5 5 5
IQR (3, 8) (2, 8) (3, 8)
TABLE 44. Number of occupants in the sampled house
Sample Accra Kumasi Berekum
Renters Mean 22.01 33.67 20.51
Median 18 28 20
IQR (12, 30) (17, 43) (14, 28)
Recent builders (not moved in) Mean 26.91 24.67 ±
Median 28 20 ±
IQR (15, 32) (13, 36) ±
Recent builders (moved in) Mean ± ± ±
Median ± ± ±
IQR ± ± ±
Recent extenders Mean 20.08 22.40 18.59
Median 18 19 18
IQR (12, 25.5) (12, 30) (11, 23.5)
Non-recent extenders Mean 23.30 25.87 26.58
Median 18.5 22 25
IQR (11, 30) (13, 35) (17, 36)
Housing Supply in Ghana 305
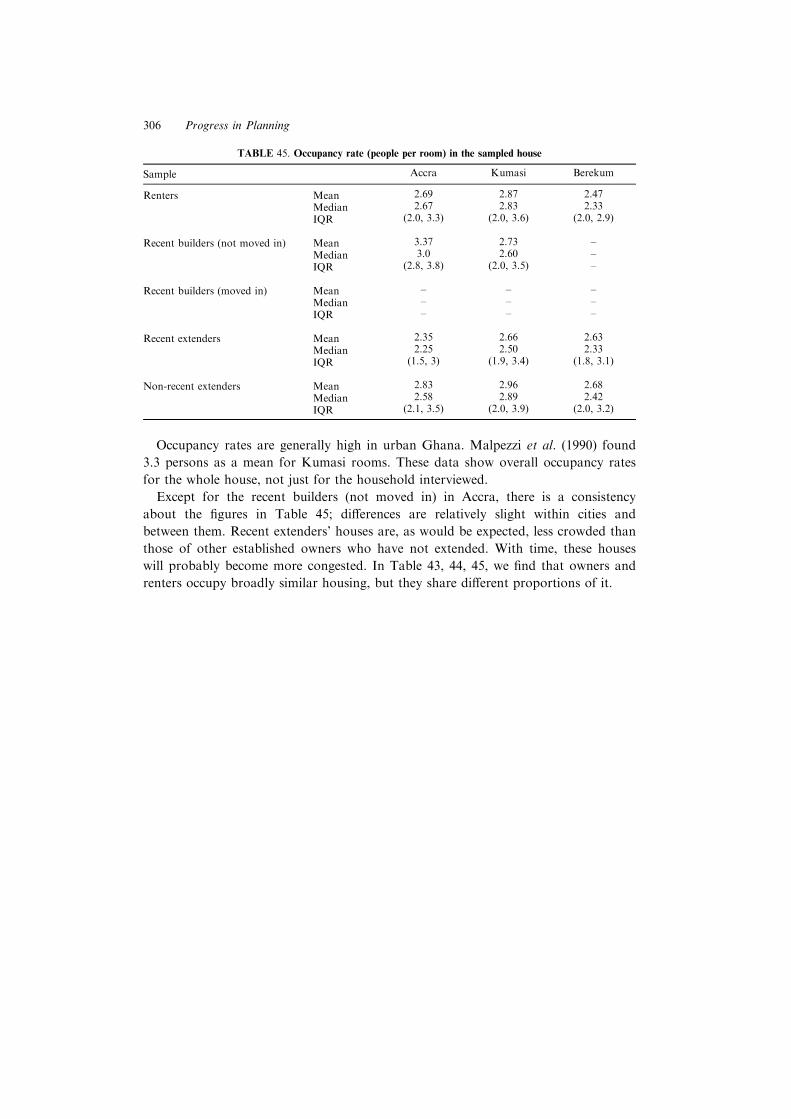
Occupancy rates are generally high in urban Ghana. Malpezzi et al. (1990) found
3.3 persons as a mean for Kumasi rooms. These data show overall occupancy rates
for the whole house, not just for the household interviewed.
Except for the recent builders (not moved in) in Accra, there is a consistency
about the ®gures in Table 45; di�erences are relatively slight within cities and
between them. Recent extenders' houses are, as would be expected, less crowded than
those of other established owners who have not extended. With time, these houses
will probably become more congested. In Table 43, 44, 45, we ®nd that owners and
renters occupy broadly similar housing, but they share di�erent proportions of it.
TABLE 45. Occupancy rate (people per room) in the sampled house
Sample Accra Kumasi Berekum
Renters Mean 2.69 2.87 2.47
Median 2.67 2.83 2.33
IQR (2.0, 3.3) (2.0, 3.6) (2.0, 2.9)
Recent builders (not moved in) Mean 3.37 2.73 ±
Median 3.0 2.60 ±
IQR (2.8, 3.8) (2.0, 3.5) ±
Recent builders (moved in) Mean ± ± ±
Median ± ± ±
IQR ± ± ±
Recent extenders Mean 2.35 2.66 2.63
Median 2.25 2.50 2.33
IQR (1.5, 3) (1.9, 3.4) (1.8, 3.1)
Non-recent extenders Mean 2.83 2.96 2.68
Median 2.58 2.89 2.42
IQR (2.1, 3.5) (2.0, 3.9) (2.0, 3.2)
306 Progress in Planning
CHAPTER 4
The route to ownership
4.1. REASONS AND PROBLEMS IN THE BUILDING PROCESS
4.1.1. Reasons for building
We asked recent builders to rank four reasons why they built their own house and
renters why they would like to own a house. First choice scored four, second choice
scored three, and so on (Table 46).
As Korboe (1993a) asserts and our data show, the chief reason for owning housing
in Ghana is for future security. This probably has little to do with a fear of eviction
from a rented room, although evictions do now occur. The mean length of stay in
the house for renters in our previous study of Kumasi in 1986 was 11 years
(Malpezzi et al., 1990) and HUDA (1990) found that 90% of tenants in Accra had
lengths of stay of more than 7 years. More probably, the security about which con-
cern is expressed is for the next generation, as the main cultures in Ghana have a
strong sense of continuity through generations and duties to those following on. As
urban housing has been historically di�cult to obtain, this generation feels obligated
to assist the next in their accommodation.
Rental income, both in the saving and the earning, is not a great motivating factor
in the decision to move from renting to owning. As we have seen above, rents are so
low in comparison to the cost of building that there are few illusions about the bur-
den imposed on the renter or the potential income bene®ts for the owner. However,
Accra respondents valued the saving and earning of rents more highly than the
others, probably a sign that they perceive rents to be nearer the cost of ownership
there. Status, which was undoubtedly important in the past (Tipple and Willis,
1992a), appears to be the least of the four in importance in Accra (it is reportedly
less important to renters than recent builders), but more important than rental
income in Kumasi and Berekum. There may be some interviewer bias in these data;
the gaining of status may be the least acceptable of the four motives to admit.
4.1.2. Reasons for extending
We asked recent extenders to rank four reasons why they extended their house and
non-recent extenders why they would like to extend their house (Tables 47 and 48).
First choice scored four, second choice scored three, and so on.
Housing Supply in Ghana 307
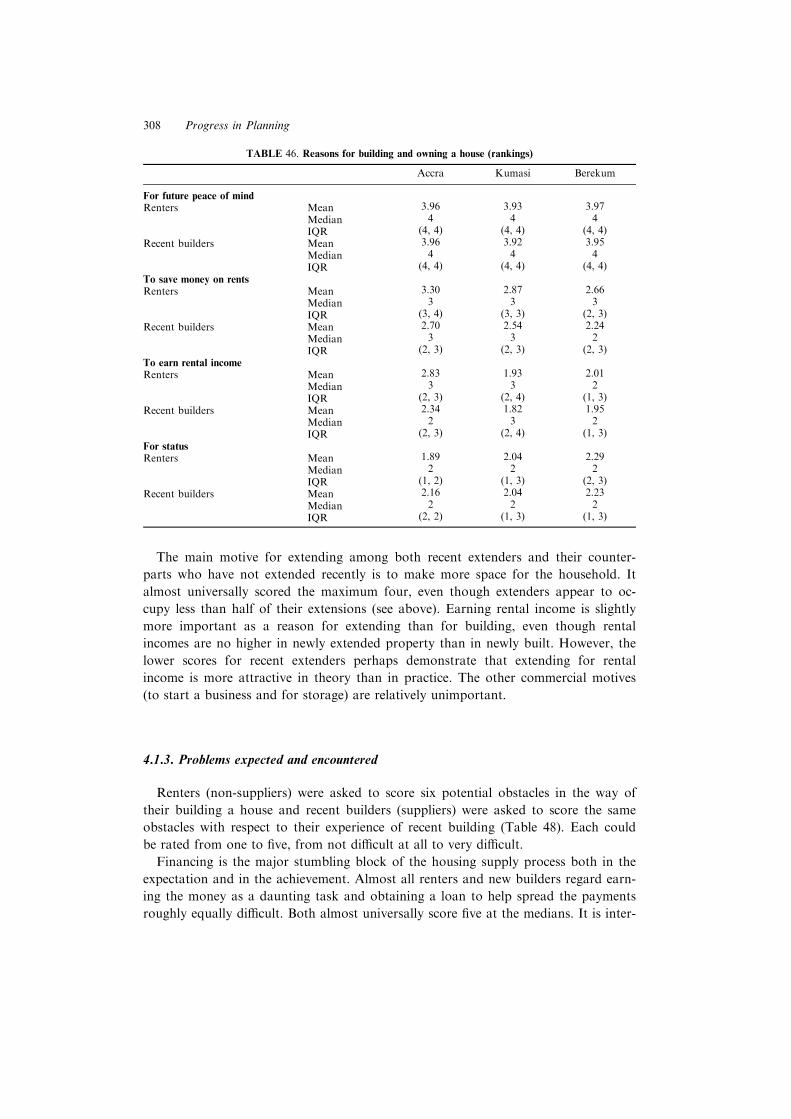
The main motive for extending among both recent extenders and their counter-
parts who have not extended recently is to make more space for the household. It
almost universally scored the maximum four, even though extenders appear to oc-
cupy less than half of their extensions (see above). Earning rental income is slightly
more important as a reason for extending than for building, even though rental
incomes are no higher in newly extended property than in newly built. However, the
lower scores for recent extenders perhaps demonstrate that extending for rental
income is more attractive in theory than in practice. The other commercial motives
(to start a business and for storage) are relatively unimportant.
4.1.3. Problems expected and encountered
Renters (non-suppliers) were asked to score six potential obstacles in the way of
their building a house and recent builders (suppliers) were asked to score the same
obstacles with respect to their experience of recent building (Table 48). Each could
be rated from one to ®ve, from not di�cult at all to very di�cult.
Financing is the major stumbling block of the housing supply process both in the
expectation and in the achievement. Almost all renters and new builders regard earn-
ing the money as a daunting task and obtaining a loan to help spread the payments
roughly equally di�cult. Both almost universally score ®ve at the medians. It is inter-
TABLE 46. Reasons for building and owning a house (rankings)
Accra Kumasi Berekum
For future peace of mindRenters Mean 3.96 3.93 3.97
Median 4 4 4
IQR (4, 4) (4, 4) (4, 4)
Recent builders Mean 3.96 3.92 3.95
Median 4 4 4
IQR (4, 4) (4, 4) (4, 4)
To save money on rentsRenters Mean 3.30 2.87 2.66
Median 3 3 3
IQR (3, 4) (3, 3) (2, 3)
Recent builders Mean 2.70 2.54 2.24
Median 3 3 2
IQR (2, 3) (2, 3) (2, 3)
To earn rental incomeRenters Mean 2.83 1.93 2.01
Median 3 3 2
IQR (2, 3) (2, 4) (1, 3)
Recent builders Mean 2.34 1.82 1.95
Median 2 3 2
IQR (2, 3) (2, 4) (1, 3)
For statusRenters Mean 1.89 2.04 2.29
Median 2 2 2
IQR (1, 2) (1, 3) (2, 3)
Recent builders Mean 2.16 2.04 2.23
Median 2 2 2
IQR (2, 2) (1, 3) (1, 3)
308 Progress in Planning
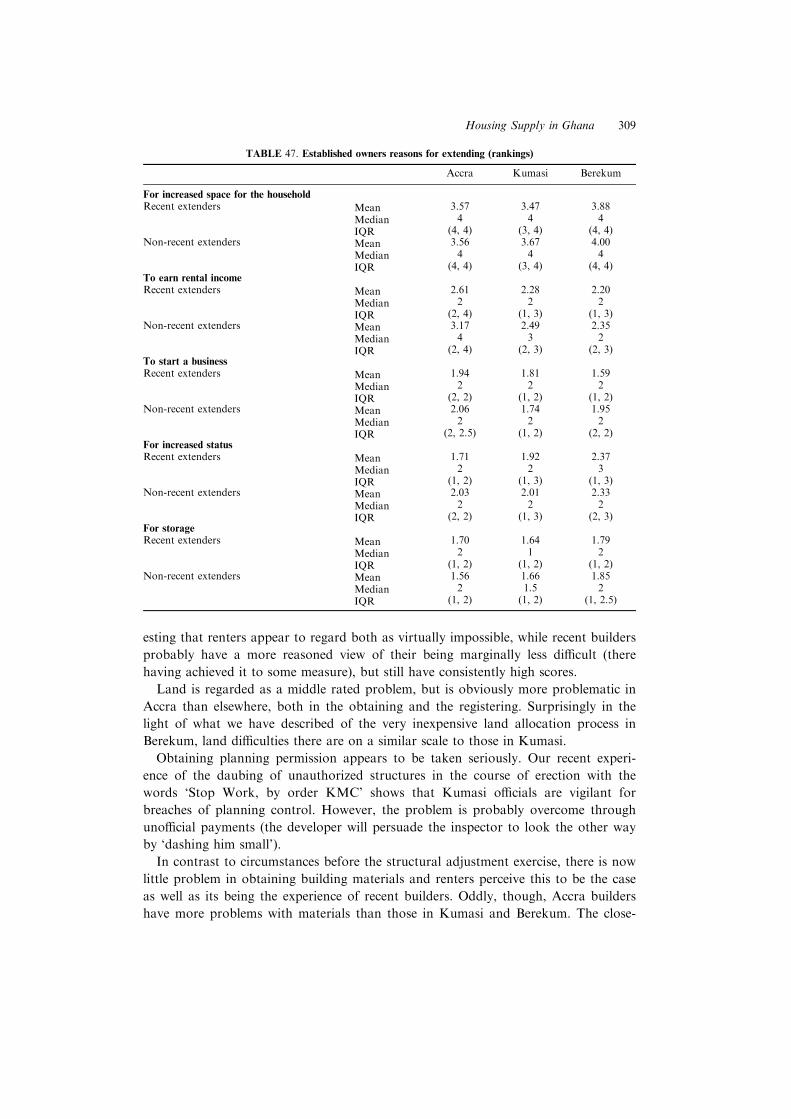
esting that renters appear to regard both as virtually impossible, while recent builders
probably have a more reasoned view of their being marginally less di�cult (there
having achieved it to some measure), but still have consistently high scores.
Land is regarded as a middle rated problem, but is obviously more problematic in
Accra than elsewhere, both in the obtaining and the registering. Surprisingly in the
light of what we have described of the very inexpensive land allocation process in
Berekum, land di�culties there are on a similar scale to those in Kumasi.
Obtaining planning permission appears to be taken seriously. Our recent experi-
ence of the daubing of unauthorized structures in the course of erection with the
words `Stop Work, by order KMC' shows that Kumasi o�cials are vigilant for
breaches of planning control. However, the problem is probably overcome through
uno�cial payments (the developer will persuade the inspector to look the other way
by `dashing him small').
In contrast to circumstances before the structural adjustment exercise, there is now
little problem in obtaining building materials and renters perceive this to be the case
as well as its being the experience of recent builders. Oddly, though, Accra builders
have more problems with materials than those in Kumasi and Berekum. The close-
TABLE 47. Established owners reasons for extending (rankings)
Accra Kumasi Berekum
For increased space for the householdRecent extenders Mean 3.57 3.47 3.88
Median 4 4 4
IQR (4, 4) (3, 4) (4, 4)Non-recent extenders Mean 3.56 3.67 4.00
Median 4 4 4
IQR (4, 4) (3, 4) (4, 4)To earn rental incomeRecent extenders Mean 2.61 2.28 2.20
Median 2 2 2
IQR (2, 4) (1, 3) (1, 3)Non-recent extenders Mean 3.17 2.49 2.35
Median 4 3 2
IQR (2, 4) (2, 3) (2, 3)To start a businessRecent extenders Mean 1.94 1.81 1.59
Median 2 2 2
IQR (2, 2) (1, 2) (1, 2)Non-recent extenders Mean 2.06 1.74 1.95
Median 2 2 2
IQR (2, 2.5) (1, 2) (2, 2)For increased statusRecent extenders Mean 1.71 1.92 2.37
Median 2 2 3
IQR (1, 2) (1, 3) (1, 3)Non-recent extenders Mean 2.03 2.01 2.33
Median 2 2 2
IQR (2, 2) (1, 3) (2, 3)For storageRecent extenders Mean 1.70 1.64 1.79
Median 2 1 2
IQR (1, 2) (1, 2) (1, 2)Non-recent extenders Mean 1.56 1.66 1.85
Median 2 1.5 2
IQR (1, 2) (1, 2) (1, 2.5)
Housing Supply in Ghana 309
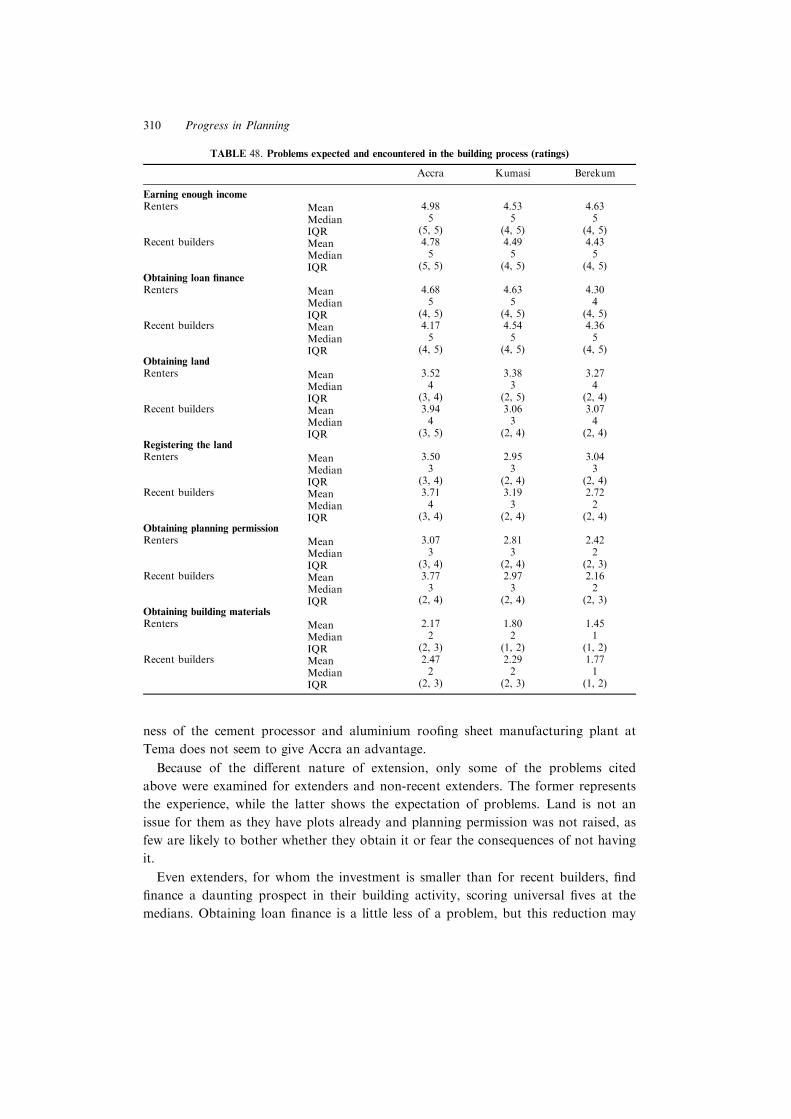
ness of the cement processor and aluminium roo®ng sheet manufacturing plant at
Tema does not seem to give Accra an advantage.
Because of the di�erent nature of extension, only some of the problems cited
above were examined for extenders and non-recent extenders. The former represents
the experience, while the latter shows the expectation of problems. Land is not an
issue for them as they have plots already and planning permission was not raised, as
few are likely to bother whether they obtain it or fear the consequences of not having
it.
Even extenders, for whom the investment is smaller than for recent builders, ®nd
®nance a daunting prospect in their building activity, scoring universal ®ves at the
medians. Obtaining loan ®nance is a little less of a problem, but this reduction may
TABLE 48. Problems expected and encountered in the building process (ratings)
Accra Kumasi Berekum
Earning enough incomeRenters Mean 4.98 4.53 4.63
Median 5 5 5
IQR (5, 5) (4, 5) (4, 5)Recent builders Mean 4.78 4.49 4.43
Median 5 5 5
IQR (5, 5) (4, 5) (4, 5)Obtaining loan ®nanceRenters Mean 4.68 4.63 4.30
Median 5 5 4
IQR (4, 5) (4, 5) (4, 5)Recent builders Mean 4.17 4.54 4.36
Median 5 5 5
IQR (4, 5) (4, 5) (4, 5)Obtaining landRenters Mean 3.52 3.38 3.27
Median 4 3 4
IQR (3, 4) (2, 5) (2, 4)Recent builders Mean 3.94 3.06 3.07
Median 4 3 4
IQR (3, 5) (2, 4) (2, 4)Registering the landRenters Mean 3.50 2.95 3.04
Median 3 3 3
IQR (3, 4) (2, 4) (2, 4)Recent builders Mean 3.71 3.19 2.72
Median 4 3 2
IQR (3, 4) (2, 4) (2, 4)Obtaining planning permissionRenters Mean 3.07 2.81 2.42
Median 3 3 2
IQR (3, 4) (2, 4) (2, 3)Recent builders Mean 3.77 2.97 2.16
Median 3 3 2
IQR (2, 4) (2, 4) (2, 3)Obtaining building materialsRenters Mean 2.17 1.80 1.45
Median 2 2 1
IQR (2, 3) (1, 2) (1, 2)Recent builders Mean 2.47 2.29 1.77
Median 2 2 1
IQR (2, 3) (2, 3) (1, 2)
310 Progress in Planning
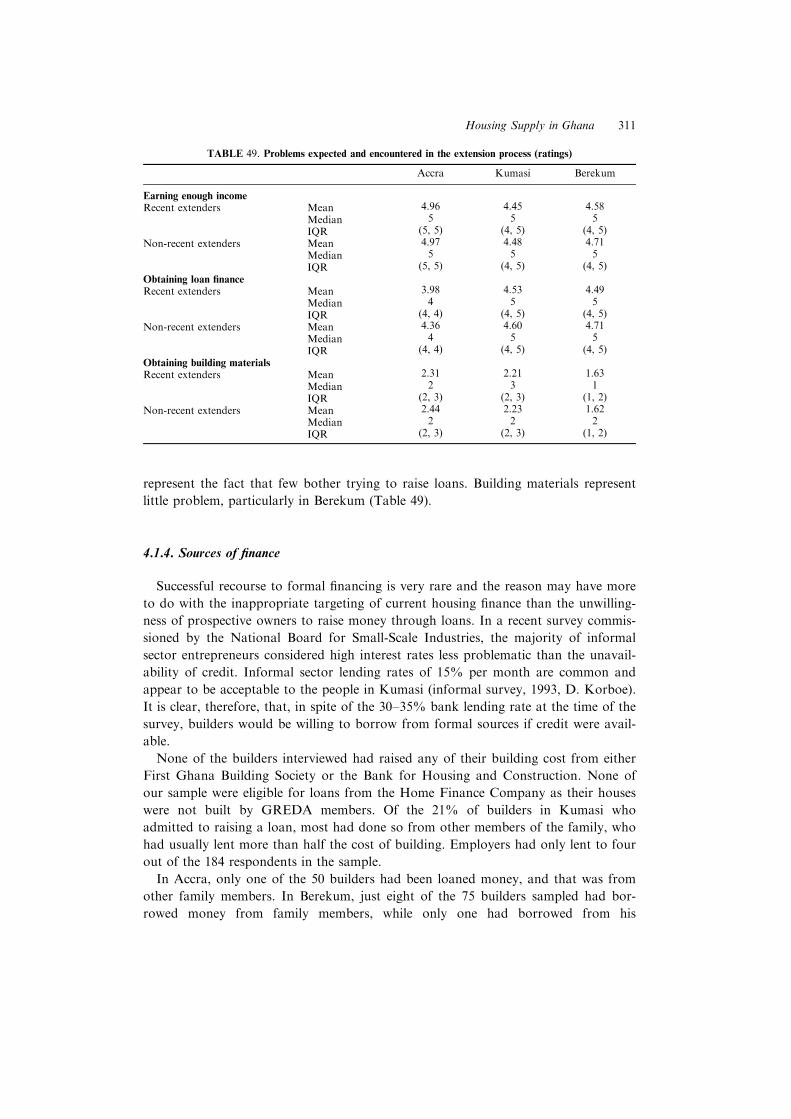
represent the fact that few bother trying to raise loans. Building materials represent
little problem, particularly in Berekum (Table 49).
4.1.4. Sources of ®nance
Successful recourse to formal ®nancing is very rare and the reason may have more
to do with the inappropriate targeting of current housing ®nance than the unwilling-
ness of prospective owners to raise money through loans. In a recent survey commis-
sioned by the National Board for Small-Scale Industries, the majority of informal
sector entrepreneurs considered high interest rates less problematic than the unavail-
ability of credit. Informal sector lending rates of 15% per month are common and
appear to be acceptable to the people in Kumasi (informal survey, 1993, D. Korboe).
It is clear, therefore, that, in spite of the 30±35% bank lending rate at the time of the
survey, builders would be willing to borrow from formal sources if credit were avail-
able.
None of the builders interviewed had raised any of their building cost from either
First Ghana Building Society or the Bank for Housing and Construction. None of
our sample were eligible for loans from the Home Finance Company as their houses
were not built by GREDA members. Of the 21% of builders in Kumasi who
admitted to raising a loan, most had done so from other members of the family, who
had usually lent more than half the cost of building. Employers had only lent to four
out of the 184 respondents in the sample.
In Accra, only one of the 50 builders had been loaned money, and that was from
other family members. In Berekum, just eight of the 75 builders sampled had bor-
rowed money from family members, while only one had borrowed from his
TABLE 49. Problems expected and encountered in the extension process (ratings)
Accra Kumasi Berekum
Earning enough incomeRecent extenders Mean 4.96 4.45 4.58
Median 5 5 5
IQR (5, 5) (4, 5) (4, 5)
Non-recent extenders Mean 4.97 4.48 4.71
Median 5 5 5
IQR (5, 5) (4, 5) (4, 5)
Obtaining loan ®nanceRecent extenders Mean 3.98 4.53 4.49
Median 4 5 5
IQR (4, 4) (4, 5) (4, 5)
Non-recent extenders Mean 4.36 4.60 4.71
Median 4 5 5
IQR (4, 4) (4, 5) (4, 5)
Obtaining building materialsRecent extenders Mean 2.31 2.21 1.63
Median 2 3 1
IQR (2, 3) (2, 3) (1, 2)
Non-recent extenders Mean 2.44 2.23 1.62
Median 2 2 2
IQR (2, 3) (2, 3) (1, 2)
Housing Supply in Ghana 311
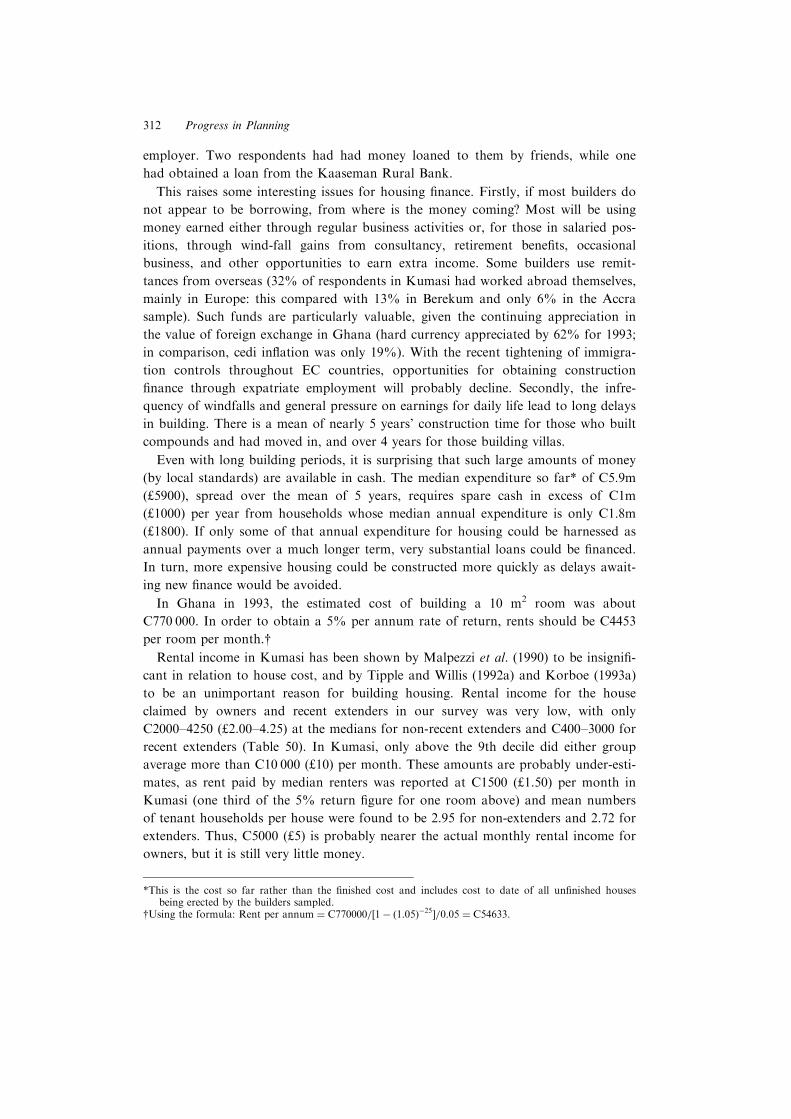
employer. Two respondents had had money loaned to them by friends, while one
had obtained a loan from the Kaaseman Rural Bank.
This raises some interesting issues for housing ®nance. Firstly, if most builders do
not appear to be borrowing, from where is the money coming? Most will be using
money earned either through regular business activities or, for those in salaried pos-
itions, through wind-fall gains from consultancy, retirement bene®ts, occasional
business, and other opportunities to earn extra income. Some builders use remit-
tances from overseas (32% of respondents in Kumasi had worked abroad themselves,
mainly in Europe: this compared with 13% in Berekum and only 6% in the Accra
sample). Such funds are particularly valuable, given the continuing appreciation in
the value of foreign exchange in Ghana (hard currency appreciated by 62% for 1993;
in comparison, cedi in¯ation was only 19%). With the recent tightening of immigra-
tion controls throughout EC countries, opportunities for obtaining construction
®nance through expatriate employment will probably decline. Secondly, the infre-
quency of windfalls and general pressure on earnings for daily life lead to long delays
in building. There is a mean of nearly 5 years' construction time for those who built
compounds and had moved in, and over 4 years for those building villas.
Even with long building periods, it is surprising that such large amounts of money
(by local standards) are available in cash. The median expenditure so far* of C5.9m
(£5900), spread over the mean of 5 years, requires spare cash in excess of C1m
(£1000) per year from households whose median annual expenditure is only C1.8m
(£1800). If only some of that annual expenditure for housing could be harnessed as
annual payments over a much longer term, very substantial loans could be ®nanced.
In turn, more expensive housing could be constructed more quickly as delays await-
ing new ®nance would be avoided.
In Ghana in 1993, the estimated cost of building a 10 m2 room was about
C770 000. In order to obtain a 5% per annum rate of return, rents should be C4453
per room per month.{Rental income in Kumasi has been shown by Malpezzi et al. (1990) to be insigni®-
cant in relation to house cost, and by Tipple and Willis (1992a) and Korboe (1993a)
to be an unimportant reason for building housing. Rental income for the house
claimed by owners and recent extenders in our survey was very low, with only
C2000±4250 (£2.00±4.25) at the medians for non-recent extenders and C400±3000 for
recent extenders (Table 50). In Kumasi, only above the 9th decile did either group
average more than C10 000 (£10) per month. These amounts are probably under-esti-
mates, as rent paid by median renters was reported at C1500 (£1.50) per month in
Kumasi (one third of the 5% return ®gure for one room above) and mean numbers
of tenant households per house were found to be 2.95 for non-extenders and 2.72 for
extenders. Thus, C5000 (£5) is probably nearer the actual monthly rental income for
owners, but it is still very little money.
*This is the cost so far rather than the ®nished cost and includes cost to date of all un®nished housesbeing erected by the builders sampled.
{Using the formula: Rent per annum � C770000=�1ÿ �1:05�ÿ25�=0:05 � C54633.
312 Progress in Planning
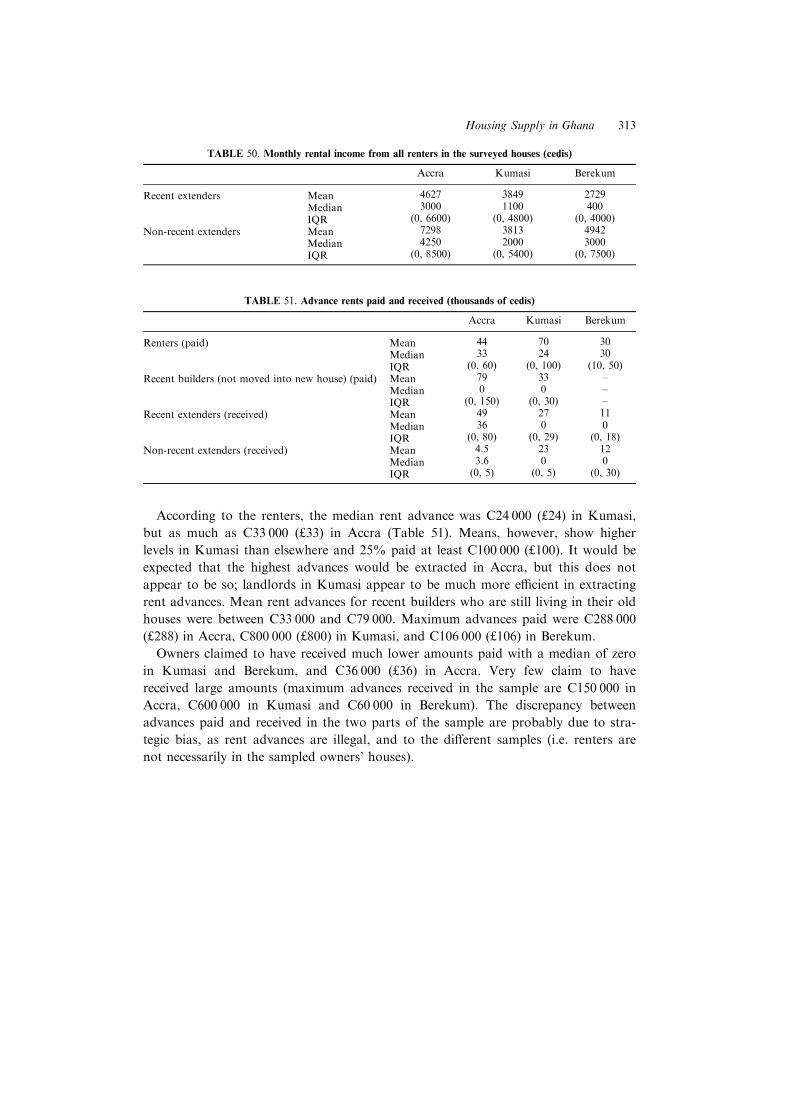
According to the renters, the median rent advance was C24 000 (£24) in Kumasi,
but as much as C33 000 (£33) in Accra (Table 51). Means, however, show higher
levels in Kumasi than elsewhere and 25% paid at least C100 000 (£100). It would be
expected that the highest advances would be extracted in Accra, but this does not
appear to be so; landlords in Kumasi appear to be much more e�cient in extracting
rent advances. Mean rent advances for recent builders who are still living in their old
houses were between C33 000 and C79 000. Maximum advances paid were C288 000
(£288) in Accra, C800 000 (£800) in Kumasi, and C106 000 (£106) in Berekum.
Owners claimed to have received much lower amounts paid with a median of zero
in Kumasi and Berekum, and C36 000 (£36) in Accra. Very few claim to have
received large amounts (maximum advances received in the sample are C150 000 in
Accra, C600 000 in Kumasi and C60 000 in Berekum). The discrepancy between
advances paid and received in the two parts of the sample are probably due to stra-
tegic bias, as rent advances are illegal, and to the di�erent samples (i.e. renters are
not necessarily in the sampled owners' houses).
TABLE 50. Monthly rental income from all renters in the surveyed houses (cedis)
Accra Kumasi Berekum
Recent extenders Mean 4627 3849 2729
Median 3000 1100 400
IQR (0, 6600) (0, 4800) (0, 4000)
Non-recent extenders Mean 7298 3813 4942
Median 4250 2000 3000
IQR (0, 8500) (0, 5400) (0, 7500)
TABLE 51. Advance rents paid and received (thousands of cedis)
Accra Kumasi Berekum
Renters (paid) Mean 44 70 30
Median 33 24 30
IQR (0, 60) (0, 100) (10, 50)
Recent builders (not moved into new house) (paid) Mean 79 33 ±
Median 0 0 ±
IQR (0, 150) (0, 30) ±
Recent extenders (received) Mean 49 27 11
Median 36 0 0
IQR (0, 80) (0, 29) (0, 18)
Non-recent extenders (received) Mean 4.5 23 12
Median 3.6 0 0
IQR (0, 5) (0, 5) (0, 30)
Housing Supply in Ghana 313

CHAPTER 5
Summary, conclusions and recommendations
5.1. SUMMARY OF FINDINGS
Our study of three urban areas in Ghana was designed to cast light onto the cur-
rent housing supply process in the capital, a large provincial city and a town to
demonstrate the housing process which is providing the bulk of new housing for
ordinary (poor) Ghanaians. In the absence of squatting in all but a few areas with
special circumstances, the poor must ®nd housing through the quasi-legal process of
building on allocated plots with more or less permanent materials.
The complexity and pitfalls of the land allocation system, particularly in Accra,
leads to long delays in development and inevitable clouding of titles. The current
land registration should alleviate most of that problem over the next decade. More
serious, however, is the lack of any formal ®nances available to would-be house-own-
ers or current house-owners wishing to extend. Incomes from rents are also insu�-
cient to cover the costs of building, even with the increased net present value
provided through exacting many months of rent in advance. The supply of infra-
structure lags far behind house building and many of our sample had no mains ser-
vices except electricity. There is extensive use of public stand pipes and latrines.
Renters pay low rents for which they gain little housing in return. However, the
rising incidence of rent advance payments means that they require access to capital.
Unexpectedly, renters in Accra have had less need to pay advances than those in
Kumasi and Berekum, rather denting the image of rapacious Accra landlords which
is nurtured in the local press. Renter household incomes are lower than those of
owners, but their per capita incomes are higher, owing to smaller households. They
are, as expected, younger and have smaller households than owners. They tend to oc-
cupy single rooms in multihabited houses, sharing what few bathrooms and toilets
that are available in the house, or relying on public taps and latrines.
The house-owners in our sample tend to have quite large households (medians of
6±10 persons, which are about twice as large as renter households) with substantial
pressures to accommodate extended family (abusua) members in the household. They
are by no means the rich elite which might be expected. The median household
incomes of owner subsamples in the three locations vary between C1.3m and C1.8m
per annum (£1300 and £1800), median per capita incomes vary within the range of
C161 000±C270 000 (£161±270), neither of which can be regarded as representing
high incomes. The income pro®les show no evidence that recent builders are weal-
thier than established owners; indeed, their per capita incomes tend to be lower than
those of renters even when adjustments are made to remove single person renter
Housing Supply in Ghana 315
households from the calculations. However, recent builders do demonstrate increased
wealth in one way; they appear to possess more consumer durables (shown in a
higher RWI score) than other owners. It is interesting that, in general, owners in
Kumasi have higher RWI scores than owners elsewhere.
House ownership is the preserve of the middle-aged in Ghana; recent builders aver-
age over 45. In discussing the question ``Why not save in advance?'', Diamond and
Lea (1995) identify the wish to acquire a house sooner rather than later as one of the
most important reasons why housing loans are bene®cial over the saving in advance
option. In Ghana we are witnessing the outcome of an absence of such opportunities
to borrow as we see the age and long record of city living which characterize even
new owners.
The houses that are being built tend to be quite large with medians of 5±10 rooms.
Berekum has substantially larger houses than the two cities, probably because the
lower standard of ®nishes and ®ttings there allows more rooms to be built for the
same money. Lower income recent builders are more likely to build compound
houses which are cheaper per room than villas. From a lower resource base, com-
pound builders complete more rooms (mean of 5.6) than builders of villas or apart-
ment blocks (mean of 4.8 rooms), taking about 6 years to complete the work.
Extensions average three rooms in Accra and Kumasi, but six in Berekum. In the
two cities, less than half of the extension tends to be occupied by the owner's house-
hold, while the rest is rented out or let rent-free to family members (in the proportion
of 2:1). Those in Berekum tend to be occupied chie¯y by the owner household.
Extenders who use their new rooms tend to have slightly reduced housing stress,
though their larger households cancel out much of the bene®t of the extra rooms.
However, extenders who have not moved in to their extensions tend to have large
houses and high per capita incomes, so they may represent an a�uent and ambitious
sub-sample rather than owners who are desperate for more room.
The cost of houses built recently in Kumasi has a median of C5.9m (£5900) and a
mean of C7m (£7000), but varies between house type. Compounds in Kumasi cost
C3.4±5.4m (£3400±5400) at the medians for owner sub-samples, while villas tend to
be between C10m and C11.7m (£10 000±11 700) at the medians. The costs per room
of villas (with a mean of C1.7m, £1700) tends to be at least twice that of compounds
(only C680 000, £680) which are simpler structures and have lower standards of ser-
vices, ®ttings and ®nishes. The portion of the house occupied by the owner costs a
mean of C6m (£6000). Houses in Berekum are about 45% cheaper than in Kumasi.
These costs compare very favourably with formal sector housing for sale.
Mean house cost to income ratio is above four in Kumasi, but owner households
occupy portions costing about three times annual income. As expected, house cost to
income ratios decline as income rises.
The houses in the sample di�er in service provision from those in the general
population in their poorer supply of toilets and water, probably owing to their gener-
ally peripheral locations. Those in Accra are particularly badly provided. There is
some evidence that recent builders have provided more services than those who built
in the past; twice as many houses have taps and their relative service indexes are
much higher. Recent extenders have poorer services than non-recent extenders, except
316 Progress in Planning
in Berekum. In Accra, the di�erence is very marked with a ®fth as many taps per
house.
Owners have considerably more rooms than renters and recent builders have more
rooms than other owners. Recent extenders bene®t from more rooms than non-recent
extenders in Kumasi and Berekum, but not in Accra. Larger households have only
marginally more rooms than small ones within each ownership category, the number
of rooms occupied is mostly dependent on ownership. Occupancy rates follow a simi-
lar pattern, with owners having lower rates than renters and recent builders having
the lowest of all. However, the slight advantage which extenders have in rooms is not
re¯ected in occupancy rates, as their larger households ®ll up the extra space avail-
able. Nor do recent extenders occupy more of the house than their non-extending
peers. However, recent builders enjoy the lion's share of their houses. The houses in
the sample have many occupants with medians ranging from 18 to 28.
Future peace of mind is the most important reason for building, both for those
who look forward to doing so and those who have recently completed the task.
Rental income is a minor consideration. Extensions are mainly undertaken to provide
more room for the household; rents and other economic considerations are less im-
portant.
Formal ®nancial sources are little used in the construction of houses in Ghana and
rental incomes will not pay o� the investment in any reasonable period. Thus, the
housing market appears to operate outside the formal economic system. Building
from cash savings creates problems of continuity of construction and elongates the
development period to more than 5 years in most cases. In the absence of a formal
®nancing system, the house construction achieved by relatively low income house-
holds is very impressive.
5.2. CONCLUSIONS
5.2.1. Incremental building
There seems to be su�cient evidence from the surveys to suggest that many of the
extensions which are being built are actually part of a very protracted incremental
building process, between the phases of which many years may elapse. In the past,
we have believed that the horizontal phasing of buildings, with foundations for a
large building being followed at intervals by its walls, roof, doors and windows, etc.,
until completion, represented the full extent of incrementalism in the construction
process in Ghana. This, however, appears not to be so. Parallel with this horizontal
phasing, we now ®nd a vertical phasing where major parts of the building comprise
interlinked projects towards a very large ®nal product.
There appears, therefore, to be a potential for improving the e�ciency of the con-
struction process by assisting construction of houses in discrete and manageable
phases. Encouraging owners to construct in smaller, cheaper phases (especially in the
earliest one) is likely to reduce the timelag between the beginning of investment and
consumption (occupation) which is currently 5 years on average. In addition, steps
Housing Supply in Ghana 317
should be taken to ensure that mains services are available at an early stage in con-
struction and occupation.
5.2.2. Owners tend to be a little better o� than renters
The di�erences between owners and renters follow the expected directions, showing
that owners tend to be a little better o�. Recent builders' per capita incomes ®t in
between those of renters and other owners. However, neither established owners nor
recent builders are a rich elite and are, therefore, likely to be helped by policy to pro-
duce considerable proportions of the housing required by ordinary, poor, people in
urban Ghana.
5.2.3. Recent builders are not wealthier than others
While the di�erences between owners and renters, recent builders and established
owners, and recent extenders and non-extenders are much as expected in direction,
they are less marked than, perhaps, would be expected. The di�erences in income
between owners and renters, and between recent builders and other owners, are
much less marked than might be expected, given that houses tend to be built from
cash and savings in the absence of a readily available housing ®nance system.
5.2.4. Recent extenders are not wealthier than non-recent extenders
Recent extenders have larger households than others, but their incomes are not
higher than their non-extending peers. Indeed, their per capita incomes are lower.
Household incomes do not seem to in¯uence whether extensions are made, but, once
the decision is taken, do in¯uence the amount of money spent on extensions. The in-
¯uential variable in this regard is the amount that a household's income exceeds that
of others in the area.
5.3. POLICY RECOMMENDATIONS
5.3.1. Finance
The most important mechanism for improving housing supply is undoubtedly a
source of ®nance. It is lack of ®nance which most impedes the rapid completion of
houses, and which delays their start until late in a person's life. The ability to borrow
over a long period for house construction and extension is undoubtedly a felt need
among suppliers and potential suppliers of housing in Ghana.
318 Progress in Planning
5.3.1.1. Finance for new house construction. Credit ®nance in general and housing®nance in particular are not well provided for in Ghana; indeed most people keeptheir money as cash or goods, rather than depositing it in banks or other formal®nance houses. The recent innovation of the Home Finance Company completelymisses the target of low to medium income households developing buildings in mostareas of the towns and cities of Ghana. Thus, the vast majority of builders must stilluse the cash in their wallet, so to speak, for buying leases on land and paying ma-terial suppliers, artisans and service agencies.
We have seen that the median builder-household currently has an income (in 1993
prices) of under C2m (£2000) per annum and is building 5±10 rooms costing about
C6m (£6000). Thus, loans of C3±8m (£3000±8000) at 1993 prices would su�ce to
help ®nancing the great majority of houses found in our survey. There would appear
to be no reason for reducing interest rates below those prevailing in the banking mar-
ket, as the house cost to income ratio is only about three, so does not constitute
exceptional levels of housing investment. The loans should be released in stages for
purchase of land lease, and ®nancing the various stages of building in order to reduce
the debt burden to a minimum during the building process.
Securing the loan on the land and then the buildings in the manner current in
most countries would make sense. However, it would require some fundamental
changes in the way land is regarded. Currently, traditionally leased land (the continu-
ation of which we would not wish to threaten) cannot act as collateral on loans
because the land itself does not technically belong to the occupier but the local com-
munity.* There is a need for some way to maintain the integrity of the community-
control of land, while allowing loans agencies some solid collateral. Research on
other means of securing housing loans is urgently required.
5.3.1.2. Finance for extensions. It is probable that ®nancial assistance for extensions,in the form of market rate loans of C1-2m, would assist all owners wishing to extend.Currently, almost no ®nance is targeted at house extenders and there are no tax, orother ®nancial incentives to add rooms. As rents are also very low, the anticipationof future income is not an important factor in extension activity. However, the con-tribution of extensions to the housing supply is undoubtedly very worthwhile andshould be encouraged by housing ®nance policy.
5.3.2. Land
As we have seen above, there is a need to develop mechanisms in the land tenure
system which allow either undeveloped plots of land or the buildings on land to act
as collateral against housing loans. We recognise that the non-marketability of land
is important to the social cohesion of Ghana's urban people. Thus, the outright own-
ership required in raising collateral on land could damage the community's long-term
ability to regain the allodial rights to land alienated to an unsuccessful builder and
then forfeited to a loaning agency. However, it is unlikely that a ®nance system that
*It is only the right of surface user that has been alienated to the plot holder.
Housing Supply in Ghana 319
is so sorely needed will develop without forms of collateral on ®xed property accepta-
ble both to the traditionalists in the community and to formal ®nancial agencies. We
propose, therefore, that this is a topic for urgent research by institutions such as the
Land Administration Research Centre (LARC) at UST, Kumasi.
5.3.3. The construction and building materials industries
There seems to be little problem for our recent builders and recent extenders aris-
ing from the construction industry or the supply of building materials. There is, how-
ever, a problem which can be detected outside the survey and which would manifest
itself if more people were intending to build. In general, there are too few capable
building contractors and even fewer developers who could supply housing ahead of
demand. The construction industry has no speculative elements; there is no
Ghanaian equivalent of Wimpey constructing large numbers of houses and selling
them at or near completion at prices which a household with median income can
a�ord to buy. Of course, they are not likely to arise until the market is created by
there being a housing ®nance system to provide end-user ®nance in the form of mort-
gages. Meanwhile, the construction industry appears to be reasonably capable of
constructing in the ad hoc manner which is currently the norm in urban Ghana.
5.3.4. The regulatory framework
It is di�cult to build a traditional compound house and still keep within the build-
ing and planning regulations, especially when the planning o�cials perversely regard
the courtyard space as built up and not part of the open area required in the regu-
lations. We have seen, however, that many recent builders have remained faithful to
the compound form and that it provides very cheap accommodation favoured by the
lower income sector of our sample of builders and owners. This survey adds more
evidence to the on-going argument that compound houses should be encouraged as
an urban building form, especially as they are so inexpensive and easily built incre-
mentally.
Where regulations exist which inhibit housing supply without achieving a real
increase in utility, safety and health among the residents or neighbours, they should
be abolished. It is obvious that many regulations are regularly ¯outed either through
inadequate development control or by bribing the inspectors. It is time for simpler
forms of regulation which re¯ect the real conditions in which people live in
Ghanaian cities and which encourage house ownership among relatively low income
people.
AcknowledgementsÐThis Research was sponsored by the Leverhulme Trust through their grant No.F125X.
320 Progress in Planning
Appendix ACalculating the Relative Wealth Index (RWI)
A Relative Wealth Index (RWI) based on the ownership of seven consumer goods
was constructed for the sample in each city. Two criteria were used to construct the
RWI: ®rst, the estimated cost of the goods in question; and second the relative fre-
quency of ownership of that good in the whole sample. Thus, the sample RWI for a
household is high when the consumer goods it owns are costly, and are to be found
with only a small proportion of respondents.
The seven consumer goods used to construct the index are listed in Table 52 along
with the estimated range of costs for each good.* In general, the lower price limit
relates to the lowest cost of the good second-hand, while the upper limit refers to the
cost of new goods (except for motor vehicles which are rarely bought new in
Ghana).{ The set of goods was selected both to represent a wide range of costs, and
because it was judged that the majority of households in Kumasi would wish to pos-
sess the full set, given that they could a�ord them.
Table 52 also includes a Relative Price Index (RPI) based on the purchase price of
a fan, the cheapest good in the set. For each good, the index number is constructed
by comparing the upper and lower limit prices of that good, with the lower and
upper limit prices of a fan (C8000±25 000). The relative price index ®gure is the
unweighted mean of the proportions of a good's upper and lower limit price, when
compared respectively with the upper and lower prices of a fan, e.g.
Television Set RPI � 0:5��20=8� � �300=25�� � 0:5�14:5� � 7:25.
The one exception to this is the calculation of the RPI ®gure for a motor vehicle.
It was unlikely that any respondents in the sample possessed a new car, or even an
expensive second-hand one, and therefore it was thought that an upper limit of one
million cedis was a more realistic ®gure upon which to base the RPI.
Data on the relative frequency of ownership of consumer durables was available
from the 1993 Kumasi household survey (see Table 53). Provided that wealth, rather
than any cultural consideration,{ is the main factor permitting the acquisition of con-
sumer goods, then one indicator of relative a�uence could be the ownership of a
good not commonly available to other respondents in your sample. If Propij is the
percentage of respondents in sample i who own good j, then a positive indicator of
relative wealth would be 100/Propij. This is the inverse relative frequency of owner-
ship (IRFO).
*The prices for second-hand goods were found by posing as a prospective purchaser and asking the pricesfrom vendors.
{In Kumasi there is a thriving trade in second-hand goods, and for many respondents in the sample thepurchase of such goods would be more usual than buying new (especially for more expensive goods,and nearly always in the case of cars, vans etc.).
{For example, very few people in Kumasi use bicycles, but they are quite common in Berekum. There arealso very low ownership rates for motor cycles (lower than for other motor vehicles), suggesting thatownership of a motor cycle is more a function of culture than of wealth. It is likely that, as expensiveitems tend to be purchased not just for personal use, a car is a more acceptable large purchase as it cantransport dependants and others as well as the owner/driver.
Housing Supply in Ghana 321
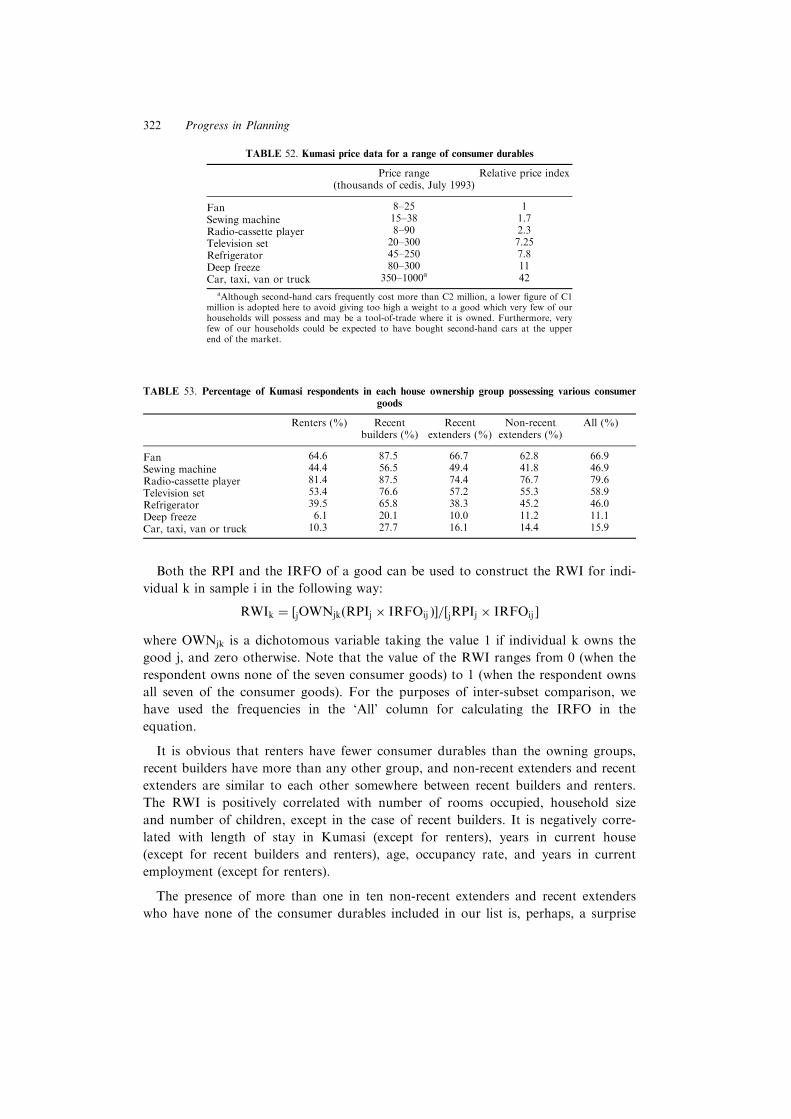
Both the RPI and the IRFO of a good can be used to construct the RWI for indi-
vidual k in sample i in the following way:
RWIk � �jOWNjk�RPIj � IRFOij ��=�jRPIj � IRFOij �
where OWNjk is a dichotomous variable taking the value 1 if individual k owns the
good j, and zero otherwise. Note that the value of the RWI ranges from 0 (when the
respondent owns none of the seven consumer goods) to 1 (when the respondent owns
all seven of the consumer goods). For the purposes of inter-subset comparison, we
have used the frequencies in the `All' column for calculating the IRFO in the
equation.
It is obvious that renters have fewer consumer durables than the owning groups,
recent builders have more than any other group, and non-recent extenders and recent
extenders are similar to each other somewhere between recent builders and renters.
The RWI is positively correlated with number of rooms occupied, household size
and number of children, except in the case of recent builders. It is negatively corre-
lated with length of stay in Kumasi (except for renters), years in current house
(except for recent builders and renters), age, occupancy rate, and years in current
employment (except for renters).
The presence of more than one in ten non-recent extenders and recent extenders
who have none of the consumer durables included in our list is, perhaps, a surprise
TABLE 52. Kumasi price data for a range of consumer durables
Price range(thousands of cedis, July 1993)
Relative price index
Fan 8±25 1
Sewing machine 15±38 1.7
Radio-cassette player 8±90 2.3
Television set 20±300 7.25
Refrigerator 45±250 7.8
Deep freeze 80±300 11
Car, taxi, van or truck 350±1000a 42
aAlthough second-hand cars frequently cost more than C2 million, a lower ®gure of C1million is adopted here to avoid giving too high a weight to a good which very few of ourhouseholds will possess and may be a tool-of-trade where it is owned. Furthermore, veryfew of our households could be expected to have bought second-hand cars at the upperend of the market.
TABLE 53. Percentage of Kumasi respondents in each house ownership group possessing various consumergoods
Renters (%) Recentbuilders (%)
Recentextenders (%)
Non-recentextenders (%)
All (%)
Fan 64.6 87.5 66.7 62.8 66.9
Sewing machine 44.4 56.5 49.4 41.8 46.9
Radio-cassette player 81.4 87.5 74.4 76.7 79.6
Television set 53.4 76.6 57.2 55.3 58.9
Refrigerator 39.5 65.8 38.3 45.2 46.0
Deep freeze 6.1 20.1 10.0 11.2 11.1
Car, taxi, van or truck 10.3 27.7 16.1 14.4 15.9
322 Progress in Planning
considering the extent of investment required to build a house and the late stage of
life at which it happens. However, many non-recent extenders and recent extenders
have inherited their houses and it is mostly they who have few or no consumer dur-
ables (Garrod et al., 1995).
Bibliography
Aina, T.A. (1988) The construction of housing for the urban poor of Lagos. Habitat International 12(1),31±44.
Amis, P. (1988) Commercialized rental housing in Nairobi, Kenya. In Spontaneous Shelter: InternationalPerspectives and Prospects, C. V. Patten (ed.). Temple University Press, Philadelphia.
Amole, B., Korboe, D. and Tipple, A.G. (1993) The family house in West Africa: a forgotten resource forpolicy makers? Third World Planning Review 15(4), 355±372.
Bentsi-Enchill, K. (1964) Ghana Land Law. Sweet and Maxwell, London.BRRI (1979) Draft Ghana Building Code, Building and Road Research Institute, Kumasi.Christie, C. and Harris, C. (1992) Kumasi Waste Disposal Social Survey Report. W. S. Atkins, Epsom.Datta, G. and Meerman, J. (1980). Household Income or Household Income Per Capita in Welfare
Comparisons, Washington DC.: The World Bank.Diamond, D. B. J. and Lea, M. J. (1995) Sustainable Financing for Housing: A Contribution to Habitat II.
Fannie Mae O�ce of Housing and Research, Washington DC.Diko, J. and Tipple, A.G. (1992) Migrants build at home: long distance housing development by
Ghanaians in London. Cities 9(4), 288±294.Economist Information Unit (EIU) (1993). Economist Intelligence Unit Country Report (Ghana), 2nd
Quarter. Economist Intelligence Unit, London.Fry, E. M. and Drew J. B. (1945). Draft Town Planning Scheme for Kumasi: Report, O�ce of the Town
Planning Adviser to the Resident Minister, W. Africa.Garrod, G., Willis, K. and Tipple, A.G. (1995) A two-stage econometric analysis of the housing extension
decision in Kumasi. Ghana. Urban Studies 32(6), 953±970.Gilbert, A. (1993) In Search of a Home. UCL Press Limited, London.Gosling, J.A., Keogh, G.T. and Stabler, M.J. (1993) House extensions and housing market adjustment: a
case study of Wokingham. Urban Studies 30(9), 1561±1576.GSS (1995) Ghana Living Standards Survey: Report on the Third Round (GLSS 3), September 1991±
September 1992, Ghana Statistical Service.Hellen, J. A., Tipple, A. G. and Prince, M. A. (1991) Environmental risk assessment in a tropical city:
An application of housing and household data from Kumasi, Ghana. In Geomedizinische undbiogeograpische Aspekte der Krankheitsverbreitung und Gesundheitsversorgung in Industrie undEntwicklungslaÈndern, E. Hinz (ed.). Peter Lang, Frankfurt.
Hill, P. (1966). Landlords and brokers: a West African trading system, Cahiers d'Etudes Africaines 6: 349±366.
HUDA (1990). (Housing and Urban Development Associates). Housing Needs Assessment Study, FinalReport. Ministry of Local Government, Government of Ghana, Accra.
Konadu-Agyemang, K.O. (1991) Re¯ections on the absence of squatter settlements in West African cities:the case of Kumasi, Ghana. Urban Studies 28(1), 139±151.
Korboe, D. (1992a) Family houses in Ghanaian cities: to be or not to be? Urban Studies 29(7), 1159±1172.Korboe, D. (1992b) Multihabitation: an analysis of residence in a West African city. Open House
International 17(1), 45±53.Korboe, D. T. (1993a) The low-income housing system in Kumasi: An empirical examination of two neigh-
bourhoods. Unpublished Ph.D. Dissertation, University of Newcastle upon Tyne.Korboe, D. T. (1993b) Qualitative Report for the Ghana Housing Supply Research Project. Department of
Housing and Planning Research, University of Science and Technology, Kumasi.Korboe, D. T. (1995) Access to, and Utilisation of, Basic Social Services by the Poor in Ghana. UNICEF,
Accra.Kumasi Health Education Project, Kumasi (KHEP), (1993) District Health Pro®leÐJune 1992±January
1993.Malpezzi, S. (1990) Urban housing and ®nancial markets: some international comparisons. Urban Studies
27(6): 971±1022.Malpezzi, S. J., Tipple, A. G. and Willis, K. G. (1990) Costs and Bene®ts of Rent Control: A Case Study in
Kumasi, Ghana. The World Bank, Washington DC.
Housing Supply in Ghana 323
McCaskie, T. C. (1991) Recent history [of Ghana]. Africa South of the Sahara, 1991. Europa Publications,London.
Ollennu, N. A. (1962) Principles of Customary Land Law in Ghana. Sweet and Maxwell, London.Osei, B. (1993) Monetary and ®nancial developmentsÐpolicies and options. In Policies and options for
Ghanaian economic development, V. Nyanteng (ed.). Institute for Statistical and EconomicResearch, University of Ghana, Accra.
Population Reference Bureau (PRB) (1993) World Population Data Sheet. Population Reference Bureau,Washington DC.
Ravallion, M. Datt, G. and van de Walle, D. (1991) Quantifying Absolute Poverty in the DevelopingWorld, Review of Income and Wealth 37(4).
Roe, A. (1991) Economy [of Ghana]. Africa South of the Sahara, 1991. Europa Publications, London, pp.521±529.
Sawyer, M. C. (1975). Policy in Some Developed Countries, Paper presented at the 14th GeneralConference of IARIW, Aulanko, Finland, August.
Seek, N.H. (1983) Adjusting housing consumption: improve or move. Urban Studies 20, 455±469.Tipple, A. G. (1984) Towards a culturally acceptable housing strategy, the case of Kumasi, Ghana.
Unpublished Ph.D. dissertation, University of Newcastle upon Tyne.Tipple, A. G. (1987) The Development of Housing Policy in Kumasi, Ghana, 1901 to 1981: With an Analysis
of the Current Housing Stock. Centre for Architectural Research and Development Overseas,University of Newcastle upon Tyne.
Tipple, A. G. (1988) The History and Practice of Rent Controls in Kumasi, Ghana. The World Bank,Washington DC.
Tipple, A. G. and Korboe, D. (1993) A challenge to Turnerian modelling: some thoughts on low-incomehousing from Kumasi, Ghana. Paper presented to the 21st IAHS World Housing Congress, CapeTown, 10±14 May.
Tipple, A.G. and Willis, K.G. (1991) Tenure choice in Kumasi, Ghana. Third World Planning Review13(1), 27±45.
Tipple, A. G. and Willis, K. G. (1992) Why should Ghanaians build houses in urban areas? CitiesFebruary, 60±74.
Turner, J. F. C. (1976) Housing by People; Towards Autonomy in Building Environments. Marion Boyars,London.
Turner J. F. C. and Fichter, R., (ed.), (1972). Freedom to Build, London, Macmillan.UNCHS (1990) The Global Strategy for Shelter to the Year 2000. UNCHS (Habitat), Nairobi.UNCHS (1993) Shelter Sector Performance Indicators. UNCHS (Habitat), Nairobi.UNDP (1993). Shelter Sector Performance Indicators, UNCHS (Habitat).Wikan, U. (1990) Changing housing strategies and patterns among the Cairo poor, 1950±85. In Housing
Africa's Urban Poor, P. Amis and P. Lloyd (ed.). Manchester University Press for the InternationalAfrican Institute, Manchester.
Willis, K.G., Malpezzi, S.J. and Tipple, A.G. (1990) An econometric and cultural analysis of rent controlin Kumasi, Ghana. Urban Studies 27(2), 241±258.
World Bank (1989) Ghana: Broadening the Recovery Through the Housing Sector. The World Bank,Washington DC.
World Bank (1990) Ghana Housing Sector Review: Sustaining the Structural Adjustment Program, A ShelterStrategy for Ghana. The World Bank, Infrastructure Operations Division, Washington DC.
World Bank (1992) The World Development Report. The World Bank, Washington DC.World Bank (1993) Housing: Enabling Markets to Work. The World Bank, Washington DC.
324 Progress in Planning
Related Documents