FINAL 2021-2029 HOUSING ELEMENT ADOPTED FEBRUARY 9, 2022 Resolution #R-22-06 2200 Huntington Drive San Marino, California, 91108 (626) 300-0700 https://www.cityofsanmarino.org

Welcome message from author
This document is posted to help you gain knowledge. Please leave a comment to let me know what you think about it! Share it to your friends and learn new things together.
Transcript
FINAL 2021-2029
HOUSING ELEMENT
ADOPTED FEBRUARY 9, 2022
Resolution #R-22-06
2200 Huntington Drive
San Marino, California, 91108
(626) 300-0700
https://www.cityofsanmarino.org
February 11, 2022
Megan Kirkeby, Deputy Director
Department of Housing and Community Development
Division of Housing Policy Development
2020 W. El Camino, Suite 500
Sacramento, CA 95833
Subject: City of San Marino Adopted Final 2021-2029 Housing Element
The City of San Marino is pleased to submit its Adopted Final 2021-2029 Housing Element for
the 6th RHNA Cycle within the statutory deadline to ensure it obtains certification for
consistency with state Housing Element Law by the California Department of Housing and
Community Development. Most importantly, this Adopted Final 2021-2029 Housing Element
has incorporated the California Department of Housing and Community Development
comments received by the City on December 31, 2021, as detailed in the attached table, and
details the City’s realistic, yet affirmative, plan for addressing the housing needs of its current
and future residents through October 15, 2029.
To ensure timeliness, the City of San Marino is submitting its Adopted 2021-2029 Housing
Element for the 6th RHNA Cycle within the statutory period to maintain eligibility for grant
funding programs, to ensure the legal adequacy of the General Plan, and to preserve local
control of land use decisions. The City is requesting the California Department of Housing and
Community Development review of its Adopted 2021-2029 Final Housing Element for the
allowed 90-day review for consistency with state Housing Law and is ready to respond should
the review conclude sooner.
The City of San Marino is committed to working with the California Department of Housing
and Community Development to ensure that our local and regional housing goals are met. As
noted throughout the Adopted 2021-2029 Final Housing Element, the City is committed to
rezoning for multi-family development at default densities and for adopting creative new overlay
programs to encourage housing developers to include affordable units within their
developments.
We look forward to hearing from your office. Please do not hesitate to contact me at (626)
300-0710, or [email protected], or our Housing Consultant, Bret McNulty of
2
Sincerely,
Sincerely,
Isidro Figueroa
Community Development Director
Enclosures
McNulty Consulting for any reason at (805) 722-5585 or [email protected]. The Community
Development Department and its Housing team are available to ensure a successful adoption
and certification process.
A. City Council Resolution #R-22-06B. Housing Element Revisions based on HCD 12/31/2021 Letter C. HCD 12/31/2021 Letter
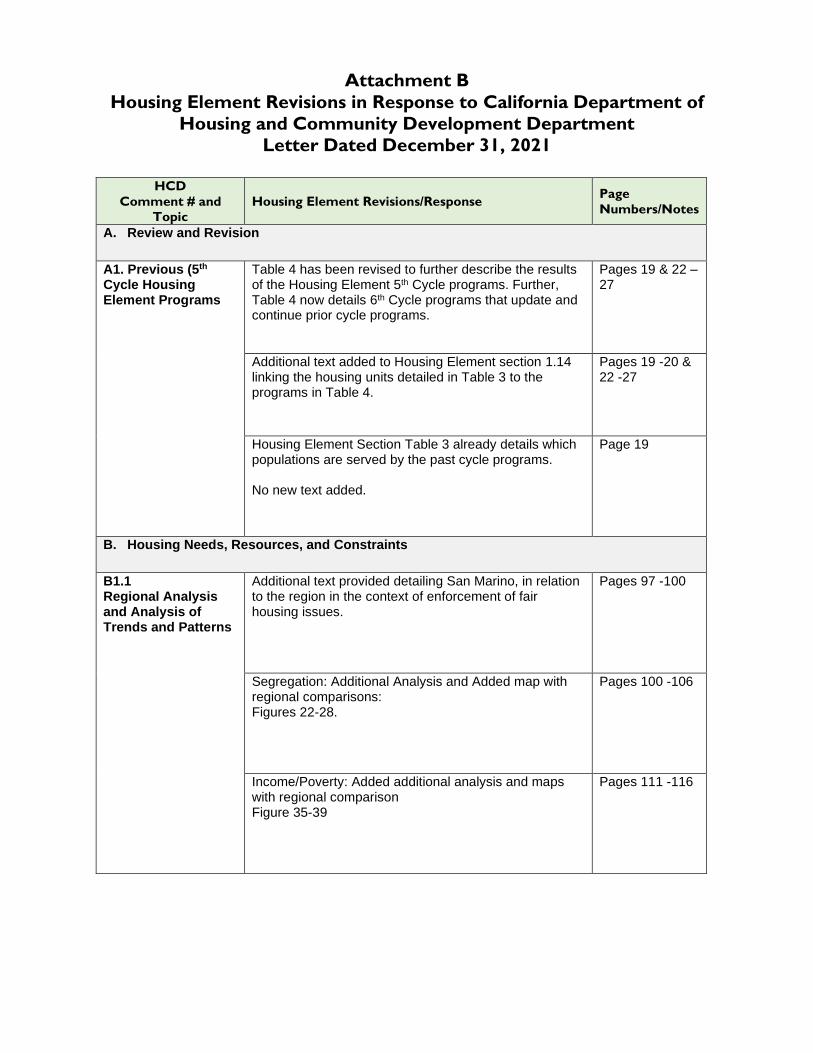
Attachment B
Housing Element Revisions in Response to California Department of
Housing and Community Development Department
Letter Dated December 31, 2021
HCD
Comment # and
Topic
Housing Element Revisions/Response Page
Numbers/Notes
A. Review and Revision
A1. Previous (5th Cycle Housing Element Programs
Table 4 has been revised to further describe the results of the Housing Element 5th Cycle programs. Further, Table 4 now details 6th Cycle programs that update and continue prior cycle programs.
Pages 19 & 22 – 27
Additional text added to Housing Element section 1.14 linking the housing units detailed in Table 3 to the programs in Table 4.
Pages 19 -20 & 22 -27
Housing Element Section Table 3 already details which populations are served by the past cycle programs. No new text added.
Page 19
B. Housing Needs, Resources, and Constraints
B1.1 Regional Analysis and Analysis of Trends and Patterns
Additional text provided detailing San Marino, in relation to the region in the context of enforcement of fair housing issues.
Pages 97 -100
Segregation: Additional Analysis and Added map with regional comparisons: Figures 22-28.
Pages 100 -106
Income/Poverty: Added additional analysis and maps with regional comparison Figure 35-39
Pages 111 -116
Attachment B
Housing Element Revisions in Response to California Department of
Housing and Community Development Department
Letter Dated December 31, 2021
HCD
Comment # and
Topic
Housing Element Revisions/Response Page
Numbers/Notes
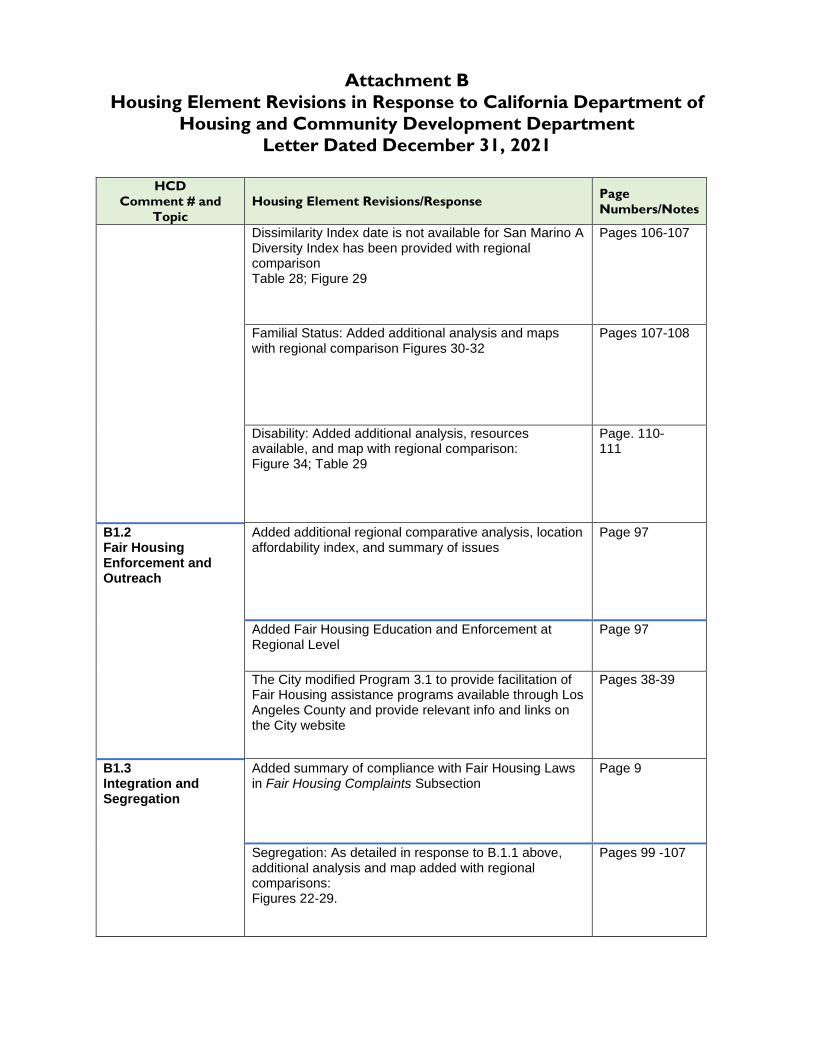
Dissimilarity Index date is not available for San Marino A Diversity Index has been provided with regional comparison Table 28; Figure 29
Pages 106-107
Familial Status: Added additional analysis and maps with regional comparison Figures 30-32
Pages 107-108
Disability: Added additional analysis, resources available, and map with regional comparison: Figure 34; Table 29
Page. 110- 111
B1.2 Fair Housing Enforcement and Outreach
Added additional regional comparative analysis, location affordability index, and summary of issues
Page 97
Added Fair Housing Education and Enforcement at Regional Level
Page 97
The City modified Program 3.1 to provide facilitation of Fair Housing assistance programs available through Los Angeles County and provide relevant info and links on the City website
Pages 38-39
B1.3 Integration and Segregation
Added summary of compliance with Fair Housing Laws in Fair Housing Complaints Subsection
Page 9
Segregation: As detailed in response to B.1.1 above, additional analysis and map added with regional comparisons: Figures 22-29.
Pages 99 -107
Attachment B
Housing Element Revisions in Response to California Department of
Housing and Community Development Department
Letter Dated December 31, 2021
HCD
Comment # and
Topic
Housing Element Revisions/Response Page
Numbers/Notes
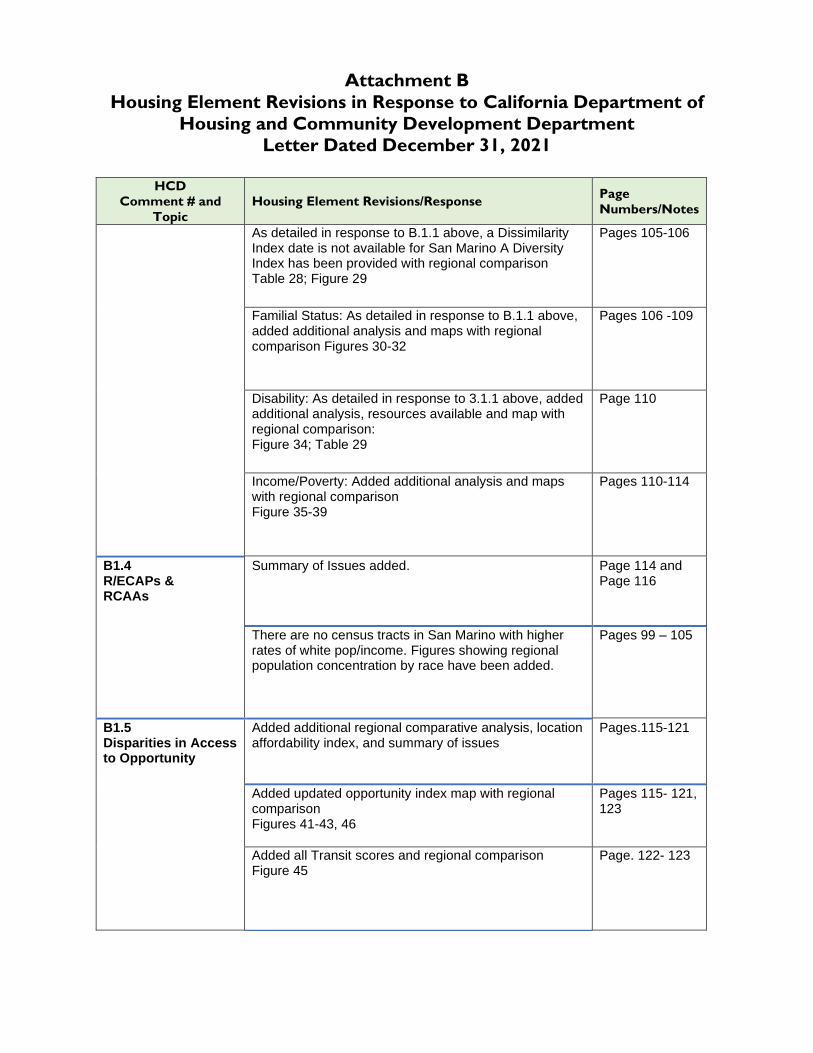
As detailed in response to B.1.1 above, a Dissimilarity Index date is not available for San Marino A Diversity Index has been provided with regional comparison Table 28; Figure 29
Pages 105-106
Familial Status: As detailed in response to B.1.1 above, added additional analysis and maps with regional comparison Figures 30-32
Pages 106 -109
Disability: As detailed in response to 3.1.1 above, added additional analysis, resources available and map with regional comparison: Figure 34; Table 29
Page 110
Income/Poverty: Added additional analysis and maps with regional comparison Figure 35-39
Pages 110-114
B1.4 R/ECAPs & RCAAs
Summary of Issues added. Page 114 and Page 116
There are no census tracts in San Marino with higher rates of white pop/income. Figures showing regional population concentration by race have been added.
Pages 99 – 105
B1.5 Disparities in Access to Opportunity
Added additional regional comparative analysis, location affordability index, and summary of issues
Pages.115-121
Added updated opportunity index map with regional comparison Figures 41-43, 46
Pages 115- 121, 123
Added all Transit scores and regional comparison Figure 45
Page. 122- 123
Attachment B
Housing Element Revisions in Response to California Department of
Housing and Community Development Department
Letter Dated December 31, 2021
HCD
Comment # and
Topic
Housing Element Revisions/Response Page
Numbers/Notes
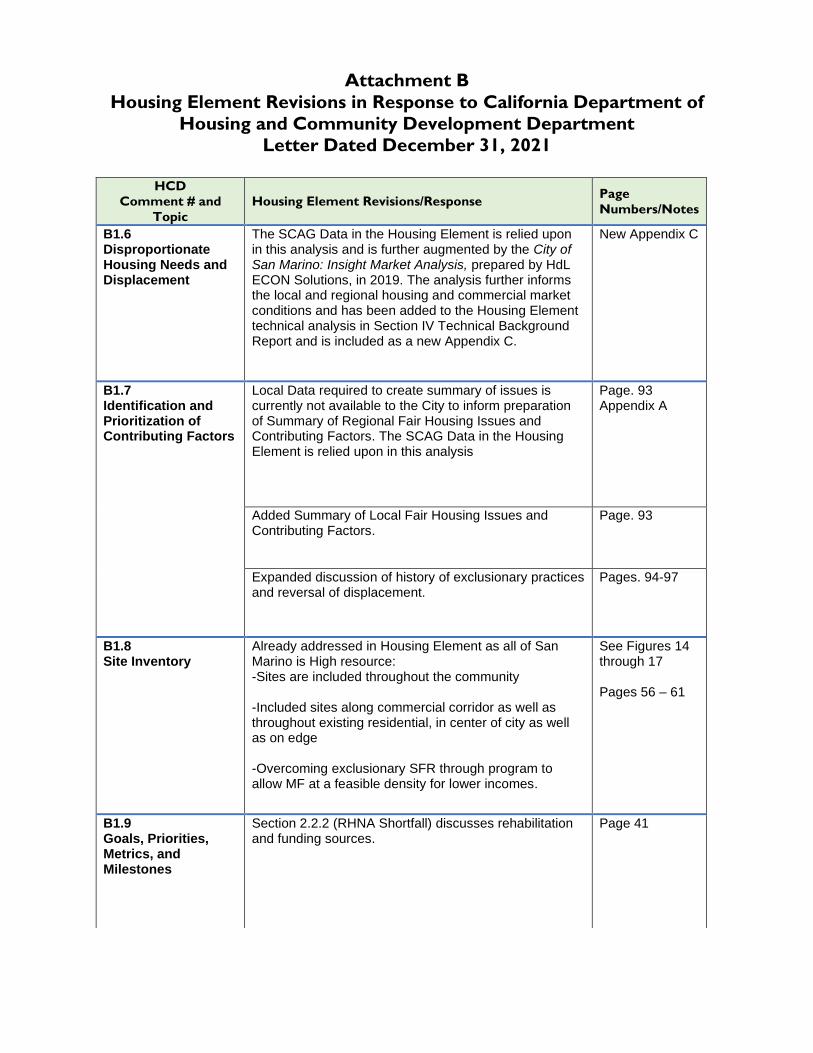
B1.6 Disproportionate Housing Needs and Displacement
The SCAG Data in the Housing Element is relied upon in this analysis and is further augmented by the City of San Marino: Insight Market Analysis, prepared by HdL ECON Solutions, in 2019. The analysis further informs the local and regional housing and commercial market conditions and has been added to the Housing Element technical analysis in Section IV Technical Background Report and is included as a new Appendix C.
New Appendix C
B1.7 Identification and Prioritization of Contributing Factors
Local Data required to create summary of issues is currently not available to the City to inform preparation of Summary of Regional Fair Housing Issues and Contributing Factors. The SCAG Data in the Housing Element is relied upon in this analysis
Page. 93 Appendix A
Added Summary of Local Fair Housing Issues and Contributing Factors.
Page. 93
Expanded discussion of history of exclusionary practices and reversal of displacement.
Pages. 94-97
B1.8 Site Inventory
Already addressed in Housing Element as all of San Marino is High resource: -Sites are included throughout the community -Included sites along commercial corridor as well as throughout existing residential, in center of city as well as on edge -Overcoming exclusionary SFR through program to allow MF at a feasible density for lower incomes.
See Figures 14 through 17 Pages 56 – 61
B1.9 Goals, Priorities, Metrics, and Milestones
Section 2.2.2 (RHNA Shortfall) discusses rehabilitation and funding sources.
Page 41
Attachment B
Housing Element Revisions in Response to California Department of
Housing and Community Development Department
Letter Dated December 31, 2021
HCD
Comment # and
Topic
Housing Element Revisions/Response Page
Numbers/Notes
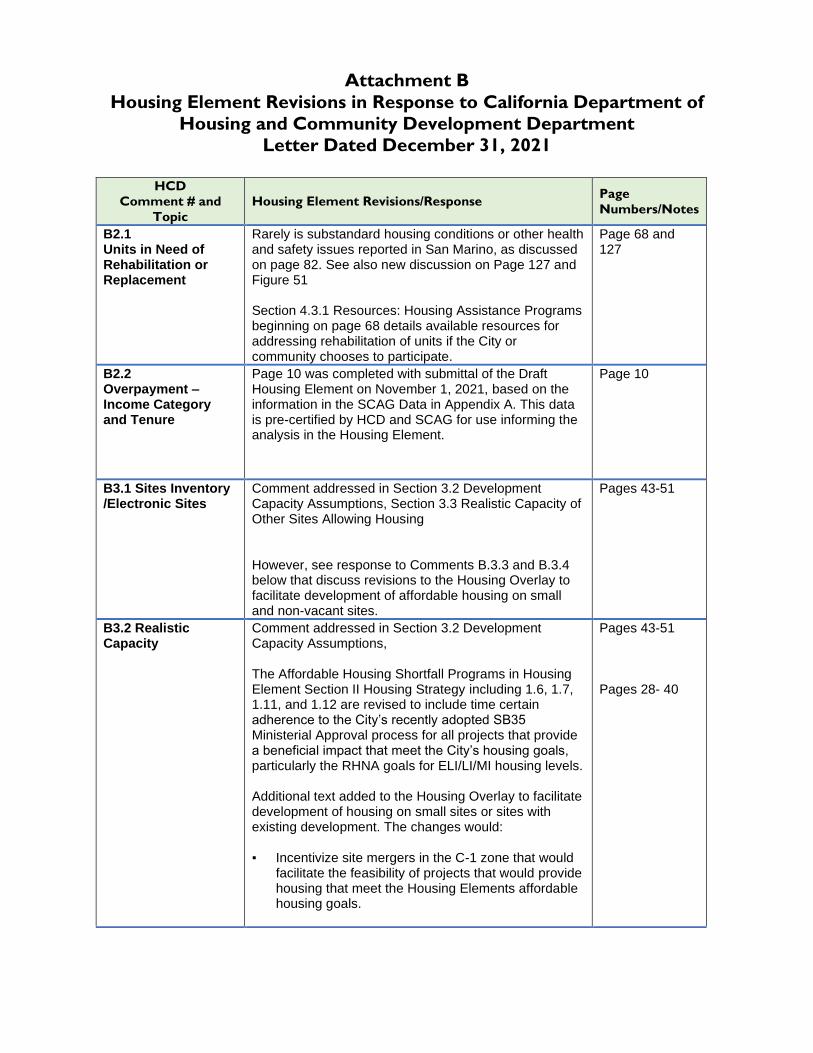
B2.1 Units in Need of Rehabilitation or Replacement
Rarely is substandard housing conditions or other health and safety issues reported in San Marino, as discussed on page 82. See also new discussion on Page 127 and Figure 51 Section 4.3.1 Resources: Housing Assistance Programs beginning on page 68 details available resources for addressing rehabilitation of units if the City or community chooses to participate.
Page 68 and 127
B2.2 Overpayment –Income Category and Tenure
Page 10 was completed with submittal of the Draft Housing Element on November 1, 2021, based on the information in the SCAG Data in Appendix A. This data is pre-certified by HCD and SCAG for use informing the analysis in the Housing Element.
Page 10
B3.1 Sites Inventory /Electronic Sites
Comment addressed in Section 3.2 Development Capacity Assumptions, Section 3.3 Realistic Capacity of Other Sites Allowing Housing However, see response to Comments B.3.3 and B.3.4 below that discuss revisions to the Housing Overlay to facilitate development of affordable housing on small and non-vacant sites.
Pages 43-51
B3.2 Realistic Capacity
Comment addressed in Section 3.2 Development Capacity Assumptions, The Affordable Housing Shortfall Programs in Housing Element Section II Housing Strategy including 1.6, 1.7, 1.11, and 1.12 are revised to include time certain adherence to the City’s recently adopted SB35 Ministerial Approval process for all projects that provide a beneficial impact that meet the City’s housing goals, particularly the RHNA goals for ELI/LI/MI housing levels. Additional text added to the Housing Overlay to facilitate development of housing on small sites or sites with existing development. The changes would: ▪ Incentivize site mergers in the C-1 zone that would
facilitate the feasibility of projects that would provide housing that meet the Housing Elements affordable housing goals.
Pages 43-51 Pages 28- 40
Attachment B
Housing Element Revisions in Response to California Department of
Housing and Community Development Department
Letter Dated December 31, 2021
HCD
Comment # and
Topic
Housing Element Revisions/Response Page
Numbers/Notes
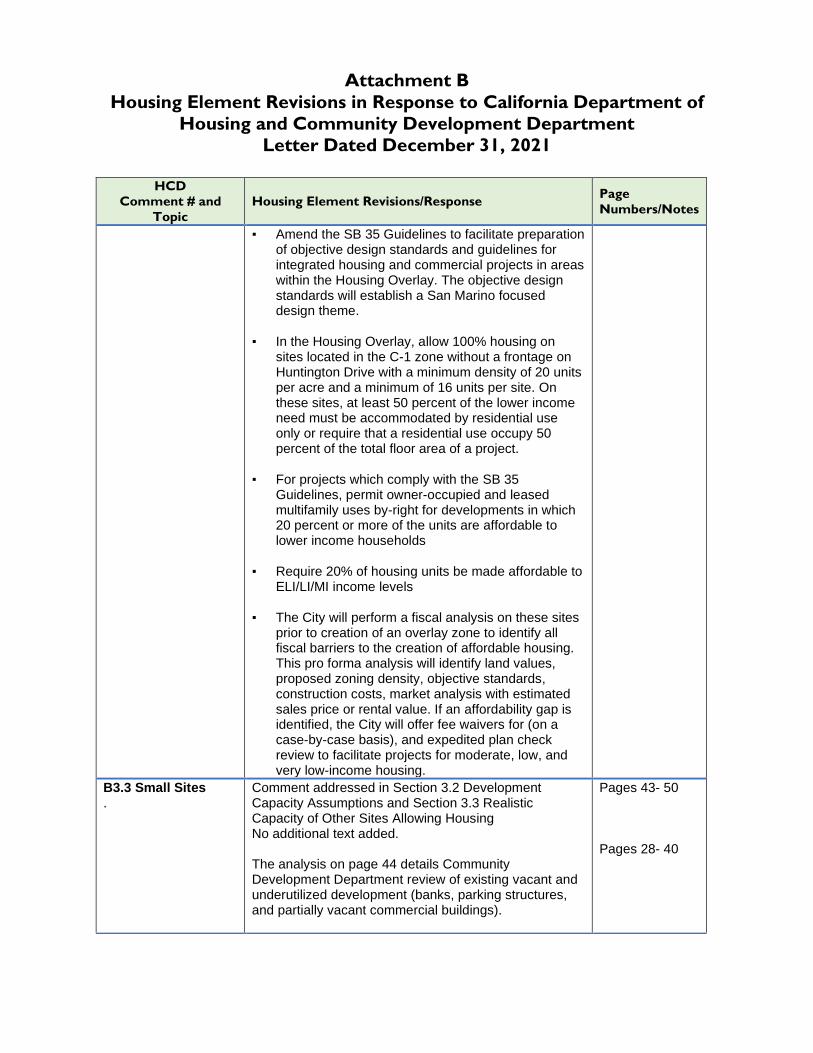
▪ Amend the SB 35 Guidelines to facilitate preparation of objective design standards and guidelines for integrated housing and commercial projects in areas within the Housing Overlay. The objective design standards will establish a San Marino focused design theme.
▪ In the Housing Overlay, allow 100% housing on sites located in the C-1 zone without a frontage on Huntington Drive with a minimum density of 20 units per acre and a minimum of 16 units per site. On these sites, at least 50 percent of the lower income need must be accommodated by residential use only or require that a residential use occupy 50 percent of the total floor area of a project.
▪ For projects which comply with the SB 35 Guidelines, permit owner-occupied and leased multifamily uses by-right for developments in which 20 percent or more of the units are affordable to lower income households
▪ Require 20% of housing units be made affordable to
ELI/LI/MI income levels
▪ The City will perform a fiscal analysis on these sites prior to creation of an overlay zone to identify all fiscal barriers to the creation of affordable housing. This pro forma analysis will identify land values, proposed zoning density, objective standards, construction costs, market analysis with estimated sales price or rental value. If an affordability gap is identified, the City will offer fee waivers for (on a case-by-case basis), and expedited plan check review to facilitate projects for moderate, low, and very low-income housing.
B3.3 Small Sites .
Comment addressed in Section 3.2 Development Capacity Assumptions and Section 3.3 Realistic Capacity of Other Sites Allowing Housing No additional text added. The analysis on page 44 details Community Development Department review of existing vacant and underutilized development (banks, parking structures, and partially vacant commercial buildings).
Pages 43- 50 Pages 28- 40
Attachment B
Housing Element Revisions in Response to California Department of
Housing and Community Development Department
Letter Dated December 31, 2021
HCD
Comment # and
Topic
Housing Element Revisions/Response Page
Numbers/Notes
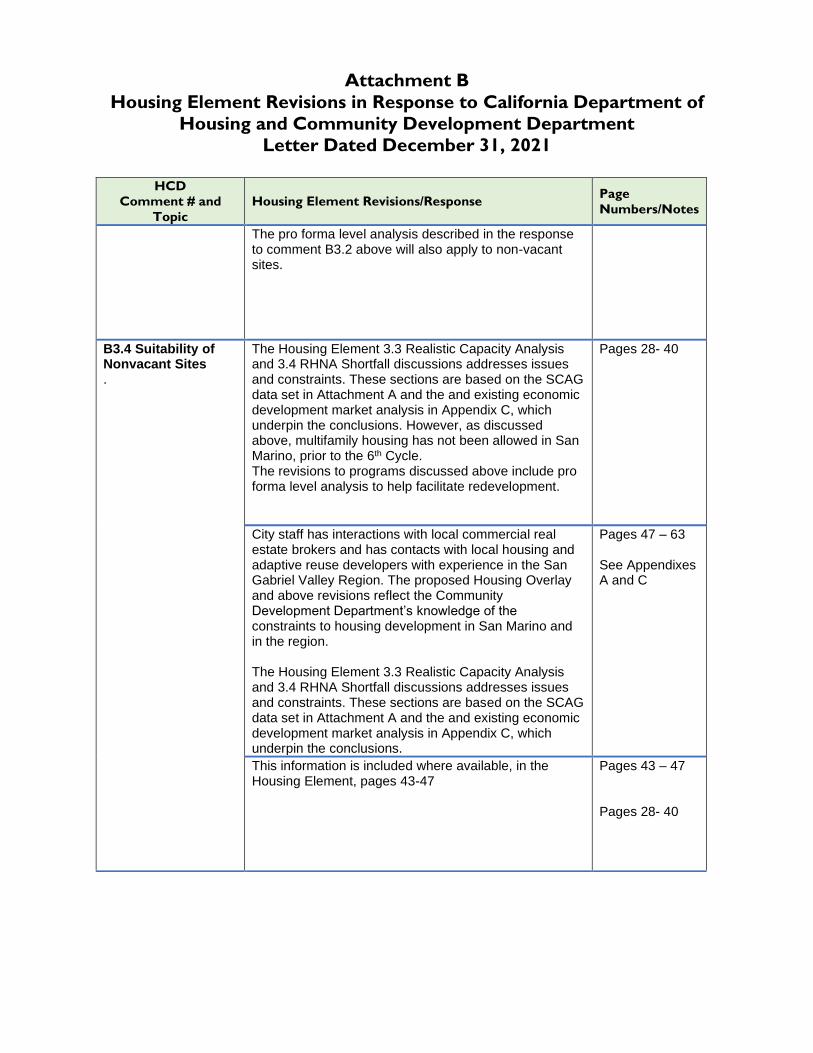
The pro forma level analysis described in the response to comment B3.2 above will also apply to non-vacant sites.
B3.4 Suitability of Nonvacant Sites .
The Housing Element 3.3 Realistic Capacity Analysis and 3.4 RHNA Shortfall discussions addresses issues and constraints. These sections are based on the SCAG data set in Attachment A and the and existing economic development market analysis in Appendix C, which underpin the conclusions. However, as discussed above, multifamily housing has not been allowed in San Marino, prior to the 6th Cycle. The revisions to programs discussed above include pro forma level analysis to help facilitate redevelopment.
Pages 28- 40
City staff has interactions with local commercial real estate brokers and has contacts with local housing and adaptive reuse developers with experience in the San Gabriel Valley Region. The proposed Housing Overlay and above revisions reflect the Community Development Department’s knowledge of the constraints to housing development in San Marino and in the region. The Housing Element 3.3 Realistic Capacity Analysis and 3.4 RHNA Shortfall discussions addresses issues and constraints. These sections are based on the SCAG data set in Attachment A and the and existing economic development market analysis in Appendix C, which underpin the conclusions.
Pages 47 – 63 See Appendixes A and C
This information is included where available, in the Housing Element, pages 43-47
Pages 43 – 47 Pages 28- 40
Attachment B
Housing Element Revisions in Response to California Department of
Housing and Community Development Department
Letter Dated December 31, 2021
HCD
Comment # and
Topic
Housing Element Revisions/Response Page
Numbers/Notes
B3.5 Missing Middle Projections
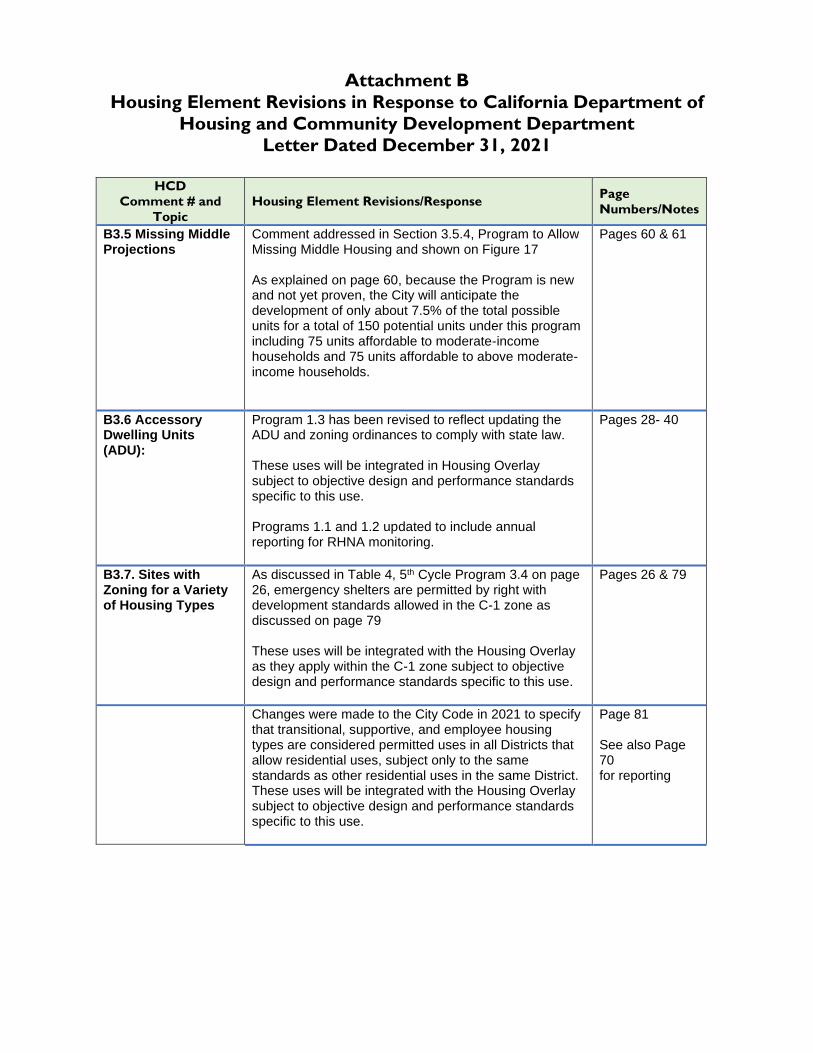
Comment addressed in Section 3.5.4, Program to Allow Missing Middle Housing and shown on Figure 17 As explained on page 60, because the Program is new and not yet proven, the City will anticipate the development of only about 7.5% of the total possible units for a total of 150 potential units under this program including 75 units affordable to moderate-income households and 75 units affordable to above moderate-income households.
Pages 60 & 61
B3.6 Accessory Dwelling Units (ADU):
Program 1.3 has been revised to reflect updating the ADU and zoning ordinances to comply with state law. These uses will be integrated in Housing Overlay subject to objective design and performance standards specific to this use. Programs 1.1 and 1.2 updated to include annual reporting for RHNA monitoring.
Pages 28- 40
B3.7. Sites with Zoning for a Variety of Housing Types
As discussed in Table 4, 5th Cycle Program 3.4 on page 26, emergency shelters are permitted by right with development standards allowed in the C-1 zone as discussed on page 79 These uses will be integrated with the Housing Overlay as they apply within the C-1 zone subject to objective design and performance standards specific to this use.
Pages 26 & 79
Changes were made to the City Code in 2021 to specify that transitional, supportive, and employee housing types are considered permitted uses in all Districts that allow residential uses, subject only to the same standards as other residential uses in the same District. These uses will be integrated with the Housing Overlay subject to objective design and performance standards specific to this use.
Page 81 See also Page 70 for reporting
Attachment B
Housing Element Revisions in Response to California Department of
Housing and Community Development Department
Letter Dated December 31, 2021
HCD
Comment # and
Topic
Housing Element Revisions/Response Page
Numbers/Notes
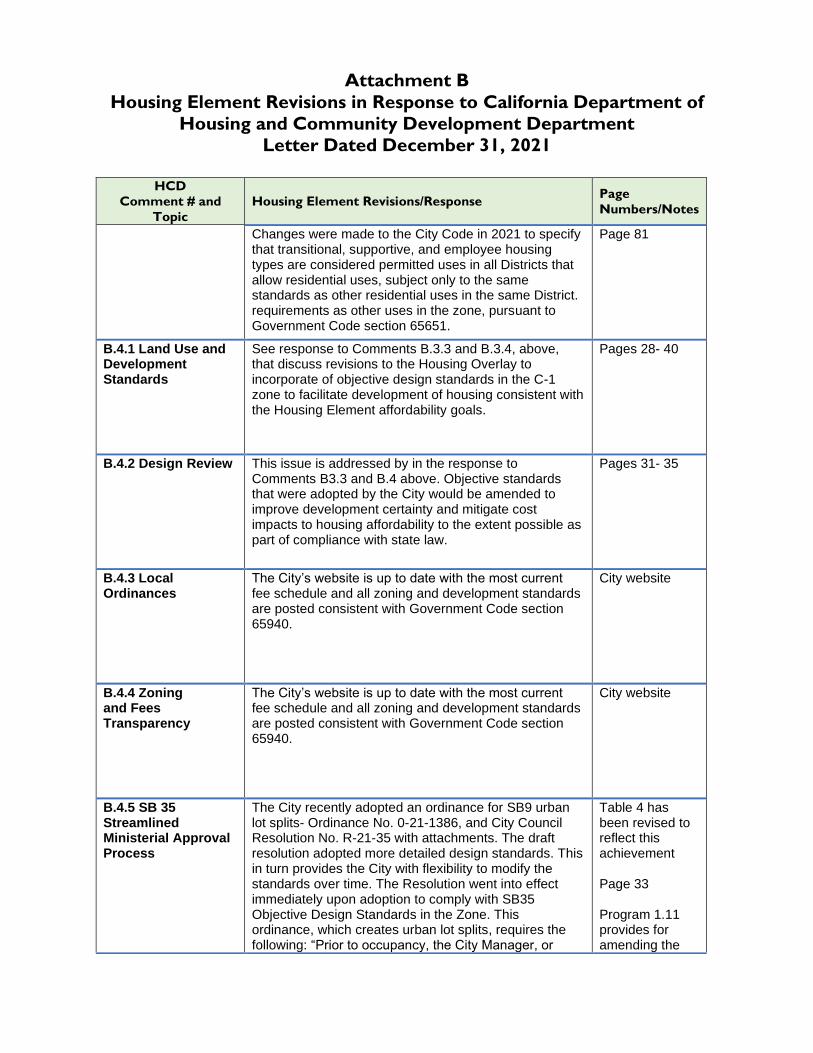
Changes were made to the City Code in 2021 to specify that transitional, supportive, and employee housing types are considered permitted uses in all Districts that allow residential uses, subject only to the same standards as other residential uses in the same District. requirements as other uses in the zone, pursuant to Government Code section 65651.
Page 81
B.4.1 Land Use and Development Standards
See response to Comments B.3.3 and B.3.4, above, that discuss revisions to the Housing Overlay to incorporate of objective design standards in the C-1 zone to facilitate development of housing consistent with the Housing Element affordability goals.
Pages 28- 40
B.4.2 Design Review
This issue is addressed by in the response to Comments B3.3 and B.4 above. Objective standards that were adopted by the City would be amended to improve development certainty and mitigate cost impacts to housing affordability to the extent possible as part of compliance with state law.
Pages 31- 35
B.4.3 Local Ordinances
The City’s website is up to date with the most current fee schedule and all zoning and development standards are posted consistent with Government Code section 65940.
City website
B.4.4 Zoning and Fees Transparency
The City’s website is up to date with the most current fee schedule and all zoning and development standards are posted consistent with Government Code section 65940.
City website
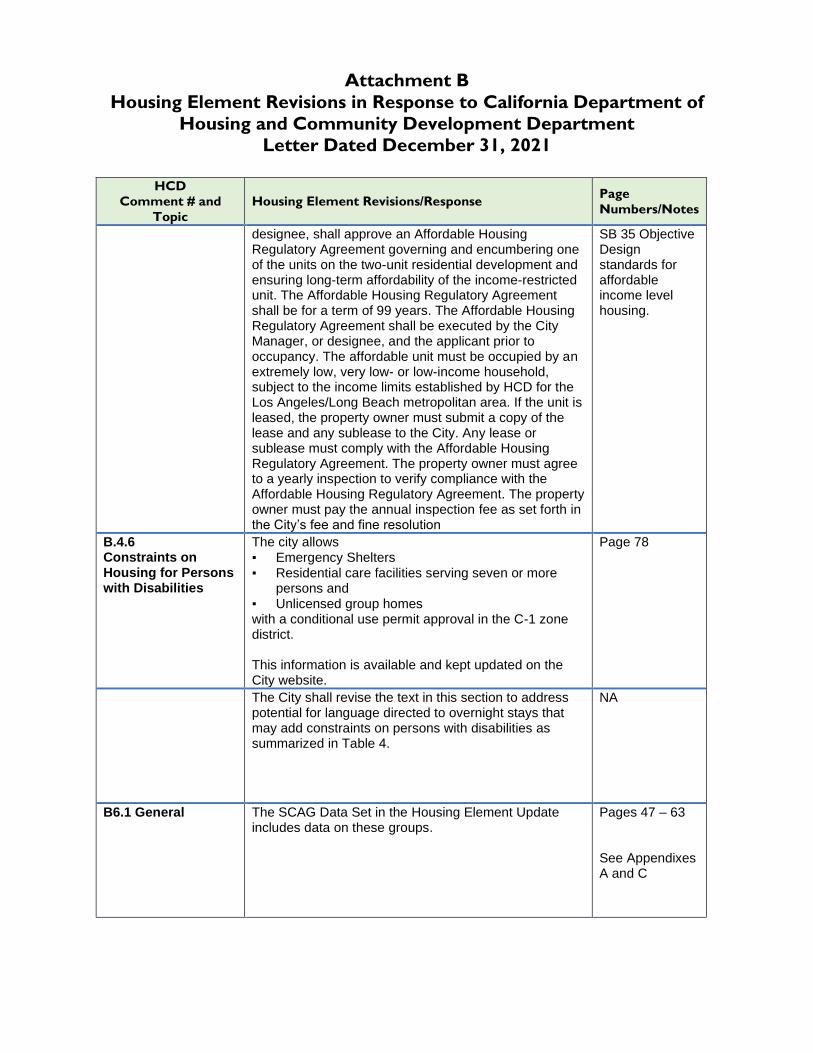
B.4.5 SB 35 Streamlined Ministerial Approval Process
The City recently adopted an ordinance for SB9 urban lot splits- Ordinance No. 0-21-1386, and City Council Resolution No. R-21-35 with attachments. The draft resolution adopted more detailed design standards. This in turn provides the City with flexibility to modify the standards over time. The Resolution went into effect immediately upon adoption to comply with SB35 Objective Design Standards in the Zone. This ordinance, which creates urban lot splits, requires the following: “Prior to occupancy, the City Manager, or
Table 4 has been revised to reflect this achievement Page 33 Program 1.11 provides for amending the
Attachment B
Housing Element Revisions in Response to California Department of
Housing and Community Development Department
Letter Dated December 31, 2021
HCD
Comment # and
Topic
Housing Element Revisions/Response Page
Numbers/Notes
designee, shall approve an Affordable Housing Regulatory Agreement governing and encumbering one of the units on the two-unit residential development and ensuring long-term affordability of the income-restricted unit. The Affordable Housing Regulatory Agreement shall be for a term of 99 years. The Affordable Housing Regulatory Agreement shall be executed by the City Manager, or designee, and the applicant prior to occupancy. The affordable unit must be occupied by an extremely low, very low- or low-income household, subject to the income limits established by HCD for the Los Angeles/Long Beach metropolitan area. If the unit is leased, the property owner must submit a copy of the lease and any sublease to the City. Any lease or sublease must comply with the Affordable Housing Regulatory Agreement. The property owner must agree to a yearly inspection to verify compliance with the Affordable Housing Regulatory Agreement. The property owner must pay the annual inspection fee as set forth in the City’s fee and fine resolution
SB 35 Objective Design standards for affordable income level housing.
B.4.6 Constraints on Housing for Persons with Disabilities
The city allows ▪ Emergency Shelters ▪ Residential care facilities serving seven or more
persons and ▪ Unlicensed group homes with a conditional use permit approval in the C-1 zone district. This information is available and kept updated on the City website.
Page 78
The City shall revise the text in this section to address potential for language directed to overnight stays that may add constraints on persons with disabilities as summarized in Table 4.
NA
B6.1 General The SCAG Data Set in the Housing Element Update includes data on these groups.
Pages 47 – 63 See Appendixes A and C
Attachment B
Housing Element Revisions in Response to California Department of
Housing and Community Development Department
Letter Dated December 31, 2021
HCD
Comment # and
Topic
Housing Element Revisions/Response Page
Numbers/Notes
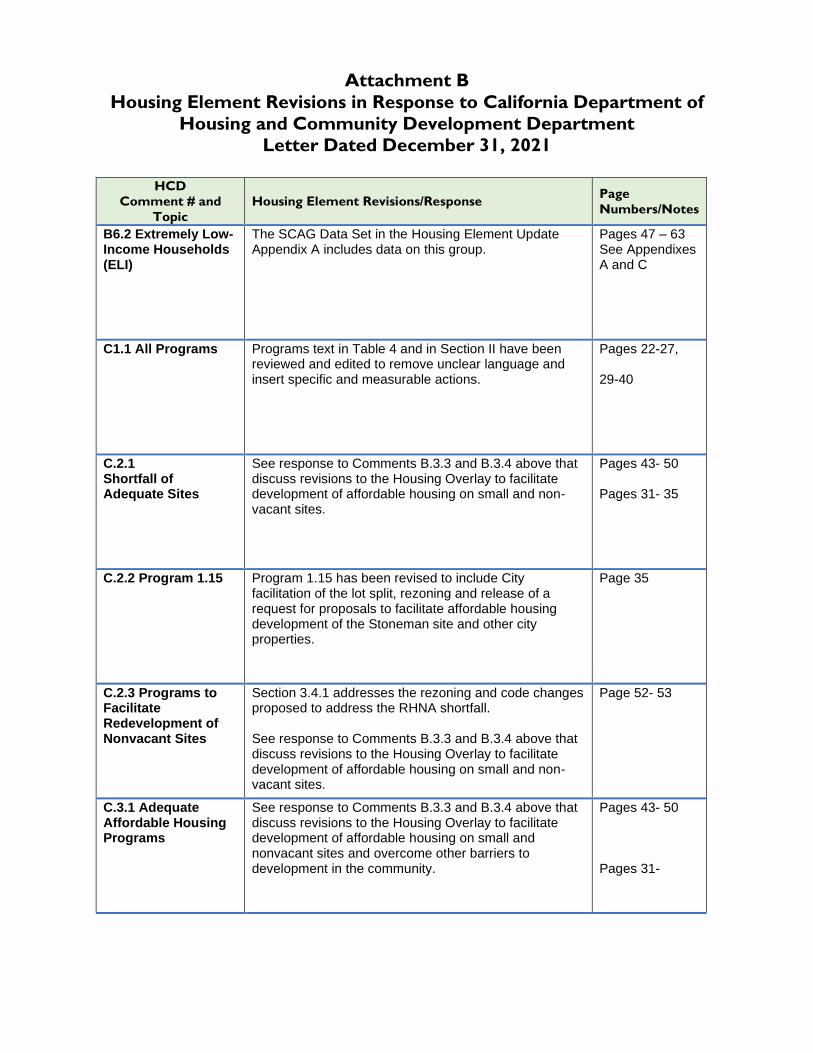
B6.2 Extremely Low-Income Households (ELI)
The SCAG Data Set in the Housing Element Update Appendix A includes data on this group.
Pages 47 – 63 See Appendixes A and C
C1.1 All Programs Programs text in Table 4 and in Section II have been reviewed and edited to remove unclear language and insert specific and measurable actions.
Pages 22-27, 29-40
C.2.1 Shortfall of Adequate Sites
See response to Comments B.3.3 and B.3.4 above that discuss revisions to the Housing Overlay to facilitate development of affordable housing on small and non-vacant sites.
Pages 43- 50 Pages 31- 35
C.2.2 Program 1.15 Program 1.15 has been revised to include City facilitation of the lot split, rezoning and release of a request for proposals to facilitate affordable housing development of the Stoneman site and other city properties.
Page 35
C.2.3 Programs to Facilitate Redevelopment of Nonvacant Sites
Section 3.4.1 addresses the rezoning and code changes proposed to address the RHNA shortfall. See response to Comments B.3.3 and B.3.4 above that discuss revisions to the Housing Overlay to facilitate development of affordable housing on small and non-vacant sites.
Page 52- 53
C.3.1 Adequate Affordable Housing Programs
See response to Comments B.3.3 and B.3.4 above that discuss revisions to the Housing Overlay to facilitate development of affordable housing on small and nonvacant sites and overcome other barriers to development in the community.
Pages 43- 50 Pages 31-
Attachment B
Housing Element Revisions in Response to California Department of
Housing and Community Development Department
Letter Dated December 31, 2021
HCD
Comment # and
Topic
Housing Element Revisions/Response Page
Numbers/Notes
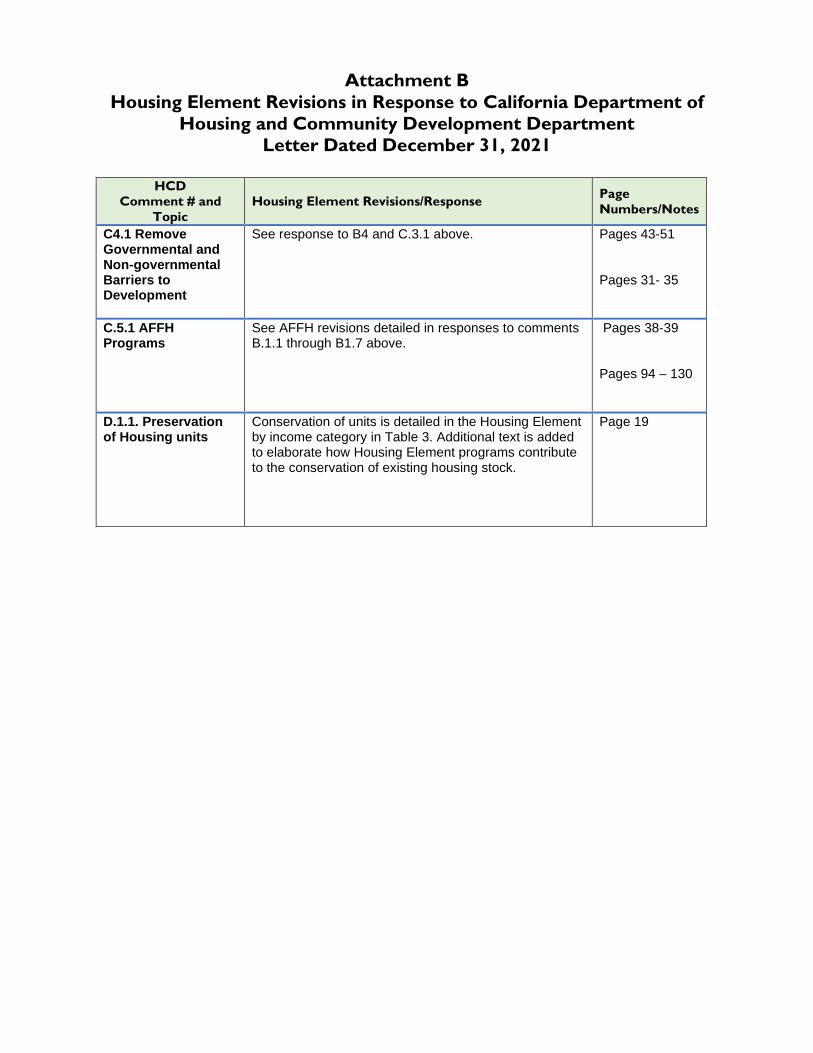
C4.1 Remove Governmental and Non-governmental Barriers to Development
See response to B4 and C.3.1 above. Pages 43-51 Pages 31- 35
C.5.1 AFFH Programs
See AFFH revisions detailed in responses to comments B.1.1 through B1.7 above.
Pages 38-39 Pages 94 – 130
D.1.1. Preservation of Housing units
Conservation of units is detailed in the Housing Element by income category in Table 3. Additional text is added to elaborate how Housing Element programs contribute to the conservation of existing housing stock.
Page 19
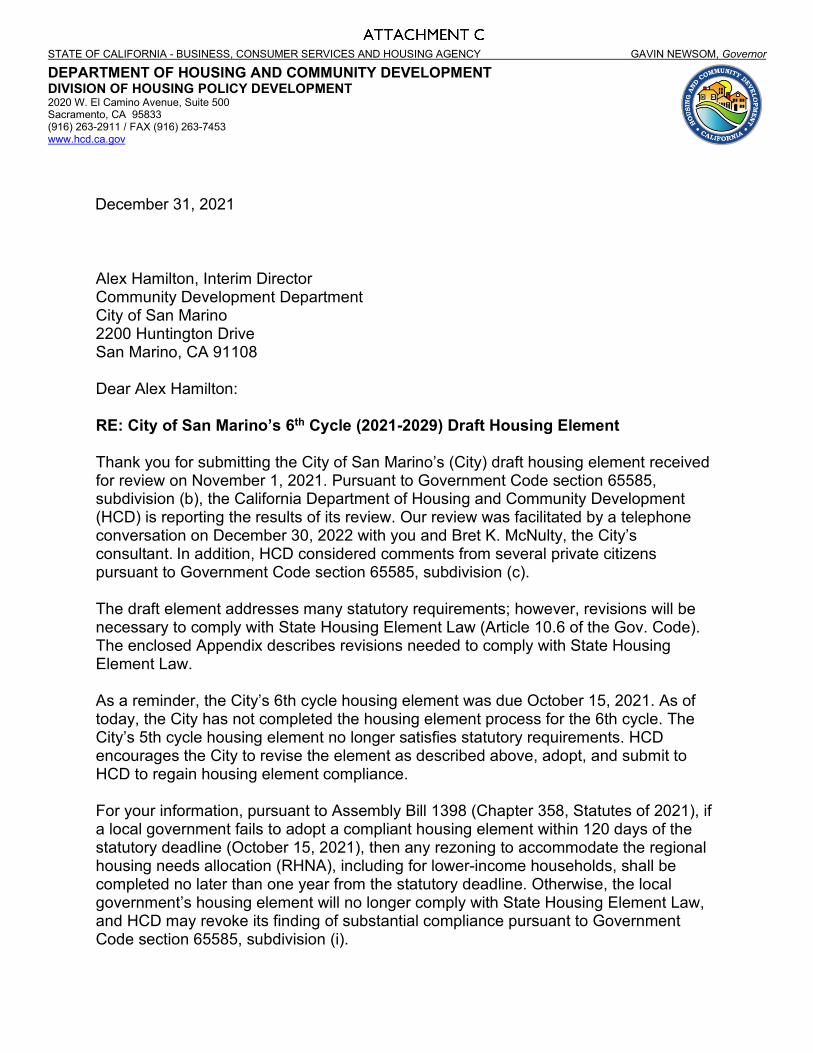
STATE OF CALIFORNIA - BUSINESS, CONSUMER SERVICES AND HOUSING AGENCY GAVIN NEWSOM, Governor
DEPARTMENT OF HOUSING AND COMMUNITY DEVELOPMENT DIVISION OF HOUSING POLICY DEVELOPMENT 2020 W. El Camino Avenue, Suite 500 Sacramento, CA 95833 (916) 263-2911 / FAX (916) 263-7453www.hcd.ca.gov
Alex Hamilton, Interim Director Community Development Department City of San Marino 2200 Huntington Drive San Marino, CA 91108
Dear Alex Hamilton:
RE: City of San Marino’s 6th Cycle (2021-2029) Draft Housing Element
Thank you for submitting the City of San Marino’s (City) draft housing element received for review on November 1, 2021. Pursuant to Government Code section 65585, subdivision (b), the California Department of Housing and Community Development (HCD) is reporting the results of its review. Our review was facilitated by a telephone conversation on December 30, 2022 with you and Bret K. McNulty, the City’s consultant. In addition, HCD considered comments from several private citizens pursuant to Government Code section 65585, subdivision (c).
The draft element addresses many statutory requirements; however, revisions will be necessary to comply with State Housing Element Law (Article 10.6 of the Gov. Code). The enclosed Appendix describes revisions needed to comply with State Housing Element Law.
As a reminder, the City’s 6th cycle housing element was due October 15, 2021. As of today, the City has not completed the housing element process for the 6th cycle. The City’s 5th cycle housing element no longer satisfies statutory requirements. HCD encourages the City to revise the element as described above, adopt, and submit to HCD to regain housing element compliance.
For your information, pursuant to Assembly Bill 1398 (Chapter 358, Statutes of 2021), if a local government fails to adopt a compliant housing element within 120 days of the statutory deadline (October 15, 2021), then any rezoning to accommodate the regional housing needs allocation (RHNA), including for lower-income households, shall be completed no later than one year from the statutory deadline. Otherwise, the local government’s housing element will no longer comply with State Housing Element Law, and HCD may revoke its finding of substantial compliance pursuant to Government Code section 65585, subdivision (i).
December 31, 2021
Bret McNulty
Typewritten text
ATTACHMENT C
Alex Hamilton, Interim Director Page 2
Public participation in the development, adoption and implementation of the housing element is essential to effective housing planning. Throughout the housing element process, the City should continue to engage the community, including organizations that represent lower-income and special needs households, by making information regularly available and considering and incorporating comments where appropriate.
Several federal, state, and regional funding programs consider housing element compliance as an eligibility or ranking criteria. For example, the CalTrans Senate Bill (SB) 1 Sustainable Communities grant; the Strategic Growth Council and HCD’s Affordable Housing and Sustainable Communities programs; and HCD’s Permanent Local Housing Allocation consider housing element compliance and/or annual reporting requirements pursuant to Government Code section 65400. With a compliant housing element, the City meets housing element requirements for these and other funding sources.
For your information, some general plan element updates are triggered by housing element adoption. HCD reminds the City to consider timing provisions and welcomes the opportunity to provide assistance. For information, please see the Technical Advisories issued by the Governor’s Office of Planning and Research at: http://opr.ca.gov/docs/OPR_Appendix_C_final.pdf and http://opr.ca.gov/docs/Final_6.26.15.pdf.
HCD is committed to assisting the City in addressing all statutory requirements of State Housing Element Law. If you have any questions or need additional technical assistance, please contact Molivann Phlong, of our staff, at [email protected].
Sincerely,
Melinda Coy Senior Housing Accountability Manager
Enclosure
City of San Marino’s 6th Cycle Draft Housing Element Page 1 December 31, 2021
APPENDIX CITY OF SAN MARINO
The following changes are necessary to bring the City’s housing element into compliance with Article 10.6 of the Government Code. Accompanying each recommended change, we cite the supporting section of the Government Code. Housing element technical assistance information is available on HCD’s website at http://www.hcd.ca.gov/community-development/housing-element/housing-element-memos.shtml. Among other resources, the housing element section contains HCD’s latest technical assistance tool, Building Blocks for Effective Housing Elements (Building Blocks), available at http://www.hcd.ca.gov/community-development/building-blocks/index.shtml and includes the Government Code addressing State Housing Element Law and other resources.
A. Review and Revision
Review the previous element to evaluate the appropriateness, effectiveness, and progress in implementation, and reflect the results of this review in the revised element. (Gov. Code, § 65588 (a) and (b).)
A thorough program-by-program review is necessary to evaluate City's performance in addressing housing goals. Table 4 must be revised to describe the actual results of the prior element’s programs (quantified where possible), compare those results to the objectives projected or planned, and based on an evaluation of any differences between what was planned versus achieved, provide a description of how the objectives and programs of the updated element incorporate changes resulting from the evaluation. This information and analysis provide the basis for developing a more effective housing program.
In addition, as part of the evaluation of programs in the past cycle, the element must provide an explanation of the effectiveness of goals, policies, and related actions in meeting the housing needs of special needs populations (e.g., elderly, persons with disabilities, large households, female headed households, farmworkers and persons experiencing homelessness).
B. Housing Needs, Resources, and Constraints
1. Affirmatively further[ing] fair housing in accordance with Chapter 15 (commencing with Section 8899.50) of Division 1 of Title 2…shall include an assessment of fair housing in the jurisdiction (Gov. Code, § 65583, subd. (c)(10)(A)) Regional Analysis and Analysis of Trends and Patterns: The element generally describes local data but must also analyze San Marino relative to the rest of the region regarding enforcement and outreach, integration, and segregation, racially and ethnically concentrated areas of poverty (R/ECAP) and areas of affluence, disparities in access to opportunity, and disproportionate housing needs and displacement risks.
City of San Marino’s 6th Cycle Draft Housing Element Page 2 December 31, 2021
In addition, wherever possible, the analysis and summary should include a discussion at a geographic level appropriate to better determine any locational trends—simply reporting information at a city-wide level will not fully display patterns and impacts on protected characteristics. Examples of appropriate geographic levels include census tracts, block groups, neighborhoods, housing development, or any other sub-section of a locality. Fair Housing Enforcement and Outreach: The element provides (page 90) some information on Fair Housing enforcement and public outreach. However, the element must include the City’s ability to provide enforcement and outreach capacity which can consist of actions such as the City’s ability to investigate complaints, obtain remedies, or the City’s ability to engage in fair housing testing. The element must address compliance with existing fair housing laws and regulations; findings, lawsuits, enforcement actions, settlements, or judgements related to fair housing or civil rights; and summarize fair housing issues related to enforcement and outreach capacity and the relationship to other fair housing issues (e.g., segregation and integration, racially and ethnically concentrated areas of poverty, etc.).
Integration and Segregation: The element includes some local data and analysis on integration and segregation (page 91); however, the element must analyze segregation and integration of familial status. The element must also analyze segregation and integration of race, familial status, disability, and income locally and regionally for patterns over time, complemented by data, and concluding with a summary of issues. To strengthen the analysis for race, the element could include updated dissimilarity index data. Racial/Ethnic Concentrated Areas of Poverty (R/ECAP) and Affluence (RCAA): The element notes there are no R/ECAPs in the City and states that there are no RCAAs given the equal distribution of wealth within City limits (page 106). However, the element should analyze some of the census tracts that have significantly higher rates of white population and income as RCAA and compare both this analysis, and R/ECAPs to the neighboring region. Disparities in Access to Opportunity: The element provides (page 97) some information on the access to opportunity. A complete analysis should include the locally and regional disparities of the educational, environmental, and economic scores through local, federal, and/or state data. Please refer to page 35 of the Affirmatively Furthering Fair Housing (AFFH) guidebook (link: https://www.hcd.ca.gov/community-development/affh/index.shtml#guidance) for specific factors that should be considered when analyzing access to opportunities as it pertains to educational, employment, environmental, transportation, and any factors that are unique to San Marino. Disproportionate Housing Needs and Displacement: The element does include (page 104) some data on disproportionate housing needs and displacement. However, the element must also analyze the data including looking at trends, patterns, and other local knowledge, and conclude with a summary of issues.
City of San Marino’s 6th Cycle Draft Housing Element Page 3 December 31, 2021
Identification and Prioritization Contributing Factors: The element must list and prioritize contributing factors to fair housing issues. Contributing factors create, contribute to, perpetuate, or increase the severity of fair housing issues and are fundamental to adequate goals and actions. Examples include community opposition to affordable housing, housing discrimination, land use and zoning laws, lack of regional cooperation, location and type or lack of affordable housing and lack of public or private investment in areas of opportunity or affordable housing choices. The analysis shall result in strategic approaches to inform and connect goals and actions to mitigate contributing factors to affordable housing. Site Inventory: The element must include an analysis demonstrating whether sites identified to meet the RHNA are distributed throughout the community in a manner that affirmatively furthers fair housing. A full analysis should address the income categories of identified sites with respect to location, the number of sites and units by all income groups and how that effects the existing patterns for all components of the assessment of fair housing (e.g., segregation and integration, access to opportunity). The element should also discuss whether the distribution of sites improves or exacerbates conditions. If sites exacerbate conditions, the element should identify further program actions that will be taken to mitigate this (e.g., anti-displacement strategies). Goals, Priorities, Metrics, and Milestones: Goals and actions must significantly seek to overcome contributing factors to fair housing issues. Currently, the element identifies a program to provide fair housing services through the Fair Housing Foundation; however, this program does not appear to facilitate any meaningful change nor address AFFH requirements. Furthermore, the element must include metrics and milestones for evaluating progress on programs, actions, and fair housing results. The element may need to include additional programs and actions to integrate the AFFH analysis into policies and programs.
2. Include an analysis and documentation of household characteristics, including level
of payment compared to ability to pay, housing characteristics, including overcrowding, and housing stock condition. (Gov. Code, § 65583, subd. (a)(2).)
Units in Need Rehabilitation or Replacement: The element identifies (page 106) substandard housing. However, it must include analysis of the condition of the existing housing stock and estimate the number of units in need of rehabilitation and replacement. For example, the analysis could include estimates from a recent windshield survey or sampling, estimates from the code enforcement agency, or information from knowledgeable builders/developers, including non-profit housing developers or organizations.
Overpayment – Income Category and Tenure: While the element identifies (page 10) the total number of overpaying households, it must quantify and analyze the number of overpaying households by tenure (i.e., renter and owner) and the lower-income households paying more than 30 percent of their income on housing.
City of San Marino’s 6th Cycle Draft Housing Element Page 4 December 31, 2021
3. An inventory of land suitable and available for residential development, including vacant sites and sites having realistic and demonstrated potential for redevelopment during the planning period to meet the locality’s housing need for a designated income level, and an analysis of the relationship of zoning and public facilities and services to these sites. (Gov. Code, § 65583, subd. (a)(3).)
The City has a regional housing need allocation (RHNA) of 397 housing units, of which 240 are for lower-income households. To address this need, the element relies on permitting residential uses in commercial zones, accessory dwelling units and junior accessory dwelling units, rezoning, utilizing a housing overlay, and including missing middle housing. To demonstrate the adequacy of these sites and strategies to accommodate the City’s RHNA, the element must include complete analyses.
Sites Inventory: The sites inventory lists several sites with multiple APNs. These parcels should be listed separately. Tables 6 and 11 must describe existing uses for any nonvacant sites and include a calculation of the realistic capacity of each site by income category. The element must also include a general map of identified sites. Electronic Sites Inventory: Pursuant to Government Code section 65583.3, subdivision (b), the City must utilize standards, forms, and definitions adopted by HCD when preparing the sites inventory. Please see HCD’s housing element webpage at https://www.hcd.ca.gov/community-development/housing-element/index.shtml for a copy of the form and instructions. The City can reach out to HCD at [email protected] for technical assistance. Please note, upon adoption of the housing element, the City must submit an electronic version of the sites inventory with its adopted housing element to [email protected]. Realistic Capacity: While the element provides (page 40) assumptions of buildout for sites included in the inventory, it must also provide support for these assumptions. For example, the element should demonstrate what specific trends, factors, and other evidence led to the assumptions. The estimate of the number of units for each site must be adjusted as necessary, based on the land use controls and site improvements, typical densities of existing or approved residential developments at a similar affordability level in that City, and on the current or planned availability and accessibility of sufficient water, sewer, and dry utilities. The element also needs to analyze the likelihood that the identified units will be developed as noted in the inventory in zones that allow nonresidential uses (e.g., mixed-use) or in areas that will be subject to an overlay, pursuant to the underlying zoning. This analysis should consider the likelihood of nonresidential development, performance standards, and development trends supporting residential development. Small Sites: The sites inventory identifies small sites to accommodate the City’s lower-income RHNA. Sites smaller than a half-acre in size are deemed inadequate to accommodate housing for lower-income households unless it is demonstrated, with sufficient evidence, that sites are suitable to accommodate housing for lower-income households. The element should provide specific examples with the densities and affordability. For sites expected to be aggregated, the element must describe
City of San Marino’s 6th Cycle Draft Housing Element Page 5 December 31, 2021
circumstances leading to consolidation, such as common ownership, the City’s role or track record in facilitating small-lot consolidation, policies or incentives offered or proposed to encourage and facilitate lot consolidation, specific examples of projects that were built for lower-income households on similarly sized sites, densities and affordability and relate those examples back to the sites inventory. Based on a complete analysis, the City should consider adding or revising programs to include incentives for facilitating development on small sites. Suitability of Nonvacant Sites: While the element identifies (page 42) nonvacant sites to accommodate the regional housing need for lower-income households, it provides no description of how the potential for redevelopment. The element must describe the methodology used to determine the additional development potential within the planning period. For example, the element includes portions of sites such as the Huntington Library and the Southwestern Academy, and sites with religious institutions, but no analysis was provided to demonstrate whether these existing uses would impede development of these sites within the planning period or how development is expected to occur on these sites. The methodology must consider factors including the extent to which existing uses may impede additional residential development, development trends, market conditions, any existing leases or other contracts that would perpetuate the existing use or prevent redevelopment of the site for additional residential development, and regulatory or other incentives or standards to encourage additional residential development on these sites. (Gov. Code, § 65583.2, subd. (g).) For sites with residential uses, the inventory could also describe structural conditions or other circumstances and trends demonstrating the redevelopment potential to more intense residential uses. For nonresidential sites, the inventory could also describe whether the use is operating, marginal or discontinued, and the condition of the structure or could describe any expressed interest in redevelopment. The element could also discuss conversations with property owners and institutions to demonstrate interest in residential development. In addition, if the housing element relies upon nonvacant sites to accommodate more than 50 percent of the RHNA for lower income households, the housing element must demonstrate that the existing use is not an impediment to additional residential development in the planning period (Gov. Code, § 65583.2, subd. (g)(2).). This can be demonstrated by providing substantial evidence that the existing use is likely to be discontinued during the planning period (Gov. Code, § 65583.2, subd. (g)(2). For additional information and sample analysis, see the Building Blocks at: http://www.hcd.ca.gov/community-development/building-blocks/site-inventory-analysis/analysis-of-sites-and-zoning.shtml#analysis. Missing Middle Projections: The element is projecting 75 units that will be developed based on the development of a missing middle ordinance to accommodate a portion of its above moderate income RHNA. To utilize projections, the element must 1) include a site-specific inventory of sites where the ordinance is being applied to 2) include a nonvacant sites analysis demonstrating the likelihood of redevelopment and that the existing use will not constitute as an impediment for additional residential use and 3) include programs and policies that establish zoning and development standards early in the planning period and implement incentives to encourage and
City of San Marino’s 6th Cycle Draft Housing Element Page 6 December 31, 2021
facilitate development. The element should support this analysis with local information such as local developer or owner interest to utilize zoning and incentives established through the ordinance. Accessory Dwelling Units (ADU): The element assumes (page 44) an ADU build out of 241 ADU and/or junior accessory dwelling unit (JADU) in the planning cycle. Given that the City has only produced an average of 9 units per year since 2018, it is not clear if this production level will be achievable in the planning period. As a result, the element should be updated to include a realistic estimate of the potential for ADUs and include policies and programs that incentivize the production of ADUs. Depending on the analysis, the element must commit to monitor ADU production throughout the course of the planning period and implement additional actions if not meeting target numbers anticipated in the housing element. In addition to monitoring production, this program should also monitor affordability. Additional actions, if necessary, should be taken in a timely manner (e.g., within 6 months). Finally, if necessary, the degree of additional actions should be in stride with the degree of the gap in production and affordability. For example, if actual production and affordability of ADUs is far from anticipated trends, then rezoning or something similar would be an appropriate action. If actual production and affordability is near anticipated trends, then measures like outreach and marketing might be more appropriate. Sites with Zoning for a Variety of Housing Types: Accessory Dwelling Units: After a cursory review of the City’s ADU ordinance, HCD discovered several areas which were not consistent with State ADU Law. This includes, but is not limited to, additional permits for ADU approval, and bedroom limitations. In addition, ADUs need to be allowed in any zones that allow residential use. HCD will provide a complete listing of ADU non-compliance issues under a separate cover. As a result, the element should include in Program 1.3 to update the City’s ADU and zoning ordinances to comply with state law. For more information, please consult HCD’s ADU Guidebook, published in December 2020, which provides detailed information on new state ADU requirements
Emergency Shelters: The housing element must demonstrate the permit processing, development, and management standards for emergency shelters are consistent with Government Code section 65583 (a)(4)(A). While housing element law does allow a jurisdiction to limit the number of beds or persons permitted to be served nightly by a facility, standards must be designed to encourage and facilitate the development of, or conversion to, an emergency shelter. The element must analyze the ten-bed limit as a potential constraint for the development of emergency shelters and ensure that parking standards only reflect the need for sufficient parking to accommodate all staff working in the emergency shelter. In addition, the element must demonstrate the commercial zone has sufficient capacity to accommodate the housing need for at least one emergency shelters.
Low Barrier Navigation Centers: Low Barrier Navigation Centers shall be a use by-right in zones where multifamily and mixed uses are permitted, including nonresidential zones permitting multifamily uses pursuant to Government Code
City of San Marino’s 6th Cycle Draft Housing Element Page 7 December 31, 2021
section 65660. The element must demonstrate compliance with this requirement and include programs as appropriate.
Permanent Supportive Housing: Supportive housing shall be a use by-right in zones where multifamily and mixed uses are permitted, including nonresidential zones permitting multifamily uses pursuant to Government Code section 65651. The element must demonstrate compliance with this requirement and include programs as appropriate.
4. An analysis of potential and actual governmental constraints upon the maintenance,
improvement, or development of housing for all income levels, including the types of housing identified in paragraph (1) of subdivision (c), and for persons with disabilities as identified in the analysis pursuant to paragraph (7), including land use controls, building codes and their enforcement, site improvements, fees and other exactions required of developers, and local processing and permit procedures. The analysis shall also demonstrate local efforts to remove governmental constraints that hinder the locality from meeting its share of the regional housing need in accordance with Government Code section 65584 and from meeting the need for housing for persons with disabilities, supportive housing, transitional housing, and emergency shelters identified pursuant to paragraph (7). Transitional housing and supportive housing shall be considered a residential use of property, and shall be subject only to those restrictions that apply to other residential dwellings of the same type in the same zone. (Gov. Code, § 65583, subd. (a)(5).)
Land Use and Development Standards: Currently, development standards do not support the development of multifamily housing. While HCD recognizes that zoning has not yet been created to implement new overlays to accommodate multifamily housing, the element should generally describe and commit to expectations for development standards in these zones. For example, the element should describe if 100 percent residential projects be allowed in the C-1 zone or if a commercial component be required for new multifamily development. In addition, the element should commit to ensuring that development standards including height, lot coverage, and parking facilitate the development of multifamily housing at the allowable densities assumed in the inventory. Design Review: The element must describe and analyze the design review guidelines, including approval procedures and decision-making criteria, for their impact as potential constraints on housing supply and affordability. For example, the analysis should analyze the requirement to present plans to the neighbors and whether this requirement will remain for multifamily housing in areas covered by the various overlays. could describe required findings and discuss whether objective standards and guidelines improve development certainty and mitigate cost impacts. The element must demonstrate this process is not a constraint or it must include a program to address this permitting requirement, as appropriate. Local Ordinances: The element must specifically analyze locally adopted ordinances such as inclusionary ordinances or short-term rental ordinances that directly impact the cost and supply of residential development. The analysis should demonstrate
City of San Marino’s 6th Cycle Draft Housing Element Page 8 December 31, 2021
local efforts to remove governmental constraints that hinder the locality from meeting its share of the regional housing need and from meeting the need for housing for persons with disabilities, supportive housing, transitional housing, and emergency shelters.
Zoning and Fees Transparency: The element must clarify its compliance with new transparency requirements for posting updated development fees and all zoning and development standards for each parcel on the City’s website pursuant to Government Code section 65940.1(a)(1). SB 35 Streamlined Ministerial Approval Process: The element must include a program to adhere to the SB 35 Ministerial Approval Process for development projects that meet specific requirements.
Constraints on Housing for Persons with Disabilities: The element briefly describes its
reasonable accommodation procedures. However, the element should also describe the process and decision-making criteria such as approval findings and analyze any potential constraints on housing for persons with disabilities. The element currently details that licensed residential care facilities serving six or fewer persons are permitted in the R-1 zone. However, it does not discuss how residential care facilities serving seven or more persons are permitted. If non-licensed group homes are only allowed with a conditional use permit, the element should analyze the process as a potential constraint on housing for persons with disabilities and add or modify programs as appropriate to ensure zoning permits group homes objectively with approval certainty. Finally, the element includes in its definition of family “This shall not include an individual paying rent to a landlord for the purpose of temporarily residing in a dwelling unit.” The element must clarify what is meant by this phrase and analyze its inclusion for potential constraints on persons with disabilities.
5. An analysis of potential and actual nongovernmental constraints upon the
maintenance, improvement, or development of housing for all income levels, including the availability of financing, the price of land, the cost of construction, the requests to develop housing at densities below those anticipated in the analysis required by subdivision (c) of Government Code section 65583.2, and the length of time between receiving approval for a housing development and submittal of an application for building permits for that housing development that hinder the construction of a locality’s share of the regional housing need in accordance with Government Code section 65584. The analysis shall also demonstrate local efforts to remove nongovernmental constraints that create a gap between the locality’s planning for the development of housing for all income levels and the construction of that housing. (Gov. Code, § 65583, subd. (a)(6).) The element must be revised to include analysis of requests to develop housing at densities below those anticipated, and the length of time between receiving approval for a housing development and submittal of an application for building permits that potentially hinder the construction of a locality’s share of the regional housing need.
6. Analyze any special housing needs such as elderly; persons with disabilities,
including a developmental disability; large families; farmworkers; families with female
City of San Marino’s 6th Cycle Draft Housing Element Page 9 December 31, 2021
heads of households; and families and persons in need of emergency shelter. (Gov. Code, § 65583, subd. (a)(7).)
General: While the element includes data and a general discussion of housing challenges faced by special needs households, it still must provide an analysis of the existing needs and resources for each special need group including seniors, female-headed households, large householders, and extremely low-income (ELI) households. For example, the element should discuss the existing resources to meet housing needs (availability of shelter beds, number of large units, number of deed restricted units, etc.,), an assessment of any gaps in resources, and proposed policies, programs, and funding to help address those gaps. Extremely Low-Income Households (ELI): While the element quantifies existing and projected ELI households, it must also analyze their housing needs. The analysis of ELI housing needs could consider tenure and rates of overcrowding and overpayment and consider existing housing resources. Persons with Developmental Disabilities: The element provides (page 10) information on Special Needs Populations. However, the element must quantify the number of persons with developmental disabilities and analyze the special housing needs of persons with developmental disabilities. The term developmental disability refers to a severe and chronic disability attributable to a mental or physical impairment, such as cerebral palsy, epilepsy, or autism, that begins before individuals reach adulthood. (Welfare and Institutions Code, § 4512.) The analysis could include the following:
• a quantification of the total number of persons with developmental disabilities; • a description of the types of developmental disabilities; • a description of the housing need, including a description of the potential
housing problems; and • a discussion of resources, policies and programs including existing housing
and services, for persons with developmental disabilities.
C. Housing Programs 1. Include a program which sets forth a schedule of actions during the planning period,
each with a timeline for implementation, which may recognize that certain programs are ongoing, such that there will be beneficial impacts of the programs within the planning period, that the local government is undertaking or intends to undertake to implement the policies and achieve the goals and objectives of the Housing Element through the administration of land use and development controls, the provision of regulatory concessions and incentives, and the utilization of appropriate federal and state financing and subsidy programs when available. The program shall include an identification of the agencies and officials responsible for the implementation of the various actions. (Gov. Code, § 65583, subd. (c).)
To address the program requirements of Government Code section 65583, subdivision (c)(1-6), and to facilitate implementation, programs should include: (1) a description of the City’s specific role in implementation; (2) definitive implementation
City of San Marino’s 6th Cycle Draft Housing Element Page 10 December 31, 2021
timelines; (3) objectives, quantified where appropriate; and (4) identification of responsible agencies and officials. All programs must be revised to demonstrate that they will have a beneficial impact within the planning period. Beneficial impact means specific commitment to deliverables, measurable metrics or objectives, definitive deadlines, dates, or benchmarks for implementation. Programs containing unclear language (e.g., “Evaluate”; “Consider”; “Encourage”; etc.) must be amended to include more specific and measurable actions. Deliverables should occur early in the planning period to ensure actual housing outcomes. The element must provide quantified objectives where appropriate and discrete timing for all programs (e.g., month and year) to account for how often the action will occur as well as to ensure a beneficial impact throughout the planning period.
2. Identify actions that will be taken to make sites available during the planning period with appropriate zoning and development standards and with services and facilities to accommodate that portion of the city’s or county’s share of the regional housing need for each income level that could not be accommodated on sites identified in the inventory completed pursuant to paragraph (3) of subdivision (a) without rezoning, and to comply with the requirements of Government Code section 65584.09. Sites shall be identified as needed to facilitate and encourage the development of a variety of types of housing for all income levels, including multifamily rental housing, factory-built housing, mobilehomes, housing for agricultural employees, supportive housing, single-room occupancy units, emergency shelters, and transitional housing. (Gov. Code, § 65583, subd. (c)(1).)
As noted in Finding B3, the element does not include a complete site analysis, therefore, the adequacy of sites and zoning were not established. Based on the results of a complete sites inventory and analysis, the City may need to add or revise programs to address a shortfall of sites or zoning available to encourage a variety of housing types. In addition, the element should be revised as follows:
Shortfall of Adequate Sites: Currently the element identifies a shortfall of adequate sites to accommodate the RHNA within the planning period. In order to provide sufficient sites to accommodate the RHNA, Program 1.6, 1.7, 1.11, 1.12, commit to, among other things, creating several new overlays and modification of the zoning code. However, in order to accommodate the lower-income need, programs must specifically commit to acreage, allowable densities and anticipated units. In addition, the program should specifically commit to rezoning pursuant to Government Code section 65583.2, subdivisions (h) and (i). The program must commit to:
• permit owner-occupied and rental multifamily uses by-right for developments in which 20 percent or more of the units are affordable to lower income households. By-right means local government review must not require a conditional use permit, planned unit development permit, or other discretionary review or approval.
• accommodate a minimum of 16 units per site;
City of San Marino’s 6th Cycle Draft Housing Element Page 11 December 31, 2021
• require a minimum density of 20 units per acre; and • at least 50 percent of the lower-income need must be accommodated on sites
designated for residential use only or on sites zoned for mixed uses that accommodate all of the very low and low-income housing need, if those sites:
o allow 100 percent residential use, and o require residential use occupy 50 percent of the total floor area of a
mixed-use project.
Program 1.15: While this program commits to the City following the Surplus Lands Act for sites such as the City-owned Stoneman property, it does not commit to the other action items outlined on page 50 including instigating the lot split, rezoning, the release of the request for proposals, and other actions necessary to facilitate development of this site within the planning period. Programs to Facilitate Redevelopment of Nonvacant Sites: The element must include a program with specific actions and timelines to assist in the development of housing identified in the sites inventory. The program(s) could commit the City to adopting priority processing, granting fee waivers or deferrals, modifying development standards, granting concessions and incentives for housing developments that include units affordable to lower and moderate-income households; assisting, supporting or pursuing funding applications; and working with housing developers coordinate and implement a strategy for developing housing affordable to lower- and moderate-income households.
3. The Housing Element shall contain programs which assist in the development of
adequate housing to meet the needs of extremely low-, very low-, low- and moderate-income households. (Gov. Code, § 65583, subd. (c)(2).)
The element must include a program(s) with specific actions and timelines to assist in the development of housing for lower-income households, including ELI and special needs households. The program(s) could commit the City to adopting priority processing, granting fee waivers or deferrals, modifying development standards, granting concessions and incentives for housing developments that include units affordable to ELI and special needs households; proactive outreach and assistance to non-profit service providers and developers; prioritizing some funding for housing developments with ELI and special needs households; assisting, supporting or pursuing funding applications; and annual outreach with housing developers to coordinate and pursue housing opportunities.
4. Address and, where appropriate and legally possible, remove governmental and nongovernmental constraints to the maintenance, improvement, and development of housing, including housing for all income levels and housing for persons with disabilities. The program shall remove constraints to, and provide reasonable accommodations for housing designed for, intended for occupancy by, or with supportive services for, persons with disabilities. (Gov. Code, § 65583, subd. (c)(3).)
As noted in Findings B4 and B5, the element requires a complete analysis of potential governmental and nongovernmental constraints. Depending upon the
City of San Marino’s 6th Cycle Draft Housing Element Page 12 December 31, 2021
results of that analysis, the City may need to revise or add programs and address and remove or mitigate any identified constraints.
5. Promote and affirmatively further fair housing opportunities and promote housing throughout the community or communities for all persons regardless of race, religion, sex, marital status, ancestry, national origin, color, familial status, or disability, and other characteristics protected by the California Fair Employment and Housing Act (Part 2.8 (commencing with Section 12900) of Division 3 of Title 2), Section 65008, and any other state and federal fair housing and planning law. (Gov. Code, § 65583, subd. (c)(5).) Program to Affirmatively Further Fair Housing:
As noted in Finding B1, the element must include a complete analysis of AFFH. The
element must be revised to add goals and actions based on the outcomes of a complete analysis. In addition, While the element includes Program 3.2 which describes how the City responds to fair housing complaints, it must also include actions that promote and AFFH opportunities and address priority issues identified in the AFFH section of the element. For example, the element could include a program committing to implement Government Code section 8899.50(b) which requires the City to administer its programs and activities relating to housing and community development in a manner to AFFH and take no action that is materially inconsistent with its obligation to AFFH.
D. Quantified Objectives
Establish the number of housing units, by income level, that can be constructed, rehabilitated, and conserved over a five-year time frame. (Gov. Code, § 65583, subd. (b)(1 & 2).) The element must include quantified objectives to establish an estimate of housing units by income category that can be constructed, rehabilitated, and conserved over the planning period. While the element includes these objectives by income group for construction, the element must also describe any conservation or preservation objectives and describe rehabilitation by income category. Strong program objectives and commitments are especially critical for rehabilitation as survey results outlined on page 161 demonstrate that 65 percent of respondents are concerned that older homes will be deteriorating and in need of repair in the next ten years.
TABLE OF CONTENTS
SECTION I: INTRODUCTION & SUMMARY .................................................................... 1
1.1 INTRODUCTION .................................................................................................................................... 1
1.2 DEFINITION AND PURPOSE ............................................................................................................ 1
1.3 CONSISTENCY WITH STATE LAWS AND GENERAL PLAN ................................................. 1
1.4 PUBLIC PARTICIPATION ..................................................................................................................... 2
1.5 ORGANIZATION OF THE HOUSING ELEMENT ...................................................................... 3
1.6 DEFINITION OF TERMS ...................................................................................................................... 4
1.7 DATA SOURCES ...................................................................................................................................... 4
1.8 COMMUNITY PROFILE ........................................................................................................................ 5
1.9 CHANGING HOUSING NEEDS AND DEMOGRAPHICS ........................................................ 7
1.10 CHARACTERISTICS OF HOUSING STOCK .............................................................................. 12
1.11 SUMMARY OF CONSTRAINTS....................................................................................................... 14
1.12 SUMMARY OF FAIR HOUSING ANALYSIS (FHA) .................................................................. 15
1.13 REGIONAL HOUSING NEEDS ALLOCATION ....................................................................... 17
1.14 2014 SAN MARINO HOUSING ELEMENT REVIEW .............................................................. 18
1.15 PROGRAM CHANGES IN 2021 HOUSING ELEMENT .......................................................... 20
SECTION II: HOUSING STRATEGY ................................................................................. 28
2.1 QUANTIFIED OBJECTIVES .............................................................................................................. 40
SECTION III: HOUSING SITES ......................................................................................... 42
3.1 CONTEXT ................................................................................................................................................ 42
3.2 DEVELOPMENT CAPACITY ASSUMPTIONS ............................................................................. 43
3.3 REALISTIC CAPACITY OF SITES ZONED FOR HOUSING .................................................. 47
3.3 REALISTIC CAPACITY OF OTHER SITES ALLOWING HOUSING .................................... 50
3.4 RHNA SHORTFALL .............................................................................................................................. 51
3.5 PROGRAMS & REZONING TO ENSURE ADEQUATE SITES .............................................. 54
3.6 INFRASTRUCTURE............................................................................................................................... 64
3.7 ENVIRONMENTAL CONSIDERATIONS ..................................................................................... 65
SECTION IV: TECHNICAL BACKGROUND REPORT ................................................... 66
4.1 INTRODUCTION .................................................................................................................................. 66
4.2 PRE-CERTIFIED SCAG DATASET .................................................................................................. 66
4.3 LOCAL HOUSING PROGRAMS & RESOURCES ........................................................................ 67
4.4 HOUSING CONSTRAINTS ANALYSIS .......................................................................................... 70
4.5 FAIR HOUSING ANALYSIS ............................................................................................................... 92
APPENDIX A: SCAG LOCAL HOUSING DATA ............................................................................. 128
APPENDIX B: COMMUNITY ENGAGEMENT .............................................................................. 150
ATTACHMENT A: COMMUNITY SURVEY RESULTS ................................................................. 177
APPENDIX C: CITY OF SAN MARINO INSIGHT MARKET ANALYSIS, 2019. ................... 183
TABLE OF FIGURES
FIGURE 1: SAN MARINO LOCATION WITHIN LARGER LOS ANGELES COUNTY .......... 6
FIGURE 2: SAN MARINO NEIGHBORHOOD DEVELOPMENT CHRONOLOGY .............. 7
FIGURE 3: CURRENT POPULATION BY AGE AND SEX ............................................................... 8
FIGURE 4: EMPLOYMENT BY INDUSTRY .......................................................................................... 9
FIGURE 5: HOUSEHOLDS BY HOUSEHOLD SIZE ........................................................................ 11
FIGURE 6: VACANT UNITS BY TYPE .................................................................................................. 13
FIGURE 7: GROWTH IN SAN MARINO AND LOS ANGELES COUNTY HOMES SALE PRICES, 2012 - 2021 ...................................................................................................................................... 14
FIGURE 8: RESIDENTIAL UNITS IN SAN MARINO, BY YEAR BUILT ................................... 42
FIGURE 9: UNDERGROUND PARKING ENTRANCE FOR EAST WEST BUILDING, 2090 HUNTINGTON DR ..................................................................................................................................... 43
FIGURE 10: PARKING FOR WELLS FARGO BUILDING, 2375 HUNTINGTON DR ........... 44
FIGURE 11: SITES FROM 810 TO 900 HUNTINGTON DR ............................................................ 45
FIGURE 12: SITES AT HUNTINGTON DR AND S SAN GABRIEL BLVD ............................... 45
FIGURE 13: SAN MARINO SECURITY BUILDING AND MIXED OCCUPANCY DEVELOPMENT, 2405 HUNTINGTON DR ....................................................................................... 46
FIGURE 14: STONEMAN SITE AND PROPOSED SUBDIVISION .............................................. 56
FIGURE 15: HUNTINGTON SITE FOR HOUSING OVERLAY ................................................... 57
FIGURE 16: ALL SITES FOR HOUSING OVERLAY ........................................................................ 58
FIGURE 17: PARCELS ELIGIBLE FOR MISSING MIDDLE HOUSING .................................... 60
FIGURE 18: FAULT, LIQUEFACTION AND LANDSLIDE ZONES MAP ................................. 88
FIGURE 19: CAL FIRE: FIRE HAZARD SEVERITY ZONE MAP ................................................. 89
FIGURE 20: CITY OF SAN MARINO ENHANCED FIRE INSPECTION ZONE MAP .......... 90
FIGURE 21: 1930'S HOLC REDLINING GRADE ............................................................................... 95
FIGURE 22: PREDOMINANT POPULATION AFRICAN AMERICAN MAJORITY ............... 99
FIGURE 23: PREDOMINANT POPULATION ASIAN MAJORITY ........................................... 100
FIGURE 24: PREDOMINANT POPULATION HISPANIC/LATINO MAJORITY ................ 101
FIGURE 25: PREDOMINANT POPULATION NATIVE AMERICAN MAJORITY ............... 101
FIGURE 26: PREDOMINANT POPULATION WHITE MAJORITY .......................................... 102
FIGURE 27: RACIAL DOT DENSITY MAP OF SAN MARINO, CA .......................................... 103
FIGURE 28: RACIAL DOT DENSITY MAP OF THE SAN GABRIEL VALLEY COUNCIL OF GOVERNMENTS....................................................................................................................................... 103
FIGURE 29: 2018 DIVERSITY INDEX OF SAN GABRIEL VALLEY ........................................ 105
FIGURE 30: PERCENTAGE OF ADULTS LIVING WITH A SPOUSE BY CENSUS TRACT ......................................................................................................................................................................... 106
FIGURE 31: PERCENTAGE OF CHILDREN LIVING IN A HOUSEHOLD WITH A MARRIED COUPLE BY CENSUS TRACT ......................................................................................... 106
FIGURE 32: PERCENTAGE OF CHILDREN LIVING IN FEMALE-HEADED HOUSEHOLDS WITH NO SPOUSE OR PARTNER PRESENT BY CENSUS TRACT ......... 107
FIGURE 33: HOUSEHOLDS BY HOUSEHOLD SIZE ................................................................... 108
FIGURE 34: PERCENT OF DISABLED POPULATION BY CENSUS TRACT 2015-2019 ... 109
FIGURE 35: MEDIAN INCOME BASED ON ACS 5-YEAR ESTIMATES 2010-2014 ............ 110
FIGURE 36: MEDIAN INCOME BASED ON ACS 5-YEAR ESTIMATES 2015-2019 ............ 110
FIGURE 37: HOUSEHOLDS EXPERIENCING POVERTY IN SAN MARINO ..................... 111
FIGURE 38: LOW- AND MODERATE- INCOME HOUSEHOLDS IN SAN MARINO BY BLOCK GROUP 2011-2015 ...................................................................................................................... 112
FIGURE 39: PERCENTAGE OF LOW- AND MODERATE- INCOME HOUSEHOLDS IN SAN GABRIEL VALLEY REGION BY BLOCK GROUP 2011-2015 ........................................... 113
FIGURE 40: LOCATION AFFORDABILITY INDEX ..................................................................... 115
FIGURE 41: TCAC OPPORTUNITY AREA INDEX MAP ............................................................. 116
FIGURE 42: ACHIEVEMENT GAP RESULTS RACIAL/DEMOGRAPHIC BREAKDOWN ......................................................................................................................................................................... 117
FIGURE 43: EDUCATIONAL OPPORTUNITY INDEX SCORES IN SAN GABRIEL VALLEY REGION ....................................................................................................................................................... 118
FIGURE 44: CALENVIROSCREEN INDEX MAP OF SAN MARINO AND SURROUNDING AREAS ........................................................................................................................................................... 119
FIGURE 45: TRANSIT SCORE IN SAN MARINO AND NEIGHBORING COMMUNITIES ......................................................................................................................................................................... 121
FIGURE 46: ECONOMIC INDEX MAP OF SAN MARINO AND SURROUNDING AREAS ......................................................................................................................................................................... 122
FIGURE 47: INFLOW/ OUTFLOW ANALYSIS OF SAN MARINO .......................................... 123
FIGURE 48: HUD JOBS PROXIMITY INDEX MAP OF SAN MARINO AND SURROUNDING AREAS ........................................................................................................................ 124
FIGURE 49: MONTHLY OWNER COSTS FOR MORTGAGE HOLDERS .............................. 125
FIGURE 50: CROWDING BY EXTENT AND TENURE ............................................................... 126
FIGURE 51: SUBSTANDARD HOUSING .......................................................................................... 126
San Marino – Final 2021-2029 Housing Element February 9, 2022
1
SECTION I: INTRODUCTION & SUMMARY
1.1 INTRODUCTION
This chapter of the San Marino General Plan presents goals, policies, programs, and supporting
information related to the provision of housing for existing and future residents of the City. The
purpose of the Housing Element is twofold: 1) to present specific policies and actions for housing
development to meet San Marino’s specific, identified housing needs; and 2) to meet regional
standards and achieve State certification, pursuant to statutory requirements.
1.2 DEFINITION AND PURPOSE
The Housing Element of the General Plan is a detailed statement of the housing goals, policies,
programs, and quantified objectives for the City. The Element is based on a comprehensive
technical assessment of existing housing policies and programs; current and projected housing
needs, especially related to low income households and special needs populations; an analysis of
market, environmental, governmental, and other factors which constrain housing production; an
assessment of ways that the City can affirmatively further fair housing for its residents; an
inventory of sites available for housing construction; and an assessment of new programs and
policies that can enhance housing production in the City.
The purpose of the Housing Element is to guide decision-making by elected and appointed
officials. Specifically, the Housing Element sets forth how the City will address the need for
housing, especially by low- and moderate-income families and special needs families and
individuals. The Housing Element also provides housing-related data and information to the
public.
1.3 CONSISTENCY WITH STATE LAWS AND GENERAL PLAN
State law requires that the General Plan include an integrated, consistent set of goals and policies.
The City of San Marino’s General Plan contains elements relating to land use, community services,
natural resources, safety (including noise), housing, and circulation. The 2021 Housing Element
provides goals, policies and implementation measures that are consistent with all other elements
of the General Plan; amendments to the City’s Land Use Element and zoning are planned for
immediately after adoption of the Housing Element. As the General Plan is amended in the future,
the City will ensure the Housing Element remains consistent with the General Plan.
New State law requires that the Safety Element be updated to address climate adaptation upon
revision of the Housing Element. The City will ensure compliance with this requirement by
updating and adopting its updated Safety Element concurrent with the 2021 Housing Element.
The City will provide a copy of the Housing Element to water and sewer service providers and
has coordinated with these agencies in the preparation of this Housing Element. Within 60 days
after adoption, the City will send the updated Housing Element to water and sewer providers with
a memo regarding the State-mandated water and sewer service priority for housing projects that
San Marino – Final 2021-2029 Housing Element February 9, 2022
2
will help San Marino meet its regional housing need for lower-income households (Government
Code Section 65589.7). Because San Marino does not have any disadvantaged communities, an
Environmental Justice Element is not required; however, a fair housing analysis has been
conducted and policies and programs to affirmatively further fair housing are included within the
Housing Element.
1.4 PUBLIC PARTICIPATION
Housing issues affect the entire community and can be confusing and contentious. State
requirements about what Housing Elements must allow often seem at odds with long-standing
community values. The public participation requirement of Housing Element law presents an
opportunity to engage constituents in defining housing issues, and in creating solutions that both
meet the needs of the community and the requirements of state law.
The ongoing restrictions on gatherings due to the COVID-19 pandemic have forced community
outreach and engagement into a virtual world. While in some cases this has made it possible for
more people to be engaged in the process, a digital divide often exists in cases where households
may lack internet connections or may be unable to attend virtual meetings due to work
obligations.
To ensure that community outreach during the pandemic was as equitable as possible, the
community outreach program was designed to provide participation opportunities via cell phone
and at the convenience of the resident. San Marino’s Housing Element Update has included the
public outreach efforts summarized below and detailed in Section 4:
• December 7, 2020: A Community Town Hall was held via Zoom. The Town Hall was
covered by the press.
• December 29, 2020: City established a Housing Element Update webpage
http://cityofsanmarino.org/housingelement The webpage provides the current update
status, access to meeting agendas and materials, document drafts, a dedicated email for
comments about the Housing Element Update, and community opinion surveys in Spanish,
Chinese and English.
• November 2020- January 2021: Community opinion surveys were conducted in English,
Spanish, and Chinese.
• January-April 2021: Stakeholder interviews conducted with responsive contacts
representing for- and not-for-profit developers, advocacy groups, and service providers,
including Southern California Non-profit Housing Association; Milestone Housing
Development Corporation; the Chinese Club of San Marino; the Los Angeles County
Economic Development Corporation; and the Pasadena-Foothills Association of Realtors.
• February 24, 2021: Planning Commission held a publicly noticed workshop on the
Housing Element Update. Commission discussed challenges faced by City, took public
input, and provided policy direction to staff.
• April 16, 2021: City Council held a publicly noticed workshop on the Housing Element
Update and reviewed the Draft Housing Strategy (Policies and Programs for the Housing
Element), potential sites, and a preliminary rezoning program to address the City’s
San Marino – Final 2021-2029 Housing Element February 9, 2022
3
RHNA shortfall. Notices for this workshop were sent to the outreach and notification list,
as well as to those who had provided contact information on the community surveys and
those that had spoken at previous meetings.
• July 20, 2021: Public Review Draft Housing Element was released and made available on
the established website. Notices of the release of the draft document were sent to the
outreach and notification list, including those who had spoken at previous meetings.
• July 17, 2021: City Council held a publicly noticed workshop to review the Draft Housing
Element for possible transmittal to the State. The City Council took public comments and
set another meeting to continue the public discussion.
• August 3, 2021: City Council held a publicly noticed meeting to receive public input
regarding the Housing Element Update and provided further direction to staff and
consultants regarding sites to include on the inventory lists to be considered for
rezoning.
• August 25, 2021: City held a Town Hall to continue to receive public input on the Draft
Housing Element and advise the community of future opportunities to provide comments
on the updated Draft Housing Element or to meet with a planner individually to discuss
the update process.
• September 24, 2021: The City Council held a duly noticed public meeting to take public
comment and requested additional changes to be made to the Draft Housing Element;
• October 29, 2021: The City Council held a public meeting and authorized staff to
transmit the Draft to HCD to begin their review.
• November 1, 2021: The Draft Housing Element and all public comments received to date
were transmitted to HCD to begin their mandatory 60-day review period, during which
time all interested parties were invited and encouraged to submit comments directly to
HCD.
• December31, 2021: HCD responded with several changes needed for the Draft Housing
Element to be compliant with State law. These changes were subsequently considered
by the Planning Commission.
• January 11, 2021: Mitigated Negative Declaration released
• January 26, 2022: Planning Commission hearing on IS-ND and Draft Housing Element;
• February 9, 2022: City Council hearing to adopt IS-ND and Housing Element
1.5 ORGANIZATION OF THE HOUSING ELEMENT
The Housing Element is organized into four main sections. Section 1 introduces the overall
Housing Element update effort, a summary of housing needs and constraints, a Fair Housing
summary, and a review of the effectiveness of the 2014 Housing Element and the City’s progress
in its implementation. Section 2 sets forth the City’s Housing Strategy, which is comprised of the
Goals, Policies and Programs that it intends to implement over the next 8-year planning cycle.
The City’s Quantified Objectives are also included in Section 2. Section 3 presents a detailed
housing site inventory, including a discussion of the availability of services, and compares this
inventory to the City’s projected housing needs. Section 4, the Technical Background Report,
provides statutorily required data including an assessment of housing needs & programs, an
analysis of non-governmental and governmental constraints to affordable housing provision, and
San Marino – Final 2021-2029 Housing Element February 9, 2022
4
a discussion of special needs populations. Pre-certified housing and demographic data provided
by the Southern California Association of Governments (SCAG) is included here.
1.6 DEFINITION OF TERMS
Throughout the Housing Element, a variety of technical terms related to income levels are used
in describing and quantifying conditions and objectives. The definitions of these terms follow:
Affordable Housing -- Housing which costs no more than 30 percent of a low-, very low-, or
extremely low-income household’s gross monthly income. For rental housing, the residents may
pay up to 30 percent of gross income on rent plus tenant-paid utilities. For homeownership,
residents can pay up to 30 percent on the combination of mortgage payments, taxes, insurance,
and Homeowners' dues.
Area Median Income (AMI) -- The income figure representing the middle point of all Los
Angeles household incomes. Fifty percent of households earn more than or equal to this figure
and 50 percent earn less than or equal to this figure. The AMI varies according to the size of the
household. For the year 2021, the AMI for a four-person household in Los Angeles County was
$80,000.
Extremely Low-Income Households (ELI) -- Households earning not more than 30 percent
of the Los Angeles County AMI.
Very Low-Income Households (VLI) -- Households earning between 31 and 50 percent of
the Los Angeles County AMI.
Low Income Households -- Households earning between 51 and 80 percent of the Los Angeles
County AMI.
Moderate Income Households -- Households earning 81 to 120 percent of the Los Angeles
County AMI.
Middle Income Households – Households earning from 80 percent to 150 percent of the Los
Angeles County AMI.
Above Moderate-Income Households -- Households earning not less than 120 percent of the
Los Angeles County AMI.
1.7 DATA SOURCES
The 2021 Housing Element Update makes full use of the pre-certified data package provided by
SCAG, which is contained in its entirely within the Technical Background Report. Data provided
within this policy document is taken from the SCAG data set and by other sources as noted. In
addition to the SCAG dataset, the following sources of data were used to help identify historic
patterns of segregation, assess constraints to housing and the market conditions in San Marino;
and to better identify specific housing needs:
● U.S. Census 2010
● 2014-2018 American Community Survey 5-year Estimates
San Marino – Final 2021-2029 Housing Element February 9, 2022
5
● Realtor.com
● Zillow.com
● Los Angeles Economic Development Commission 2021 Economic Forecast
● LACDA Analysis of Impediments to Fair Housing Choice/Assessment of Fair Housing
● Connect SoCal 2020-2045
● Los Angeles County Affordable Housing Action Plan, 2018
● Los Angeles County Office of the Assessor
● Pasadena-Foothills Association of Realtors
● Los Angeles Homeless Services Authority 2020 Homeless Count, by City
● City of San Marino Building Permit Data
● San Marino Historic Resource Survey, October 2020
● Historic neighborhood development data provided by City of San Marino staff
● 2013-2017 Comprehensive Housing Affordability Strategy (CHAS) data for San Marino
● EPA’s San Marino Environmental Justice Report
● Rich Blocks, Poor Blocks – based on the 2012-2016 American Community Survey for San
Marino
● Income by Neighborhoods Map, CityData.com accessed March 2021
● A Portrait of Los Angeles County, San Marino–Measure of America, as of March 2021
● Los Angeles County Annual Affordable Housing Outcomes Report, CHP, 30 April 2019
● CA Department of Housing and Community Development, Housing Needs Data
Certification Letter, 2020
1.8 COMMUNITY PROFILE
San Marino is a small city within the very large and diverse Los Angeles County (Figure 1). It is
located 11 miles from the City of Los Angeles, and is surrounded by the cities of Pasadena, South
Pasadena, San Gabriel, and Alhambra. While San Marino is served by the nearby freeway network
(210 and 164) and by the Metro bus line 78/79/379, it does not have high-speed rail services and
does not contain any Priority Growth Areas envisioned in Connect SoCal 2020-2045. San Marino’s
2020 population of 12,870 represents a decrease from the 2010 population of 13,187. This lack
of growth is consistent with that of Los Angeles County and the State of California, both of which
have recently begun decreasing in population.
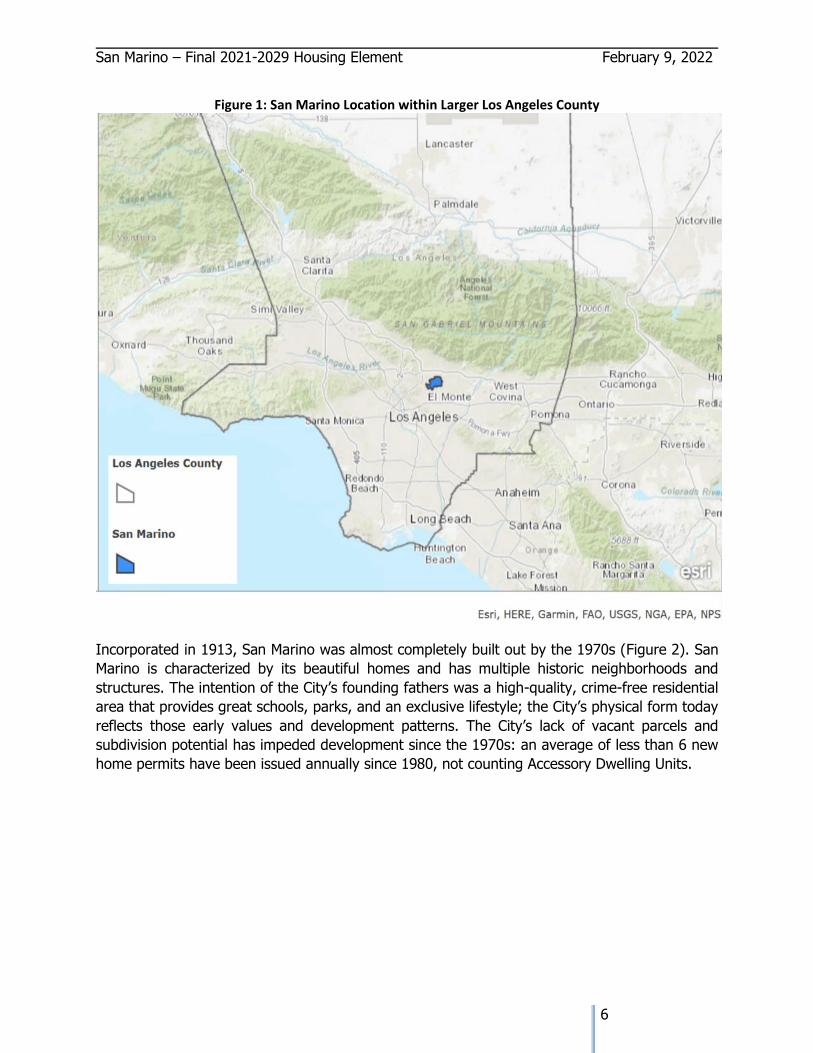
San Marino – Final 2021-2029 Housing Element February 9, 2022
6
Figure 1: San Marino Location within Larger Los Angeles County
Incorporated in 1913, San Marino was almost completely built out by the 1970s (Figure 2). San
Marino is characterized by its beautiful homes and has multiple historic neighborhoods and
structures. The intention of the City’s founding fathers was a high-quality, crime-free residential
area that provides great schools, parks, and an exclusive lifestyle; the City’s physical form today
reflects those early values and development patterns. The City’s lack of vacant parcels and
subdivision potential has impeded development since the 1970s: an average of less than 6 new
home permits have been issued annually since 1980, not counting Accessory Dwelling Units.
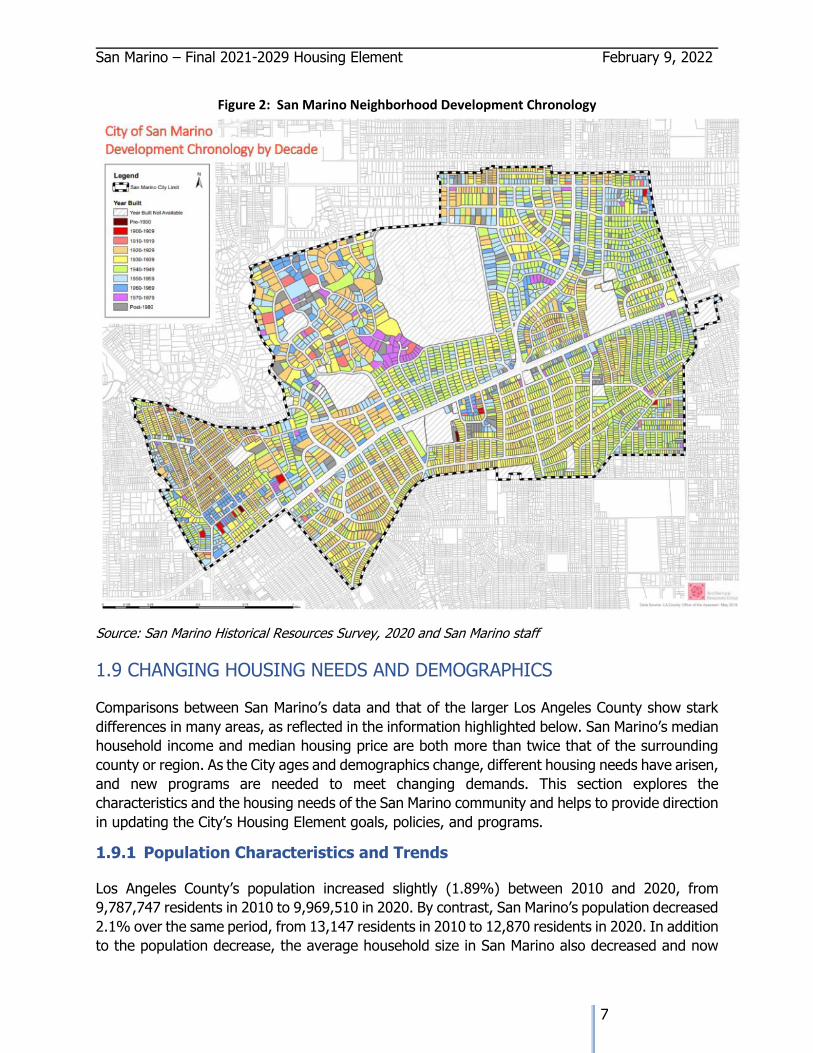
San Marino – Final 2021-2029 Housing Element February 9, 2022
7
Figure 2: San Marino Neighborhood Development Chronology
Source: San Marino Historical Resources Survey, 2020 and San Marino staff
1.9 CHANGING HOUSING NEEDS AND DEMOGRAPHICS
Comparisons between San Marino’s data and that of the larger Los Angeles County show stark
differences in many areas, as reflected in the information highlighted below. San Marino’s median
household income and median housing price are both more than twice that of the surrounding
county or region. As the City ages and demographics change, different housing needs have arisen,
and new programs are needed to meet changing demands. This section explores the
characteristics and the housing needs of the San Marino community and helps to provide direction
in updating the City’s Housing Element goals, policies, and programs.
1.9.1 Population Characteristics and Trends
Los Angeles County’s population increased slightly (1.89%) between 2010 and 2020, from
9,787,747 residents in 2010 to 9,969,510 in 2020. By contrast, San Marino’s population decreased
2.1% over the same period, from 13,147 residents in 2010 to 12,870 residents in 2020. In addition
to the population decrease, the average household size in San Marino also decreased and now
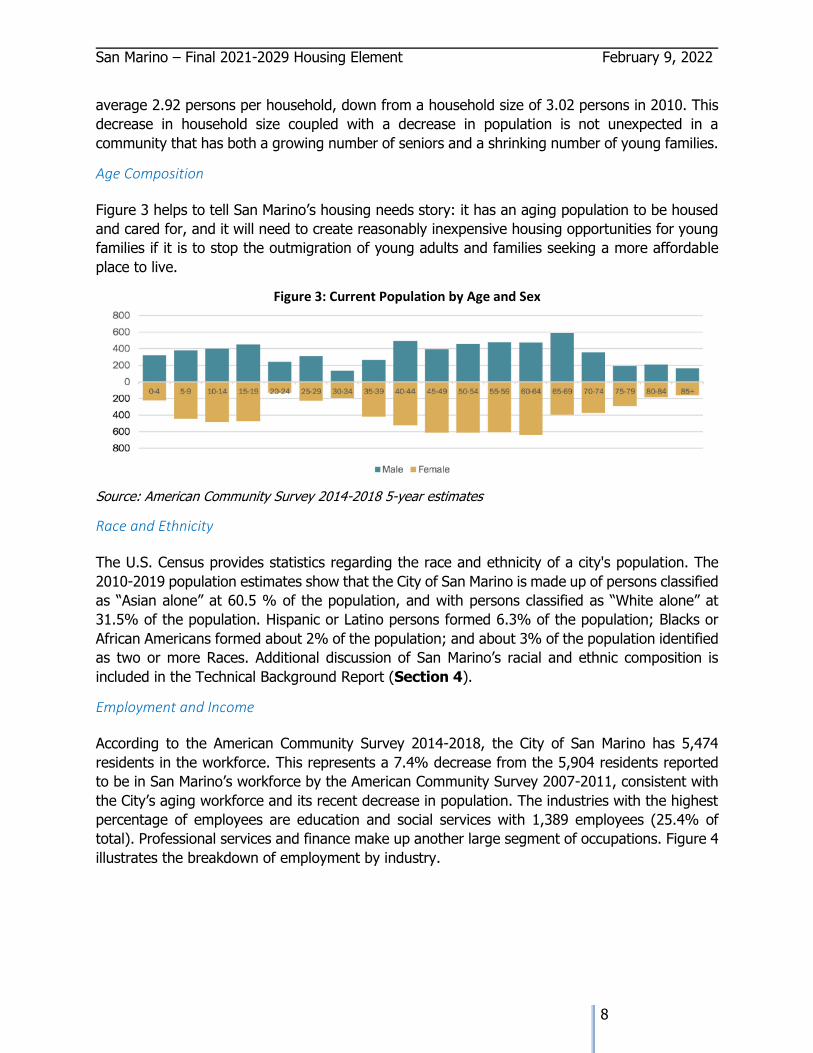
San Marino – Final 2021-2029 Housing Element February 9, 2022
8
average 2.92 persons per household, down from a household size of 3.02 persons in 2010. This
decrease in household size coupled with a decrease in population is not unexpected in a
community that has both a growing number of seniors and a shrinking number of young families.
Age Composition
Figure 3 helps to tell San Marino’s housing needs story: it has an aging population to be housed
and cared for, and it will need to create reasonably inexpensive housing opportunities for young
families if it is to stop the outmigration of young adults and families seeking a more affordable
place to live.
Figure 3: Current Population by Age and Sex
Source: American Community Survey 2014-2018 5-year estimates
Race and Ethnicity
The U.S. Census provides statistics regarding the race and ethnicity of a city's population. The
2010-2019 population estimates show that the City of San Marino is made up of persons classified
as “Asian alone” at 60.5 % of the population, and with persons classified as “White alone” at
31.5% of the population. Hispanic or Latino persons formed 6.3% of the population; Blacks or
African Americans formed about 2% of the population; and about 3% of the population identified
as two or more Races. Additional discussion of San Marino’s racial and ethnic composition is
included in the Technical Background Report (Section 4).
Employment and Income
According to the American Community Survey 2014-2018, the City of San Marino has 5,474
residents in the workforce. This represents a 7.4% decrease from the 5,904 residents reported
to be in San Marino’s workforce by the American Community Survey 2007-2011, consistent with
the City’s aging workforce and its recent decrease in population. The industries with the highest
percentage of employees are education and social services with 1,389 employees (25.4% of
total). Professional services and finance make up another large segment of occupations. Figure 4
illustrates the breakdown of employment by industry.
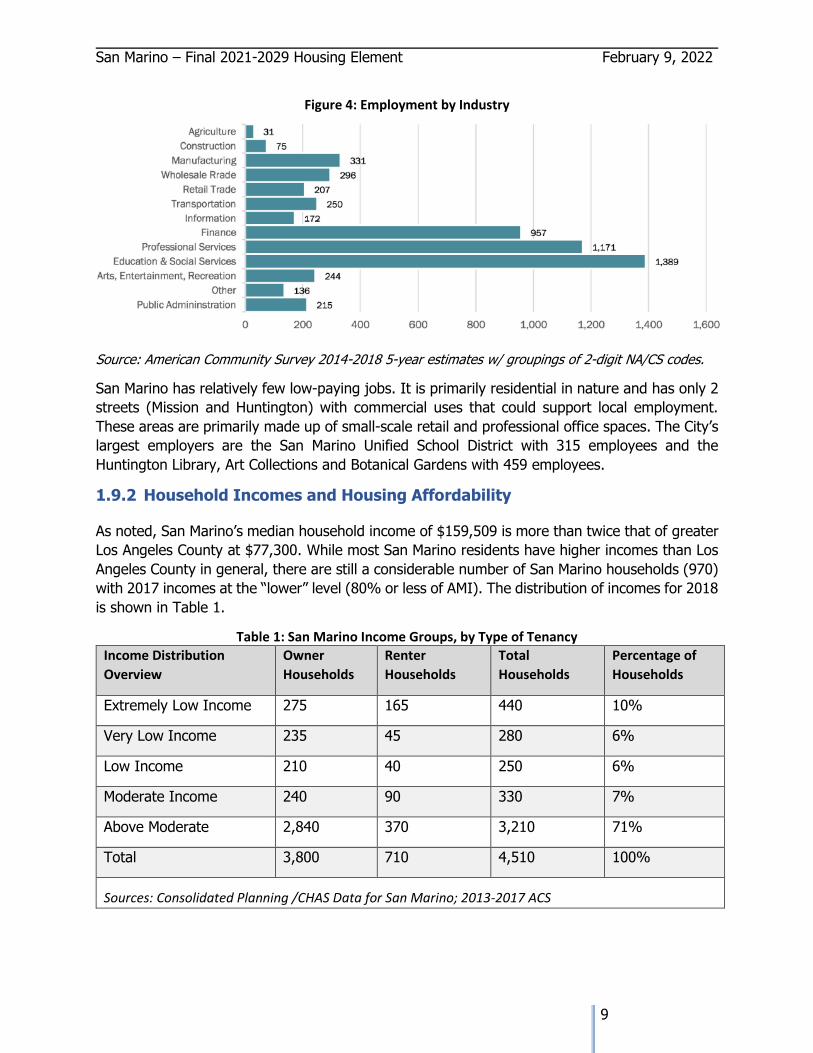
San Marino – Final 2021-2029 Housing Element February 9, 2022
9
Figure 4: Employment by Industry
Source: American Community Survey 2014-2018 5-year estimates w/ groupings of 2-digit NA/CS codes.
San Marino has relatively few low-paying jobs. It is primarily residential in nature and has only 2
streets (Mission and Huntington) with commercial uses that could support local employment.
These areas are primarily made up of small-scale retail and professional office spaces. The City’s
largest employers are the San Marino Unified School District with 315 employees and the
Huntington Library, Art Collections and Botanical Gardens with 459 employees.
1.9.2 Household Incomes and Housing Affordability
As noted, San Marino’s median household income of $159,509 is more than twice that of greater
Los Angeles County at $77,300. While most San Marino residents have higher incomes than Los
Angeles County in general, there are still a considerable number of San Marino households (970)
with 2017 incomes at the “lower” level (80% or less of AMI). The distribution of incomes for 2018
is shown in Table 1.
Table 1: San Marino Income Groups, by Type of Tenancy
Income Distribution
Overview
Owner
Households
Renter
Households
Total
Households
Percentage of
Households
Extremely Low Income 275 165 440 10%
Very Low Income 235 45 280 6%
Low Income 210 40 250 6%
Moderate Income 240 90 330 7%
Above Moderate 2,840 370 3,210 71%
Total 3,800 710 4,510 100%
Sources: Consolidated Planning /CHAS Data for San Marino; 2013-2017 ACS
San Marino – Final 2021-2029 Housing Element February 9, 2022
10
Housing Costs and Overpayment
When housing prices are very high, many households must “overpay” for housing. Households
are considered housing cost-burdened when their total housing costs exceed 30% of their gross
monthly income, and to be “severely cost burdened” when their total housing costs exceed 50%
of their gross monthly income. As would be expected, households with very-low and extremely
low incomes are disproportionately housing cost-burdened. In San Marino, 22% of households
are severely cost burdened and are paying more than 50% of their gross monthly incomes for
housing. Another 15% of households are paying more than 30% of their incomes on housing,
and 62% are paying less than 30% of their incomes for housing. While the high median household
incomes in San Marino result in a relatively low overpayment rate, there are still 1,697 San Marino
households who are overpaying for housing.
Source: SCAG Data
1.9.3 Special Needs Populations
Homeless
The Los Angeles County Community Development Commission conducts bi-annual point-in-time
surveys of homeless populations. San Marino is occasionally reported to have 1 unhoused person,
but typically is reported to have zero unhoused persons. Services for homeless individuals are
available in neighboring Pasadena. San Marino allows emergency shelters to be established in
any commercially zoned property as a permitted use; however, no interest has been shown on
the part of homeless service providers in initiating homeless services in San Marino.
Disabled
Census data indicate that San Marino has 461 persons with an independent living disability, 248
with a self-care disability, 413 with an ambulatory disability, 229 with a vision disability, 199 with
a cognitive disability and 163 with a hearing disability. These numbers are not exclusive, as some
residents have more than one type of disability. The most commonly occurring disabilities among
seniors 65 and older were independent living and ambulatory disabilities, each experienced by
more than ten percent of San Marino’s seniors. The provision of ADUs (Accessory Dwelling Units)
and JADUs (Junior Accessory Dwelling Units), and the adoption of a voluntary Universal Design
program, can help to address these special needs.
Elderly
According to the 2019 U.S. Census population estimates, about 21 percent of San Marino’s
population are aged 65 and above. As shown earlier in Figure 3, a large and growing percentage
of San Marino’s population is elderly; by the end of the Housing Element period, the 70-75 age
group will be the most prevalent, followed by the 65-70, 60-65, and 55-60 age groups. Elderly
persons often have fixed incomes in addition to other special needs related to housing and may
require physical improvements to their homes such as ramps, handrails, lower cupboards and
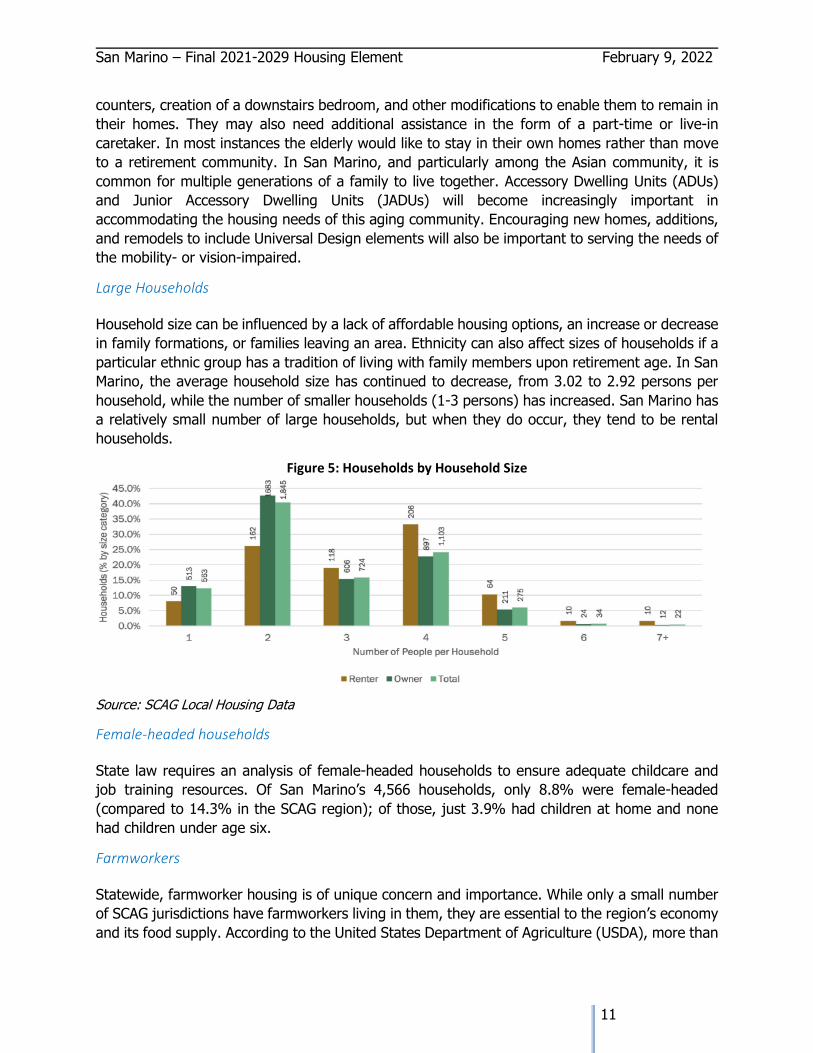
San Marino – Final 2021-2029 Housing Element February 9, 2022
11
counters, creation of a downstairs bedroom, and other modifications to enable them to remain in
their homes. They may also need additional assistance in the form of a part-time or live-in
caretaker. In most instances the elderly would like to stay in their own homes rather than move
to a retirement community. In San Marino, and particularly among the Asian community, it is
common for multiple generations of a family to live together. Accessory Dwelling Units (ADUs)
and Junior Accessory Dwelling Units (JADUs) will become increasingly important in
accommodating the housing needs of this aging community. Encouraging new homes, additions,
and remodels to include Universal Design elements will also be important to serving the needs of
the mobility- or vision-impaired.
Large Households
Household size can be influenced by a lack of affordable housing options, an increase or decrease
in family formations, or families leaving an area. Ethnicity can also affect sizes of households if a
particular ethnic group has a tradition of living with family members upon retirement age. In San
Marino, the average household size has continued to decrease, from 3.02 to 2.92 persons per
household, while the number of smaller households (1-3 persons) has increased. San Marino has
a relatively small number of large households, but when they do occur, they tend to be rental
households.
Figure 5: Households by Household Size
Source: SCAG Local Housing Data
Female-headed households
State law requires an analysis of female-headed households to ensure adequate childcare and
job training resources. Of San Marino’s 4,566 households, only 8.8% were female-headed
(compared to 14.3% in the SCAG region); of those, just 3.9% had children at home and none
had children under age six.
Farmworkers
Statewide, farmworker housing is of unique concern and importance. While only a small number
of SCAG jurisdictions have farmworkers living in them, they are essential to the region’s economy
and its food supply. According to the United States Department of Agriculture (USDA), more than
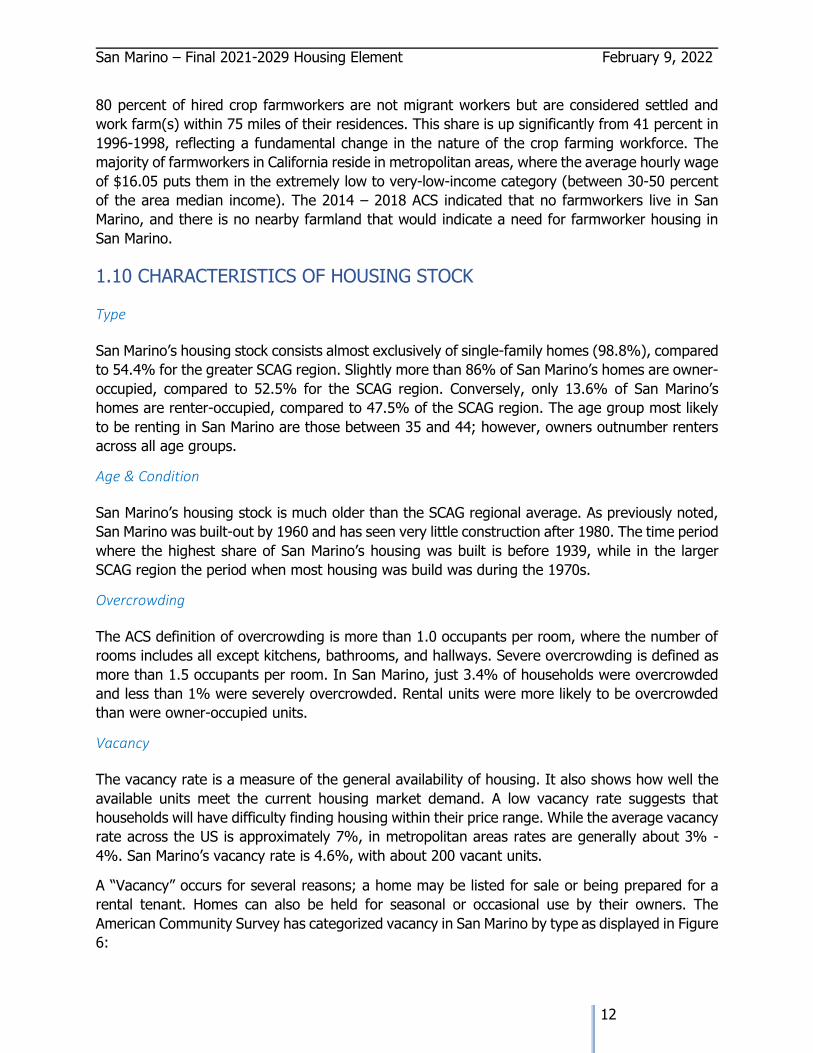
San Marino – Final 2021-2029 Housing Element February 9, 2022
12
80 percent of hired crop farmworkers are not migrant workers but are considered settled and
work farm(s) within 75 miles of their residences. This share is up significantly from 41 percent in
1996-1998, reflecting a fundamental change in the nature of the crop farming workforce. The
majority of farmworkers in California reside in metropolitan areas, where the average hourly wage
of $16.05 puts them in the extremely low to very-low-income category (between 30-50 percent
of the area median income). The 2014 – 2018 ACS indicated that no farmworkers live in San
Marino, and there is no nearby farmland that would indicate a need for farmworker housing in
San Marino.
1.10 CHARACTERISTICS OF HOUSING STOCK
Type
San Marino’s housing stock consists almost exclusively of single-family homes (98.8%), compared
to 54.4% for the greater SCAG region. Slightly more than 86% of San Marino’s homes are owner-
occupied, compared to 52.5% for the SCAG region. Conversely, only 13.6% of San Marino’s
homes are renter-occupied, compared to 47.5% of the SCAG region. The age group most likely
to be renting in San Marino are those between 35 and 44; however, owners outnumber renters
across all age groups.
Age & Condition
San Marino’s housing stock is much older than the SCAG regional average. As previously noted,
San Marino was built-out by 1960 and has seen very little construction after 1980. The time period
where the highest share of San Marino’s housing was built is before 1939, while in the larger
SCAG region the period when most housing was build was during the 1970s.
Overcrowding
The ACS definition of overcrowding is more than 1.0 occupants per room, where the number of
rooms includes all except kitchens, bathrooms, and hallways. Severe overcrowding is defined as
more than 1.5 occupants per room. In San Marino, just 3.4% of households were overcrowded
and less than 1% were severely overcrowded. Rental units were more likely to be overcrowded
than were owner-occupied units.
Vacancy
The vacancy rate is a measure of the general availability of housing. It also shows how well the
available units meet the current housing market demand. A low vacancy rate suggests that
households will have difficulty finding housing within their price range. While the average vacancy
rate across the US is approximately 7%, in metropolitan areas rates are generally about 3% -
4%. San Marino’s vacancy rate is 4.6%, with about 200 vacant units.
A “Vacancy” occurs for several reasons; a home may be listed for sale or being prepared for a
rental tenant. Homes can also be held for seasonal or occasional use by their owners. The
American Community Survey has categorized vacancy in San Marino by type as displayed in Figure
6:
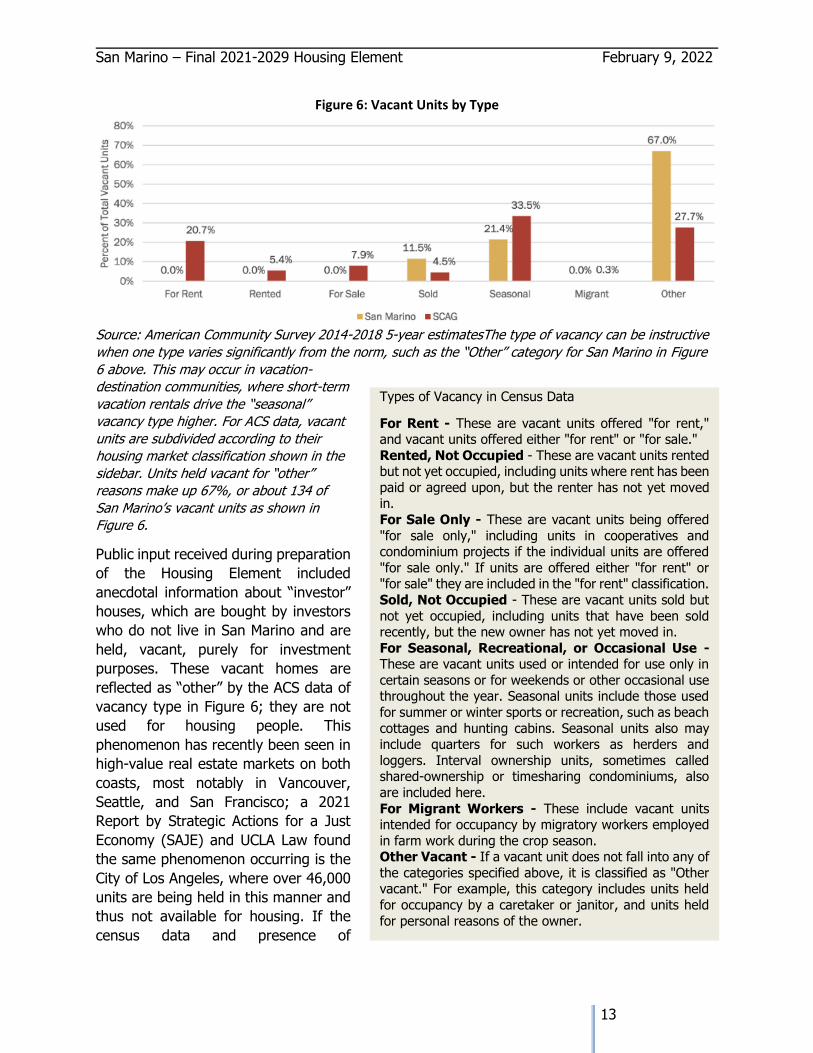
San Marino – Final 2021-2029 Housing Element February 9, 2022
13
Figure 6: Vacant Units by Type
Source: American Community Survey 2014-2018 5-year estimatesThe type of vacancy can be instructive
when one type varies significantly from the norm, such as the “Other” category for San Marino in Figure
6 above. This may occur in vacation-
destination communities, where short-term
vacation rentals drive the “seasonal”
vacancy type higher. For ACS data, vacant
units are subdivided according to their
housing market classification shown in the
sidebar. Units held vacant for “other”
reasons make up 67%, or about 134 of
San Marino’s vacant units as shown in
Figure 6.
Public input received during preparation
of the Housing Element included
anecdotal information about “investor”
houses, which are bought by investors
who do not live in San Marino and are
held, vacant, purely for investment
purposes. These vacant homes are
reflected as “other” by the ACS data of
vacancy type in Figure 6; they are not
used for housing people. This
phenomenon has recently been seen in
high-value real estate markets on both
coasts, most notably in Vancouver,
Seattle, and San Francisco; a 2021
Report by Strategic Actions for a Just
Economy (SAJE) and UCLA Law found
the same phenomenon occurring is the
City of Los Angeles, where over 46,000
units are being held in this manner and
thus not available for housing. If the
census data and presence of
Types of Vacancy in Census Data
For Rent - These are vacant units offered "for rent," and vacant units offered either "for rent" or "for sale."
Rented, Not Occupied - These are vacant units rented but not yet occupied, including units where rent has been
paid or agreed upon, but the renter has not yet moved in.
For Sale Only - These are vacant units being offered
"for sale only," including units in cooperatives and condominium projects if the individual units are offered
"for sale only." If units are offered either "for rent" or "for sale" they are included in the "for rent" classification.
Sold, Not Occupied - These are vacant units sold but
not yet occupied, including units that have been sold recently, but the new owner has not yet moved in.
For Seasonal, Recreational, or Occasional Use - These are vacant units used or intended for use only in
certain seasons or for weekends or other occasional use throughout the year. Seasonal units include those used
for summer or winter sports or recreation, such as beach
cottages and hunting cabins. Seasonal units also may include quarters for such workers as herders and
loggers. Interval ownership units, sometimes called shared-ownership or timesharing condominiums, also
are included here.
For Migrant Workers - These include vacant units intended for occupancy by migratory workers employed
in farm work during the crop season. Other Vacant - If a vacant unit does not fall into any of
the categories specified above, it is classified as "Other vacant." For example, this category includes units held
for occupancy by a caretaker or janitor, and units held
for personal reasons of the owner.
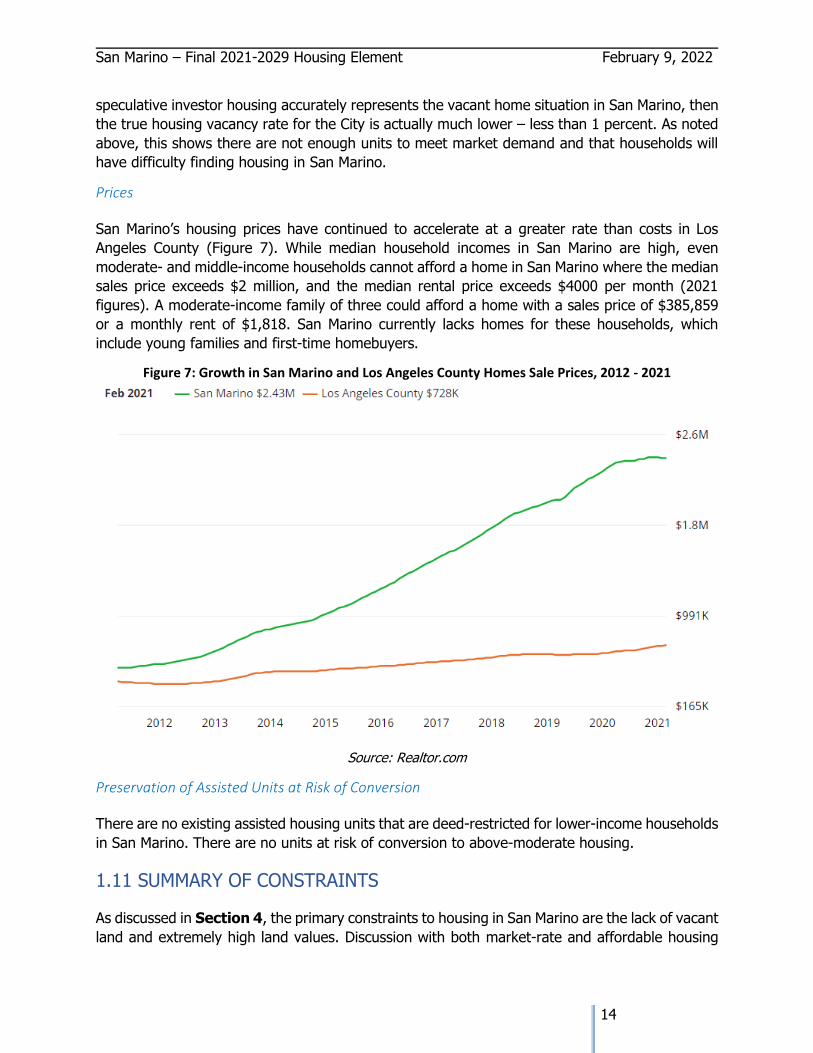
San Marino – Final 2021-2029 Housing Element February 9, 2022
14
speculative investor housing accurately represents the vacant home situation in San Marino, then
the true housing vacancy rate for the City is actually much lower – less than 1 percent. As noted
above, this shows there are not enough units to meet market demand and that households will
have difficulty finding housing in San Marino.
Prices
San Marino’s housing prices have continued to accelerate at a greater rate than costs in Los
Angeles County (Figure 7). While median household incomes in San Marino are high, even
moderate- and middle-income households cannot afford a home in San Marino where the median
sales price exceeds $2 million, and the median rental price exceeds $4000 per month (2021
figures). A moderate-income family of three could afford a home with a sales price of $385,859
or a monthly rent of $1,818. San Marino currently lacks homes for these households, which
include young families and first-time homebuyers.
Figure 7: Growth in San Marino and Los Angeles County Homes Sale Prices, 2012 - 2021
Source: Realtor.com
Preservation of Assisted Units at Risk of Conversion
There are no existing assisted housing units that are deed-restricted for lower-income households
in San Marino. There are no units at risk of conversion to above-moderate housing.
1.11 SUMMARY OF CONSTRAINTS
As discussed in Section 4, the primary constraints to housing in San Marino are the lack of vacant
land and extremely high land values. Discussion with both market-rate and affordable housing
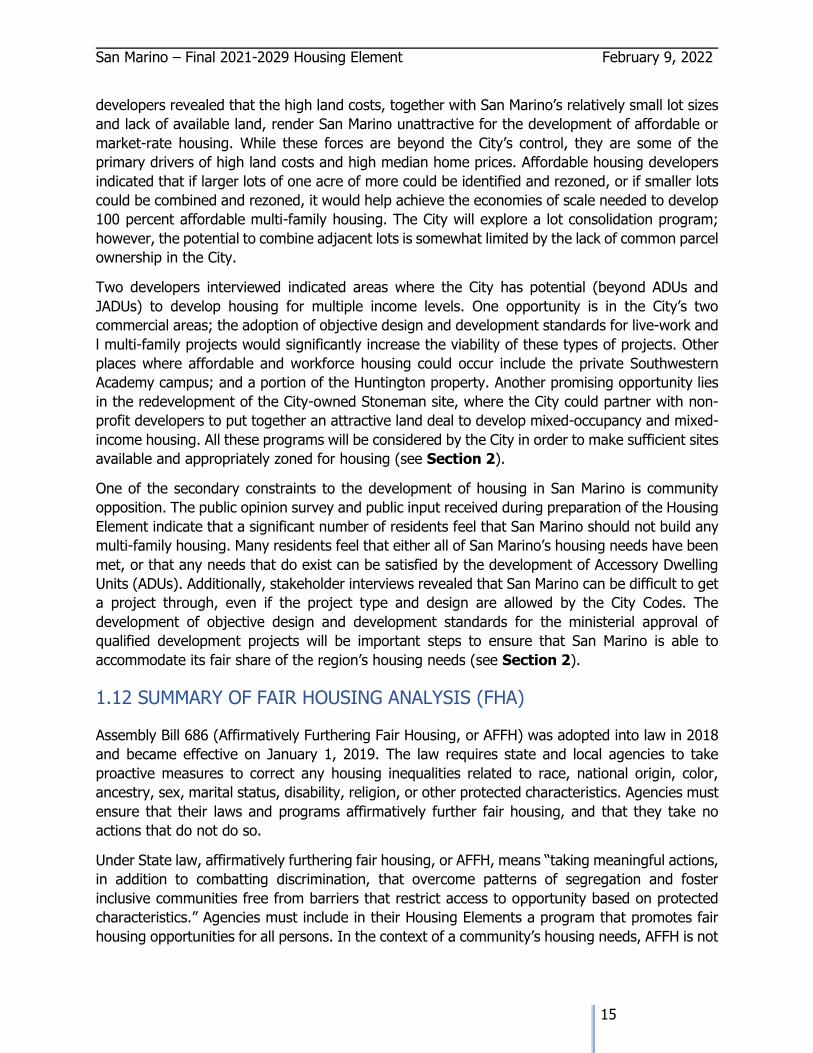
San Marino – Final 2021-2029 Housing Element February 9, 2022
15
developers revealed that the high land costs, together with San Marino’s relatively small lot sizes
and lack of available land, render San Marino unattractive for the development of affordable or
market-rate housing. While these forces are beyond the City’s control, they are some of the
primary drivers of high land costs and high median home prices. Affordable housing developers
indicated that if larger lots of one acre of more could be identified and rezoned, or if smaller lots
could be combined and rezoned, it would help achieve the economies of scale needed to develop
100 percent affordable multi-family housing. The City will explore a lot consolidation program;
however, the potential to combine adjacent lots is somewhat limited by the lack of common parcel
ownership in the City.
Two developers interviewed indicated areas where the City has potential (beyond ADUs and
JADUs) to develop housing for multiple income levels. One opportunity is in the City’s two
commercial areas; the adoption of objective design and development standards for live-work and
l multi-family projects would significantly increase the viability of these types of projects. Other
places where affordable and workforce housing could occur include the private Southwestern
Academy campus; and a portion of the Huntington property. Another promising opportunity lies
in the redevelopment of the City-owned Stoneman site, where the City could partner with non-
profit developers to put together an attractive land deal to develop mixed-occupancy and mixed-
income housing. All these programs will be considered by the City in order to make sufficient sites
available and appropriately zoned for housing (see Section 2).
One of the secondary constraints to the development of housing in San Marino is community
opposition. The public opinion survey and public input received during preparation of the Housing
Element indicate that a significant number of residents feel that San Marino should not build any
multi-family housing. Many residents feel that either all of San Marino’s housing needs have been
met, or that any needs that do exist can be satisfied by the development of Accessory Dwelling
Units (ADUs). Additionally, stakeholder interviews revealed that San Marino can be difficult to get
a project through, even if the project type and design are allowed by the City Codes. The
development of objective design and development standards for the ministerial approval of
qualified development projects will be important steps to ensure that San Marino is able to
accommodate its fair share of the region’s housing needs (see Section 2).
1.12 SUMMARY OF FAIR HOUSING ANALYSIS (FHA)
Assembly Bill 686 (Affirmatively Furthering Fair Housing, or AFFH) was adopted into law in 2018
and became effective on January 1, 2019. The law requires state and local agencies to take
proactive measures to correct any housing inequalities related to race, national origin, color,
ancestry, sex, marital status, disability, religion, or other protected characteristics. Agencies must
ensure that their laws and programs affirmatively further fair housing, and that they take no
actions that do not do so.
Under State law, affirmatively furthering fair housing, or AFFH, means “taking meaningful actions,
in addition to combatting discrimination, that overcome patterns of segregation and foster
inclusive communities free from barriers that restrict access to opportunity based on protected
characteristics.” Agencies must include in their Housing Elements a program that promotes fair
housing opportunities for all persons. In the context of a community’s housing needs, AFFH is not
San Marino – Final 2021-2029 Housing Element February 9, 2022
16
just about the number of units needed, but also about where the units are located and who has
access to them.
AB 686 makes certain requirements for the analysis of fair housing issues; this analysis is
contained in Section 4 along with a history of San Marino and its past practices of allowing only
single-family homes.
While HCD has not yet completed its guidance document for AFFH analysis within Housing
Elements, discussions with HCD staff indicated that a proper course of action in Areas of
Opportunity like San Marino would be to 1) analyze and discuss areas of ethnic or economic
concentration; and 2) assess any exclusionary land use practices and include programs to
overcome or reverse them. A history of San Marino’s development and growth patterns is provided
in Section 4 and summarized here.
San Marino is much more racially diverse than the average U.S. city. While there is a somewhat
greater White population in the northwestern part of the City and a slightly greater Asian
population in the southeastern part of the City, there are no areas of ethnic or economic
concentration. Median incomes are high and fairly stable throughout the City, as is the racial mix
of its citizens. While there are a considerable number of low-income senior households in San
Marino, they tend to own their homes and are not concentrated in any area or neighborhood.
San Marino does not have any areas of racial or ethnically concentrated areas of poverty (R/CAPs).
It is a well-integrated community, and the entire City is designated as an Area of Opportunity.
This designation is based on the consideration of factors affecting the quality of life and health
outcomes including educational enrollment and attainment; employment rates; lack of
overcrowding in housing or overpayment for housing costs; transportation costs; and
environmental health.
San Marino’s rich and varied past spans multiple eras of California history and is associated with
cultural and social themes that were definitive in the history of Los Angeles County and Southern
California. Since its 1913 incorporation, “the City envisioned itself as a residential enclave for
people of means, with zoning that ensured minimal commercial development and no industry or
multi-family residences” (Source: San Marino Historic Resources Survey Report, October 2020). This
exclusive designation has played out in the City’s zoning since its establishment. San Marino is
almost exclusively residential, with its built environment dominated by detached single-family
homes constructed primarily between the 1920s and the 1960s. As of 2021, there were no areas
zoned for multi-family residences, or for industry/manufacturing. Small areas on Huntington Drive
and Mission Street are zoned for commercial use, and the City has recently approved a mixed-
occupancy project on Huntington Drive.
By definition, single-family zoning is exclusionary when it occurs to the exclusion of other types
of residential uses. While not intended to be exclusionary, San Marino’s past prohibition of
anything but single-family homes has had the effect of excluding persons who do not have
incomes high enough to live in the City. Because poverty occurs most often with persons of color,
these practices have resulted in the exclusion of protected classes even though they were not
intended to. AB 686 requires that the City adopt programs to overcome and reverse this pattern
of exclusion, and to identify locations for affordable housing through the AFFH lens.
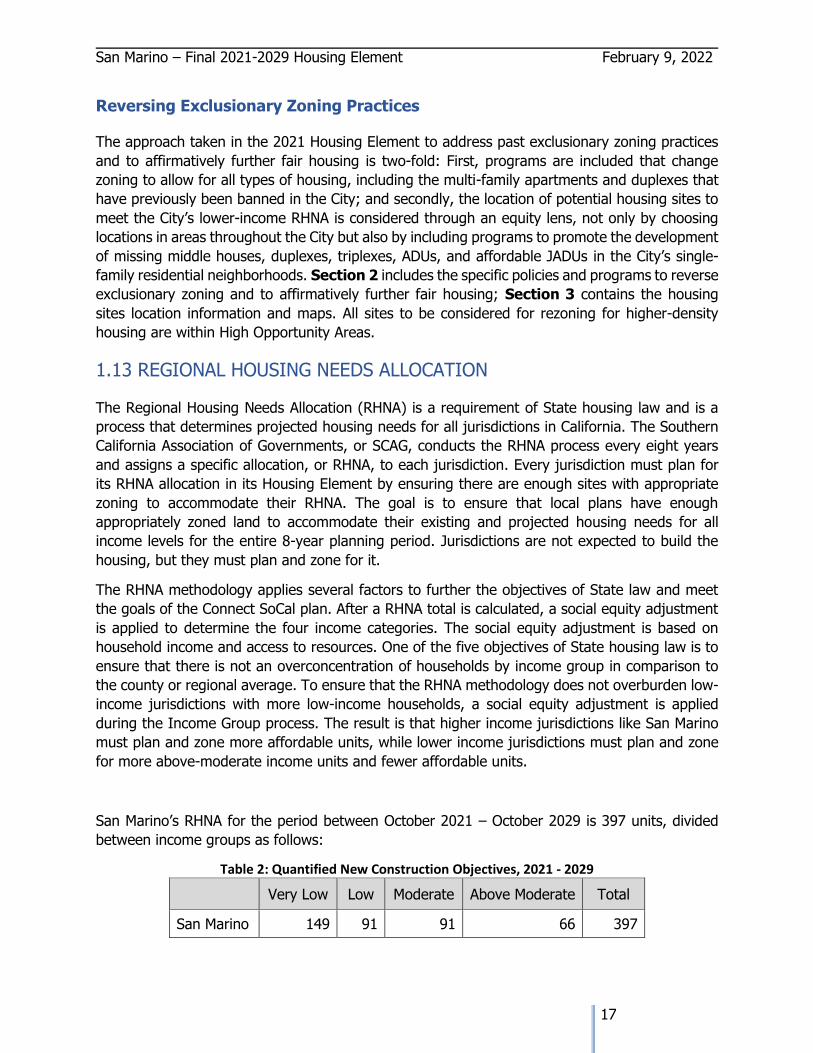
San Marino – Final 2021-2029 Housing Element February 9, 2022
17
Reversing Exclusionary Zoning Practices
The approach taken in the 2021 Housing Element to address past exclusionary zoning practices
and to affirmatively further fair housing is two-fold: First, programs are included that change
zoning to allow for all types of housing, including the multi-family apartments and duplexes that
have previously been banned in the City; and secondly, the location of potential housing sites to
meet the City’s lower-income RHNA is considered through an equity lens, not only by choosing
locations in areas throughout the City but also by including programs to promote the development
of missing middle houses, duplexes, triplexes, ADUs, and affordable JADUs in the City’s single-
family residential neighborhoods. Section 2 includes the specific policies and programs to reverse
exclusionary zoning and to affirmatively further fair housing; Section 3 contains the housing
sites location information and maps. All sites to be considered for rezoning for higher-density
housing are within High Opportunity Areas.
1.13 REGIONAL HOUSING NEEDS ALLOCATION
The Regional Housing Needs Allocation (RHNA) is a requirement of State housing law and is a
process that determines projected housing needs for all jurisdictions in California. The Southern
California Association of Governments, or SCAG, conducts the RHNA process every eight years
and assigns a specific allocation, or RHNA, to each jurisdiction. Every jurisdiction must plan for
its RHNA allocation in its Housing Element by ensuring there are enough sites with appropriate
zoning to accommodate their RHNA. The goal is to ensure that local plans have enough
appropriately zoned land to accommodate their existing and projected housing needs for all
income levels for the entire 8-year planning period. Jurisdictions are not expected to build the
housing, but they must plan and zone for it.
The RHNA methodology applies several factors to further the objectives of State law and meet
the goals of the Connect SoCal plan. After a RHNA total is calculated, a social equity adjustment
is applied to determine the four income categories. The social equity adjustment is based on
household income and access to resources. One of the five objectives of State housing law is to
ensure that there is not an overconcentration of households by income group in comparison to
the county or regional average. To ensure that the RHNA methodology does not overburden low-
income jurisdictions with more low-income households, a social equity adjustment is applied
during the Income Group process. The result is that higher income jurisdictions like San Marino
must plan and zone more affordable units, while lower income jurisdictions must plan and zone
for more above-moderate income units and fewer affordable units.
San Marino’s RHNA for the period between October 2021 – October 2029 is 397 units, divided
between income groups as follows:
Table 2: Quantified New Construction Objectives, 2021 - 2029
Very Low Low Moderate Above Moderate Total
San Marino 149 91 91 66 397

San Marino – Final 2021-2029 Housing Element February 9, 2022
18
While the RHNA is assigned based on the four income categories above, the law also requires
that communities plan for the needs of extremely low-income households, defined as those
making less than 30% of the County AMI. The housing need for this income group is generally
considered to be half of the very low-income need. Because San Marino is a high-income and
high-resource community, it has a much greater RHNA for affordable and moderate-income units
than it does for Above-moderate units. Since the RHNA cannot be accommodated on existing
sites with appropriate zoning, San Marino has a “RHNA shortfall” and the City must rezone
adequate new sites to meet its regional need and to meet the requirements of Government Code
Section 65583 c. 1, which requires zoning for all types of residential uses including multi-family
and manufactured homes. Section 3 provides an analysis of the RHNA shortfall, the required
sites information, and the housing sites inventory.
1.14 2014 SAN MARINO HOUSING ELEMENT REVIEW
The City has taken multiple steps to facilitate residential and live-work development since
adoption of the 2014 Housing Element, including the following:
● Expanded opportunities for low- and moderate-income housing by adopting a revised
Accessory Dwelling Unit Ordinance and a new Junior Accessory Dwelling Unit Ordinance,
in compliance with State law;
● Provided no-cost ADU/JADU pre-application consultations with planning staff to ensure
complete application submittals and the shortest possible processing time;
● Drafted a mixed-use ordinance for City Council consideration (this was ultimately not
adopted, but residential uses continue to be allowed in the C-1 and the City Council has
requested that staff prepare objective design standards to guide their development);
● Approved the first mixed-occupancy project at 2405 Huntington Drive (3 commercial
ground floor units, 2 residential units above);
● Produced and distributed public handouts on Fair Housing;
● Established a specific page within the City’s website that includes housing-related
information; and
● Moved to an online permitting system to facilitate continued permit issuance during
pandemic closure and beyond.
Progress Implementing Programs
The City was successful in implementing most of the programs in its 2014 Housing Element and
is implementing others with the adoption of this 2021 Housing Element Update. See
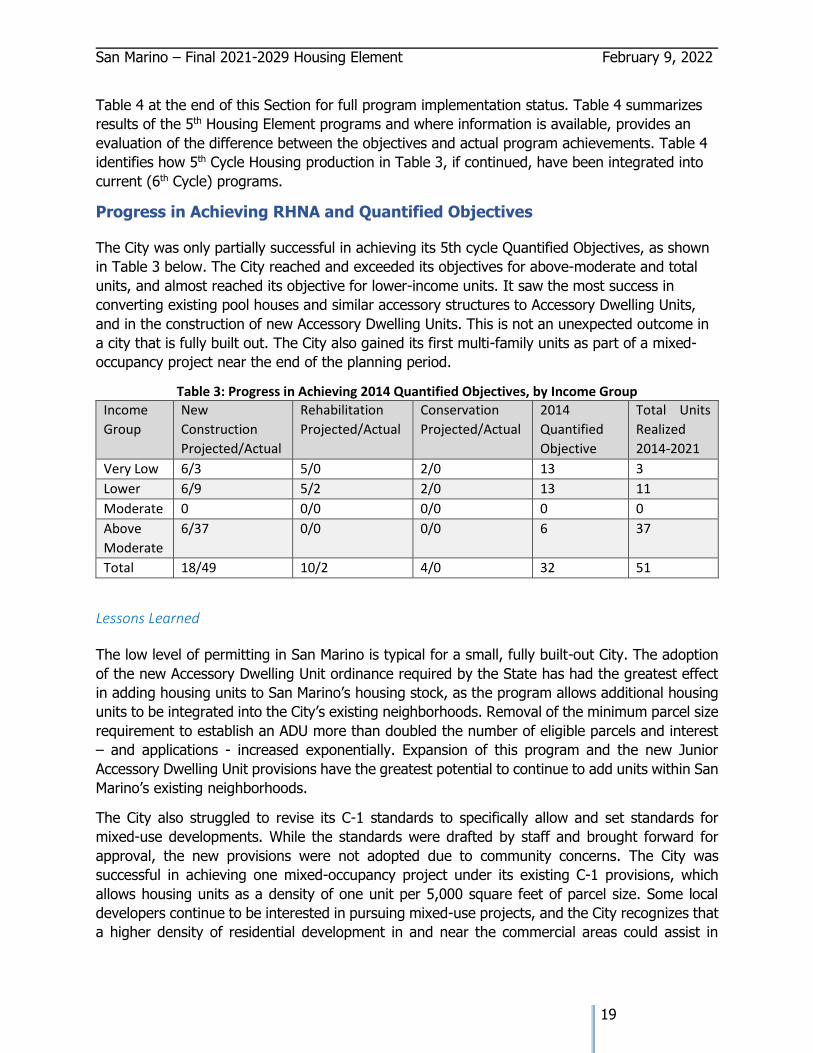
San Marino – Final 2021-2029 Housing Element February 9, 2022
19
Table 4 at the end of this Section for full program implementation status. Table 4 summarizes
results of the 5th Housing Element programs and where information is available, provides an
evaluation of the difference between the objectives and actual program achievements. Table 4
identifies how 5th Cycle Housing production in Table 3, if continued, have been integrated into
current (6th Cycle) programs.
Progress in Achieving RHNA and Quantified Objectives
The City was only partially successful in achieving its 5th cycle Quantified Objectives, as shown
in Table 3 below. The City reached and exceeded its objectives for above-moderate and total
units, and almost reached its objective for lower-income units. It saw the most success in
converting existing pool houses and similar accessory structures to Accessory Dwelling Units,
and in the construction of new Accessory Dwelling Units. This is not an unexpected outcome in
a city that is fully built out. The City also gained its first multi-family units as part of a mixed-
occupancy project near the end of the planning period.
Table 3: Progress in Achieving 2014 Quantified Objectives, by Income Group
Income
Group
New
Construction
Projected/Actual
Rehabilitation
Projected/Actual
Conservation
Projected/Actual
2014
Quantified
Objective
Total Units
Realized
2014-2021
Very Low 6/3 5/0 2/0 13 3
Lower 6/9 5/2 2/0 13 11
Moderate 0 0/0 0/0 0 0
Above
Moderate
6/37 0/0 0/0 6 37
Total 18/49 10/2 4/0 32 51
Lessons Learned
The low level of permitting in San Marino is typical for a small, fully built-out City. The adoption
of the new Accessory Dwelling Unit ordinance required by the State has had the greatest effect
in adding housing units to San Marino’s housing stock, as the program allows additional housing
units to be integrated into the City’s existing neighborhoods. Removal of the minimum parcel size
requirement to establish an ADU more than doubled the number of eligible parcels and interest
– and applications - increased exponentially. Expansion of this program and the new Junior
Accessory Dwelling Unit provisions have the greatest potential to continue to add units within San
Marino’s existing neighborhoods.
The City also struggled to revise its C-1 standards to specifically allow and set standards for
mixed-use developments. While the standards were drafted by staff and brought forward for
approval, the new provisions were not adopted due to community concerns. The City was
successful in achieving one mixed-occupancy project under its existing C-1 provisions, which
allows housing units as a density of one unit per 5,000 square feet of parcel size. Some local
developers continue to be interested in pursuing mixed-use projects, and the City recognizes that
a higher density of residential development in and near the commercial areas could assist in
San Marino – Final 2021-2029 Housing Element February 9, 2022
20
revitalizing them. Adaptive re-use and other redevelopment strategies would be appropriate for
this area. The City will continue to allow residential uses within the C-1 zone, by-right if at least
20% of units are affordable. With the recent strengthening of the Housing Accountability Act and
the passage of SB 35, the City has learned the importance of adopting objective design and
development standards and anticipates the creation and adoption of such standards within the
next year.
San Marino has always prided itself on having the best schools in the State, and one of the most
difficult lessons for the City has been the loss of its student population. As reflected in Census
data and school enrollment figures, young families cannot afford to live in San Marino because of
the lack of housing affordable to lower, moderate, and middle-income households. The City
recognizes the need to ensure that young families can live in San Marino and is committed to
putting new programs into place for lower income households.
1.15 PROGRAM CHANGES IN 2021 HOUSING ELEMENT
The 2021 Housing Element update is not a comprehensive "new" Housing Element, but rather an
update of the 2014 Housing Element. The focus of the update process has been to keep the
programs that are working, adding new policies and programs where community needs have
changed or where necessary to comply with new State laws. The same three goals of the existing
2014 Housing Element have been maintained, with new or revised policies and programs
proposed to meet changing needs and legal requirements. Most ongoing policies and programs
are successful and are continued in the Housing Element update; limited-term programs that
have already been accomplished have not been carried forward.
The 2021 Housing Element updates housing numbers related to RHNA, outlines public
participation, and makes limited changes in programs that commit the County to future land use
changes to be made within three years. A brief summary of the changes and revisions are listed
by Goal below:
GOAL 1: Provide a range of housing opportunities for all income levels.
● New Policy added to allow interior conversion of single-family residences into duplexes or
triplexes in neighborhoods near jobs and transit, and to consider other missing middle
housing solutions.
● New policy added to ensure that adequate sites continue to be available throughout the
planning period (statutory requirement).
● Policy revised to encourage local lenders to become approved for the Home Ownership
and Mortgage Credit Certificate programs for first-time homebuyers.
● New Policy added to affirmatively further fair housing throughout San Marino’s
neighborhoods (statutory requirement).
● Program revised to facilitate the development of ADUs and JADUs by providing
promotional materials and pre-approved plans for ADUs, and to add consideration of a
and amnesty program for ADUs and a low-interest or forgivable loan program for lower-
income households to create affordable JADUs.
San Marino – Final 2021-2029 Housing Element February 9, 2022
21
● Program revised to increase the number of ADUs expected to be developed during the
next planning period, consistent with recent permitting levels.
● New Program added to adopt objective design and development standards for residential
and live-work projects.
● New Program added to consider adoption of a Housing Overlay Zone.
● New Program added to implement “missing middle” provisions in designated single-family
neighborhoods near jobs and transit.
● New Program added to adopt a density bonus ordinance to comply with new State laws,
and to consider adopting a City density bonus ordinance to better address local housing
needs for seniors, and first-time homebuyers.
● New Program added to consider and rezone sites by October 15, 2024 to accommodate
the identified RHNA shortfall and any additional sites necessary to ensure compliance with
No Net Loss laws.
● New program added to maintain an Administrative List of Housing Sites to ensure
compliance with No Net Loss Laws
● New Program added to implement an Enhanced Affordability Overlay if sufficient sites are
not rezoned by October 15, 2024.
● New Program added to promote first-time homebuyer programs and to encourage use of
the housing land trust model.
GOAL 2: Maintain the existing housing stock.
● New Policy added to ensure that the City’s housing stock is not lost to non-residential
uses.
● New Program added to consider adopting the conservation measures in the EAP (Energy
Action Plan) where appropriate for San Marino and not duplicative of Building Code
requirements.
● New Program added to explore the nature of prolonged home vacancies in the City, and
to consider adoption of an annual fee or “vacancy tax” if it is determined that vacant
homes are being held only for investment purposes and are not being used for housing.
Funds from this fee or “tax” would be used to support the City’s housing programs.
GOAL 3: Ensure the accessibility to housing for all segments of society.
● New Policy added to promote and encourage special needs housing and universal design
in new and remodeled homes.
● New Program added to implement Universal Design policies.
● New Program added to encourage ADUs and JADUs for seniors and persons with
disabilities, and to include Universal Design provisions in pre-approved ADU plans.
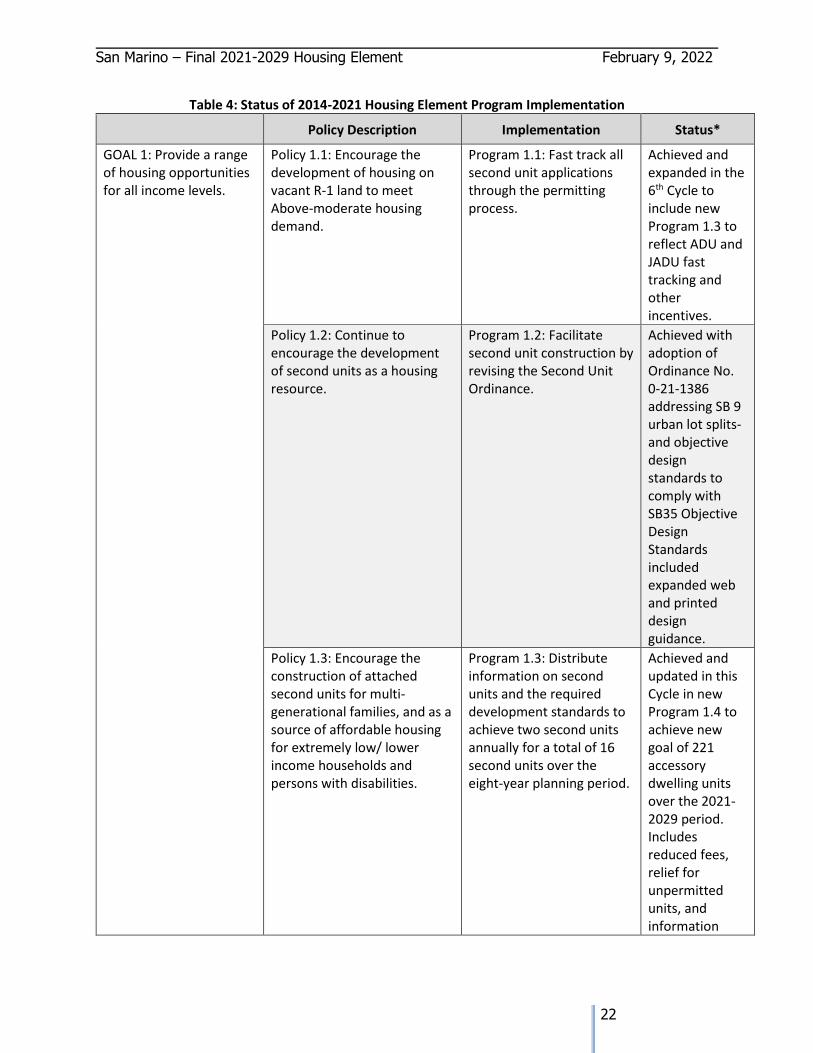
San Marino – Final 2021-2029 Housing Element February 9, 2022
22
Table 4: Status of 2014-2021 Housing Element Program Implementation
Policy Description Implementation Status*
GOAL 1: Provide a range of housing opportunities for all income levels.
Policy 1.1: Encourage the development of housing on vacant R-1 land to meet Above-moderate housing demand.
Program 1.1: Fast track all second unit applications through the permitting process.
Achieved and expanded in the 6th Cycle to include new Program 1.3 to reflect ADU and JADU fast tracking and other incentives.
Policy 1.2: Continue to encourage the development of second units as a housing resource.
Program 1.2: Facilitate second unit construction by revising the Second Unit Ordinance.
Achieved with adoption of Ordinance No. 0-21-1386 addressing SB 9 urban lot splits-and objective design standards to comply with SB35 Objective Design Standards included expanded web and printed design guidance.
Policy 1.3: Encourage the construction of attached second units for multi-generational families, and as a source of affordable housing for extremely low/ lower income households and persons with disabilities.
Program 1.3: Distribute information on second units and the required development standards to achieve two second units annually for a total of 16 second units over the eight-year planning period.
Achieved and updated in this Cycle in new Program 1.4 to achieve new goal of 221 accessory dwelling units over the 2021-2029 period. Includes reduced fees, relief for unpermitted units, and information
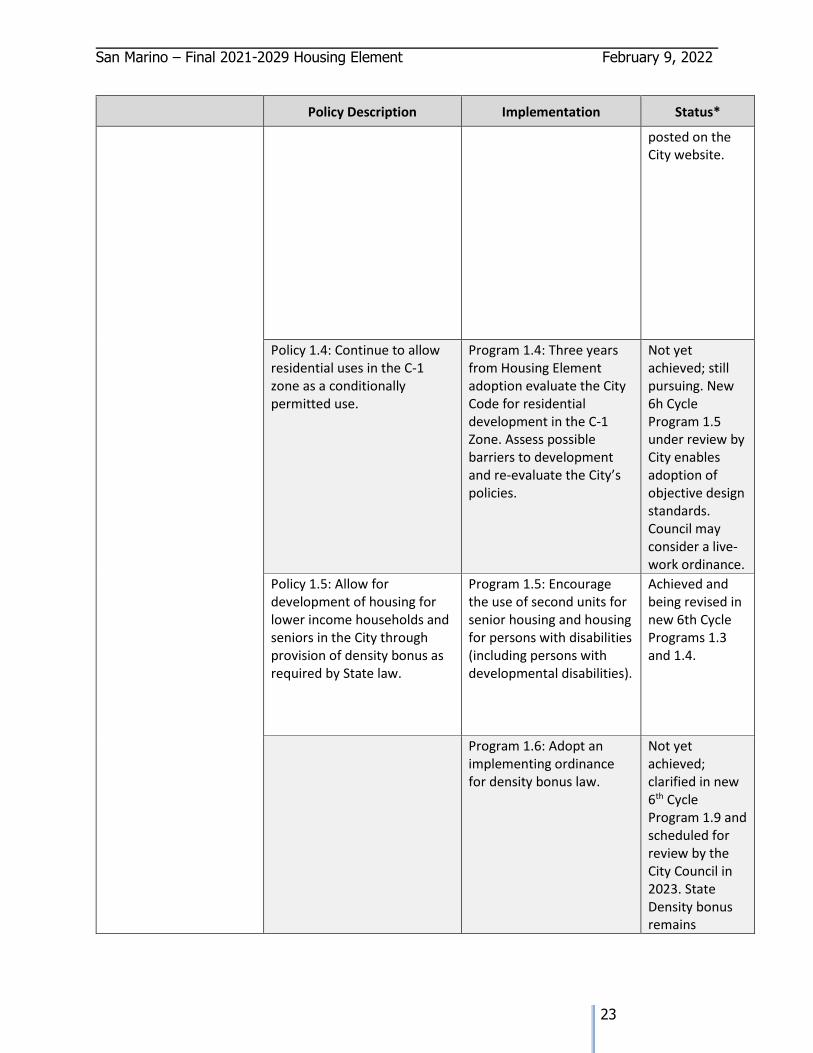
San Marino – Final 2021-2029 Housing Element February 9, 2022
23
Policy Description Implementation Status*
posted on the City website.
Policy 1.4: Continue to allow residential uses in the C-1 zone as a conditionally permitted use.
Program 1.4: Three years from Housing Element adoption evaluate the City Code for residential development in the C-1 Zone. Assess possible barriers to development and re-evaluate the City’s policies.
Not yet achieved; still pursuing. New 6h Cycle Program 1.5 under review by City enables adoption of objective design standards. Council may consider a live-work ordinance.
Policy 1.5: Allow for development of housing for lower income households and seniors in the City through provision of density bonus as required by State law.
Program 1.5: Encourage the use of second units for senior housing and housing for persons with disabilities (including persons with developmental disabilities).
Achieved and being revised in new 6th Cycle Programs 1.3 and 1.4.
Program 1.6: Adopt an implementing ordinance for density bonus law.
Not yet achieved; clarified in new 6th Cycle Program 1.9 and scheduled for review by the City Council in 2023. State Density bonus remains
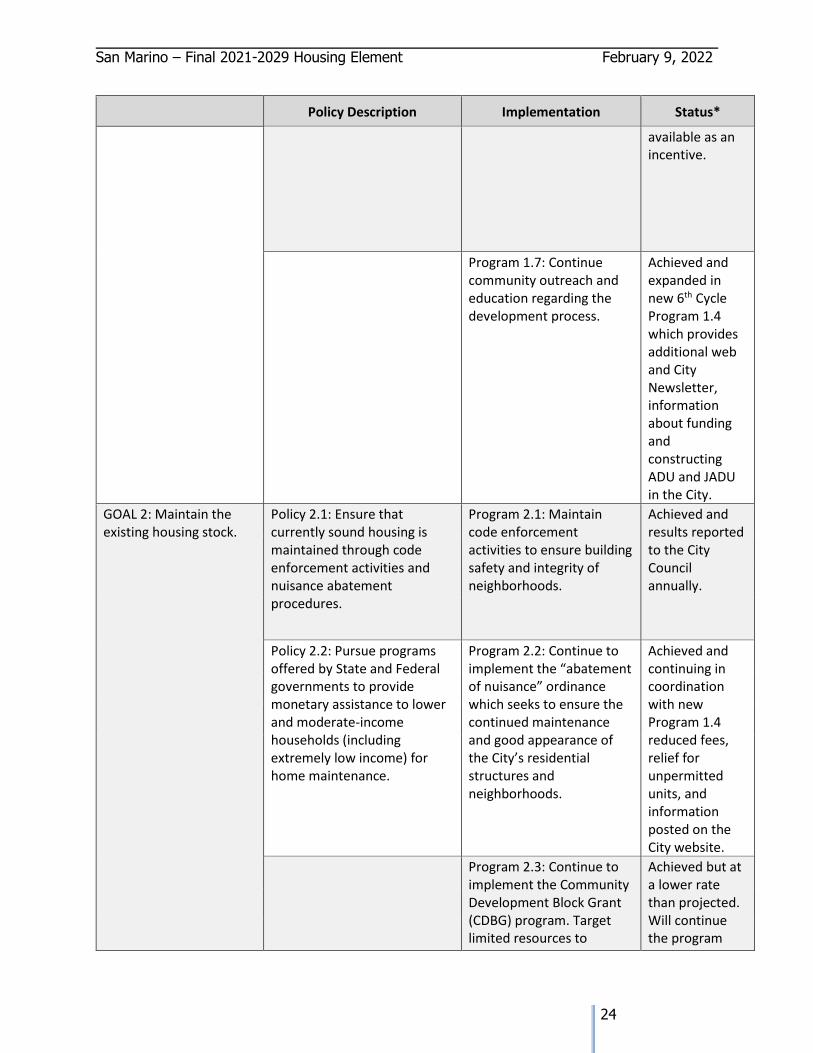
San Marino – Final 2021-2029 Housing Element February 9, 2022
24
Policy Description Implementation Status*
available as an incentive.
Program 1.7: Continue community outreach and education regarding the development process.
Achieved and expanded in new 6th Cycle Program 1.4 which provides additional web and City Newsletter, information about funding and constructing ADU and JADU in the City.
GOAL 2: Maintain the existing housing stock.
Policy 2.1: Ensure that currently sound housing is maintained through code enforcement activities and nuisance abatement procedures.
Program 2.1: Maintain code enforcement activities to ensure building safety and integrity of neighborhoods.
Achieved and results reported to the City Council annually.
Policy 2.2: Pursue programs offered by State and Federal governments to provide monetary assistance to lower and moderate-income households (including extremely low income) for home maintenance.
Program 2.2: Continue to implement the “abatement of nuisance” ordinance which seeks to ensure the continued maintenance and good appearance of the City’s residential structures and neighborhoods.
Achieved and continuing in coordination with new Program 1.4 reduced fees, relief for unpermitted units, and information posted on the City website.
Program 2.3: Continue to implement the Community Development Block Grant (CDBG) program. Target limited resources to
Achieved but at a lower rate than projected. Will continue the program
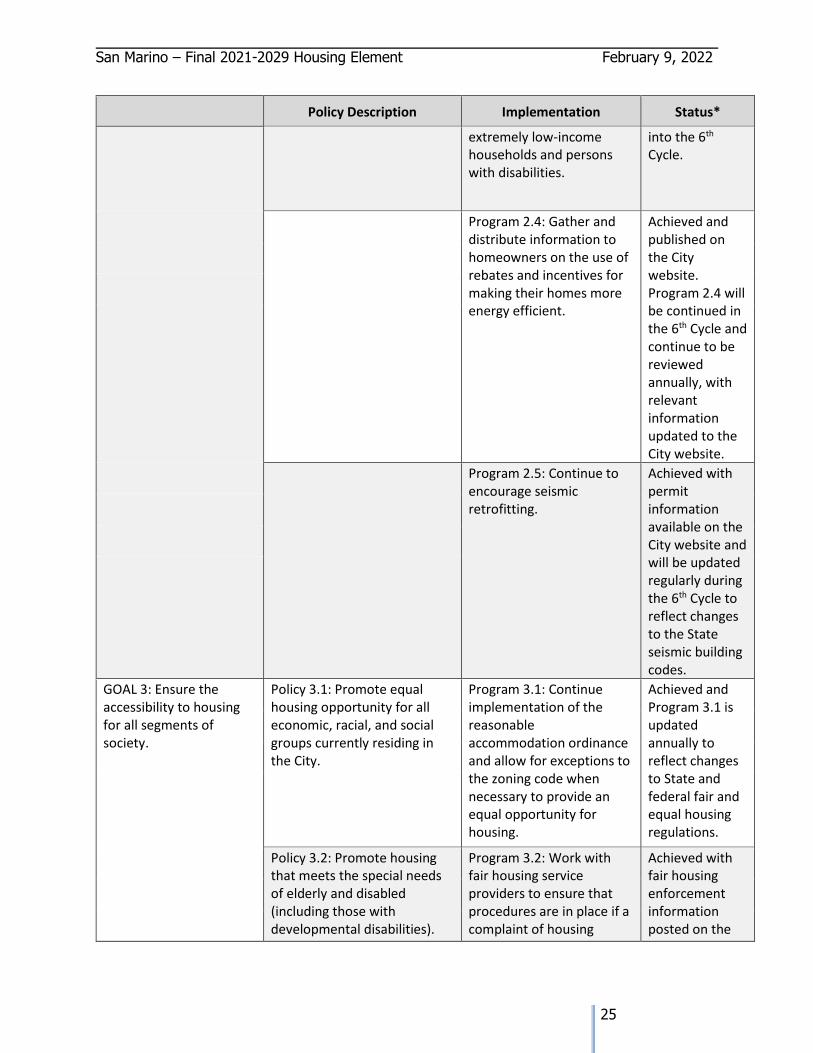
San Marino – Final 2021-2029 Housing Element February 9, 2022
25
Policy Description Implementation Status*
extremely low-income households and persons with disabilities.
into the 6th Cycle.
Program 2.4: Gather and distribute information to homeowners on the use of rebates and incentives for making their homes more energy efficient.
Achieved and published on the City website. Program 2.4 will be continued in the 6th Cycle and continue to be reviewed annually, with relevant information updated to the City website.
Program 2.5: Continue to encourage seismic retrofitting.
Achieved with permit information available on the City website and will be updated regularly during the 6th Cycle to reflect changes to the State seismic building codes.
GOAL 3: Ensure the accessibility to housing for all segments of society.
Policy 3.1: Promote equal housing opportunity for all economic, racial, and social groups currently residing in the City.
Program 3.1: Continue implementation of the reasonable accommodation ordinance and allow for exceptions to the zoning code when necessary to provide an equal opportunity for housing.
Achieved and Program 3.1 is updated annually to reflect changes to State and federal fair and equal housing regulations.
Policy 3.2: Promote housing that meets the special needs of elderly and disabled (including those with developmental disabilities).
Program 3.2: Work with fair housing service providers to ensure that procedures are in place if a complaint of housing
Achieved with fair housing enforcement information posted on the
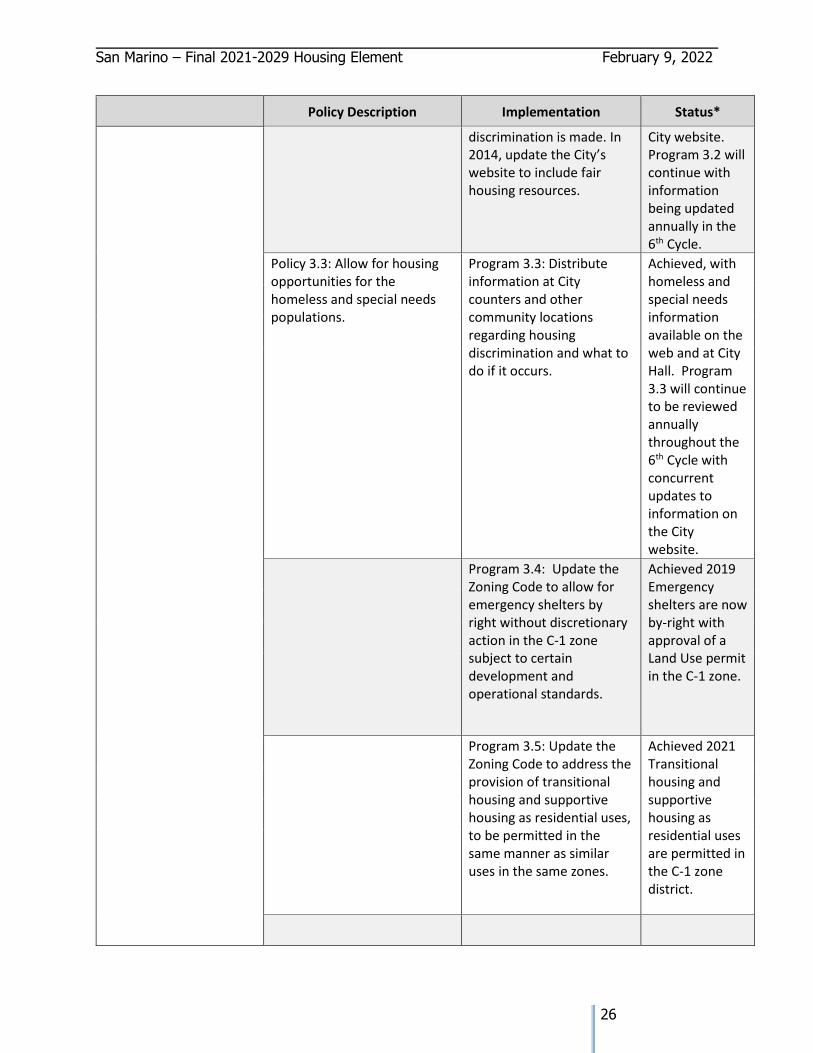
San Marino – Final 2021-2029 Housing Element February 9, 2022
26
Policy Description Implementation Status*
discrimination is made. In 2014, update the City’s website to include fair housing resources.
City website. Program 3.2 will continue with information being updated annually in the 6th Cycle.
Policy 3.3: Allow for housing opportunities for the homeless and special needs populations.
Program 3.3: Distribute information at City counters and other community locations regarding housing discrimination and what to do if it occurs.
Achieved, with homeless and special needs information available on the web and at City Hall. Program 3.3 will continue to be reviewed annually throughout the 6th Cycle with concurrent updates to information on the City website.
Program 3.4: Update the Zoning Code to allow for emergency shelters by right without discretionary action in the C-1 zone subject to certain development and operational standards.
Achieved 2019 Emergency shelters are now by-right with approval of a Land Use permit in the C-1 zone.
Program 3.5: Update the Zoning Code to address the provision of transitional housing and supportive housing as residential uses, to be permitted in the same manner as similar uses in the same zones.
Achieved 2021 Transitional housing and supportive housing as residential uses are permitted in the C-1 zone district.
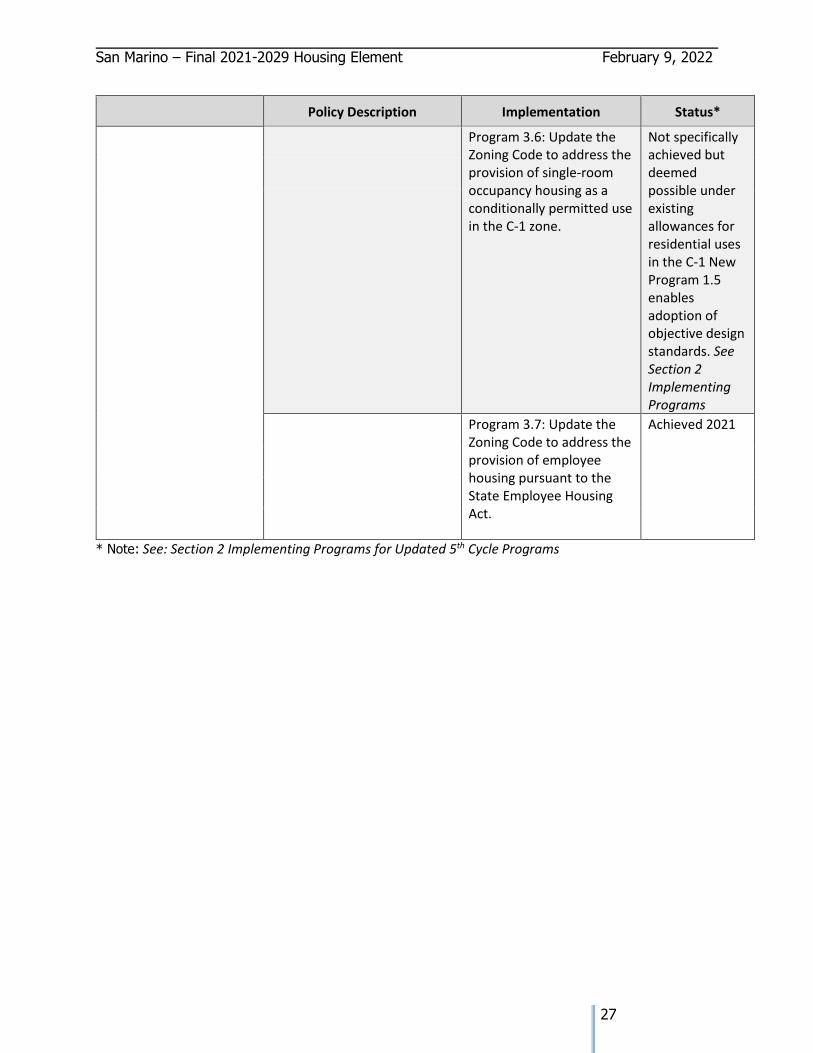
San Marino – Final 2021-2029 Housing Element February 9, 2022
27
Policy Description Implementation Status*
Program 3.6: Update the Zoning Code to address the provision of single-room occupancy housing as a conditionally permitted use in the C-1 zone.
Not specifically achieved but deemed possible under existing allowances for residential uses in the C-1 New Program 1.5 enables adoption of objective design standards. See Section 2 Implementing Programs
Program 3.7: Update the Zoning Code to address the provision of employee housing pursuant to the State Employee Housing Act.
Achieved 2021
* Note: See: Section 2 Implementing Programs for Updated 5th Cycle Programs
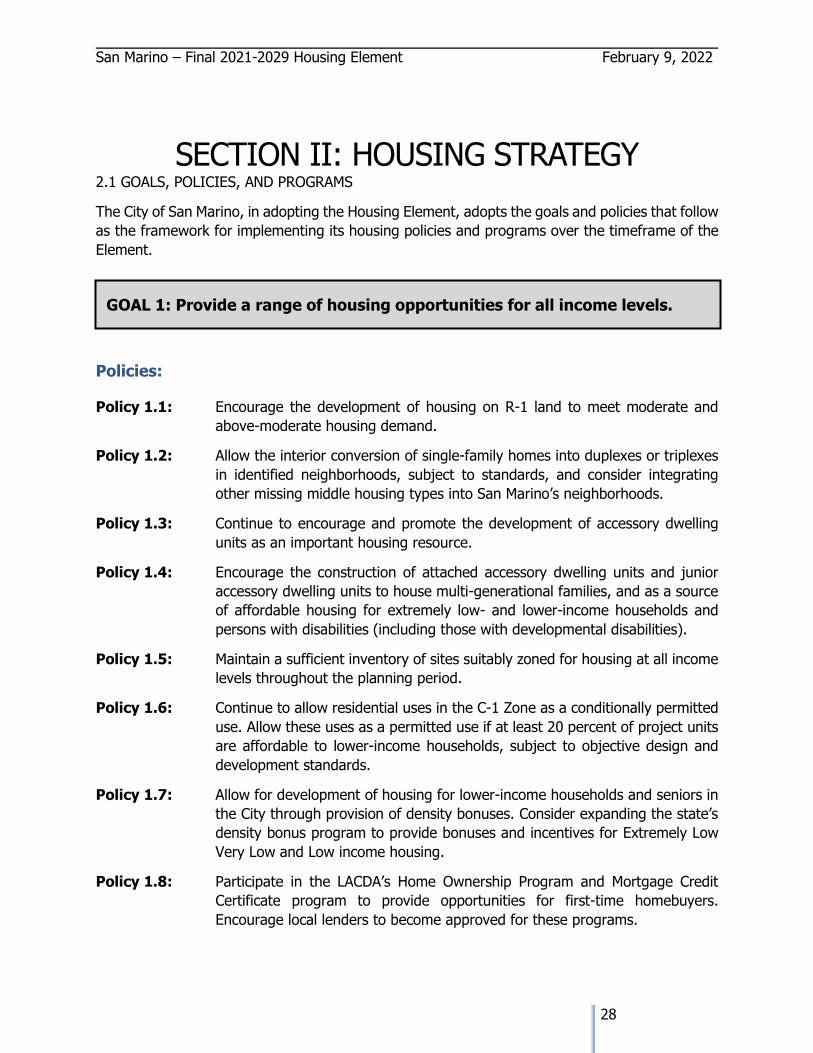
San Marino – Final 2021-2029 Housing Element February 9, 2022
28
SECTION II: HOUSING STRATEGY 2.1 GOALS, POLICIES, AND PROGRAMS
The City of San Marino, in adopting the Housing Element, adopts the goals and policies that follow
as the framework for implementing its housing policies and programs over the timeframe of the
Element.
Policies:
Policy 1.1: Encourage the development of housing on R-1 land to meet moderate and
above-moderate housing demand.
Policy 1.2: Allow the interior conversion of single-family homes into duplexes or triplexes
in identified neighborhoods, subject to standards, and consider integrating
other missing middle housing types into San Marino’s neighborhoods.
Policy 1.3: Continue to encourage and promote the development of accessory dwelling
units as an important housing resource.
Policy 1.4: Encourage the construction of attached accessory dwelling units and junior
accessory dwelling units to house multi-generational families, and as a source
of affordable housing for extremely low- and lower-income households and
persons with disabilities (including those with developmental disabilities).
Policy 1.5: Maintain a sufficient inventory of sites suitably zoned for housing at all income
levels throughout the planning period.
Policy 1.6: Continue to allow residential uses in the C-1 Zone as a conditionally permitted
use. Allow these uses as a permitted use if at least 20 percent of project units
are affordable to lower-income households, subject to objective design and
development standards.
Policy 1.7: Allow for development of housing for lower-income households and seniors in
the City through provision of density bonuses. Consider expanding the state’s
density bonus program to provide bonuses and incentives for Extremely Low
Very Low and Low income housing.
Policy 1.8: Participate in the LACDA’s Home Ownership Program and Mortgage Credit
Certificate program to provide opportunities for first-time homebuyers.
Encourage local lenders to become approved for these programs.
GOAL 1: Provide a range of housing opportunities for all income levels.
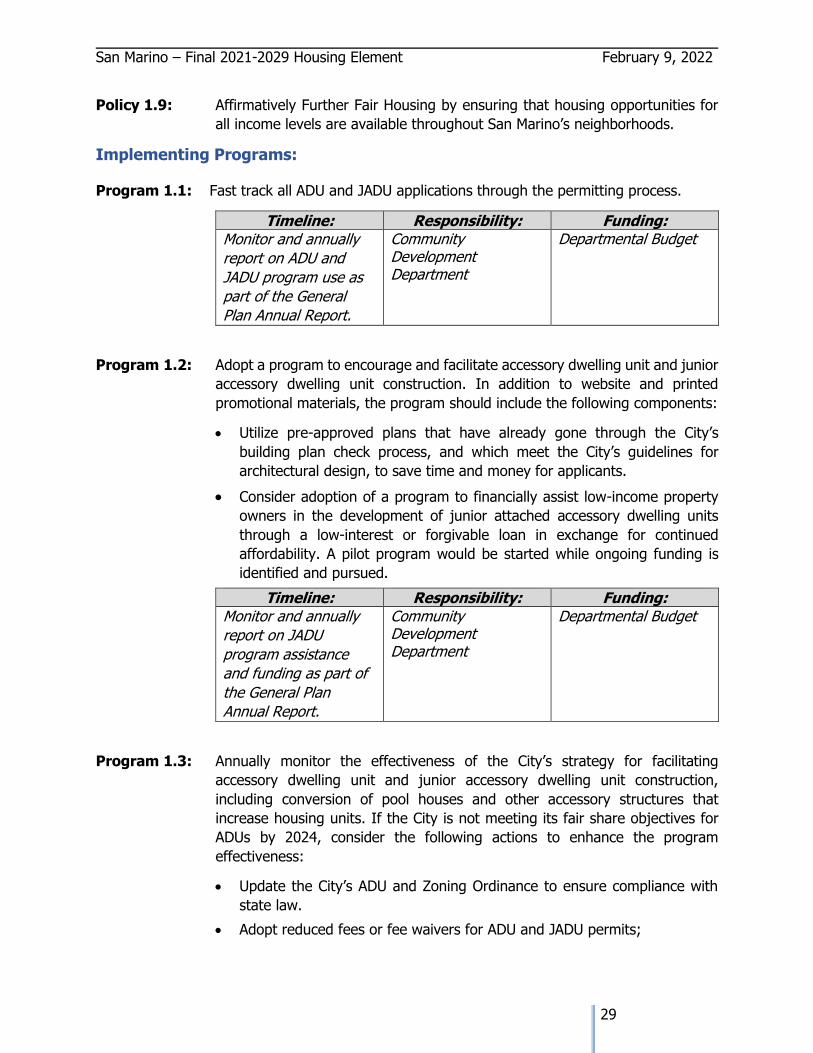
San Marino – Final 2021-2029 Housing Element February 9, 2022
29
Policy 1.9: Affirmatively Further Fair Housing by ensuring that housing opportunities for
all income levels are available throughout San Marino’s neighborhoods.
Implementing Programs:
Program 1.1: Fast track all ADU and JADU applications through the permitting process.
Timeline: Responsibility: Funding: Monitor and annually
report on ADU and
JADU program use as
part of the General
Plan Annual Report.
Community Development Department
Departmental Budget
Program 1.2: Adopt a program to encourage and facilitate accessory dwelling unit and junior
accessory dwelling unit construction. In addition to website and printed
promotional materials, the program should include the following components:
• Utilize pre-approved plans that have already gone through the City’s
building plan check process, and which meet the City’s guidelines for
architectural design, to save time and money for applicants.
• Consider adoption of a program to financially assist low-income property
owners in the development of junior attached accessory dwelling units
through a low-interest or forgivable loan in exchange for continued
affordability. A pilot program would be started while ongoing funding is
identified and pursued.
Timeline: Responsibility: Funding: Monitor and annually
report on JADU
program assistance
and funding as part of
the General Plan
Annual Report.
Community Development Department
Departmental Budget
Program 1.3: Annually monitor the effectiveness of the City’s strategy for facilitating
accessory dwelling unit and junior accessory dwelling unit construction,
including conversion of pool houses and other accessory structures that
increase housing units. If the City is not meeting its fair share objectives for
ADUs by 2024, consider the following actions to enhance the program
effectiveness:
• Update the City’s ADU and Zoning Ordinance to ensure compliance with
state law.
• Adopt reduced fees or fee waivers for ADU and JADU permits;
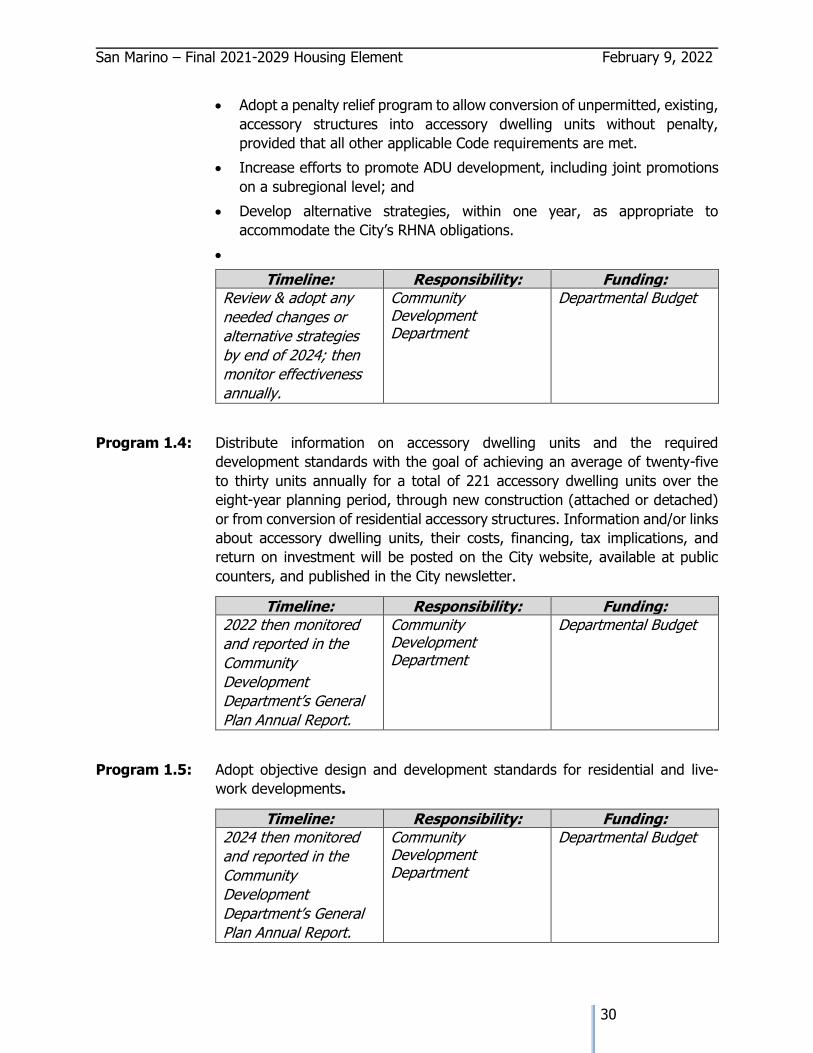
San Marino – Final 2021-2029 Housing Element February 9, 2022
30
• Adopt a penalty relief program to allow conversion of unpermitted, existing,
accessory structures into accessory dwelling units without penalty,
provided that all other applicable Code requirements are met.
• Increase efforts to promote ADU development, including joint promotions
on a subregional level; and
• Develop alternative strategies, within one year, as appropriate to
accommodate the City’s RHNA obligations.
•
Timeline: Responsibility: Funding: Review & adopt any
needed changes or
alternative strategies
by end of 2024; then
monitor effectiveness
annually.
Community Development Department
Departmental Budget
Program 1.4: Distribute information on accessory dwelling units and the required
development standards with the goal of achieving an average of twenty-five
to thirty units annually for a total of 221 accessory dwelling units over the
eight-year planning period, through new construction (attached or detached)
or from conversion of residential accessory structures. Information and/or links
about accessory dwelling units, their costs, financing, tax implications, and
return on investment will be posted on the City website, available at public
counters, and published in the City newsletter.
Timeline: Responsibility: Funding: 2022 then monitored
and reported in the
Community
Development
Department’s General
Plan Annual Report.
Community Development Department
Departmental Budget
Program 1.5: Adopt objective design and development standards for residential and live-
work developments.
Timeline: Responsibility: Funding: 2024 then monitored
and reported in the
Community
Development
Department’s General
Plan Annual Report.
Community Development Department
Departmental Budget
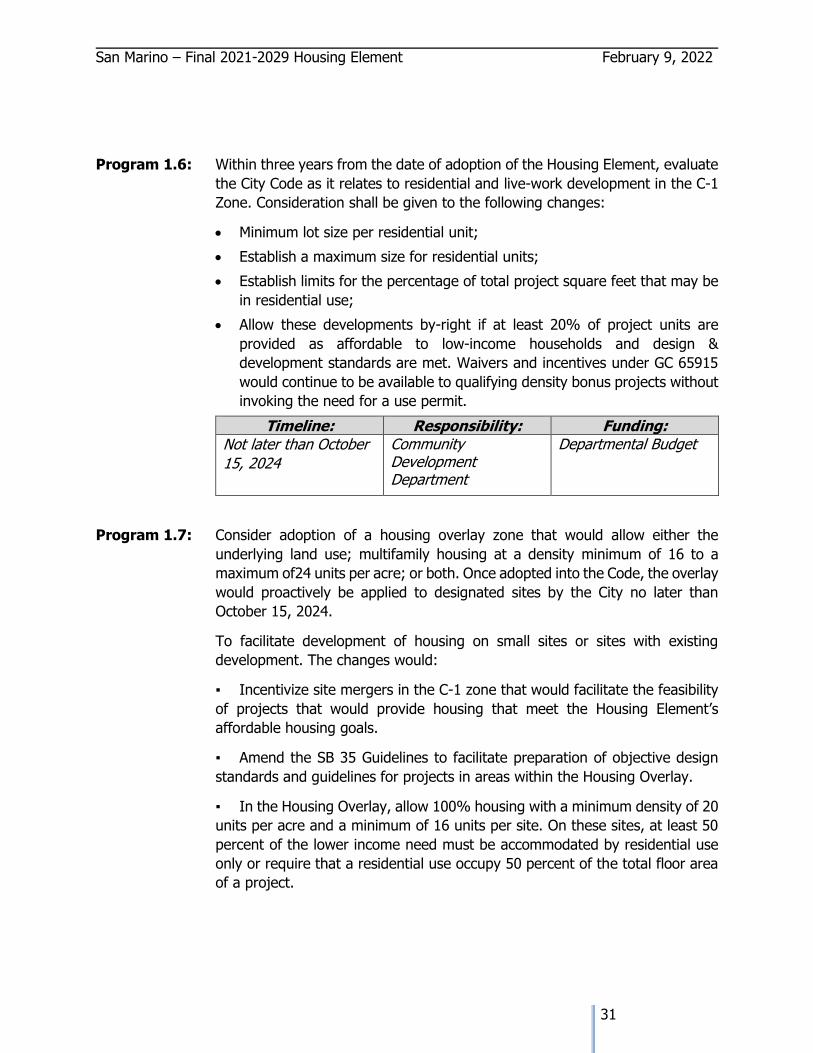
San Marino – Final 2021-2029 Housing Element February 9, 2022
31
Program 1.6: Within three years from the date of adoption of the Housing Element, evaluate
the City Code as it relates to residential and live-work development in the C-1
Zone. Consideration shall be given to the following changes:
• Minimum lot size per residential unit;
• Establish a maximum size for residential units;
• Establish limits for the percentage of total project square feet that may be
in residential use;
• Allow these developments by-right if at least 20% of project units are
provided as affordable to low-income households and design &
development standards are met. Waivers and incentives under GC 65915
would continue to be available to qualifying density bonus projects without
invoking the need for a use permit.
Timeline: Responsibility: Funding: Not later than October
15, 2024
Community Development Department
Departmental Budget
Program 1.7: Consider adoption of a housing overlay zone that would allow either the
underlying land use; multifamily housing at a density minimum of 16 to a
maximum of24 units per acre; or both. Once adopted into the Code, the overlay
would proactively be applied to designated sites by the City no later than
October 15, 2024.
To facilitate development of housing on small sites or sites with existing
development. The changes would:
▪ Incentivize site mergers in the C-1 zone that would facilitate the feasibility
of projects that would provide housing that meet the Housing Element’s
affordable housing goals.
▪ Amend the SB 35 Guidelines to facilitate preparation of objective design
standards and guidelines for projects in areas within the Housing Overlay.
▪ In the Housing Overlay, allow 100% housing with a minimum density of 20
units per acre and a minimum of 16 units per site. On these sites, at least 50
percent of the lower income need must be accommodated by residential use
only or require that a residential use occupy 50 percent of the total floor area
of a project.
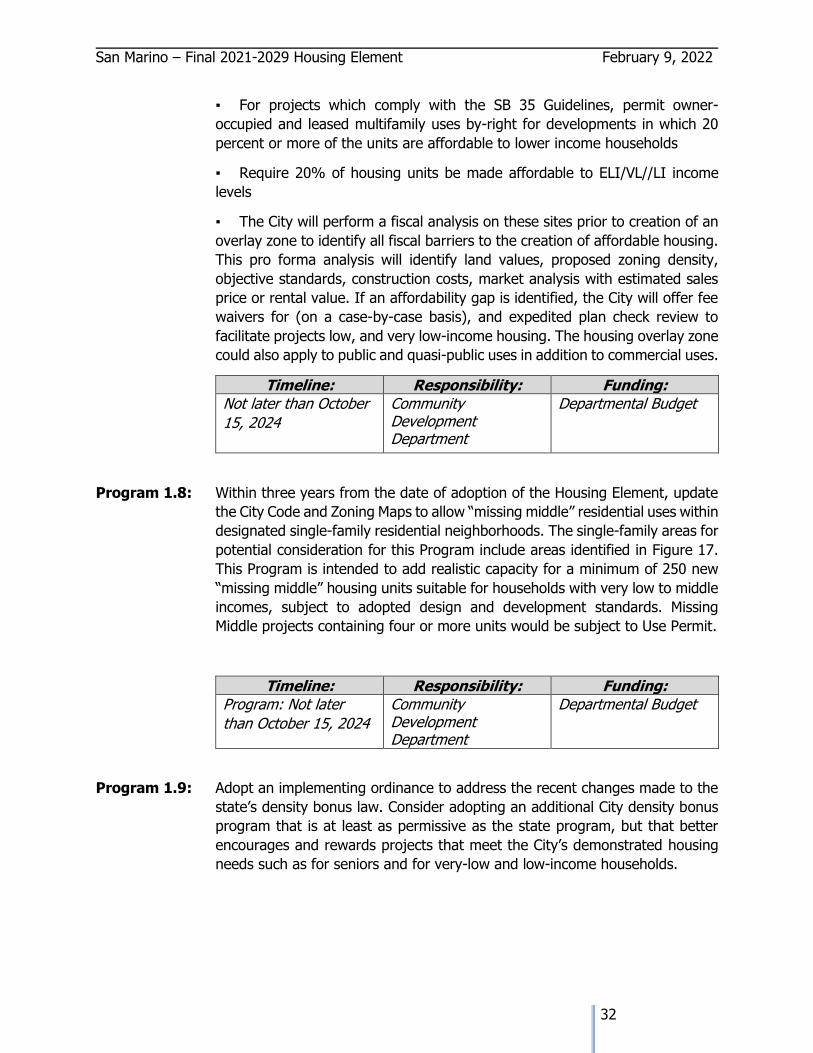
San Marino – Final 2021-2029 Housing Element February 9, 2022
32
▪ For projects which comply with the SB 35 Guidelines, permit owner-
occupied and leased multifamily uses by-right for developments in which 20
percent or more of the units are affordable to lower income households
▪ Require 20% of housing units be made affordable to ELI/VL//LI income
levels
▪ The City will perform a fiscal analysis on these sites prior to creation of an
overlay zone to identify all fiscal barriers to the creation of affordable housing.
This pro forma analysis will identify land values, proposed zoning density,
objective standards, construction costs, market analysis with estimated sales
price or rental value. If an affordability gap is identified, the City will offer fee
waivers for (on a case-by-case basis), and expedited plan check review to
facilitate projects low, and very low-income housing. The housing overlay zone
could also apply to public and quasi-public uses in addition to commercial uses.
Timeline: Responsibility: Funding: Not later than October
15, 2024
Community Development Department
Departmental Budget
Program 1.8: Within three years from the date of adoption of the Housing Element, update
the City Code and Zoning Maps to allow “missing middle” residential uses within
designated single-family residential neighborhoods. The single-family areas for
potential consideration for this Program include areas identified in Figure 17.
This Program is intended to add realistic capacity for a minimum of 250 new
“missing middle” housing units suitable for households with very low to middle
incomes, subject to adopted design and development standards. Missing
Middle projects containing four or more units would be subject to Use Permit.
Timeline: Responsibility: Funding: Program: Not later
than October 15, 2024
Community Development Department
Departmental Budget
Program 1.9: Adopt an implementing ordinance to address the recent changes made to the
state’s density bonus law. Consider adopting an additional City density bonus
program that is at least as permissive as the state program, but that better
encourages and rewards projects that meet the City’s demonstrated housing
needs such as for seniors and for very-low and low-income households.
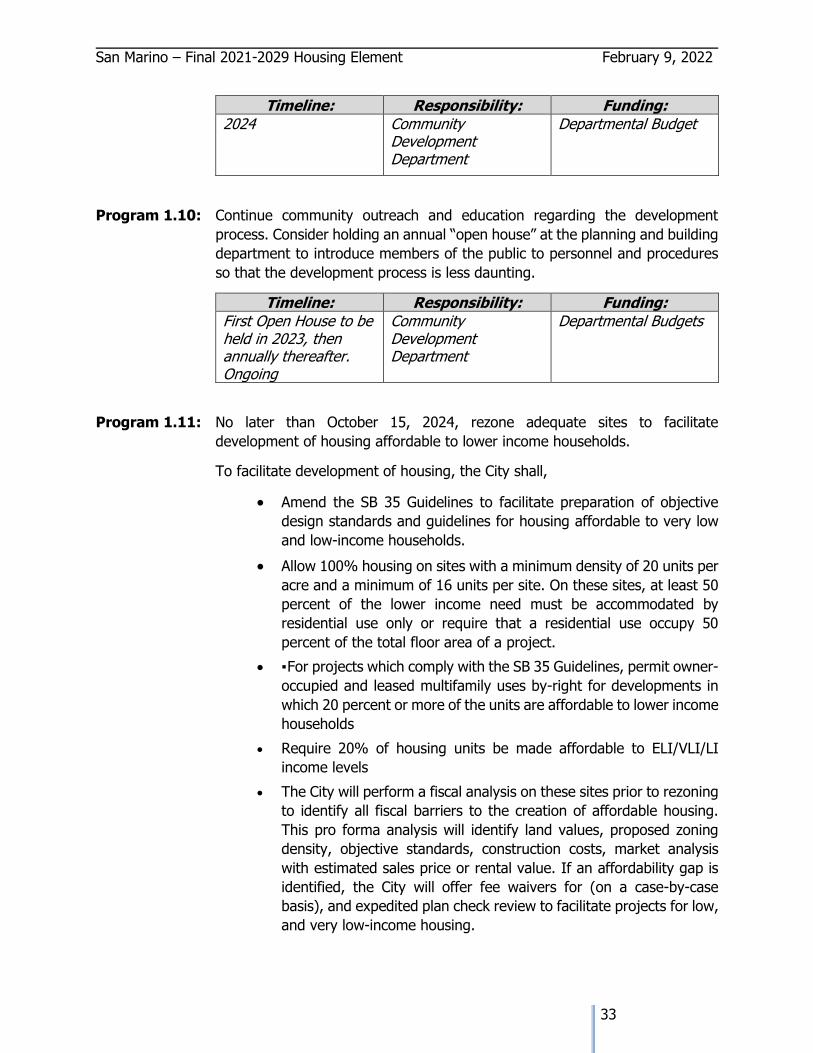
San Marino – Final 2021-2029 Housing Element February 9, 2022
33
Timeline: Responsibility: Funding: 2024 Community
Development Department
Departmental Budget
Program 1.10: Continue community outreach and education regarding the development
process. Consider holding an annual “open house” at the planning and building
department to introduce members of the public to personnel and procedures
so that the development process is less daunting.
Timeline: Responsibility: Funding: First Open House to be held in 2023, then annually thereafter. Ongoing
Community Development Department
Departmental Budgets
Program 1.11: No later than October 15, 2024, rezone adequate sites to facilitate
development of housing affordable to lower income households.
To facilitate development of housing, the City shall,
• Amend the SB 35 Guidelines to facilitate preparation of objective
design standards and guidelines for housing affordable to very low
and low-income households.
• Allow 100% housing on sites with a minimum density of 20 units per
acre and a minimum of 16 units per site. On these sites, at least 50
percent of the lower income need must be accommodated by
residential use only or require that a residential use occupy 50
percent of the total floor area of a project.
• ▪ For projects which comply with the SB 35 Guidelines, permit owner-
occupied and leased multifamily uses by-right for developments in
which 20 percent or more of the units are affordable to lower income
households
• Require 20% of housing units be made affordable to ELI/VLI/LI
income levels
• The City will perform a fiscal analysis on these sites prior to rezoning
to identify all fiscal barriers to the creation of affordable housing.
This pro forma analysis will identify land values, proposed zoning
density, objective standards, construction costs, market analysis
with estimated sales price or rental value. If an affordability gap is
identified, the City will offer fee waivers for (on a case-by-case
basis), and expedited plan check review to facilitate projects for low,
and very low-income housing.
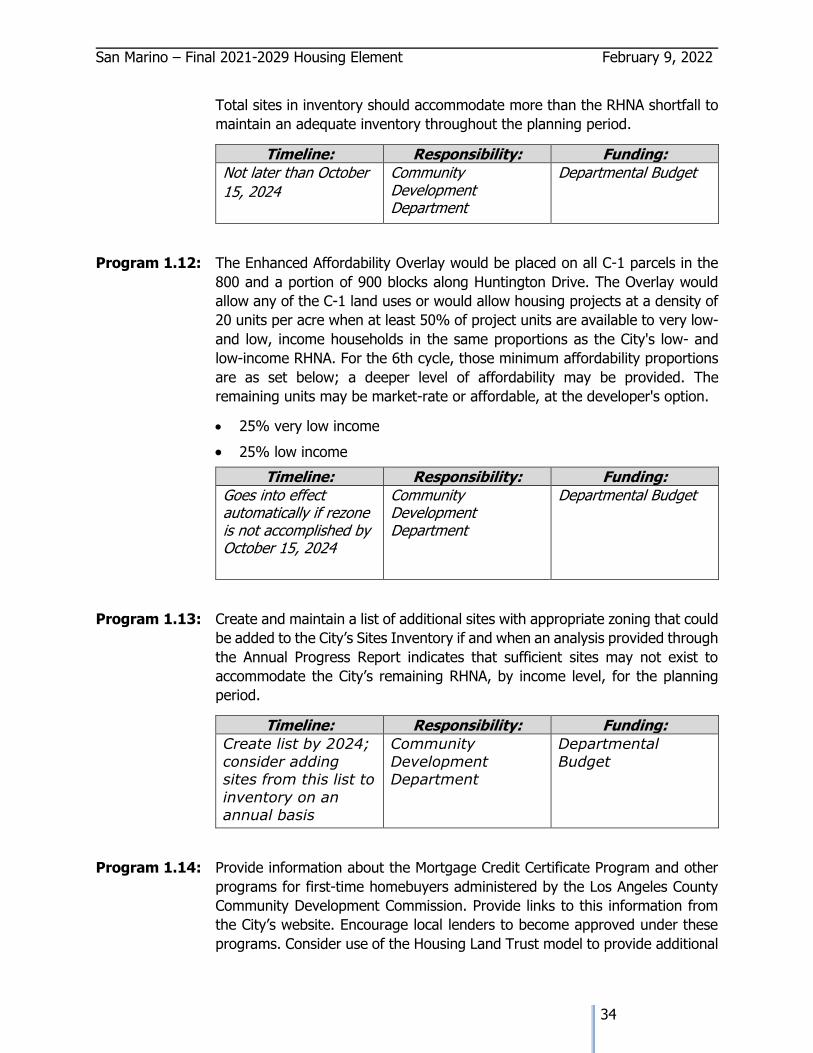
San Marino – Final 2021-2029 Housing Element February 9, 2022
34
Total sites in inventory should accommodate more than the RHNA shortfall to
maintain an adequate inventory throughout the planning period.
Timeline: Responsibility: Funding: Not later than October
15, 2024
Community Development Department
Departmental Budget
Program 1.12: The Enhanced Affordability Overlay would be placed on all C-1 parcels in the
800 and a portion of 900 blocks along Huntington Drive. The Overlay would
allow any of the C-1 land uses or would allow housing projects at a density of
20 units per acre when at least 50% of project units are available to very low-
and low, income households in the same proportions as the City's low- and
low-income RHNA. For the 6th cycle, those minimum affordability proportions
are as set below; a deeper level of affordability may be provided. The
remaining units may be market-rate or affordable, at the developer's option.
• 25% very low income
• 25% low income
Timeline: Responsibility: Funding: Goes into effect automatically if rezone is not accomplished by October 15, 2024
Community Development Department
Departmental Budget
Program 1.13: Create and maintain a list of additional sites with appropriate zoning that could
be added to the City’s Sites Inventory if and when an analysis provided through
the Annual Progress Report indicates that sufficient sites may not exist to
accommodate the City’s remaining RHNA, by income level, for the planning
period.
Timeline: Responsibility: Funding: Create list by 2024;
consider adding sites from this list to
inventory on an annual basis
Community
Development Department
Departmental
Budget
Program 1.14: Provide information about the Mortgage Credit Certificate Program and other
programs for first-time homebuyers administered by the Los Angeles County
Community Development Commission. Provide links to this information from
the City’s website. Encourage local lenders to become approved under these
programs. Consider use of the Housing Land Trust model to provide additional
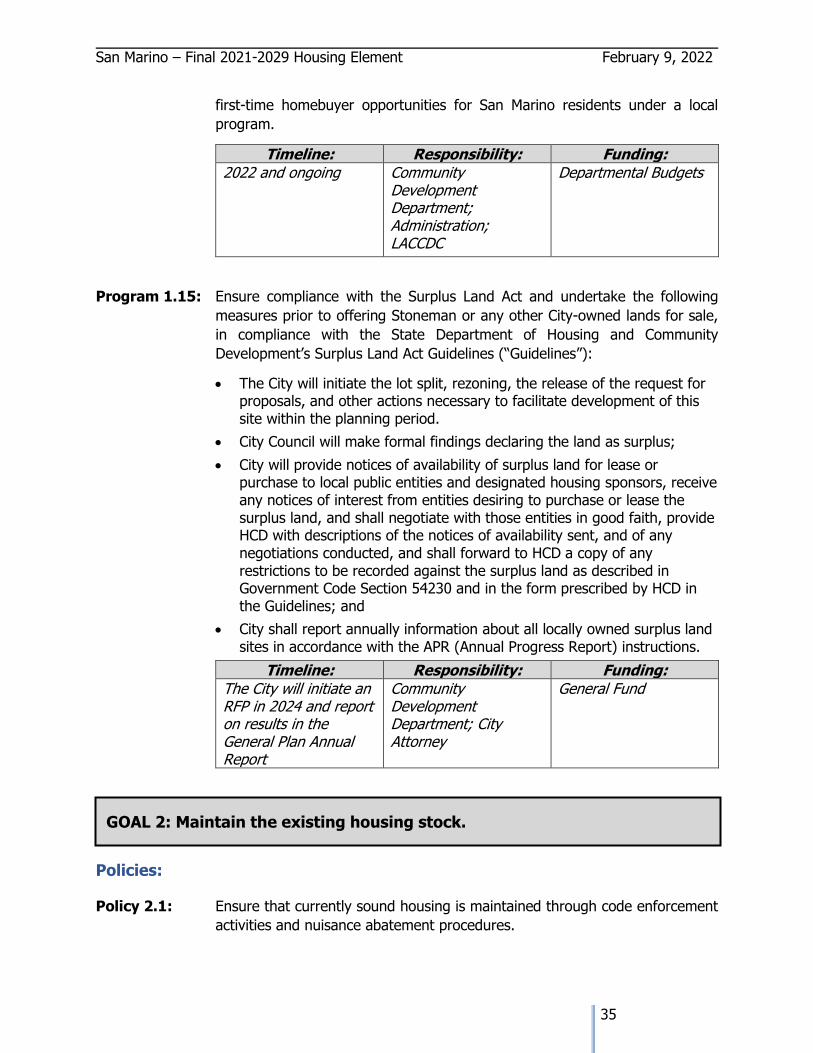
San Marino – Final 2021-2029 Housing Element February 9, 2022
35
first-time homebuyer opportunities for San Marino residents under a local
program.
Timeline: Responsibility: Funding: 2022 and ongoing Community
Development Department; Administration; LACCDC
Departmental Budgets
Program 1.15: Ensure compliance with the Surplus Land Act and undertake the following
measures prior to offering Stoneman or any other City-owned lands for sale,
in compliance with the State Department of Housing and Community
Development’s Surplus Land Act Guidelines (“Guidelines”):
• The City will initiate the lot split, rezoning, the release of the request for proposals, and other actions necessary to facilitate development of this site within the planning period.
• City Council will make formal findings declaring the land as surplus;
• City will provide notices of availability of surplus land for lease or purchase to local public entities and designated housing sponsors, receive any notices of interest from entities desiring to purchase or lease the surplus land, and shall negotiate with those entities in good faith, provide HCD with descriptions of the notices of availability sent, and of any negotiations conducted, and shall forward to HCD a copy of any restrictions to be recorded against the surplus land as described in Government Code Section 54230 and in the form prescribed by HCD in the Guidelines; and
• City shall report annually information about all locally owned surplus land sites in accordance with the APR (Annual Progress Report) instructions.
Timeline: Responsibility: Funding: The City will initiate an RFP in 2024 and report on results in the General Plan Annual Report
Community Development Department; City Attorney
General Fund
Policies:
Policy 2.1: Ensure that currently sound housing is maintained through code enforcement
activities and nuisance abatement procedures.
GOAL 2: Maintain the existing housing stock.
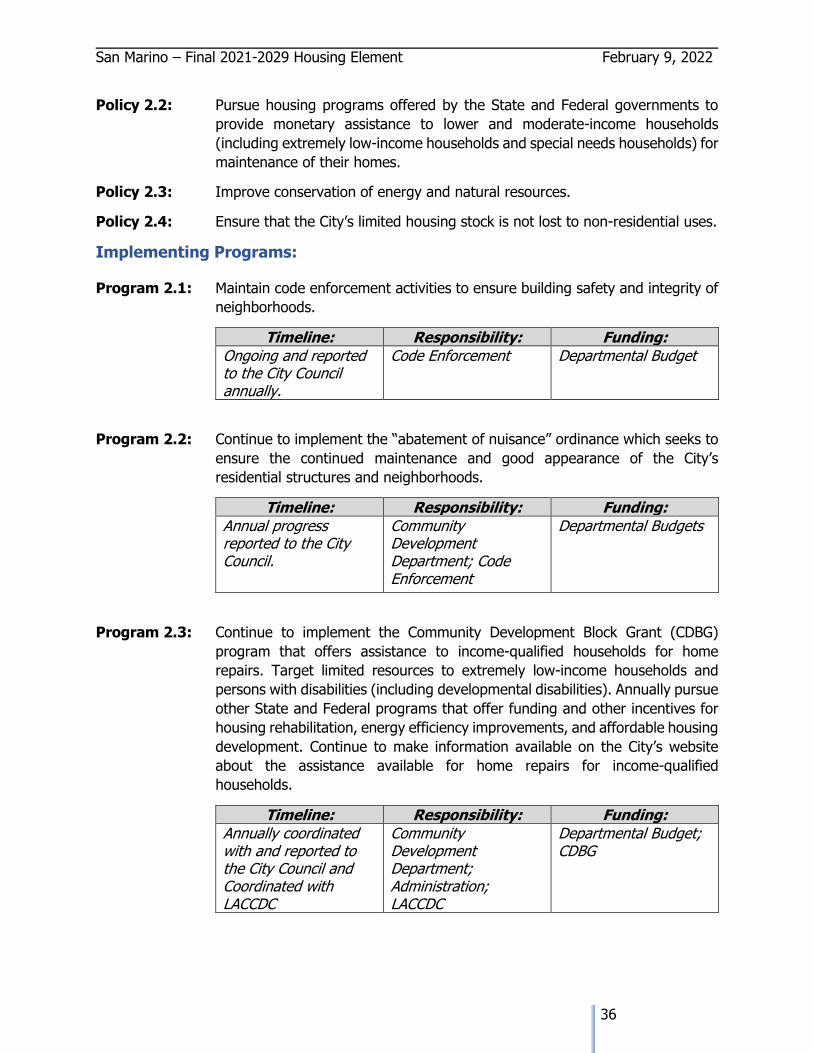
San Marino – Final 2021-2029 Housing Element February 9, 2022
36
Policy 2.2: Pursue housing programs offered by the State and Federal governments to
provide monetary assistance to lower and moderate-income households
(including extremely low-income households and special needs households) for
maintenance of their homes.
Policy 2.3: Improve conservation of energy and natural resources.
Policy 2.4: Ensure that the City’s limited housing stock is not lost to non-residential uses.
Implementing Programs:
Program 2.1: Maintain code enforcement activities to ensure building safety and integrity of
neighborhoods.
Timeline: Responsibility: Funding: Ongoing and reported to the City Council annually.
Code Enforcement Departmental Budget
Program 2.2: Continue to implement the “abatement of nuisance” ordinance which seeks to
ensure the continued maintenance and good appearance of the City’s
residential structures and neighborhoods.
Timeline: Responsibility: Funding: Annual progress reported to the City Council.
Community Development Department; Code Enforcement
Departmental Budgets
Program 2.3: Continue to implement the Community Development Block Grant (CDBG)
program that offers assistance to income-qualified households for home
repairs. Target limited resources to extremely low-income households and
persons with disabilities (including developmental disabilities). Annually pursue
other State and Federal programs that offer funding and other incentives for
housing rehabilitation, energy efficiency improvements, and affordable housing
development. Continue to make information available on the City’s website
about the assistance available for home repairs for income-qualified
households.
Timeline: Responsibility: Funding: Annually coordinated with and reported to the City Council and Coordinated with LACCDC
Community Development Department; Administration; LACCDC
Departmental Budget; CDBG
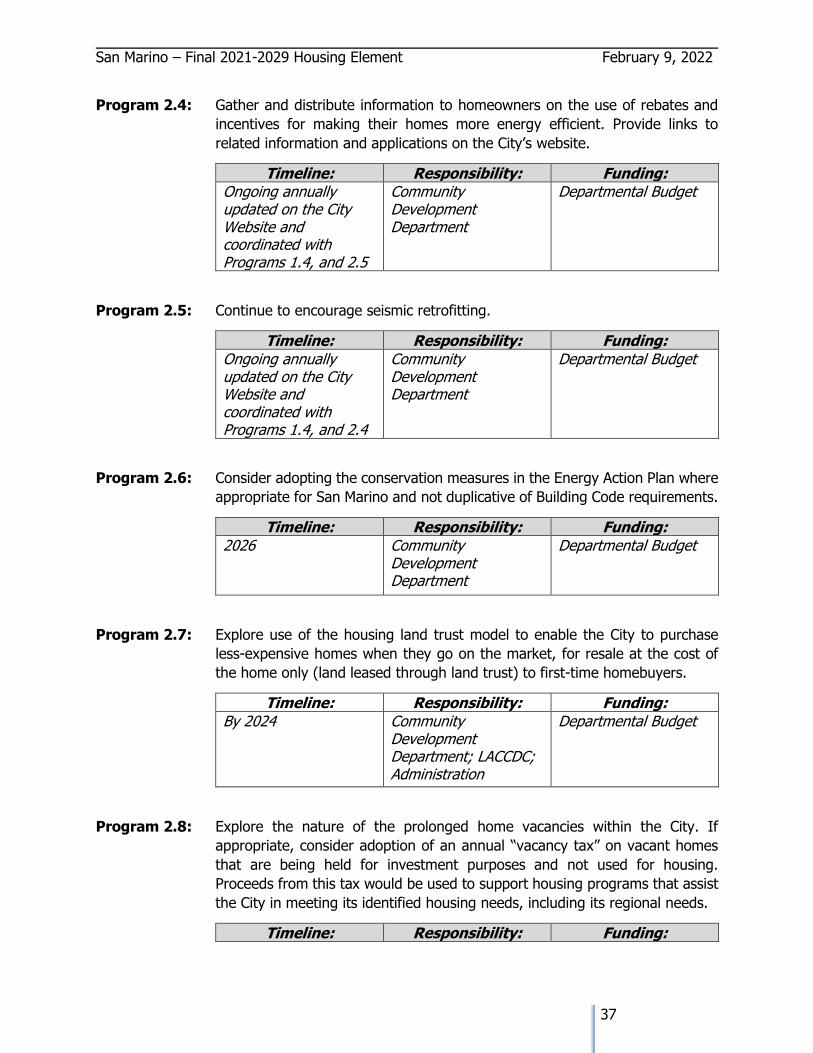
San Marino – Final 2021-2029 Housing Element February 9, 2022
37
Program 2.4: Gather and distribute information to homeowners on the use of rebates and
incentives for making their homes more energy efficient. Provide links to
related information and applications on the City’s website.
Timeline: Responsibility: Funding: Ongoing annually updated on the City Website and coordinated with Programs 1.4, and 2.5
Community Development Department
Departmental Budget
Program 2.5: Continue to encourage seismic retrofitting.
Timeline: Responsibility: Funding: Ongoing annually updated on the City Website and coordinated with Programs 1.4, and 2.4
Community Development Department
Departmental Budget
Program 2.6: Consider adopting the conservation measures in the Energy Action Plan where
appropriate for San Marino and not duplicative of Building Code requirements.
Timeline: Responsibility: Funding: 2026 Community
Development Department
Departmental Budget
Program 2.7: Explore use of the housing land trust model to enable the City to purchase
less-expensive homes when they go on the market, for resale at the cost of
the home only (land leased through land trust) to first-time homebuyers.
Timeline: Responsibility: Funding: By 2024 Community
Development Department; LACCDC; Administration
Departmental Budget
Program 2.8: Explore the nature of the prolonged home vacancies within the City. If
appropriate, consider adoption of an annual “vacancy tax” on vacant homes
that are being held for investment purposes and not used for housing.
Proceeds from this tax would be used to support housing programs that assist
the City in meeting its identified housing needs, including its regional needs.
Timeline: Responsibility: Funding:
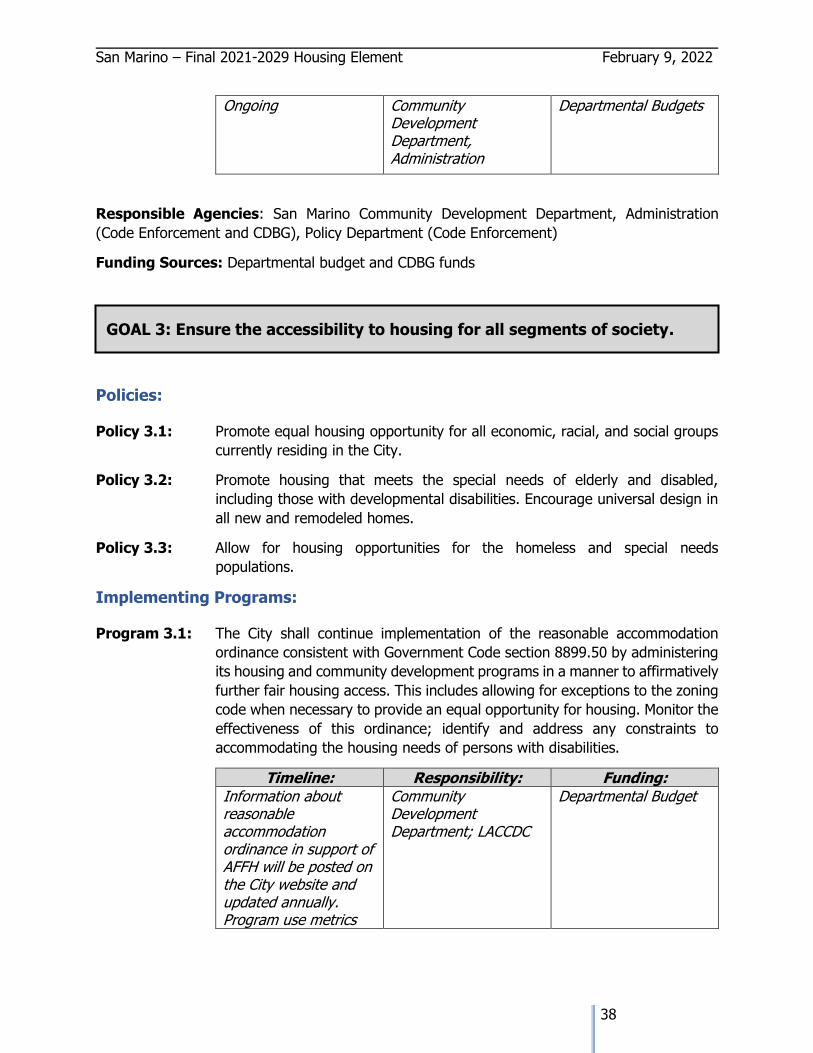
San Marino – Final 2021-2029 Housing Element February 9, 2022
38
Ongoing Community Development Department, Administration
Departmental Budgets
Responsible Agencies: San Marino Community Development Department, Administration
(Code Enforcement and CDBG), Policy Department (Code Enforcement)
Funding Sources: Departmental budget and CDBG funds
Policies:
Policy 3.1: Promote equal housing opportunity for all economic, racial, and social groups
currently residing in the City.
Policy 3.2: Promote housing that meets the special needs of elderly and disabled,
including those with developmental disabilities. Encourage universal design in
all new and remodeled homes.
Policy 3.3: Allow for housing opportunities for the homeless and special needs
populations.
Implementing Programs:
Program 3.1: The City shall continue implementation of the reasonable accommodation
ordinance consistent with Government Code section 8899.50 by administering
its housing and community development programs in a manner to affirmatively
further fair housing access. This includes allowing for exceptions to the zoning
code when necessary to provide an equal opportunity for housing. Monitor the
effectiveness of this ordinance; identify and address any constraints to
accommodating the housing needs of persons with disabilities.
Timeline: Responsibility: Funding: Information about reasonable accommodation ordinance in support of AFFH will be posted on the City website and updated annually. Program use metrics
Community Development Department; LACCDC
Departmental Budget
GOAL 3: Ensure the accessibility to housing for all segments of society.
Policies
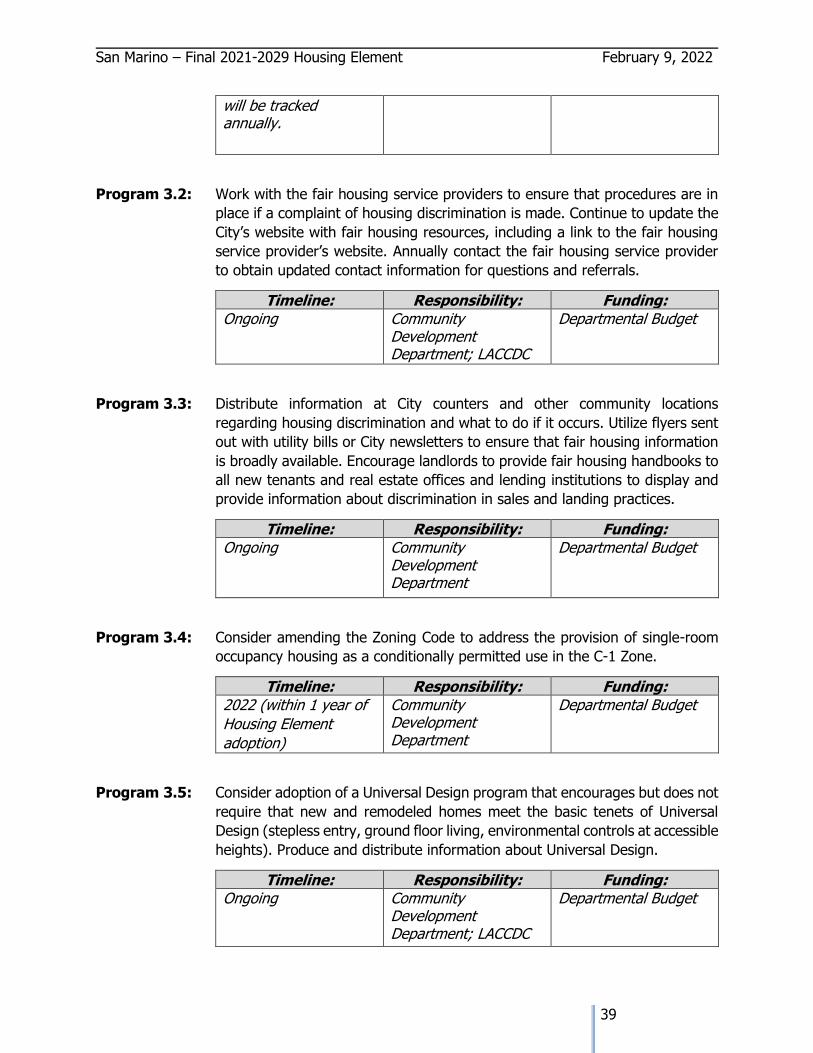
San Marino – Final 2021-2029 Housing Element February 9, 2022
39
will be tracked annually.
Program 3.2: Work with the fair housing service providers to ensure that procedures are in
place if a complaint of housing discrimination is made. Continue to update the
City’s website with fair housing resources, including a link to the fair housing
service provider’s website. Annually contact the fair housing service provider
to obtain updated contact information for questions and referrals.
Timeline: Responsibility: Funding: Ongoing Community
Development Department; LACCDC
Departmental Budget
Program 3.3: Distribute information at City counters and other community locations
regarding housing discrimination and what to do if it occurs. Utilize flyers sent
out with utility bills or City newsletters to ensure that fair housing information
is broadly available. Encourage landlords to provide fair housing handbooks to
all new tenants and real estate offices and lending institutions to display and
provide information about discrimination in sales and landing practices.
Timeline: Responsibility: Funding: Ongoing Community
Development Department
Departmental Budget
Program 3.4: Consider amending the Zoning Code to address the provision of single-room
occupancy housing as a conditionally permitted use in the C-1 Zone.
Timeline: Responsibility: Funding: 2022 (within 1 year of
Housing Element
adoption)
Community Development Department
Departmental Budget
Program 3.5: Consider adoption of a Universal Design program that encourages but does not
require that new and remodeled homes meet the basic tenets of Universal
Design (stepless entry, ground floor living, environmental controls at accessible
heights). Produce and distribute information about Universal Design.
Timeline: Responsibility: Funding: Ongoing Community
Development Department; LACCDC
Departmental Budget
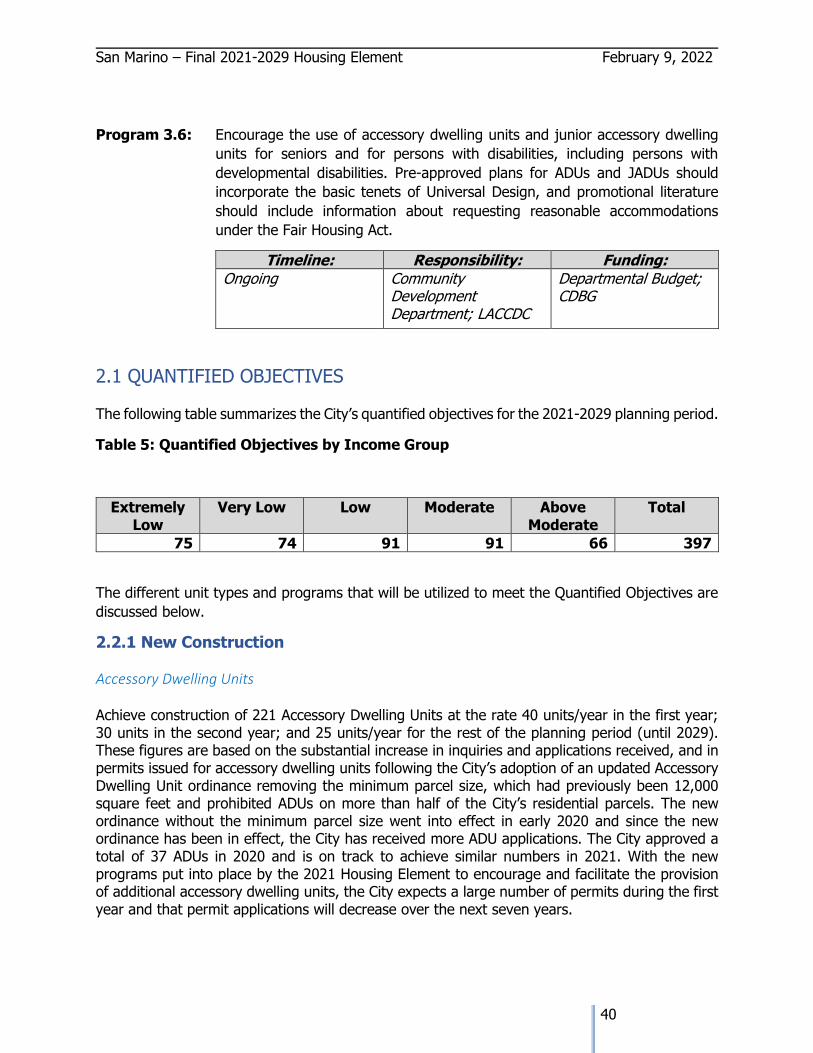
San Marino – Final 2021-2029 Housing Element February 9, 2022
40
Program 3.6: Encourage the use of accessory dwelling units and junior accessory dwelling
units for seniors and for persons with disabilities, including persons with
developmental disabilities. Pre-approved plans for ADUs and JADUs should
incorporate the basic tenets of Universal Design, and promotional literature
should include information about requesting reasonable accommodations
under the Fair Housing Act.
Timeline: Responsibility: Funding: Ongoing Community
Development Department; LACCDC
Departmental Budget; CDBG
2.1 QUANTIFIED OBJECTIVES
The following table summarizes the City’s quantified objectives for the 2021-2029 planning period.
Table 5: Quantified Objectives by Income Group
Extremely Low
Very Low Low Moderate Above Moderate
Total
75 74 91 91 66 397
The different unit types and programs that will be utilized to meet the Quantified Objectives are
discussed below.
2.2.1 New Construction
Accessory Dwelling Units
Achieve construction of 221 Accessory Dwelling Units at the rate 40 units/year in the first year; 30 units in the second year; and 25 units/year for the rest of the planning period (until 2029). These figures are based on the substantial increase in inquiries and applications received, and in permits issued for accessory dwelling units following the City’s adoption of an updated Accessory Dwelling Unit ordinance removing the minimum parcel size, which had previously been 12,000 square feet and prohibited ADUs on more than half of the City’s residential parcels. The new ordinance without the minimum parcel size went into effect in early 2020 and since the new ordinance has been in effect, the City has received more ADU applications. The City approved a total of 37 ADUs in 2020 and is on track to achieve similar numbers in 2021. With the new programs put into place by the 2021 Housing Element to encourage and facilitate the provision of additional accessory dwelling units, the City expects a large number of permits during the first year and that permit applications will decrease over the next seven years.
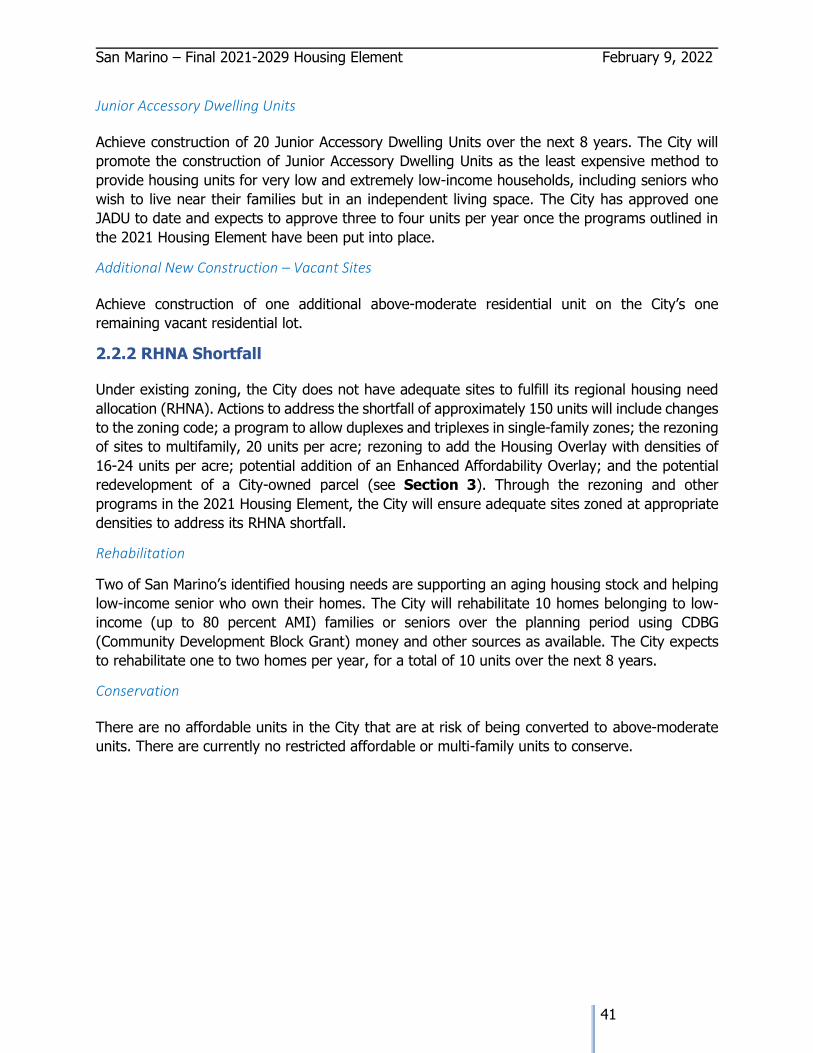
San Marino – Final 2021-2029 Housing Element February 9, 2022
41
Junior Accessory Dwelling Units
Achieve construction of 20 Junior Accessory Dwelling Units over the next 8 years. The City will
promote the construction of Junior Accessory Dwelling Units as the least expensive method to
provide housing units for very low and extremely low-income households, including seniors who
wish to live near their families but in an independent living space. The City has approved one
JADU to date and expects to approve three to four units per year once the programs outlined in
the 2021 Housing Element have been put into place.
Additional New Construction – Vacant Sites
Achieve construction of one additional above-moderate residential unit on the City’s one
remaining vacant residential lot.
2.2.2 RHNA Shortfall
Under existing zoning, the City does not have adequate sites to fulfill its regional housing need
allocation (RHNA). Actions to address the shortfall of approximately 150 units will include changes
to the zoning code; a program to allow duplexes and triplexes in single-family zones; the rezoning
of sites to multifamily, 20 units per acre; rezoning to add the Housing Overlay with densities of
16-24 units per acre; potential addition of an Enhanced Affordability Overlay; and the potential
redevelopment of a City-owned parcel (see Section 3). Through the rezoning and other
programs in the 2021 Housing Element, the City will ensure adequate sites zoned at appropriate
densities to address its RHNA shortfall.
Rehabilitation
Two of San Marino’s identified housing needs are supporting an aging housing stock and helping
low-income senior who own their homes. The City will rehabilitate 10 homes belonging to low-
income (up to 80 percent AMI) families or seniors over the planning period using CDBG
(Community Development Block Grant) money and other sources as available. The City expects
to rehabilitate one to two homes per year, for a total of 10 units over the next 8 years.
Conservation
There are no affordable units in the City that are at risk of being converted to above-moderate
units. There are currently no restricted affordable or multi-family units to conserve.
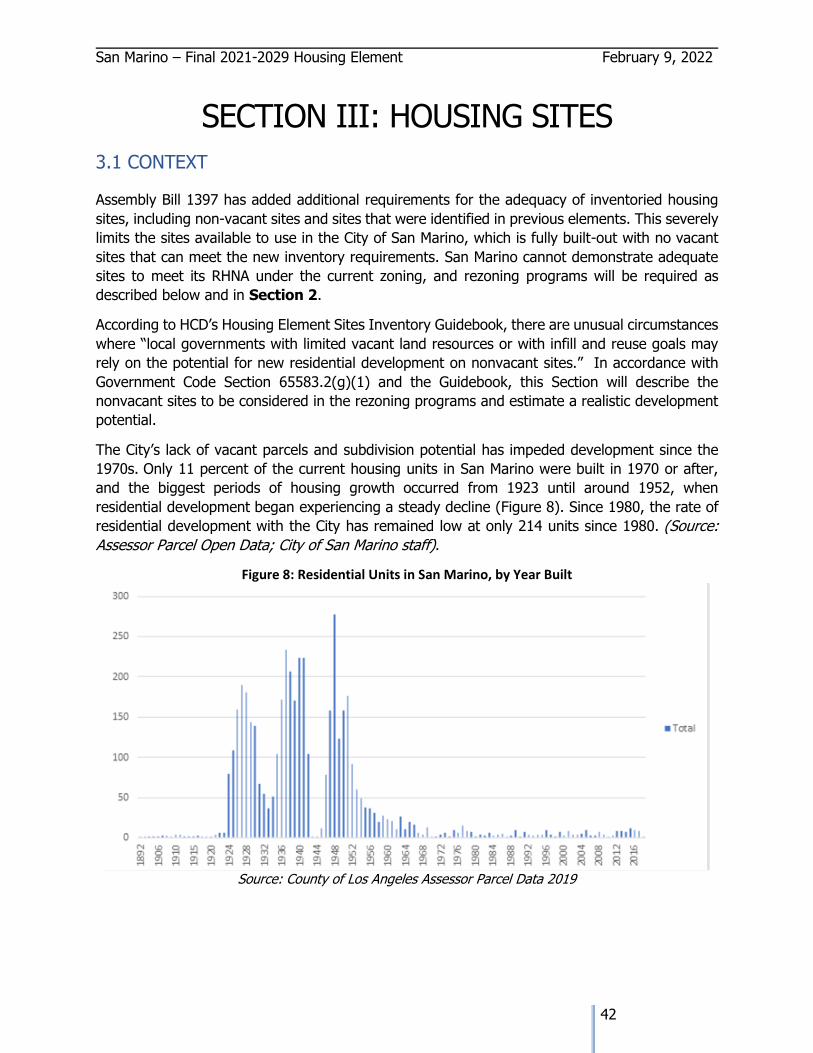
San Marino – Final 2021-2029 Housing Element February 9, 2022
42
SECTION III: HOUSING SITES
3.1 CONTEXT
Assembly Bill 1397 has added additional requirements for the adequacy of inventoried housing
sites, including non‐vacant sites and sites that were identified in previous elements. This severely
limits the sites available to use in the City of San Marino, which is fully built-out with no vacant
sites that can meet the new inventory requirements. San Marino cannot demonstrate adequate
sites to meet its RHNA under the current zoning, and rezoning programs will be required as
described below and in Section 2.
According to HCD’s Housing Element Sites Inventory Guidebook, there are unusual circumstances
where “local governments with limited vacant land resources or with infill and reuse goals may
rely on the potential for new residential development on nonvacant sites.” In accordance with
Government Code Section 65583.2(g)(1) and the Guidebook, this Section will describe the
nonvacant sites to be considered in the rezoning programs and estimate a realistic development
potential.
The City’s lack of vacant parcels and subdivision potential has impeded development since the
1970s. Only 11 percent of the current housing units in San Marino were built in 1970 or after,
and the biggest periods of housing growth occurred from 1923 until around 1952, when
residential development began experiencing a steady decline (Figure 8). Since 1980, the rate of
residential development with the City has remained low at only 214 units since 1980. (Source:
Assessor Parcel Open Data; City of San Marino staff).
Figure 8: Residential Units in San Marino, by Year Built
Source: County of Los Angeles Assessor Parcel Data 2019
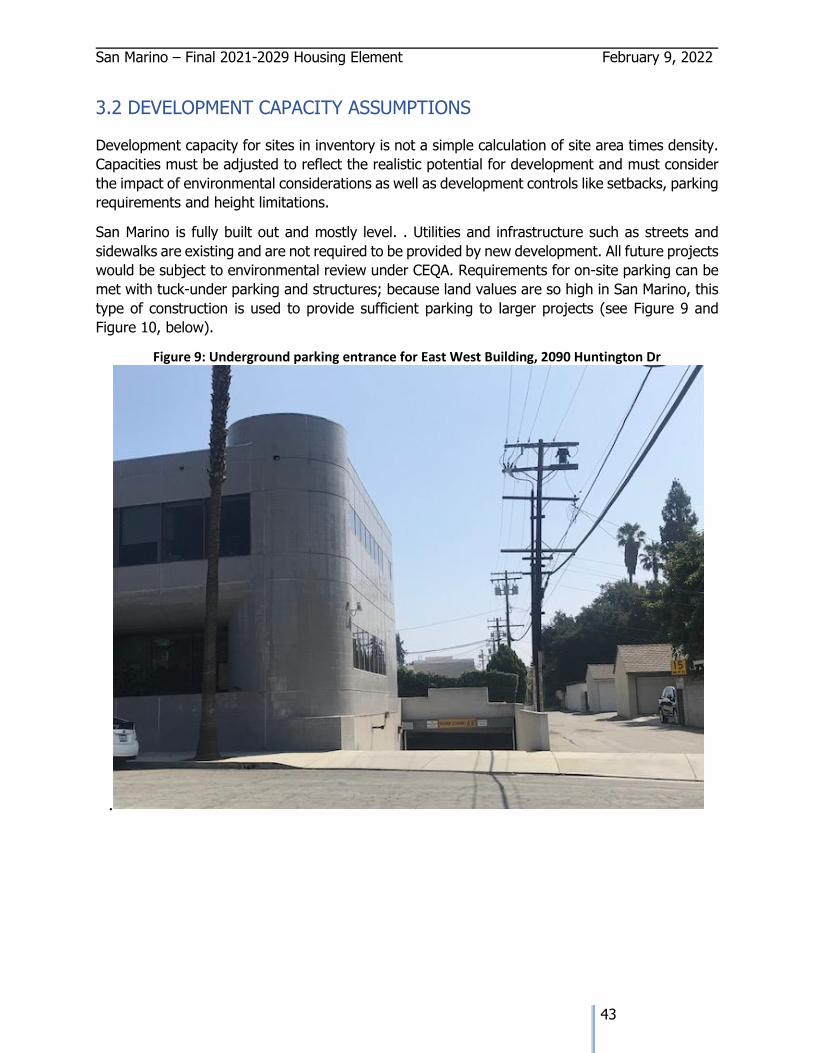
San Marino – Final 2021-2029 Housing Element February 9, 2022
43
3.2 DEVELOPMENT CAPACITY ASSUMPTIONS
Development capacity for sites in inventory is not a simple calculation of site area times density.
Capacities must be adjusted to reflect the realistic potential for development and must consider
the impact of environmental considerations as well as development controls like setbacks, parking
requirements and height limitations.
San Marino is fully built out and mostly level. . Utilities and infrastructure such as streets and
sidewalks are existing and are not required to be provided by new development. All future projects
would be subject to environmental review under CEQA. Requirements for on-site parking can be
met with tuck-under parking and structures; because land values are so high in San Marino, this
type of construction is used to provide sufficient parking to larger projects (see Figure 9 and
Figure 10, below).
Figure 9: Underground parking entrance for East West Building, 2090 Huntington Dr
.
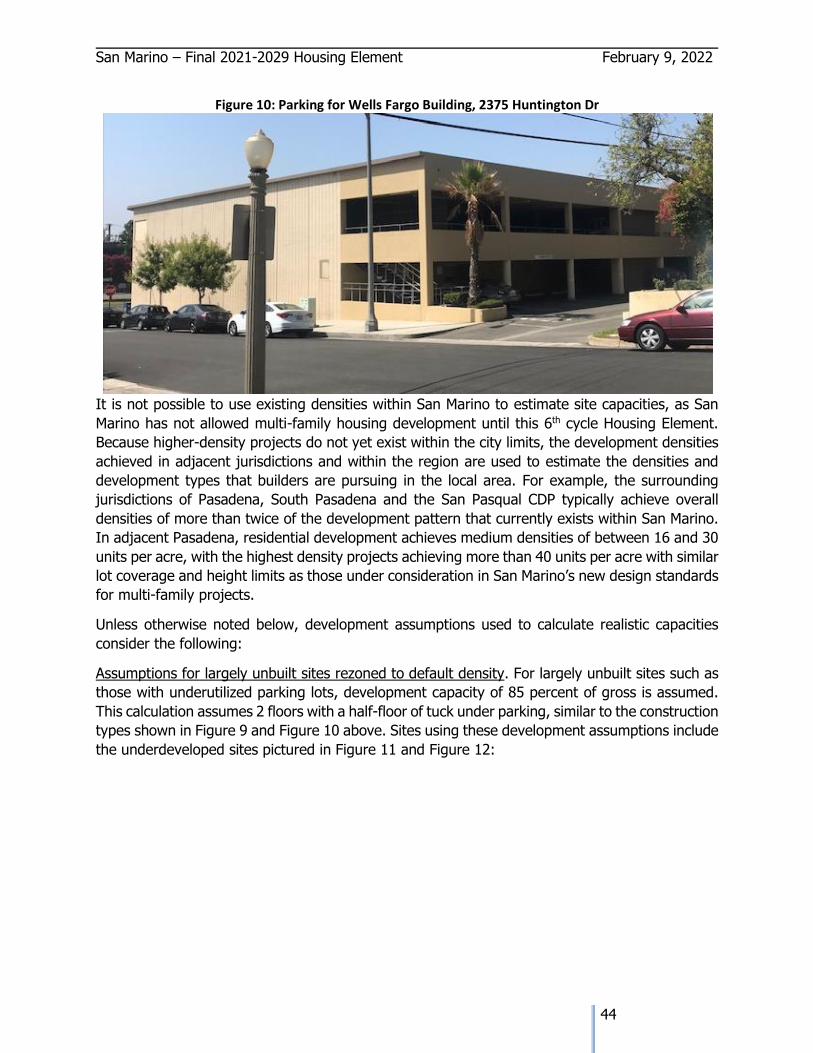
San Marino – Final 2021-2029 Housing Element February 9, 2022
44
Figure 10: Parking for Wells Fargo Building, 2375 Huntington Dr
It is not possible to use existing densities within San Marino to estimate site capacities, as San
Marino has not allowed multi-family housing development until this 6th cycle Housing Element.
Because higher-density projects do not yet exist within the city limits, the development densities
achieved in adjacent jurisdictions and within the region are used to estimate the densities and
development types that builders are pursuing in the local area. For example, the surrounding
jurisdictions of Pasadena, South Pasadena and the San Pasqual CDP typically achieve overall
densities of more than twice of the development pattern that currently exists within San Marino.
In adjacent Pasadena, residential development achieves medium densities of between 16 and 30
units per acre, with the highest density projects achieving more than 40 units per acre with similar
lot coverage and height limits as those under consideration in San Marino’s new design standards
for multi-family projects.
Unless otherwise noted below, development assumptions used to calculate realistic capacities
consider the following:
Assumptions for largely unbuilt sites rezoned to default density. For largely unbuilt sites such as
those with underutilized parking lots, development capacity of 85 percent of gross is assumed.
This calculation assumes 2 floors with a half-floor of tuck under parking, similar to the construction
types shown in Figure 9 and Figure 10 above. Sites using these development assumptions include
the underdeveloped sites pictured in Figure 11 and Figure 12:
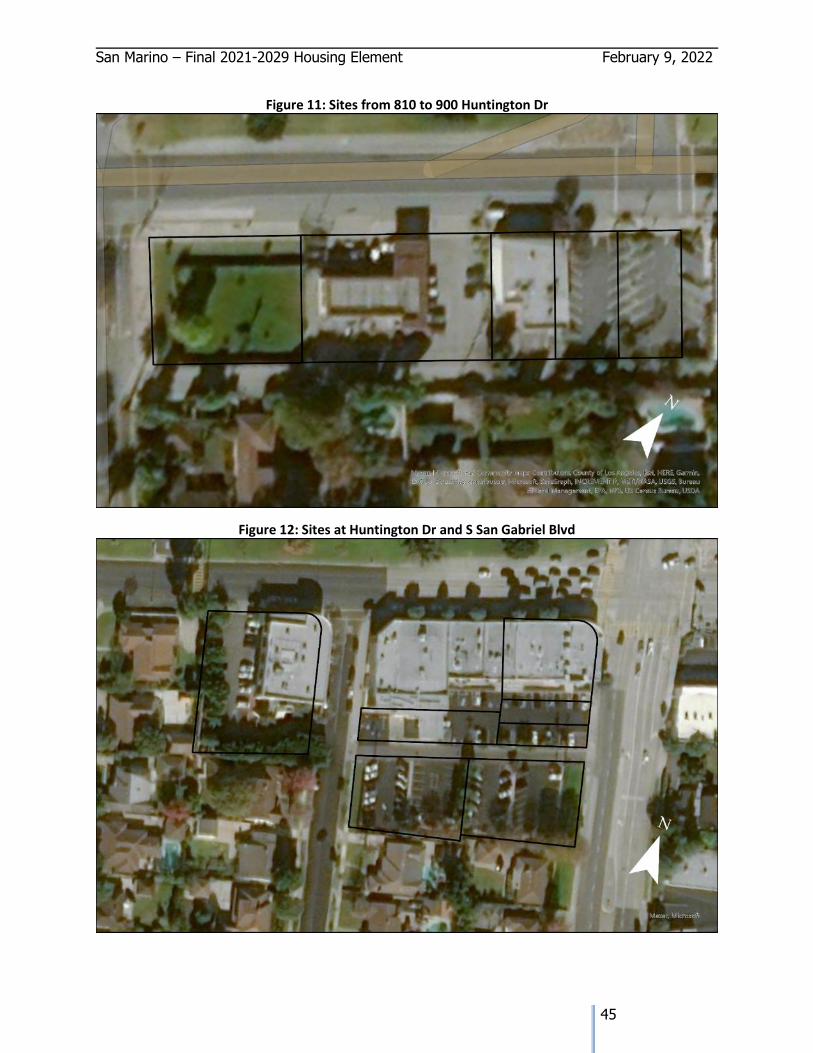
San Marino – Final 2021-2029 Housing Element February 9, 2022
45
Figure 11: Sites from 810 to 900 Huntington Dr
Figure 12: Sites at Huntington Dr and S San Gabriel Blvd
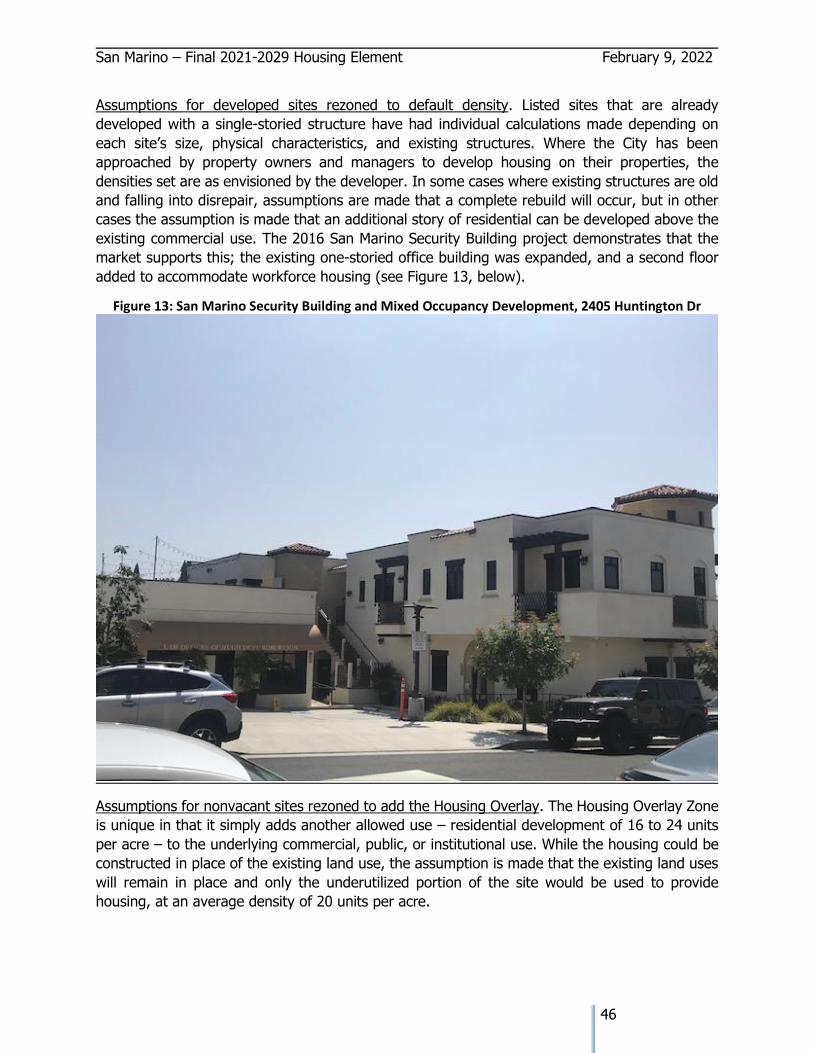
San Marino – Final 2021-2029 Housing Element February 9, 2022
46
Assumptions for developed sites rezoned to default density. Listed sites that are already
developed with a single-storied structure have had individual calculations made depending on
each site’s size, physical characteristics, and existing structures. Where the City has been
approached by property owners and managers to develop housing on their properties, the
densities set are as envisioned by the developer. In some cases where existing structures are old
and falling into disrepair, assumptions are made that a complete rebuild will occur, but in other
cases the assumption is made that an additional story of residential can be developed above the
existing commercial use. The 2016 San Marino Security Building project demonstrates that the
market supports this; the existing one-storied office building was expanded, and a second floor
added to accommodate workforce housing (see Figure 13, below).
Figure 13: San Marino Security Building and Mixed Occupancy Development, 2405 Huntington Dr
Assumptions for nonvacant sites rezoned to add the Housing Overlay. The Housing Overlay Zone
is unique in that it simply adds another allowed use – residential development of 16 to 24 units
per acre – to the underlying commercial, public, or institutional use. While the housing could be
constructed in place of the existing land use, the assumption is made that the existing land uses
will remain in place and only the underutilized portion of the site would be used to provide
housing, at an average density of 20 units per acre.
San Marino – Final 2021-2029 Housing Element February 9, 2022
47
Assumptions for nonvacant sites rezoned to add the Enhanced Affordability Overlay. The
Enhanced Affordability Overlay Zone would be applicable to C-1 parcels on the 800 and a portion
of the 900 blocks of Huntington Drive, adjacent to bus stops and walkable to daily services.
Parcels along these lots generally consist of one-story underutilized buildings and lots. The
Enhanced Affordability Overlay will allow densities of 20 units per acre, as long as minimum
affordability requirements are met. This Overlay utilized the same development capacity
assumptions as discussed above for parcels rezoned to default density of 20 units per acre, which
would provide a realistic capacity of 25 units within the Enhanced Affordability Overlay Zone.
Overall, the City has taken a conservative approach when calculating realistic development
capacities, as shown in Table 16: Available Sites for Housing After Rezoning Programs*. With a
total capacity of about 5,000 new units, the calculated realistic development capacity, including
ADUs and JADUs is set at less than 600 units.
3.3 REALISTIC CAPACITY OF SITES ZONED FOR HOUSING
The City currently allows only single-family dwellings on lots zoned for housing. All residential
properties are categorized into eight Area Districts allowing various densities through minimum
lot size requirements; these range from 1-4 units per acre to 2-6 units per acre. Each residentially
zoned parcel only allows one residence, one ADU, and one JADU under existing zoning. Because
not all housing types are currently allowed, rezoning will be necessary to accommodate the
regional housing need as well as to enable the development of all types of housing.
The one vacant residentially zoned site available in the City has a realistic capacity of one above-
moderate income unit; a building permit has been issued. The non-vacant City-owned Stoneman
property could have capacity for 11 residential units were it to be subdivided into 11 lots;
however, this is not a realistic capacity because the City does not intend to subdivide the property
in this manner, and instead intends either split and surplus a portion of the property consistent
with the Surplus Lands Act, or to find a non-profit developer through the RFP process. While both
properties could also accommodate an ADU and a JADU, those types are summarized below and
are not included here. Table 6 summarizes the realistic capacity for residentially zoned sites:
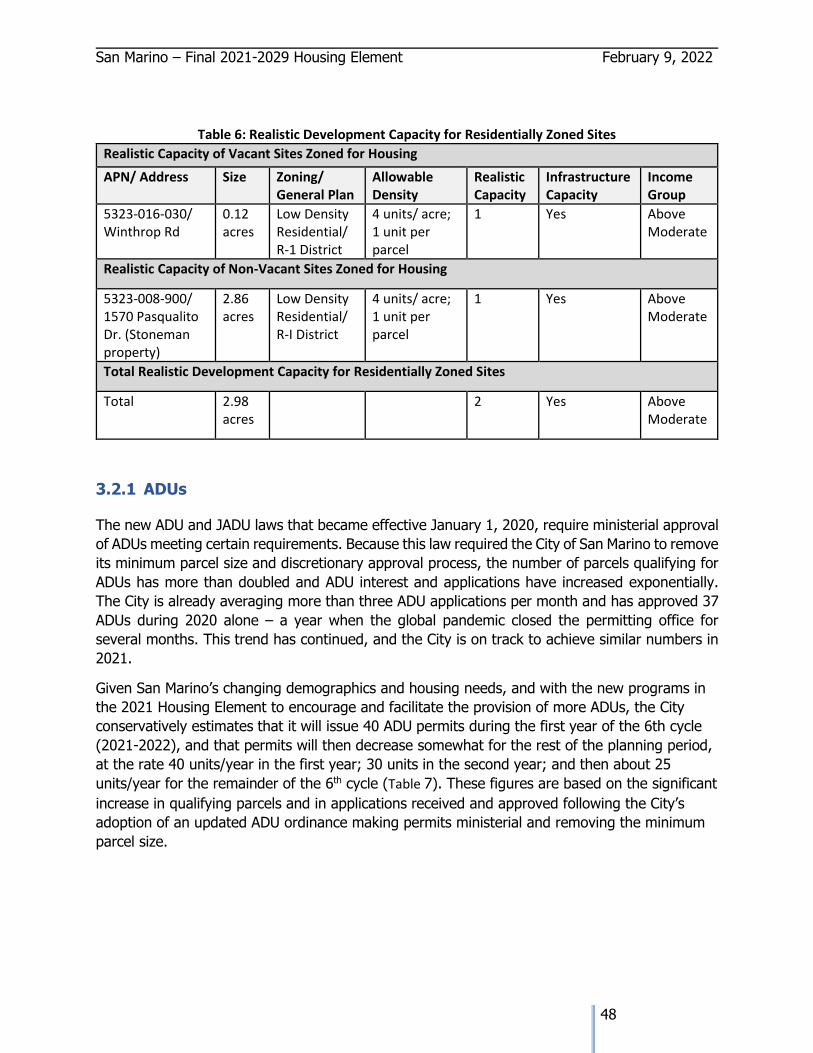
San Marino – Final 2021-2029 Housing Element February 9, 2022
48
Table 6: Realistic Development Capacity for Residentially Zoned Sites
Realistic Capacity of Vacant Sites Zoned for Housing
APN/ Address Size Zoning/ General Plan
Allowable Density
Realistic Capacity
Infrastructure Capacity
Income Group
5323-016-030/ Winthrop Rd
0.12 acres
Low Density Residential/ R-1 District
4 units/ acre; 1 unit per parcel
1 Yes Above Moderate
Realistic Capacity of Non-Vacant Sites Zoned for Housing
5323-008-900/ 1570 Pasqualito Dr. (Stoneman property)
2.86 acres
Low Density Residential/ R-I District
4 units/ acre; 1 unit per parcel
1 Yes Above Moderate
Total Realistic Development Capacity for Residentially Zoned Sites
Total 2.98 acres
2 Yes Above Moderate
3.2.1 ADUs
The new ADU and JADU laws that became effective January 1, 2020, require ministerial approval
of ADUs meeting certain requirements. Because this law required the City of San Marino to remove
its minimum parcel size and discretionary approval process, the number of parcels qualifying for
ADUs has more than doubled and ADU interest and applications have increased exponentially.
The City is already averaging more than three ADU applications per month and has approved 37
ADUs during 2020 alone – a year when the global pandemic closed the permitting office for
several months. This trend has continued, and the City is on track to achieve similar numbers in
2021.
Given San Marino’s changing demographics and housing needs, and with the new programs in
the 2021 Housing Element to encourage and facilitate the provision of more ADUs, the City
conservatively estimates that it will issue 40 ADU permits during the first year of the 6th cycle
(2021-2022), and that permits will then decrease somewhat for the rest of the planning period,
at the rate 40 units/year in the first year; 30 units in the second year; and then about 25
units/year for the remainder of the 6th cycle (Table 7). These figures are based on the significant
increase in qualifying parcels and in applications received and approved following the City’s
adoption of an updated ADU ordinance making permits ministerial and removing the minimum
parcel size.
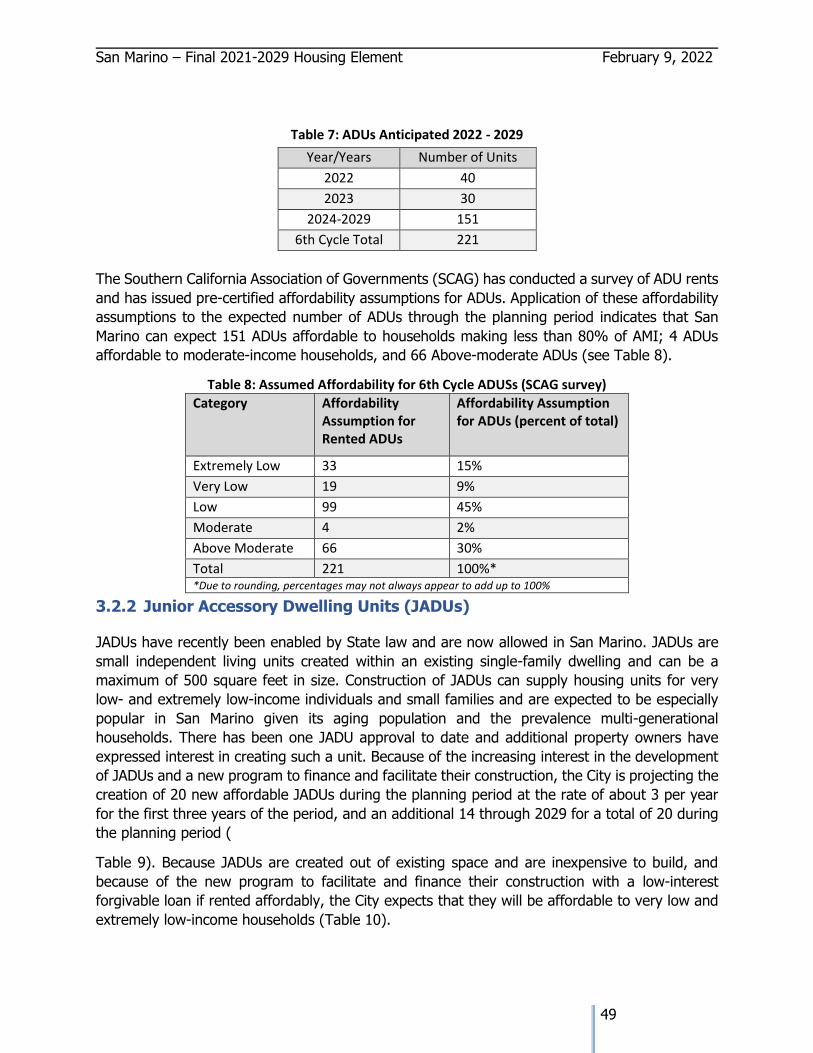
San Marino – Final 2021-2029 Housing Element February 9, 2022
49
Table 7: ADUs Anticipated 2022 - 2029
Year/Years Number of Units
2022 40
2023 30
2024-2029 151
6th Cycle Total 221
The Southern California Association of Governments (SCAG) has conducted a survey of ADU rents
and has issued pre-certified affordability assumptions for ADUs. Application of these affordability
assumptions to the expected number of ADUs through the planning period indicates that San
Marino can expect 151 ADUs affordable to households making less than 80% of AMI; 4 ADUs
affordable to moderate-income households, and 66 Above-moderate ADUs (see Table 8).
Table 8: Assumed Affordability for 6th Cycle ADUSs (SCAG survey)
Category Affordability Assumption for Rented ADUs
Affordability Assumption for ADUs (percent of total)
Extremely Low 33 15%
Very Low 19 9%
Low 99 45%
Moderate 4 2%
Above Moderate 66 30%
Total 221 100%* *Due to rounding, percentages may not always appear to add up to 100%
3.2.2 Junior Accessory Dwelling Units (JADUs)
JADUs have recently been enabled by State law and are now allowed in San Marino. JADUs are
small independent living units created within an existing single-family dwelling and can be a
maximum of 500 square feet in size. Construction of JADUs can supply housing units for very
low- and extremely low-income individuals and small families and are expected to be especially
popular in San Marino given its aging population and the prevalence multi-generational
households. There has been one JADU approval to date and additional property owners have
expressed interest in creating such a unit. Because of the increasing interest in the development
of JADUs and a new program to finance and facilitate their construction, the City is projecting the
creation of 20 new affordable JADUs during the planning period at the rate of about 3 per year
for the first three years of the period, and an additional 14 through 2029 for a total of 20 during
the planning period (
Table 9). Because JADUs are created out of existing space and are inexpensive to build, and
because of the new program to facilitate and finance their construction with a low-interest
forgivable loan if rented affordably, the City expects that they will be affordable to very low and
extremely low-income households (Table 10).
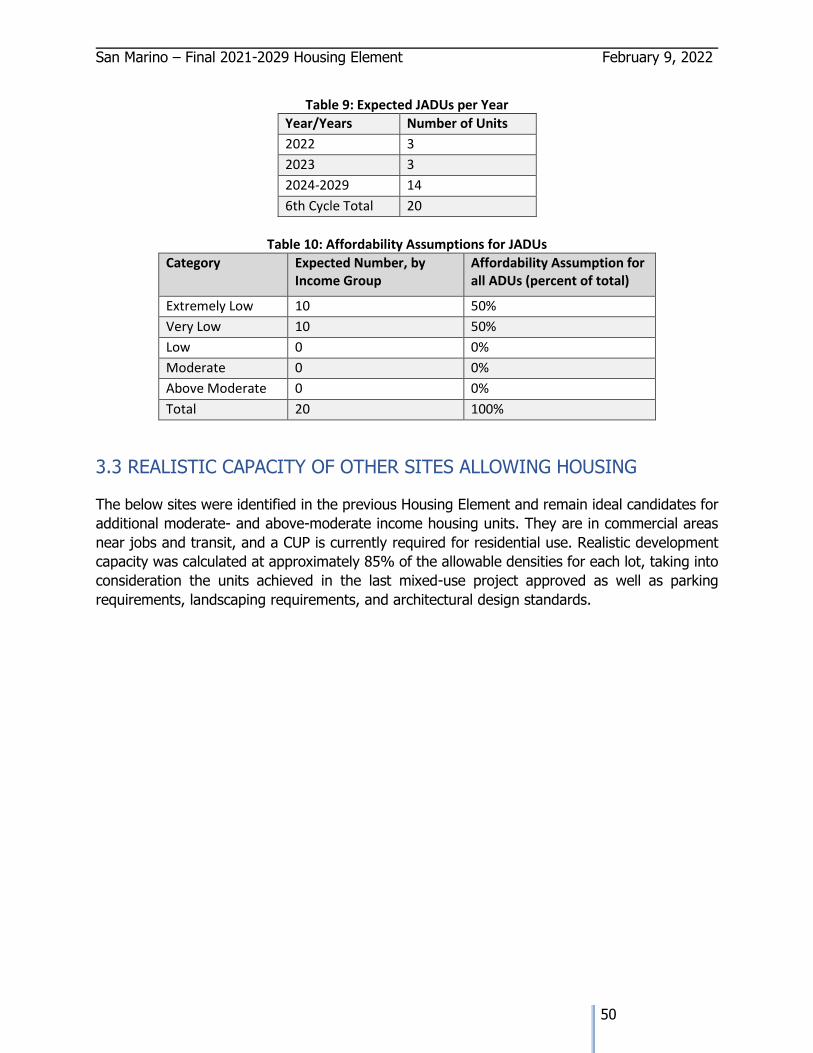
San Marino – Final 2021-2029 Housing Element February 9, 2022
50
Table 9: Expected JADUs per Year
Year/Years Number of Units
2022 3
2023 3
2024-2029 14
6th Cycle Total 20
Table 10: Affordability Assumptions for JADUs
Category Expected Number, by Income Group
Affordability Assumption for all ADUs (percent of total)
Extremely Low 10 50%
Very Low 10 50%
Low 0 0%
Moderate 0 0%
Above Moderate 0 0%
Total 20 100%
3.3 REALISTIC CAPACITY OF OTHER SITES ALLOWING HOUSING
The below sites were identified in the previous Housing Element and remain ideal candidates for
additional moderate- and above-moderate income housing units. They are in commercial areas
near jobs and transit, and a CUP is currently required for residential use. Realistic development
capacity was calculated at approximately 85% of the allowable densities for each lot, taking into
consideration the units achieved in the last mixed-use project approved as well as parking
requirements, landscaping requirements, and architectural design standards.
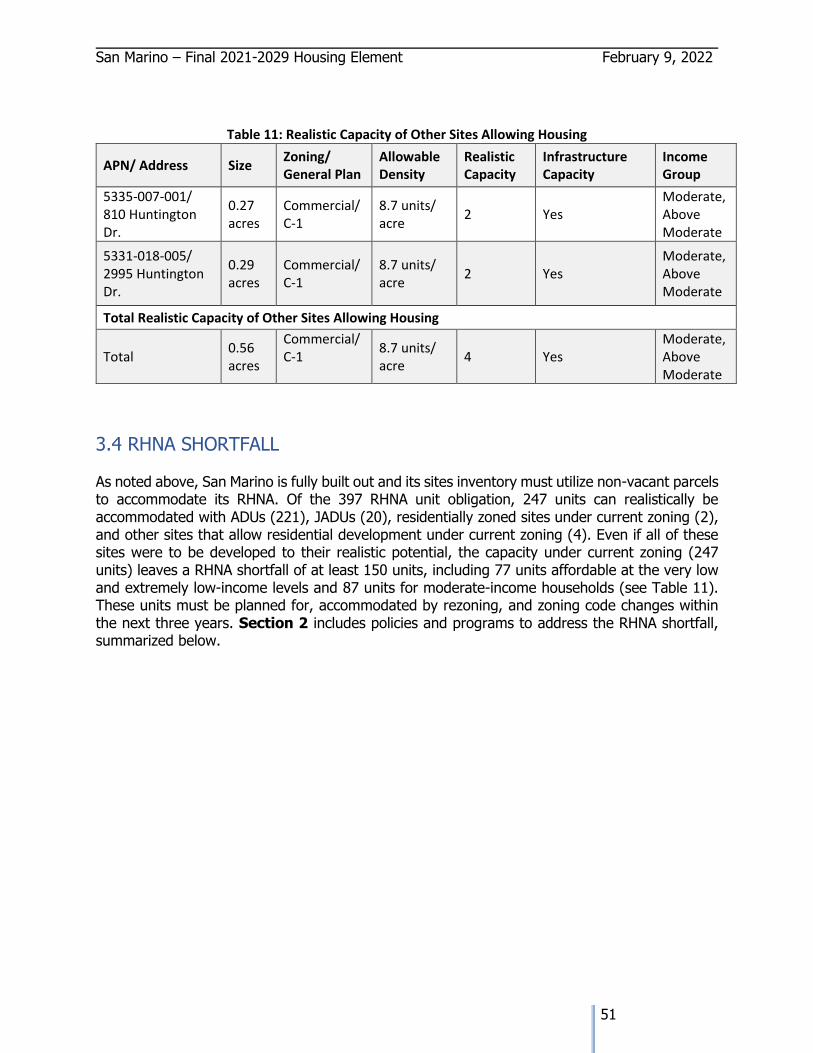
San Marino – Final 2021-2029 Housing Element February 9, 2022
51
Table 11: Realistic Capacity of Other Sites Allowing Housing
APN/ Address Size Zoning/ General Plan
Allowable Density
Realistic Capacity
Infrastructure Capacity
Income Group
5335-007-001/ 810 Huntington Dr.
0.27 acres
Commercial/ C-1
8.7 units/ acre
2 Yes Moderate, Above Moderate
5331-018-005/ 2995 Huntington Dr.
0.29 acres
Commercial/ C-1
8.7 units/ acre
2 Yes Moderate, Above Moderate
Total Realistic Capacity of Other Sites Allowing Housing
Total 0.56 acres
Commercial/ C-1
8.7 units/ acre
4 Yes Moderate, Above Moderate
3.4 RHNA SHORTFALL
As noted above, San Marino is fully built out and its sites inventory must utilize non-vacant parcels to accommodate its RHNA. Of the 397 RHNA unit obligation, 247 units can realistically be accommodated with ADUs (221), JADUs (20), residentially zoned sites under current zoning (2), and other sites that allow residential development under current zoning (4). Even if all of these sites were to be developed to their realistic potential, the capacity under current zoning (247 units) leaves a RHNA shortfall of at least 150 units, including 77 units affordable at the very low and extremely low-income levels and 87 units for moderate-income households (see Table 11). These units must be planned for, accommodated by rezoning, and zoning code changes within the next three years. Section 2 includes policies and programs to address the RHNA shortfall, summarized below.
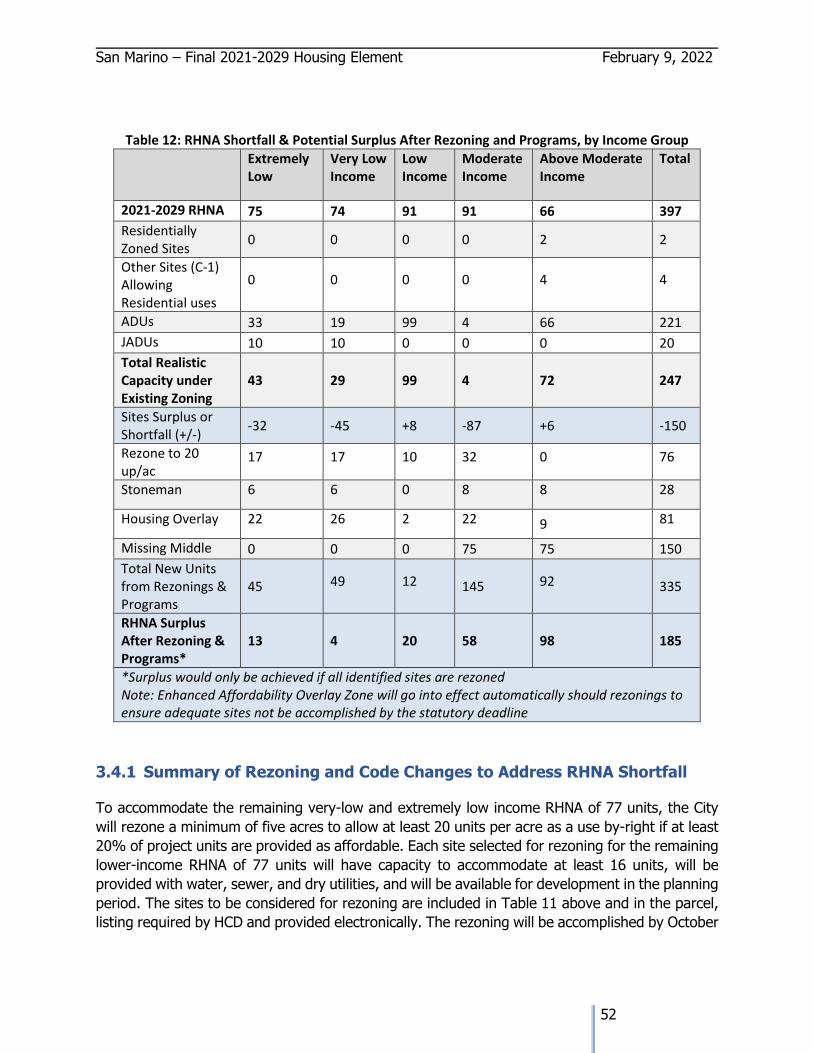
San Marino – Final 2021-2029 Housing Element February 9, 2022
52
Table 12: RHNA Shortfall & Potential Surplus After Rezoning and Programs, by Income Group
Extremely Low
Very Low Income
Low Income
Moderate Income
Above Moderate Income
Total
2021-2029 RHNA 75 74 91 91 66 397
Residentially Zoned Sites
0 0 0 0 2 2
Other Sites (C-1) Allowing Residential uses
0 0 0 0 4 4
ADUs 33 19 99 4 66 221
JADUs 10 10 0 0 0 20
Total Realistic Capacity under Existing Zoning
43 29 99 4 72 247
Sites Surplus or Shortfall (+/-)
-32 -45 +8 -87 +6 -150
Rezone to 20 up/ac
17 17 10 32 0 76
Stoneman 6 6 0 8 8 28
Housing Overlay 22 26 2 22 9 81
Missing Middle 0 0 0 75 75 150
Total New Units from Rezonings & Programs
45 49 12 145 92 335
RHNA Surplus After Rezoning & Programs*
13 4 20 58 98 185
*Surplus would only be achieved if all identified sites are rezoned Note: Enhanced Affordability Overlay Zone will go into effect automatically should rezonings to ensure adequate sites not be accomplished by the statutory deadline
3.4.1 Summary of Rezoning and Code Changes to Address RHNA Shortfall
To accommodate the remaining very-low and extremely low income RHNA of 77 units, the City
will rezone a minimum of five acres to allow at least 20 units per acre as a use by-right if at least
20% of project units are provided as affordable. Each site selected for rezoning for the remaining
lower-income RHNA of 77 units will have capacity to accommodate at least 16 units, will be
provided with water, sewer, and dry utilities, and will be available for development in the planning
period. The sites to be considered for rezoning are included in Table 11 above and in the parcel,
listing required by HCD and provided electronically. The rezoning will be accomplished by October
San Marino – Final 2021-2029 Housing Element February 9, 2022
53
15, 2024. Should the rezoning not be accomplished within the three-year period, the Enhanced
Affordability Overlay (see Program 1.12) will automatically go into effect.
To accommodate the remaining moderate-income RHNA of 87 units, the City will adopt a program
allowing duplexes and triplexes within existing single-family homes in the single-family
neighborhoods near jobs and transit, where those neighborhoods do not fall within a historic
district. Adoption of the program to accommodate moderate-income units will be accomplished
by October 15, 2024.
The rezoning and code changes to be considered are summarized below.
Rezonings:
• Rezoning 2.03 acres at 415 & 475 Huntington to Multifamily, 20 units per acre (34 units
realistic capacity. Realistic capacities assume development at 75% of allowed density);
• Rezoning and subdivision of the City-owned Stoneman property into two parcels, with
one 1.2-acre parcel housing the historic Stoneman School building and associated
parking; and one parcel of 1.66 acres containing a vacant, non-historic structure and
parking area. The 1.66-acre parcel would be made available to an affordable housing
developer in compliance with the Surplus Land Act; if the City does not surplus the
property, it would make the property available to a non-profit developer under a long-
term lease specifying the minimum levels of affordability (28 units realistic capacity);
• Rezoning to apply the Housing Overlay (16-24 units per acre) to multiple sites meeting location criteria for proximity to transit and jobs. Sites to be considered include the 8-acre Southwestern Academy, a 1-acre portion of the Huntington Library site, two sites on church properties, and two sites of over one acre each along Huntington Drive (total of at least 81 units realistic capacity).
Zoning Code Changes to Increase Allowable Densities & By-Right Uses
• Zoning Code change to adopt the Housing Overlay zone;
• Zoning Code changes to include multifamily zoning, and to include objective design &
development standards for by-right multi-family and live-work projects;
• Zoning Code change to allow multi-family and potentially live-work developments by-
right if at least 20% are affordable, subject to objective design & development
standards; and
• Zoning Code change to allow “missing middle” housing in single-family neighborhoods
that are near jobs and transit but that are not within the City-designated very high
wildfire hazard area or City-designated historic areas (200 units realistic capacity); and
• Zoning Code change to adopt the Enhanced Affordability Overlay zone to go into effect
automatically if the City fails to zone adequate sites for low-income households by
October 15, 2024.
Additional Programs are included to facilitate and encourage the provision and ADUs and
JADUs, two forms of housing that will best assist the City to meet its identified housing needs
for aging and disabled households. In order to address No Net Loss requirements, the City will
San Marino – Final 2021-2029 Housing Element February 9, 2022
54
maintain an administrative list of appropriately zoned parcels which can be added to the
inventory list during the annual APR review if needed to maintain an adequate supply of
appropriately zoned land throughout the planning period.
3.5 PROGRAMS & REZONING TO ENSURE ADEQUATE SITES
In compliance with Government Code §65583 (d), the City of San Marino will pursue the rezoning
of sites to meet the RHNA shortfall. To comply with the “No Net Loss” law and to ensure that
sufficient sites are maintained to accommodate the remaining RHNA throughout the planning
period, the City will adopt Programs and will strive to identify and rezone enough sites to
accommodate 120% of its RHNA shortfall. Rezoned sites will allow qualified developments by-
right if at least 20% of units are provided as affordable; a Use Permit will be required for above-
moderate projects. All new multi-family and live-work projects will be subject to objective design
and development standards. The City is committed to identifying and rezoning adequate sites
within the first three years of the housing element period through a variety of rezoning programs
and other actions, as outlined below.
3.5.1 Rezoning to Default Density (Program 1.6)
The initial step is rezoning sites to meet the RHNA is to identify and rezone appropriate sites at a
density of 20 units per acre, by-right if the project contains at least 20% affordable and subject
to use permit if no affordability is included. While the City will consider a variety of sites to be
rezoned to receive this high-density designation and will perform its environmental (CEQA)
analysis after all sites have been identified, the sites in Table 13 below are included as having
realistic redevelopment potential because of interest previously expressed by developers in
building multi-family housing on these sites.
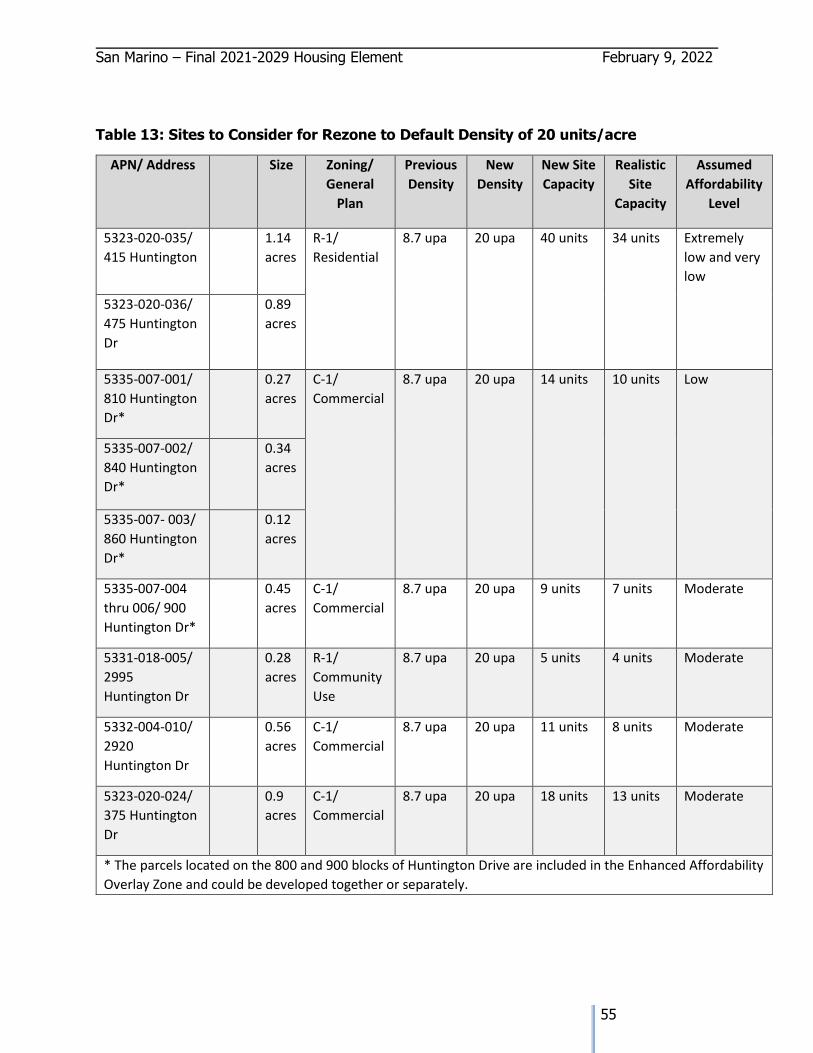
San Marino – Final 2021-2029 Housing Element February 9, 2022
55
Table 13: Sites to Consider for Rezone to Default Density of 20 units/acre
APN/ Address Size Zoning/
General
Plan
Previous
Density
New
Density
New Site
Capacity
Realistic
Site
Capacity
Assumed
Affordability
Level
5323-020-035/
415 Huntington
1.14
acres
R-1/
Residential
8.7 upa 20 upa 40 units 34 units Extremely
low and very
low
5323-020-036/
475 Huntington
Dr
0.89
acres
5335-007-001/
810 Huntington
Dr*
0.27
acres
C-1/
Commercial
8.7 upa 20 upa 14 units 10 units Low
5335-007-002/
840 Huntington
Dr*
0.34
acres
5335-007- 003/
860 Huntington
Dr*
0.12
acres
5335-007-004
thru 006/ 900
Huntington Dr*
0.45
acres
C-1/
Commercial
8.7 upa 20 upa 9 units 7 units Moderate
5331-018-005/
2995
Huntington Dr
0.28
acres
R-1/
Community
Use
8.7 upa 20 upa 5 units 4 units Moderate
5332-004-010/
2920
Huntington Dr
0.56
acres
C-1/
Commercial
8.7 upa 20 upa 11 units 8 units Moderate
5323-020-024/
375 Huntington
Dr
0.9
acres
C-1/
Commercial
8.7 upa 20 upa 18 units 13 units Moderate
* The parcels located on the 800 and 900 blocks of Huntington Drive are included in the Enhanced Affordability
Overlay Zone and could be developed together or separately.
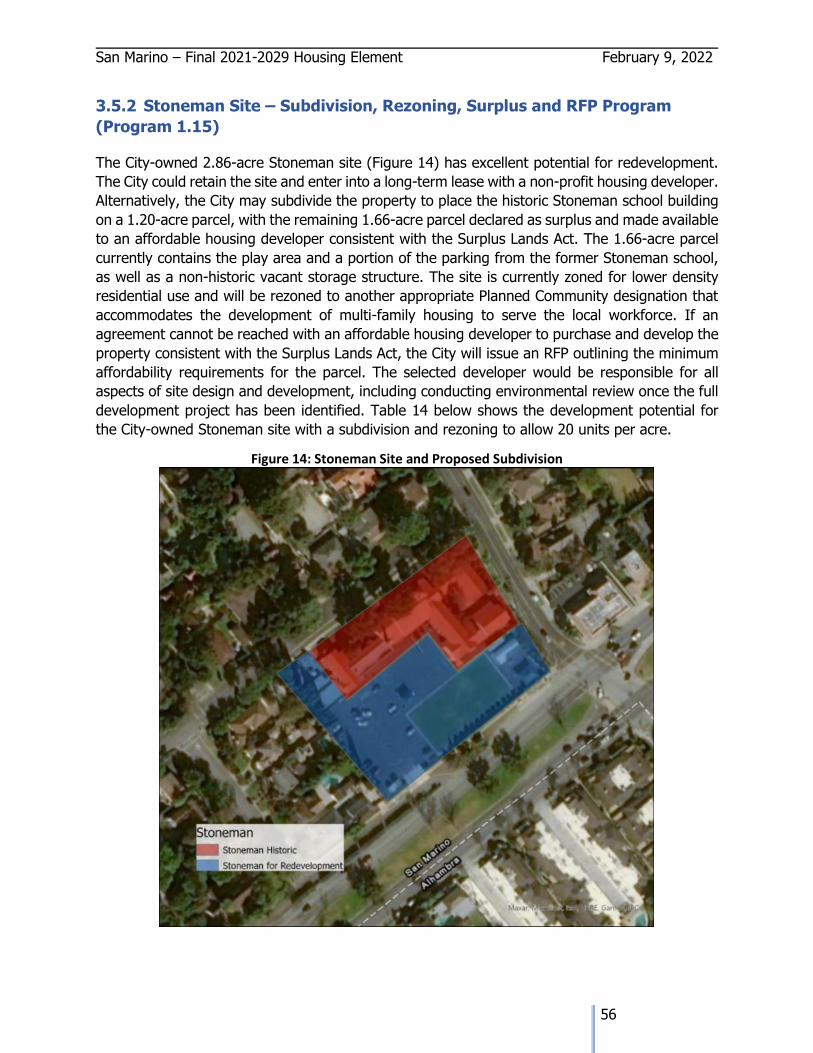
San Marino – Final 2021-2029 Housing Element February 9, 2022
56
3.5.2 Stoneman Site – Subdivision, Rezoning, Surplus and RFP Program
(Program 1.15)
The City-owned 2.86-acre Stoneman site (Figure 14) has excellent potential for redevelopment.
The City could retain the site and enter into a long-term lease with a non-profit housing developer.
Alternatively, the City may subdivide the property to place the historic Stoneman school building
on a 1.20-acre parcel, with the remaining 1.66-acre parcel declared as surplus and made available
to an affordable housing developer consistent with the Surplus Lands Act. The 1.66-acre parcel
currently contains the play area and a portion of the parking from the former Stoneman school,
as well as a non-historic vacant storage structure. The site is currently zoned for lower density
residential use and will be rezoned to another appropriate Planned Community designation that
accommodates the development of multi-family housing to serve the local workforce. If an
agreement cannot be reached with an affordable housing developer to purchase and develop the
property consistent with the Surplus Lands Act, the City will issue an RFP outlining the minimum
affordability requirements for the parcel. The selected developer would be responsible for all
aspects of site design and development, including conducting environmental review once the full
development project has been identified. Table 14 below shows the development potential for
the City-owned Stoneman site with a subdivision and rezoning to allow 20 units per acre.
Figure 14: Stoneman Site and Proposed Subdivision
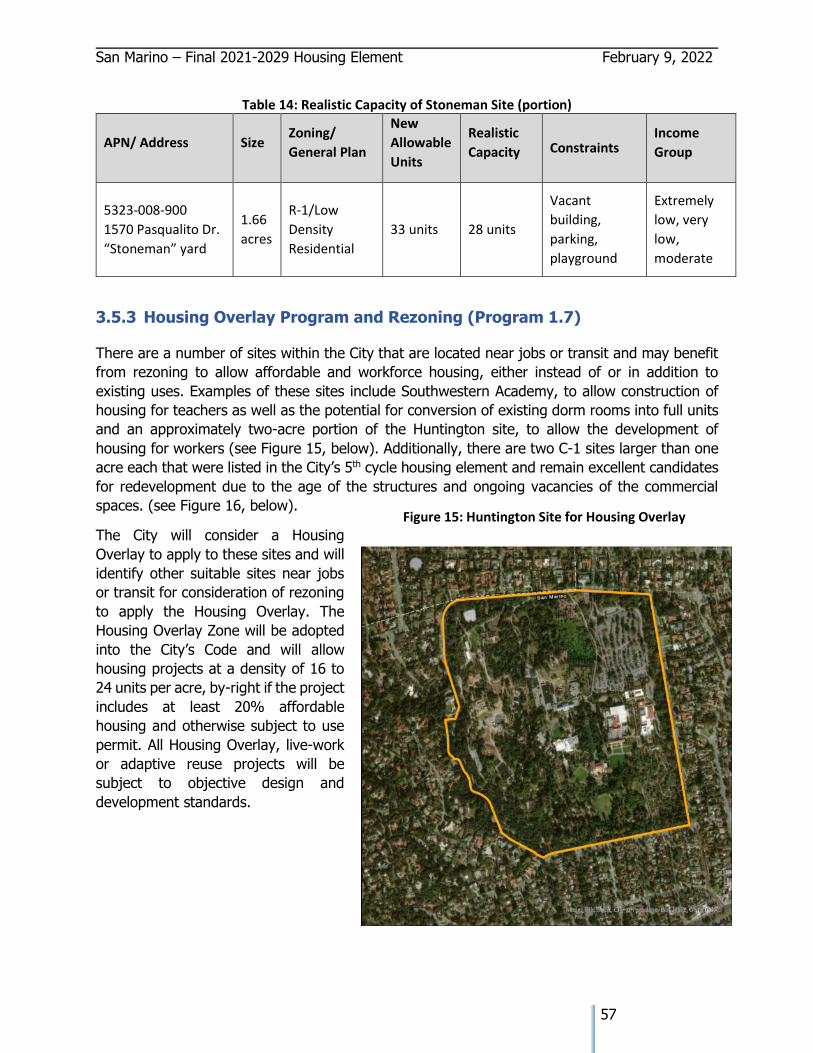
San Marino – Final 2021-2029 Housing Element February 9, 2022
57
Table 14: Realistic Capacity of Stoneman Site (portion)
APN/ Address Size Zoning/
General Plan
New
Allowable
Units
Realistic
Capacity Constraints Income
Group
5323-008-900
1570 Pasqualito Dr.
“Stoneman” yard
1.66
acres
R-1/Low
Density
Residential
33 units 28 units
Vacant
building,
parking,
playground
Extremely
low, very
low,
moderate
3.5.3 Housing Overlay Program and Rezoning (Program 1.7)
There are a number of sites within the City that are located near jobs or transit and may benefit
from rezoning to allow affordable and workforce housing, either instead of or in addition to
existing uses. Examples of these sites include Southwestern Academy, to allow construction of
housing for teachers as well as the potential for conversion of existing dorm rooms into full units
and an approximately two-acre portion of the Huntington site, to allow the development of
housing for workers (see Figure 15, below). Additionally, there are two C-1 sites larger than one
acre each that were listed in the City’s 5th cycle housing element and remain excellent candidates
for redevelopment due to the age of the structures and ongoing vacancies of the commercial
spaces. (see Figure 16, below).
The City will consider a Housing
Overlay to apply to these sites and will
identify other suitable sites near jobs
or transit for consideration of rezoning
to apply the Housing Overlay. The
Housing Overlay Zone will be adopted
into the City’s Code and will allow
housing projects at a density of 16 to
24 units per acre, by-right if the project
includes at least 20% affordable
housing and otherwise subject to use
permit. All Housing Overlay, live-work
or adaptive reuse projects will be
subject to objective design and
development standards.
Figure 15: Huntington Site for Housing Overlay
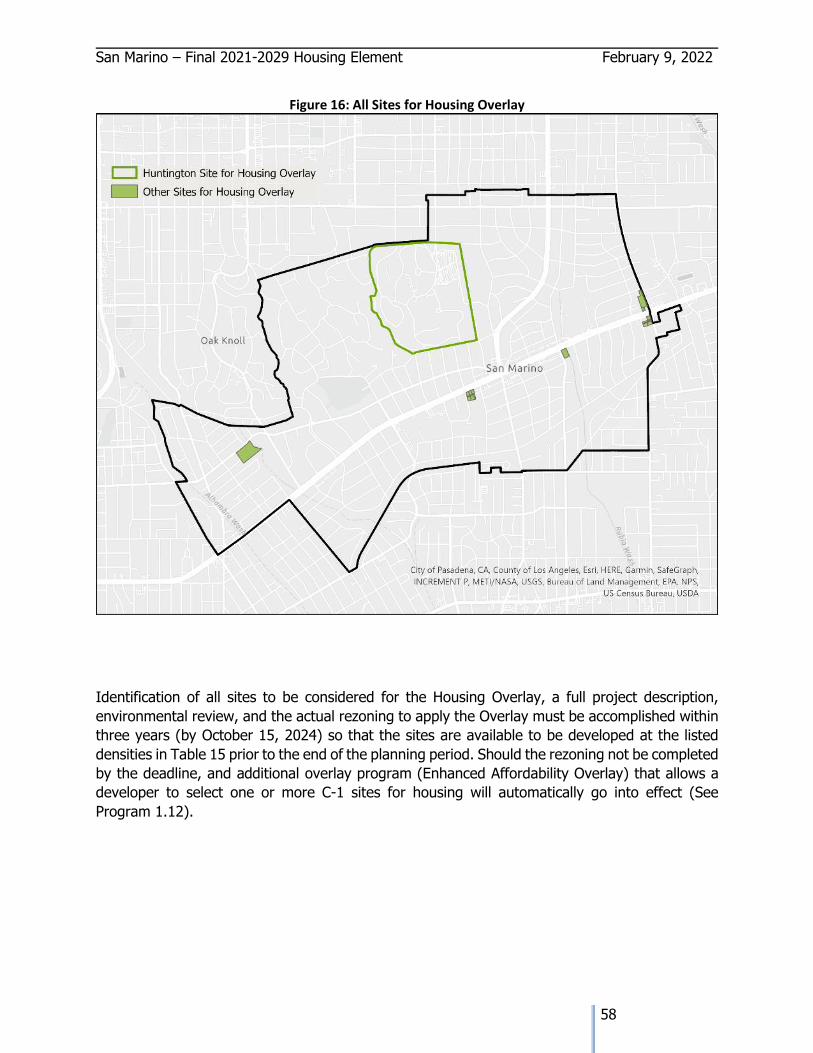
San Marino – Final 2021-2029 Housing Element February 9, 2022
58
Figure 16: All Sites for Housing Overlay
Identification of all sites to be considered for the Housing Overlay, a full project description,
environmental review, and the actual rezoning to apply the Overlay must be accomplished within
three years (by October 15, 2024) so that the sites are available to be developed at the listed
densities in Table 15 prior to the end of the planning period. Should the rezoning not be completed
by the deadline, and additional overlay program (Enhanced Affordability Overlay) that allows a
developer to select one or more C-1 sites for housing will automatically go into effect (See
Program 1.12).
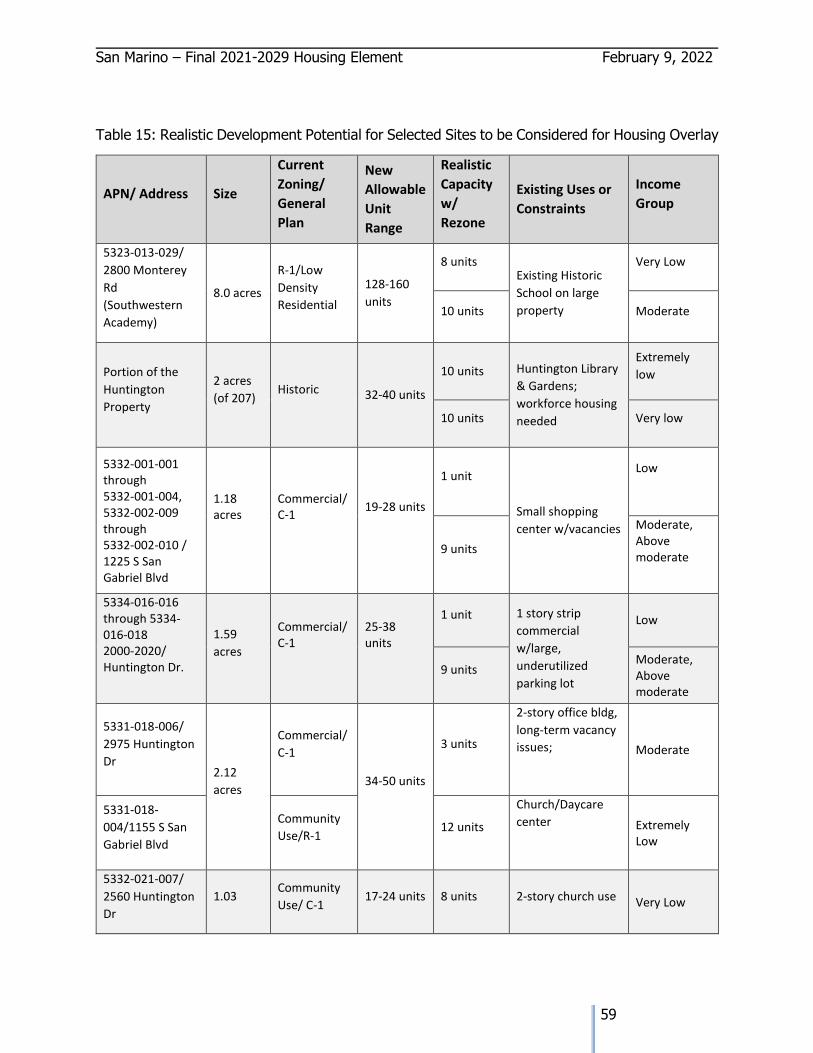
San Marino – Final 2021-2029 Housing Element February 9, 2022
59
Table 15: Realistic Development Potential for Selected Sites to be Considered for Housing Overlay
APN/ Address Size
Current
Zoning/
General
Plan
New
Allowable
Unit
Range
Realistic
Capacity
w/
Rezone
Existing Uses or
Constraints
Income
Group
5323-013-029/
2800 Monterey
Rd
(Southwestern
Academy)
8.0 acres
R-1/Low
Density
Residential
128-160
units
8 units Existing Historic
School on large
property
Very Low
10 units Moderate
Portion of the
Huntington
Property
2 acres
(of 207) Historic 32-40 units
10 units Huntington Library
& Gardens;
workforce housing
needed
Extremely
low
10 units Very low
5332-001-001 through 5332-001-004, 5332-002-009 through 5332-002-010 / 1225 S San Gabriel Blvd
1.18 acres
Commercial/ C-1
19-28 units
1 unit
Small shopping
center w/vacancies
Low
9 units
Moderate, Above moderate
5334-016-016 through 5334-016-018 2000-2020/ Huntington Dr.
1.59
acres
Commercial/ C-1
25-38 units
1 unit 1 story strip
commercial
w/large,
underutilized
parking lot
Low
9 units Moderate, Above moderate
5331-018-006/
2975 Huntington
Dr 2.12
acres
Commercial/
C-1
34-50 units
3 units
2-story office bldg,
long-term vacancy
issues;
Moderate
5331-018-
004/1155 S San
Gabriel Blvd
Community
Use/R-1 12 units
Church/Daycare
center
Extremely Low
5332-021-007/
2560 Huntington
Dr
1.03 Community
Use/ C-1 17-24 units 8 units 2-story church use Very Low
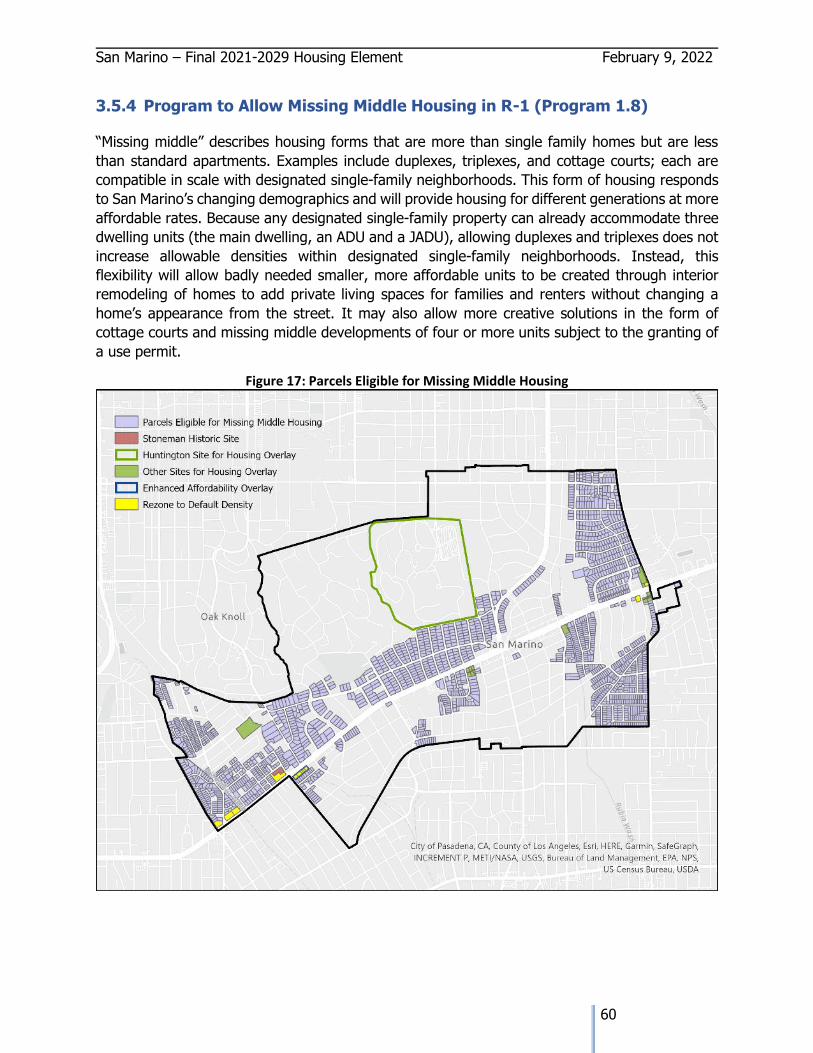
San Marino – Final 2021-2029 Housing Element February 9, 2022
60
3.5.4 Program to Allow Missing Middle Housing in R-1 (Program 1.8)
“Missing middle” describes housing forms that are more than single family homes but are less
than standard apartments. Examples include duplexes, triplexes, and cottage courts; each are
compatible in scale with designated single-family neighborhoods. This form of housing responds
to San Marino’s changing demographics and will provide housing for different generations at more
affordable rates. Because any designated single-family property can already accommodate three
dwelling units (the main dwelling, an ADU and a JADU), allowing duplexes and triplexes does not
increase allowable densities within designated single-family neighborhoods. Instead, this
flexibility will allow badly needed smaller, more affordable units to be created through interior
remodeling of homes to add private living spaces for families and renters without changing a
home’s appearance from the street. It may also allow more creative solutions in the form of
cottage courts and missing middle developments of four or more units subject to the granting of
a use permit.
Figure 17: Parcels Eligible for Missing Middle Housing
San Marino – Final 2021-2029 Housing Element February 9, 2022
61
The City will make Zoning Code change to allow “missing middle” housing to expand San Marino’s
housing stock and accommodate those seeking housing between single-family homes and higher-
density apartment buildings. Parcels eligible for missing middle housing are those R-1 parcels that
are located within 2000 feet of transit stops and jobs, to encourage walking to daily needs and
decreasing the need to drive (see Figure 17, above). Parcels within a City-designated historic
district or area are not eligible for this program. Using these parameters, there are a total of just
under 1,800 single-family parcels that could qualify for missing middle housing. Assuming the
development of duplexes and triplexes only, the changes to allow denser development in the R-
1 zone have the potential to increase inventory by over 2,000 new infill dwelling units. However,
because the Program is new and not yet proven, the City will anticipate the development of only
about 7.5% of the total possible units for a total of 150 potential units under this program,
including 75 units affordable to moderate-income households and 75 units affordable to above-
moderate income households.
3.5.5 Program to Adopt Housing Overlay into Zoning Code (Program 1.7)
As outlined in 3.5.3 above, before the Housing Overlay Zone can be applied to appropriate
properties it must first be adopted into the City’s Zoning Code. The Housing Overlay Zone will
allow a variety of housing types, tenures, and densities to address the City’s identified housing
needs, including housing for seniors; the local workforce, including teachers, small households,
and first-time homebuyers. Allowable densities would range from 16 to 24 units per acre,
depending on housing type; multi-family rental housing would be allowed at a density of at least
20 units per acre and projects providing at least 20% of units as affordable would be eligible for
both a density bonus and for by-right processing. The Housing Overlay may be placed over any
base zoning designation but only to sites located within 2000 feet of jobs, transit, or both.
3.5.6 Programs to Promote & Encourage ADUs (Programs 1.1, 1.3, 1.4)
Through aggressive ADU facilitation and promotion, the City can expect to develop 221 Accessory
Dwelling Units (ADUs) over the 8-year planning period, including 40 units in the first year, 30 in
the second year, and 25 per year for the balance of the planning period. In accordance with the
Southern California Association of Governments (SCAG) survey of affordability levels of ADUs, the
City can expect 33 extremely low income, 19 very low income, and 99 low-income units to be
built with the adoption of aggressive programs designed to encourage and facilitate construction
of ADUs. These programs are detailed in Section 2.
3.5.7 Program of Low-interest or Forgivable Loans for JADUs (Program 1.2)
JADUs are the least expensive method to provide housing units for lower income households,
including young adults starting out or seniors who wish to live near their families but in an
independent living space. Because they are carved out of existing space and do not involve new
construction, they can be accommodated in existing neighborhoods without impacting
architectural and historic character, two qualities that the San Marino community feels strongly
about. They are the least expensive way to produce additional housing units (as low as $20,000
per unit) and can affirmatively further fair housing because they open up high-income
neighborhoods to a very low-income source of housing.
San Marino – Final 2021-2029 Housing Element February 9, 2022
62
Demographic information and survey data indicate that a significant percentage of San Marino’s
elderly households are low income, despite owning their own homes. A local low-interest or
forgivable loan program can assist lower-income homeowners in constructing these small units
in exchange for continued affordability. This would provide affordable units within San Marino’s
existing single-family neighborhoods. While a permanent source of funding for this program would
need to be identified, the City could establish a pilot with limited funding while additional sources
are explored.
3.5.8 With Rezoning, Housing Sites Adequate to Meet RHNA
The City is committed to providing adequate sites to meet its regional housing need, while also
addressing the City’s identified housing needs and affirmatively furthering fair housing. The City
will locate and consider a number of housing sites and will rezone appropriate sites before October
2024 to meet its RHNA shortfall, with enough remaining capacity to comply with No Net Loss
laws. The wide range of programs adopted or enhanced with the 2021 Housing Element Update
will assist the City in meeting its commitment by providing opportunities for all income levels,
ages, and abilities throughout San Marino’s high opportunity neighborhoods. With the adoption
of all of the programs in the 2021 Housing Element, any site in San Marino can be an affordable
housing site.
The realistic capacity of sites to be considered for rezoning and the Programs to be developed in
the 2021 Housing Element are provided in Table 15, below. Implementation of these programs
and rezonings would increase San Marino’s housing capacity by over 600 units, exceeding its
RHNA shortfall of 150 units and ensuring adequate sites to meet remaining RHNA needs
throughout the planning period.
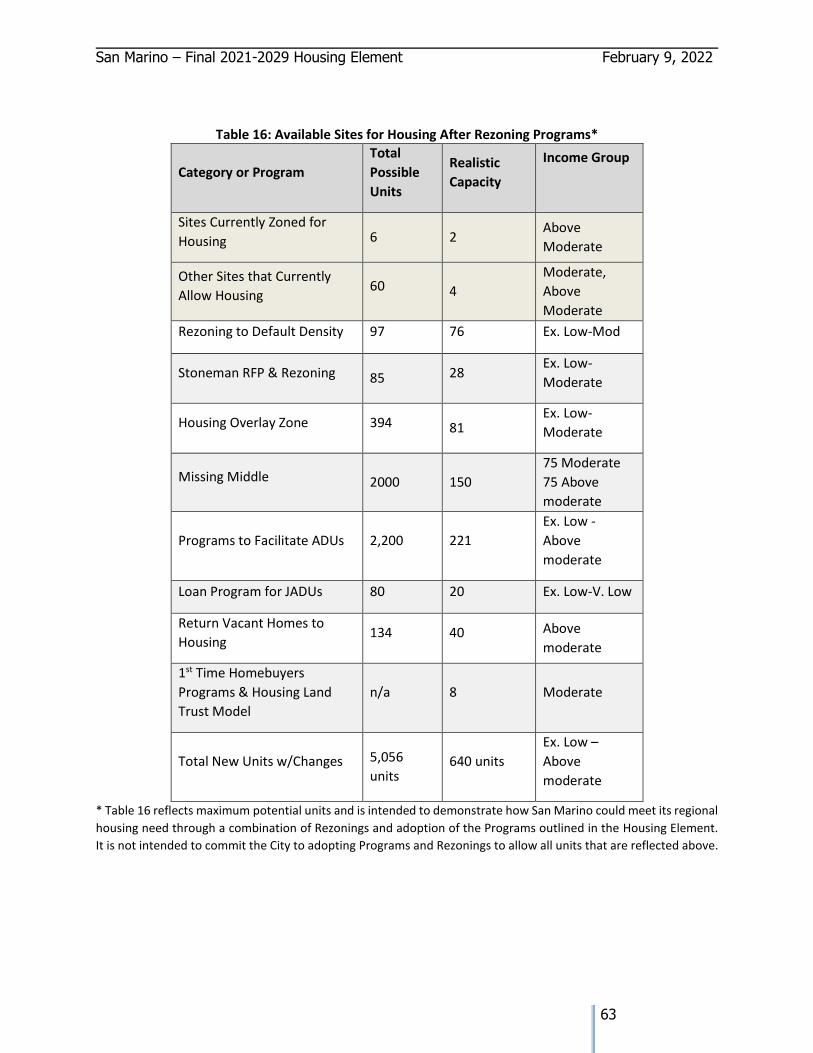
San Marino – Final 2021-2029 Housing Element February 9, 2022
63
Table 16: Available Sites for Housing After Rezoning Programs*
Category or Program
Total
Possible
Units
Realistic
Capacity
Income Group
Sites Currently Zoned for
Housing 6 2 Above
Moderate
Other Sites that Currently
Allow Housing 60 4
Moderate,
Above
Moderate
Rezoning to Default Density 97 76 Ex. Low-Mod
Stoneman RFP & Rezoning 85 28 Ex. Low-
Moderate
Housing Overlay Zone 394 81 Ex. Low-
Moderate
Missing Middle 2000 150
75 Moderate
75 Above
moderate
Programs to Facilitate ADUs 2,200 221
Ex. Low -
Above
moderate
Loan Program for JADUs 80 20 Ex. Low-V. Low
Return Vacant Homes to
Housing 134 40 Above
moderate
1st Time Homebuyers
Programs & Housing Land
Trust Model
n/a 8 Moderate
Total New Units w/Changes 5,056
units 640 units
Ex. Low –
Above
moderate
* Table 16 reflects maximum potential units and is intended to demonstrate how San Marino could meet its regional
housing need through a combination of Rezonings and adoption of the Programs outlined in the Housing Element.
It is not intended to commit the City to adopting Programs and Rezonings to allow all units that are reflected above.
San Marino – Final 2021-2029 Housing Element February 9, 2022
64
3.6 INFRASTRUCTURE
This subsection provides information about the availability of services to serve new housing and
examines any infrastructure limitations within the City. San Marino is entirely developed and is
surrounded by other incorporated communities with similar fully developed properties. As a
developed city, San Marino has multiple infrastructure services developed and maintained by
multiple agencies. Currently, the City’s infrastructure is in good condition and the agencies
providing services have indicated there are no foreseeable issues maintaining service to existing
housing or providing service to the additional housing anticipated in the 2021 Housing Element.
3.6.1 Water
The City of San Marino is served with water by California American Water and by sewer from the
Los Angeles County Sanitation District (District).
California American Water serves the City of San Marino with the “San Marino System” which also
serves portions of neighboring cities of Rosemead, Temple City, San Gabriel, El Monte, Pasadena,
and some unincorporated areas of Los Angeles County. The San Marino Water System is primarily
supplied by groundwater sources in the Main San Gabriel and Raymond Basins; In 2019, the
system supply consisted of 90 percent local well water and 10 percent purchased treated surface
water from the Metropolitan Water District of Southern California (Water District). Since both
basins have adjudicated groundwater allocations, additional supplies are purchased to meet
seasonal and annual demands. The sources for these additional supplies are the Sacramento
River Delta and the Colorado River. Drinking water provided by the Water District receives multiple
technological treatments including sedimentation, filtration, and disinfection. Groundwater
supplies are disinfected with chlorine and surface water supplies are treated with chloramines for
bacteriological quality in the distribution system. The District’s technological treatments and
practices are evaluated every five years by the State Water Resources Control Board Division of
Drinking Water (Water Board). The water sources for the California American Water - San Marino
System were assessed in 2003 to evaluate the pattern of pollutant sources and ensure proper
decontamination of the water to make it suitable for human consumption. Ongoing monitoring
and annual reporting are performed to ensure that tap water is safe to drink and compliant with
the U.S. Environmental Protection Agency and the Water Board regulations limiting the quantity
of contaminants in public water systems.
3.6.2 Sewer
The Sanitation District serves the City of San Marino through their Districts 15 and 16.
Conversations with District staff in early 2021 indicate that the District is confident in the ability
to serve the projected number of new residences of the City of San Marino. The District has
enough capacity and adequate budget to ensure regular monitoring and maintenance and the
ongoing provision of quality services to both residential and commercial properties in the City.
San Marino is currently utilizing only 25 to 30 percent of its sewer capacity.
San Marino – Final 2021-2029 Housing Element February 9, 2022
65
3.6.3 Other Utilities
San Marino is entirely developed and as such, connections for public utilities such as electricity,
gas, telephone, cable, and garbage collection are readily available for future development. The
streets are paved and receive regular maintenance by the Parks & Public Works Department. The
Department facilitates street sweeping, sidewalk maintenance, streetlight repair, enforcement of
the tree and landscape ordinance, coordinating trash and recycling materials collection, and is
the point of contact for water and sewage services.
3.7 ENVIRONMENTAL CONSIDERATIONS
Because San Marino is built out and has no special status species or habitat, environmental
considerations are not a constraint to the development of housing with the limited exceptions
summarized below and discussed in more detail in Section 4.
3.7.1 Seismic Hazards
San Marino is located within an area of high seismic activity due to the proximity of the Raymond
Hill fault. The greatest potential danger from seismic hazards is the collapse of older residential
units constructed from unreinforced masonry, and explosions of petroleum and fuel lines. The
City regulates the construction of new habitable structures within seismic hazard zones through
required site investigations, setbacks, and construction standards to comply with State law and
minimize risks from seismic events.
3.7.2 Flooding Hazards
While San Marino faces minimal risk from flood hazards, there are three limited areas that are
susceptible to short periods of localized flooding during periods of intense rainfall: Huntington
Boulevard near Old Mill Road; Lacy Park; and Huntington Boulevard near San Marino High School.
Because there is minimal risk and no history of repeatedly damaged structures due to flooding,
there are no additional conditions or requirements imposed on development in these areas that
would pose a constraint to development.
3.7.3 Fire Hazards
San Marino contains no State-recognize wildfire hazard zones. However, the City has identified
their own locally designated wildfire hazard zone in the Northwest area of the City with stricter
requirements, including construction standards and brush clearance, to minimize risk. Past fires
have damaged or destroyed structures due to combustible roofing material, wood construction,
and lack of defensible space. The City prohibits replacement or installation of new wood roofing
and enforces fire safety building practices found within the California Building Code (Source: San
Marino Local Hazard Mitigation Plan, 2019). Programs to increase densities are not applicable
within this area, except as required under State law.
San Marino – Final 2021-2029 Housing Element February 9, 2022
66
SECTION IV: TECHNICAL BACKGROUND REPORT
4.1 INTRODUCTION
The Technical Background Report (TBR) of the 2021 San Marino Housing Element includes
statutorily required data, an analysis of governmental and non-governmental constraints to the
provision of housing. As part of the new AB 686 requirements to Affirmatively Further Fair
Housing, the TBR also includes a brief history of San Marino’s growth and exclusively single-family
zoning practices, and an analysis of the economic and ethnic make-up of the City and its
neighborhoods. Section 1 of the Housing Element contains summary information and further
analysis where new policies or programs are needed to overcome past exclusionary land use
practices and to respond to changing demographics and housing needs.
4.2 PRE-CERTIFIED SCAG DATASET
The Southern California Association of Governments (SCAG) has compiled a housing needs data
package for each jurisdiction. These housing data packages have been pre-certified by the
California Department of Housing and Community Development (HCD) to meet statutory
requirements for the quantification of existing and projected housing needs including:
• Identification of population and employment trends;
• Household characteristics (i.e., existing households by tenure, existing extremely low-
income households, total, lower and extremely low-income households overpaying,
overcrowded households);
• Special needs (i.e., number of persons with disabilities, number of persons with
developmental disabilities, elderly households by tenure, large households by tenure and
female headed households); and
• Regional Housing Need Allocation (RHNA) by income group, including extremely low-
income households.
In order to meet all statutory requirements in Government Code §65583(a) (1 and 2) related to
quantification and analysis of existing housing needs, this Technical Background Report also
includes locally acquired information and data including but not limited to areas of economic and
ethnic segregation, special needs, local knowledge of the housing stock, local housing resources,
and an analysis of housing constraints. The San Marino 2020 Pre-Certified Local Housing Data
Packet includes the requisite data on farmworkers, persons experiencing homelessness,
substandard housing, and units at-risk of conversion to above-moderate uses in the jurisdiction.
The packet also includes some analysis of the data; further analysis is provided herein and
throughout the Housing Element (Source: Housing Needs Data Certification Letter from HCD).
The SCAG Housing Needs Dataset is included in Appendix A of this Section in its entire original
form. The remainder of this Technical Background Report contains other data related to local
housing programs and resources and housing constraints.
San Marino – Final 2021-2029 Housing Element February 9, 2022
67
4.3 LOCAL HOUSING PROGRAMS & RESOURCES
San Marino is served by the Los Angeles County Development Authority (LACDA), formerly known
as the Housing Authority of the County of Los Angeles. The LACDA was formed from a
consolidation of the Los Angeles Housing Authority, Community Development Department, and
the Redevelopment Agency. The LACDA provides resources for housing assistance, affordable
rental housing, first-time homebuyers, home improvements, community development,
construction management, economic development, and traffic services. The jurisdiction of the
LACDA includes all unincorporated areas of Los Angeles County and the 70 incorporated cities in
Los Angeles County that do not have their own public housing agencies. The City of San Marino
is within the jurisdiction of the LACDA.
4.3.1 Resources: Housing Assistance Programs
The following programs are primarily Federal- and State-run programs providing funding for
construction, rehabilitation, or rental assistance for very low-, low-, and moderate-income
households. This section describes programs that may be locally available and potentially
applicable within the City.
• The Section 8 Housing Choice Voucher (HCV Program) is the federal government’s
major program for assisting very low-income families, the elderly, and the disabled to
afford decent, safe, and sanitary housing in the private market. Participants may choose
any housing that meet the requirements of the program. The LACDA pays a housing
subsidy directly to the property owner, and the participant pays the difference between
the actual rent charged and the amount subsidized by the program. (Source: LACDA) The
availability of this program depends on LACDA funding, efforts, and priorities. San Marino
rental rates general exceed Fair Market Rents for the program and therefore are not
eligible properties.
• Home Investment Partnerships (HOME) are grants provided by the U.S. Department
of Housing and Urban Development (HUD) to fund a wide variety of projects that
implement local housing strategies and create affordable housing for low-income
households including building, buying, rehabilitating affordable housing, or providing
direct rental assistance (Source: HUD). San Marino’s existing housing stock and lack of
developable land hampers the City’s ability to compete for these funds.
• Section 203(k) funding provided by HUD facilitates the rehabilitation and repair of
single-family residential properties by ensuring homeowner loans for purchase or
refinancing of properties and can enable homebuyers to purchase homes that need
significant repairs. It can also be used for a variety of other improvements, including
conversion of properties up to a four-unit structure, enhance accessibility for a disabled
person, or elimination of health and safety hazards. Most homes in San Marino are not
eligible for this funding due to the well-maintained condition and high home values of the
housing stock (Source: HUD).
• Section 202 funding provided by HUD finances construction, rehabilitation, or
acquisition of structures for supportive housing for VLI elderly persons through interest-
San Marino – Final 2021-2029 Housing Element February 9, 2022
68
free capital advances and rental assistance funds. This funding is only available to private
nonprofit organizations and consumer cooperatives and is highly competitive.
• The Low-Income Housing Tax Credit (LIHTC) Program provides State and Local
agencies the equivalent of approximately $8 billion in annual budget authority to issues
tax credits for the acquisition, rehabilitation, or new construction of rental housing
targeted to lower-income households. The California Tax Credit Allocation Committee
(TCAC) competitively administers credits to projects based on priorities they set each year.
Interested developers may apply for a 9% tax credit (which is often competitive) or a 4%
tax credit. The developers who have been awarded the credits sell the credits to investors.
This creates cash equity which provides a significant portion of the funds that developers
need to build affordable housing. A 9% tax credit raises about 70% of the cost of a
development and a 4% credit raises about 30% of the cost of a development. Since the
debt needed to develop is lower, a project can offer more affordable rents while still being
a financially viable venture. Investors buy these credits as a tax benefit; tax credits are
subtracted directly from a taxpayer’s liability each year for 10 years Buildings eligible for
the LIHTC must either have 20% of units must rent-restricted and occupied by tenants
with incomes no higher than 50% of the Area Median Income (AMI) or 40% of units rent
restricted and occupied by tenants with incomes no higher than 60% of AMI.
The Department of Housing and Urban Development (HUD) designates Qualified Census
Tracts (QCTs) and Difficult Development Areas (DDAs) that have increased eligibility.
QCTs must have 50 percent of households with incomes below 60 percent of the AMI or
have a poverty rate of 25 percent or more. DDAs are areas with high land, construction,
and utility costs relative to the area median income. There are no QCTs in San Marino. All
of San Marino is in a DDA. San Marino is also within a ‘Highest Resource’ designation
which provides an eligibility bonus in applying for this funding; however, even with the
tax credit, affordable housing projects in a high-cost area can be very difficult to fund
because of the high cost of land. The ability to apply for this program depends on the
level of interest from developers, developable sites, constraints imposed by development
standards, and the level of competition in the region for LIHTC funding. (Sources:
California Tax Credit Allocation Committee, National Housing Law Project, U.S.
Department of Housing and Urban Development)
• Preservation Funding is not currently needed due to the absence of at-risk housing
units in the City.
• The California Self-Help Housing Program (CSHHP) is a state program that provides
technical assistance and funding for the training and supervision of low- and moderate-
income self-help homebuilders. Funding is provided through sponsor organizations, either
local government agencies or nonprofit corporations.
• The Section 811 Supportive Housing for Persons with Disabilities Program is
managed by HUD and provides funding through interest-free capital advances, operating
subsidies, and/or project rental assistance for eligible projects developing affordable
housing for persons with disabilities. This program is highly competitive and requires a
nonprofit housing sponsor.
San Marino – Final 2021-2029 Housing Element February 9, 2022
69
• The Federal Home Loan Bank Act establishes an Affordable Housing Program (AHP)
within the Federal Housing Finance Agency. AHP funds are granted to financial institutions
on behalf of a housing sponsor and may be used to finance the purchase, construction,
or rehabilitation of owner-occupied housing for low- or moderate-income households and
the purchase, construction, or rehabilitation of rental housing where at least 20 percent
of the units are affordable for and occupied by very low-income households. Local
development costs may deter local developers from applying for this program.
4.3.2 Resources: Homeless Population
Individuals are considered homeless when they lack fixed and regular nighttime residences.
Homeless individuals may be unsheltered, including those living in tents, cars, makeshift shelters,
or on the street, or sheltered, including those in emergency shelters or transitional shelters. By
the most recent count, the City of San Marino has no homeless residents. Over the past four
years, there has occasionally been up to one homeless resident in the City. (Source: Los Angeles
Homeless Services Authority, 2020)
4.3.3 Resources: Homeless Shelters
Homeless shelters provide temporary shelter for the homeless population. Although the City of
San Marino has little to no homeless population, the City does allow emergency shelters by-right
within its commercial zone. There are currently no homeless shelters within the San Marino City
limits; however, there are shelters available in nearby Pasadena. The closest homeless shelter to
San Marino is Union Station Homeless Services, located at 412 S. Raymond Avenue in Pasadena.
4.3.4 Resources: Transitional Housing
Transitional housing provides temporary lodging and is designed to move individuals and families
into permanent housing within a specified period of time, no longer than 24 months. The City of
San Marino does not currently have any known transitional housing facilities. The closest
transitional housing facilities are located in the Euclid Village Condominium complex in nearby
Pasadena.
4.3.5 Resources: Supportive Housing
Supportive housing provides shelter and supportive services to homeless persons with a disability
or mental illness. The Los Angeles Homeless Services Authority provides Safe Haven (SH) housing
as temporary supportive housing for hard-to-reach homeless persons with severe mental illness
that have been unwilling or unable to participate in supportive services, as well as Permanent
Supportive Housing (PSH) to assist homeless individuals with a disability or families in which one
adult or child has a disability to live independently. The City of San Marino does not currently
have any known supportive housing facilities.
4.3.6 At-Risk Assisted Housing Developments.
In compliance with Government Code §65583(a)(9), this section will report a zero inventory of
at-risk units (10 years from the Housing Element due date). The City of San Marino contains no
assisted housing developments, and therefore contains no at-risk assisted housing developments.
San Marino – Final 2021-2029 Housing Element February 9, 2022
70
4.3.7 Planning and Zoning Incentives
AB 2345 provides developers with density bonuses or other incentives in exchange for the
provision of affordable housing which meets certain requirements. As of January 2021, up to a
50% density bonus can be approved for housing projects consisting of a combination of affordable
and Above-moderate homes. The legislation also reduces specific thresholds for obtaining
approvals and allowances from local jurisdictions, requires density bonus reporting, and reduces
parking obligations for many projects qualifying for a density bonus.
4.4 HOUSING CONSTRAINTS ANALYSIS
This section of the Housing Element examines the constraints that could hinder the City’s
achievement of its housing objectives and the resources that are available to assist in the
production, maintenance, and improvement of the City’s housing stock.
4.4.1 Non-Governmental Constraints
In compliance with Government Code §65583(a)(6) the following is an analysis of potential non-
governmental constraints:
Vacant Land
The City's vacant land supply is non-existent. There is one (1) vacant residential lot remaining in
the City, and a building permit has been issued for its development with a single-family home.
Since the City is built-out and there are no remaining subdividable parcels, subdivision standards
do not form a constraint to development. The City’s established policies of maintaining excellent
design standards and very low densities to maintain community character apply to all new
development. With no vacant lots in the City, there is no potential to develop new affordable
housing units on vacant land within City limits and all development must take place on non-vacant
parcels.
Land Costs
The cost of land directly influences the cost of housing. In turn, land prices are determined by
several factors, most importantly the availability of land. As previously noted, there are no vacant
residential parcels in San Marino. Compared to surrounding jurisdictions, as well as the region,
land prices in San Marino significantly constrain the production of housing. Table 17 below
provides the land cost for a standardized ¼ acre residential lot in San Marino ($1,673,700)
compared to the highest-cost jurisdictions in Los Angeles County and the immediate area around
the City. San Marino consistently ranks among the top 100 most expensive zip codes in the nation;
in 2019 it ranked 34th most expensive in the annual Price Shark survey. Land costs in San Marino
are a significant constraint to the development of housing; this is a factor that is outside of the
City’s control.
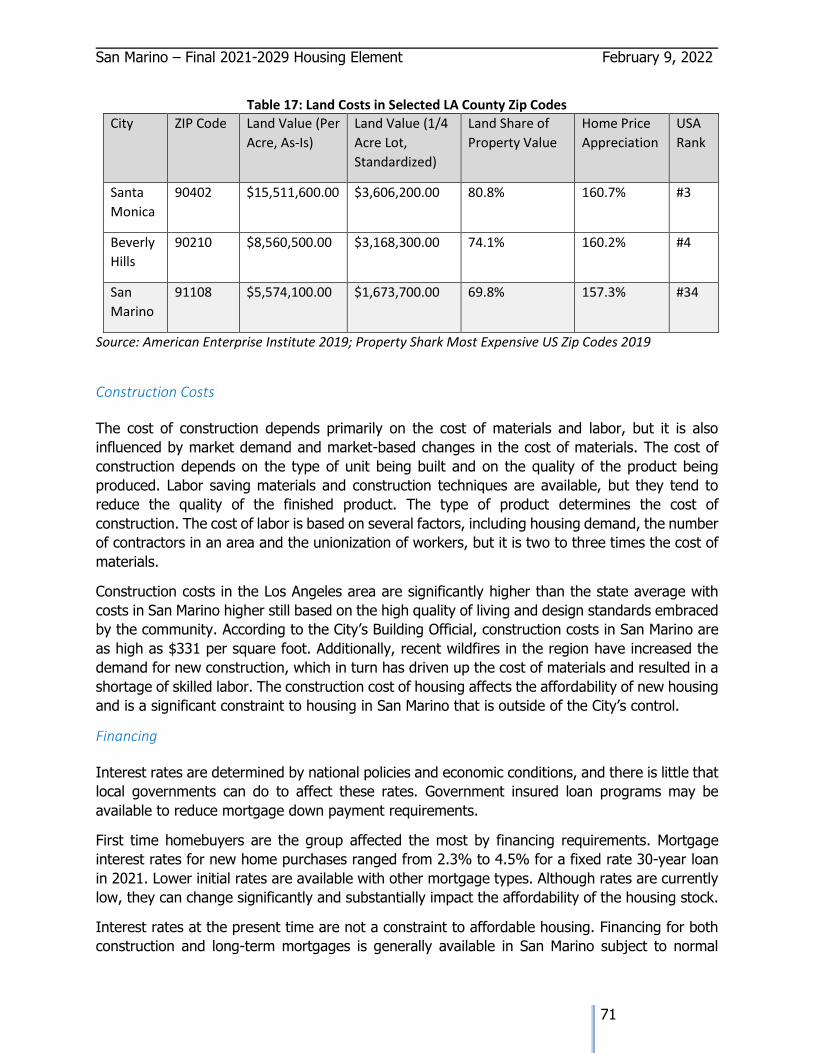
San Marino – Final 2021-2029 Housing Element February 9, 2022
71
Table 17: Land Costs in Selected LA County Zip Codes
City ZIP Code Land Value (Per
Acre, As-Is)
Land Value (1/4
Acre Lot,
Standardized)
Land Share of
Property Value
Home Price
Appreciation
USA
Rank
Santa
Monica
90402 $15,511,600.00 $3,606,200.00 80.8% 160.7% #3
Beverly
Hills
90210 $8,560,500.00 $3,168,300.00 74.1% 160.2% #4
San
Marino
91108 $5,574,100.00 $1,673,700.00 69.8% 157.3% #34
Source: American Enterprise Institute 2019; Property Shark Most Expensive US Zip Codes 2019
Construction Costs
The cost of construction depends primarily on the cost of materials and labor, but it is also
influenced by market demand and market-based changes in the cost of materials. The cost of
construction depends on the type of unit being built and on the quality of the product being
produced. Labor saving materials and construction techniques are available, but they tend to
reduce the quality of the finished product. The type of product determines the cost of
construction. The cost of labor is based on several factors, including housing demand, the number
of contractors in an area and the unionization of workers, but it is two to three times the cost of
materials.
Construction costs in the Los Angeles area are significantly higher than the state average with
costs in San Marino higher still based on the high quality of living and design standards embraced
by the community. According to the City’s Building Official, construction costs in San Marino are
as high as $331 per square foot. Additionally, recent wildfires in the region have increased the
demand for new construction, which in turn has driven up the cost of materials and resulted in a
shortage of skilled labor. The construction cost of housing affects the affordability of new housing
and is a significant constraint to housing in San Marino that is outside of the City’s control.
Financing
Interest rates are determined by national policies and economic conditions, and there is little that
local governments can do to affect these rates. Government insured loan programs may be
available to reduce mortgage down payment requirements.
First time homebuyers are the group affected the most by financing requirements. Mortgage
interest rates for new home purchases ranged from 2.3% to 4.5% for a fixed rate 30-year loan
in 2021. Lower initial rates are available with other mortgage types. Although rates are currently
low, they can change significantly and substantially impact the affordability of the housing stock.
Interest rates at the present time are not a constraint to affordable housing. Financing for both
construction and long-term mortgages is generally available in San Marino subject to normal
San Marino – Final 2021-2029 Housing Element February 9, 2022
72
underwriting standards. A more critical obstacle to homeownership involves both the affordability
of the housing stock and the ability of potential buyers to fulfill down payment requirements.
Typically, conventional home loans will require 5% to 20% of the sale price as a down payment,
which is the largest constraint to first time homebuyers. This indicates a need for flexible loan
programs and a method to bridge the gap between the down payment required and a potential
homeowner's available funds.
According to local realtors, the market continues to experience many all cash offers for homes in
San Marino. This makes it difficult for first time home buyers with minimal down payments to
compete for a home. Anecdotal information received during the public input process for the
Housing Element update indicated that smaller homes were almost always bought by “flippers”
for cash with no intent to make it a home. Instead, the houses are enlarged and remodeled, then
put back on the market for much higher prices where they sit vacant for months or even years.
Vacancy rate data would seem to collaborate this anecdotal information. The City is exploring use
of a subregional Housing Land Trust that could help to reduce this constraint.
Community Opposition
Many California homeowners, including those in San Marino, are resistant to new housing
development, especially that of higher density, in their towns. Public input received during the
Housing Element Update process identified an environment in which negative citizen input can
make it difficult to build anything new or creative within the City, even if all zoning, development,
and design guidelines are followed. Many residents are concerned that new development will
negatively impact their quality of life by decreasing privacy, safety, property value, public health,
or service levels.
A 2014 Housing Element program to consider amending the City’s commercial development
standards to make it easier to build mixed-use projects was met with significant community
opposition and the program was abandoned. As shown by the community opinion surveys,
residents have mixed feelings about new housing development in San Marino. While many
community members express support for more low-cost housing choices and the introduction of
more residential uses in the commercial areas, there are a significant number of community
members who feel that all of San Marino’s housing needs are being met and that there should be
no changes made to the existing physical form of the City. Many respondents to the survey felt
that no apartments should be built in San Marino. To help overcome this opposition, objective
design and development standards will need to be adopted to provide for the ministerial review
of qualified housing projects.
Community resistance can lead to a variety of constraints on housing development. Community
members may pressure the Planning Commission and City Council to deny projects, and in some
cases may also threaten legal action. This environment increases risk for developers and may
discourage them from bringing development proposals to the City. It also means that
development proposals, especially multifamily residential development or development at a higher
density than currently exists, will likely require more time and resources in the development
process to address community concerns. Constraints from community resistance in discretionary
decision-making and design review processes make it even more important for the City to adopt
objective design and development standards for residential and live-work projects.
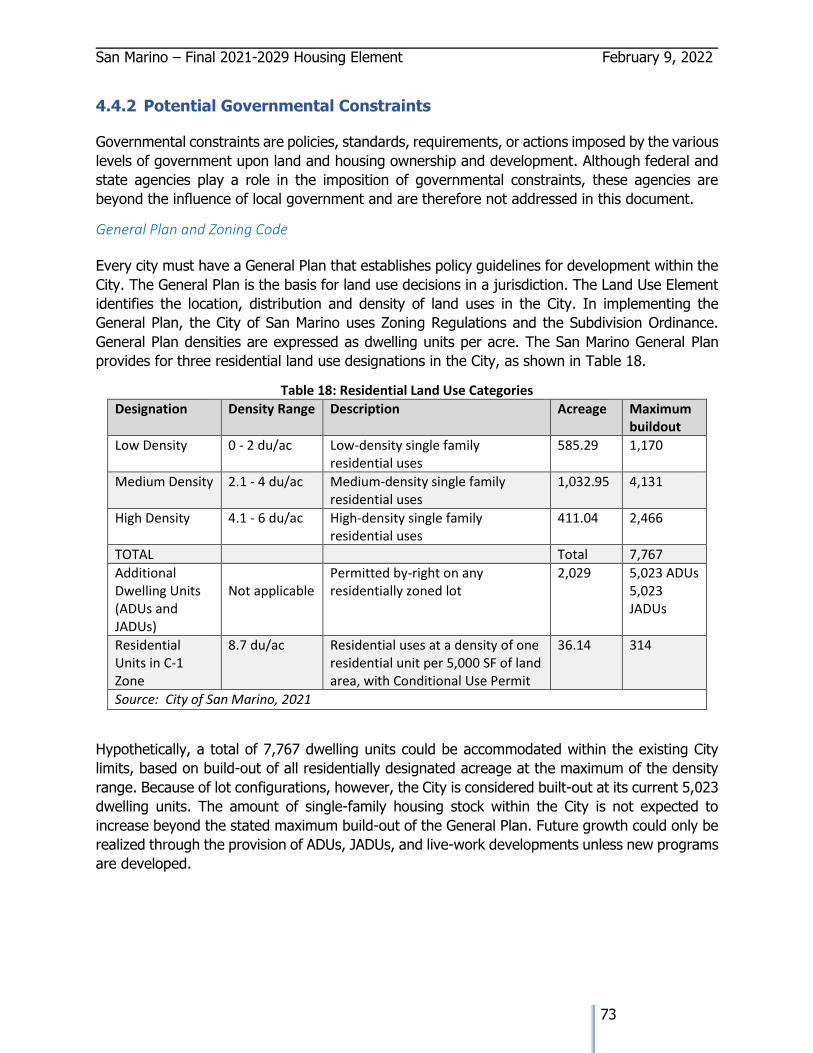
San Marino – Final 2021-2029 Housing Element February 9, 2022
73
4.4.2 Potential Governmental Constraints
Governmental constraints are policies, standards, requirements, or actions imposed by the various
levels of government upon land and housing ownership and development. Although federal and
state agencies play a role in the imposition of governmental constraints, these agencies are
beyond the influence of local government and are therefore not addressed in this document.
General Plan and Zoning Code
Every city must have a General Plan that establishes policy guidelines for development within the
City. The General Plan is the basis for land use decisions in a jurisdiction. The Land Use Element
identifies the location, distribution and density of land uses in the City. In implementing the
General Plan, the City of San Marino uses Zoning Regulations and the Subdivision Ordinance.
General Plan densities are expressed as dwelling units per acre. The San Marino General Plan
provides for three residential land use designations in the City, as shown in Table 18.
Table 18: Residential Land Use Categories
Designation Density Range Description Acreage Maximum buildout
Low Density 0 - 2 du/ac Low-density single family residential uses
585.29 1,170
Medium Density 2.1 - 4 du/ac Medium-density single family residential uses
1,032.95 4,131
High Density 4.1 - 6 du/ac High-density single family residential uses
411.04 2,466
TOTAL Total 7,767
Additional Dwelling Units (ADUs and JADUs)
Not applicable
Permitted by-right on any residentially zoned lot
2,029 5,023 ADUs 5,023 JADUs
Residential Units in C-1 Zone
8.7 du/ac Residential uses at a density of one residential unit per 5,000 SF of land area, with Conditional Use Permit
36.14 314
Source: City of San Marino, 2021
Hypothetically, a total of 7,767 dwelling units could be accommodated within the existing City
limits, based on build-out of all residentially designated acreage at the maximum of the density
range. Because of lot configurations, however, the City is considered built-out at its current 5,023
dwelling units. The amount of single-family housing stock within the City is not expected to
increase beyond the stated maximum build-out of the General Plan. Future growth could only be
realized through the provision of ADUs, JADUs, and live-work developments unless new programs
are developed.
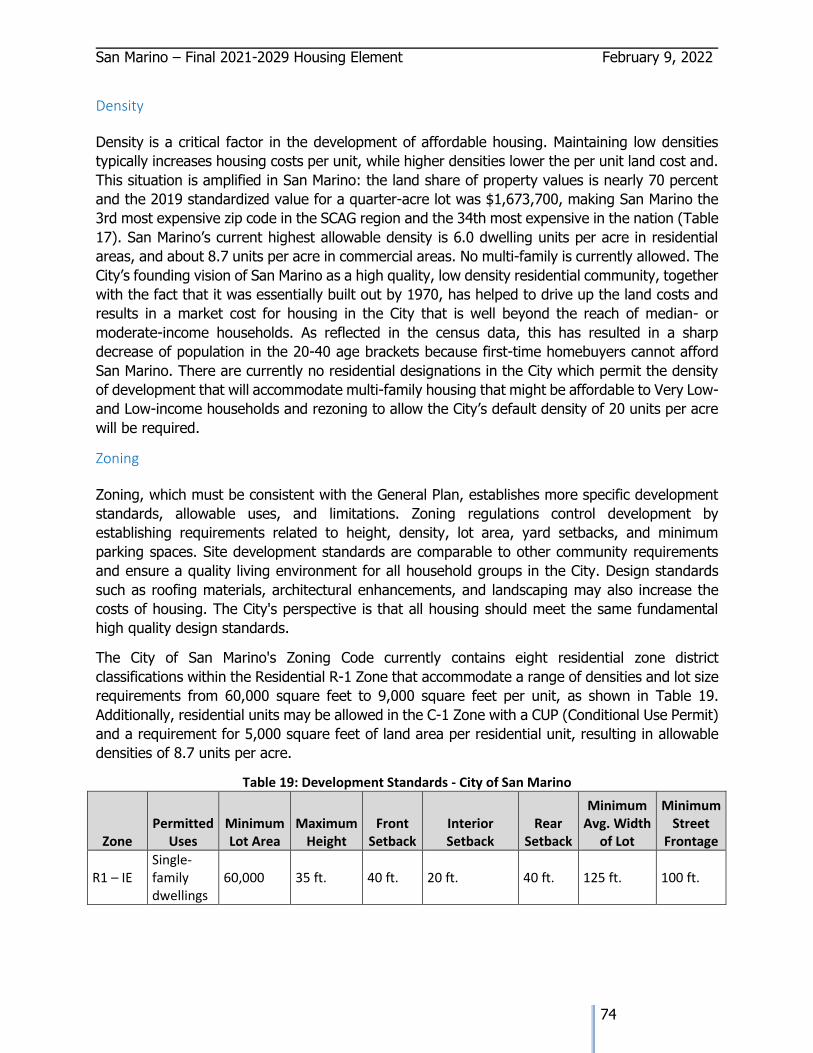
San Marino – Final 2021-2029 Housing Element February 9, 2022
74
Density
Density is a critical factor in the development of affordable housing. Maintaining low densities
typically increases housing costs per unit, while higher densities lower the per unit land cost and.
This situation is amplified in San Marino: the land share of property values is nearly 70 percent
and the 2019 standardized value for a quarter-acre lot was $1,673,700, making San Marino the
3rd most expensive zip code in the SCAG region and the 34th most expensive in the nation (Table
17). San Marino’s current highest allowable density is 6.0 dwelling units per acre in residential
areas, and about 8.7 units per acre in commercial areas. No multi-family is currently allowed. The
City’s founding vision of San Marino as a high quality, low density residential community, together
with the fact that it was essentially built out by 1970, has helped to drive up the land costs and
results in a market cost for housing in the City that is well beyond the reach of median- or
moderate-income households. As reflected in the census data, this has resulted in a sharp
decrease of population in the 20-40 age brackets because first-time homebuyers cannot afford
San Marino. There are currently no residential designations in the City which permit the density
of development that will accommodate multi-family housing that might be affordable to Very Low-
and Low-income households and rezoning to allow the City’s default density of 20 units per acre
will be required.
Zoning
Zoning, which must be consistent with the General Plan, establishes more specific development
standards, allowable uses, and limitations. Zoning regulations control development by
establishing requirements related to height, density, lot area, yard setbacks, and minimum
parking spaces. Site development standards are comparable to other community requirements
and ensure a quality living environment for all household groups in the City. Design standards
such as roofing materials, architectural enhancements, and landscaping may also increase the
costs of housing. The City's perspective is that all housing should meet the same fundamental
high quality design standards.
The City of San Marino's Zoning Code currently contains eight residential zone district
classifications within the Residential R-1 Zone that accommodate a range of densities and lot size
requirements from 60,000 square feet to 9,000 square feet per unit, as shown in Table 19.
Additionally, residential units may be allowed in the C-1 Zone with a CUP (Conditional Use Permit)
and a requirement for 5,000 square feet of land area per residential unit, resulting in allowable
densities of 8.7 units per acre.
Table 19: Development Standards - City of San Marino
Zone Permitted
Uses Minimum Lot Area
Maximum Height
Front Setback
Interior Setback
Rear Setback
Minimum Avg. Width
of Lot
Minimum Street
Frontage
R1 – IE Single-family dwellings
60,000 35 ft. 40 ft. 20 ft. 40 ft. 125 ft. 100 ft.
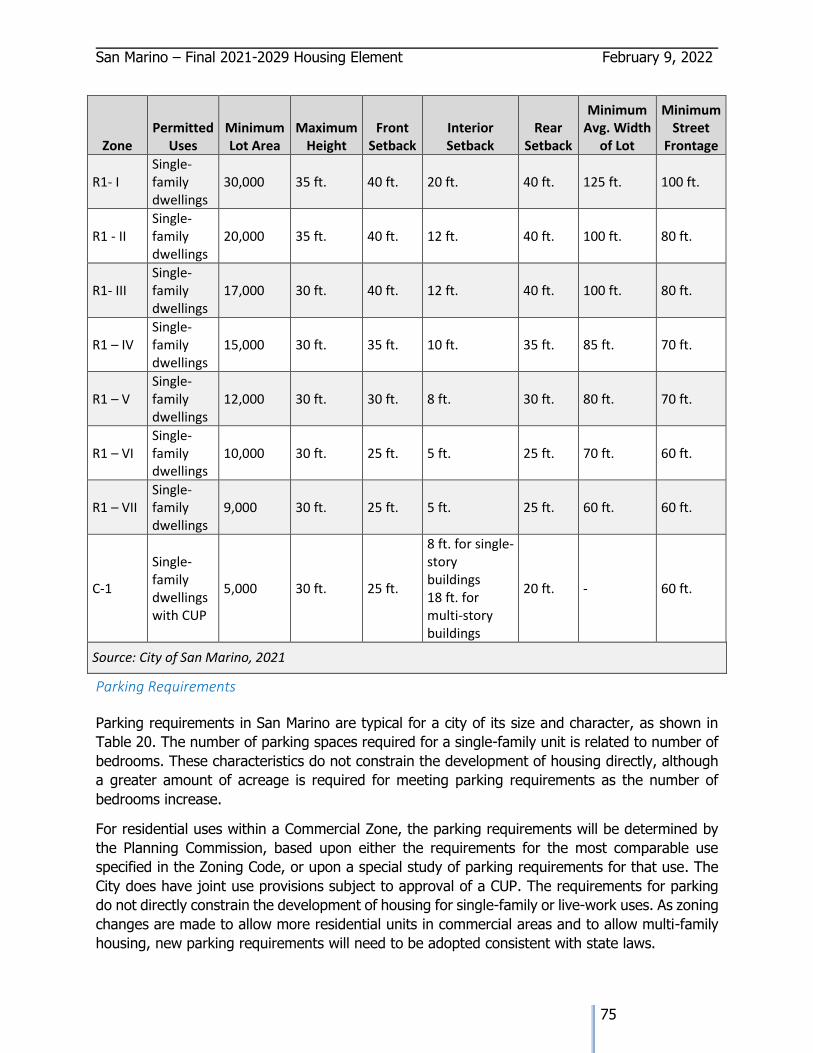
San Marino – Final 2021-2029 Housing Element February 9, 2022
75
Zone Permitted
Uses Minimum Lot Area
Maximum Height
Front Setback
Interior Setback
Rear Setback
Minimum Avg. Width
of Lot
Minimum Street
Frontage
R1- I Single-family dwellings
30,000 35 ft. 40 ft. 20 ft. 40 ft. 125 ft. 100 ft.
R1 - II Single-family dwellings
20,000 35 ft. 40 ft. 12 ft. 40 ft. 100 ft. 80 ft.
R1- III Single-family dwellings
17,000 30 ft. 40 ft. 12 ft. 40 ft. 100 ft. 80 ft.
R1 – IV Single-family dwellings
15,000 30 ft. 35 ft. 10 ft. 35 ft. 85 ft. 70 ft.
R1 – V Single-family dwellings
12,000 30 ft. 30 ft. 8 ft. 30 ft. 80 ft. 70 ft.
R1 – VI Single-family dwellings
10,000 30 ft. 25 ft. 5 ft. 25 ft. 70 ft. 60 ft.
R1 – VII Single-family dwellings
9,000 30 ft. 25 ft. 5 ft. 25 ft. 60 ft. 60 ft.
C-1
Single-family dwellings with CUP
5,000 30 ft. 25 ft.
8 ft. for single-story buildings 18 ft. for multi-story buildings
20 ft. - 60 ft.
Source: City of San Marino, 2021
Parking Requirements
Parking requirements in San Marino are typical for a city of its size and character, as shown in
Table 20. The number of parking spaces required for a single-family unit is related to number of
bedrooms. These characteristics do not constrain the development of housing directly, although
a greater amount of acreage is required for meeting parking requirements as the number of
bedrooms increase.
For residential uses within a Commercial Zone, the parking requirements will be determined by
the Planning Commission, based upon either the requirements for the most comparable use
specified in the Zoning Code, or upon a special study of parking requirements for that use. The
City does have joint use provisions subject to approval of a CUP. The requirements for parking
do not directly constrain the development of housing for single-family or live-work uses. As zoning
changes are made to allow more residential units in commercial areas and to allow multi-family
housing, new parking requirements will need to be adopted consistent with state laws.
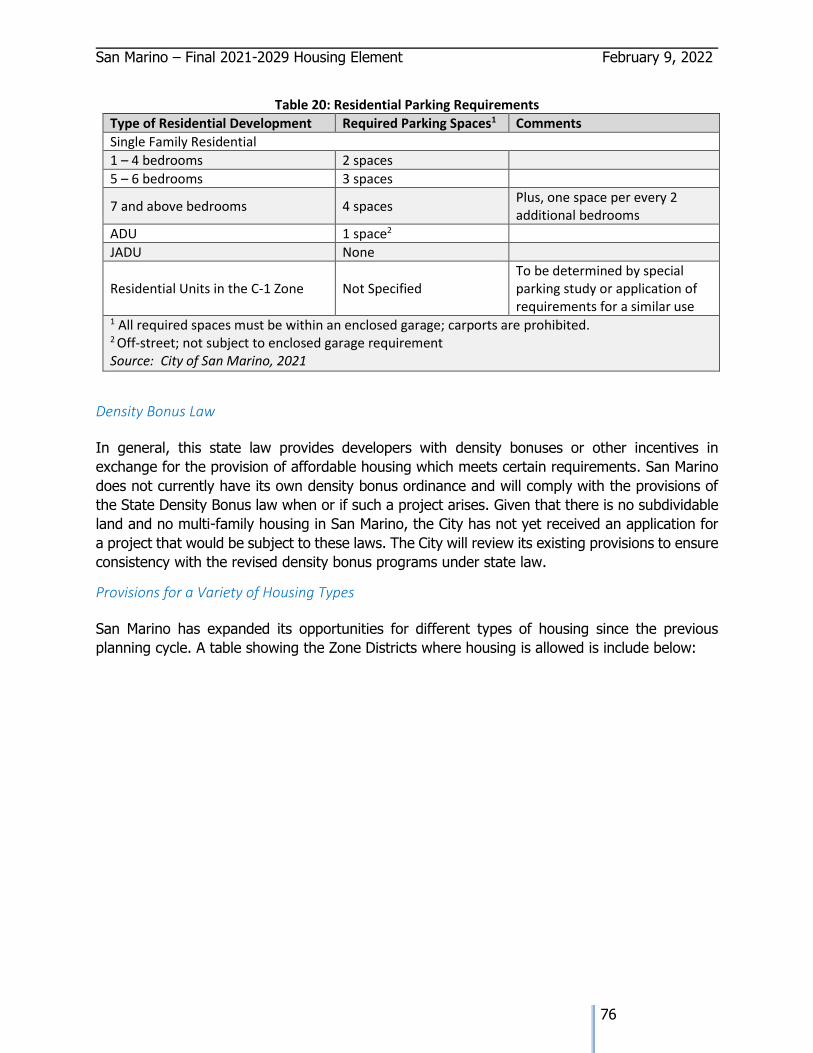
San Marino – Final 2021-2029 Housing Element February 9, 2022
76
Table 20: Residential Parking Requirements
Type of Residential Development Required Parking Spaces1 Comments
Single Family Residential
1 – 4 bedrooms 2 spaces
5 – 6 bedrooms 3 spaces
7 and above bedrooms 4 spaces Plus, one space per every 2 additional bedrooms
ADU 1 space2
JADU None
Residential Units in the C-1 Zone Not Specified To be determined by special parking study or application of requirements for a similar use
1 All required spaces must be within an enclosed garage; carports are prohibited. 2 Off-street; not subject to enclosed garage requirement Source: City of San Marino, 2021
Density Bonus Law
In general, this state law provides developers with density bonuses or other incentives in
exchange for the provision of affordable housing which meets certain requirements. San Marino
does not currently have its own density bonus ordinance and will comply with the provisions of
the State Density Bonus law when or if such a project arises. Given that there is no subdividable
land and no multi-family housing in San Marino, the City has not yet received an application for
a project that would be subject to these laws. The City will review its existing provisions to ensure
consistency with the revised density bonus programs under state law.
Provisions for a Variety of Housing Types
San Marino has expanded its opportunities for different types of housing since the previous
planning cycle. A table showing the Zone Districts where housing is allowed is include below:
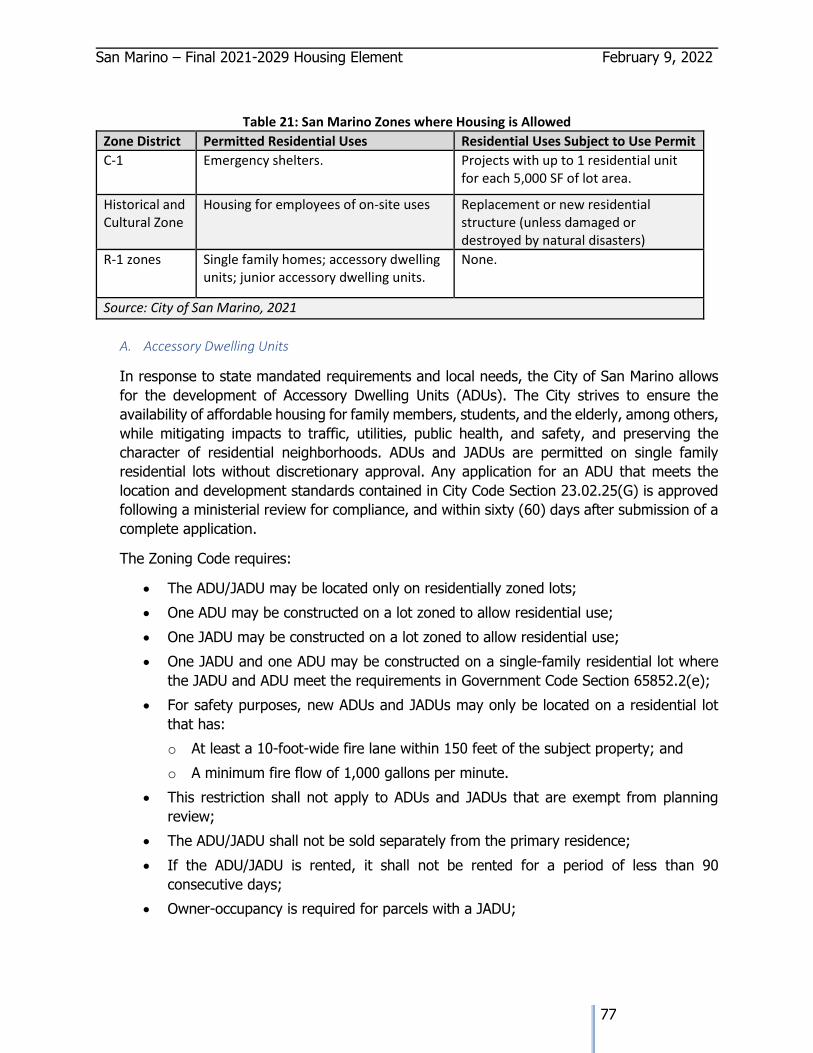
San Marino – Final 2021-2029 Housing Element February 9, 2022
77
Table 21: San Marino Zones where Housing is Allowed
Zone District Permitted Residential Uses Residential Uses Subject to Use Permit
C-1 Emergency shelters. Projects with up to 1 residential unit for each 5,000 SF of lot area.
Historical and Cultural Zone
Housing for employees of on-site uses Replacement or new residential structure (unless damaged or destroyed by natural disasters)
R-1 zones Single family homes; accessory dwelling units; junior accessory dwelling units.
None.
Source: City of San Marino, 2021
A. Accessory Dwelling Units
In response to state mandated requirements and local needs, the City of San Marino allows
for the development of Accessory Dwelling Units (ADUs). The City strives to ensure the
availability of affordable housing for family members, students, and the elderly, among others,
while mitigating impacts to traffic, utilities, public health, and safety, and preserving the
character of residential neighborhoods. ADUs and JADUs are permitted on single family
residential lots without discretionary approval. Any application for an ADU that meets the
location and development standards contained in City Code Section 23.02.25(G) is approved
following a ministerial review for compliance, and within sixty (60) days after submission of a
complete application.
The Zoning Code requires:
• The ADU/JADU may be located only on residentially zoned lots;
• One ADU may be constructed on a lot zoned to allow residential use;
• One JADU may be constructed on a lot zoned to allow residential use;
• One JADU and one ADU may be constructed on a single-family residential lot where
the JADU and ADU meet the requirements in Government Code Section 65852.2(e);
• For safety purposes, new ADUs and JADUs may only be located on a residential lot
that has:
o At least a 10-foot-wide fire lane within 150 feet of the subject property; and
o A minimum fire flow of 1,000 gallons per minute.
• This restriction shall not apply to ADUs and JADUs that are exempt from planning
review;
• The ADU/JADU shall not be sold separately from the primary residence;
• If the ADU/JADU is rented, it shall not be rented for a period of less than 90
consecutive days;
• Owner-occupancy is required for parcels with a JADU;
San Marino – Final 2021-2029 Housing Element February 9, 2022
78
• The ADU/JADU shall be restricted to the Livable Area approved at the time of the
building permit issuance; and
• The ADU/JADU may not have utility services separate from those of the main
residential structure on the same property.
ADU Development Standards:
• ADUs are limited to a maximum of two bedrooms.
• Studio and one-bedroom ADUs shall not exceed 850 square feet of Livable Area.
• Two Bedroom ADUs shall no exceed 1,000 square feet of Livable Area.
• A Detached ADU shall not exceed 1000 square feet of Livable Area and shall not
exceed one story or sixteen feet (16’) in height.
• An ADU shall include a kitchen for cooking and eating and other permanent provisions
for living and sleeping, including a closet or other reasonable storage area.
• Exterior lighting shall be shielded or directed so that it does not glare off-site or
illuminate the primary residence or any adjacent property.
• Windows shall be located to avoid direct line of sign to windows of adjacent properties.
• An ADU shall have a separate exterior access and to the greatest extent feasible, shall
not be visible from the street.
• Any common wall separating the accessory dwelling unit from the main building shall
be soundproofed.
• A permanent foundation shall be required for all ADUs.
• One off-street parking space shall be provided for each ADU except when:
o The ADU is located within a one-half mile walking distance of Public Transit.
o The ADU is entirely within a proposed or existing primary dwelling or other existing
structure.
o The ADU is located within an historic district.
• The design of the second unit shall be consistent with that of the main building; and
• The ADU must be served by its own parking space.
• An ADU may not have separate utility services.
JADU Development standards:
• The Owner of a parcel proposed for a JADU shall occupy as a principal residence either
the Single-Family Dwelling Unit or the JADU. Owner-occupancy shall not be required
if the Owner is another governmental agency, land trust, or housing organization.
• The JADU shall be a minimum of 150 square feet and a maximum of 500 square feet
of Livable Area.
• The JADU must be contained entirely within the walls of the existing or proposed
Single Family Dwelling Unit.
• The JADU shall include an efficiency kitchen.
San Marino – Final 2021-2029 Housing Element February 9, 2022
79
• The JADU shall have a separate entry from the main entrance to the Single-Family
Dwelling.
• An interior entry to the main living area shall be provided to serv a JADU.
• No additional parking is required for a JADU.
B. Manufactured Housing
The City has allowed manufactured, prefabricated, and mobile home construction in its R-1
Zone since 1996. No manufactured housing currently exists in the City. It is subject to the
same development standards as otherwise required for that zone. Certain additional
requirements are included in the City Code:
• Minimum Dimensions: Thirty feet (30') (excluding garage).
• Roof: Pressure treated, fire retardant wood shake or shingle, 300# or heavier
composition shingle, clay or cement tile, rock, or gravel; shaped, rolled, or reflective
roofs are prohibited.
• Eaves: Minimum sixteen-inch (16") eave protection unless otherwise approved by the
Commission.
• Exterior Wall Treatment:
o Permitted Materials: Wood siding, stucco, brick or as approved by the
Commission.
o Color: Natural earth tones, white, with complementary trim color.
o Prohibited Materials: No reflective, glossy, polished, roll-formed, stamped,
extruded, plastic, PVC or similar type of materials shall be used for roofing or
siding.
• Foundation Required: All manufactured homes shall be installed on a foundation
system, pursuant to section 18551 of the California Health and Safety Code, and no
more than ten (10) years shall have elapsed between the date of manufacture of the
home and the date of the application for issuance of a permit to install the
manufactured home in the City.
• Design Review: Such manufactured homes shall meet all other requirements of this
Code and are subject to design review.
C. Emergency Shelters
In accordance with State Law and as set forth in City Code 23.03.01(I) (1-9), Emergency
shelters are permitted in the C-1 Zone. Emergency shelters must comply with the following
standards in addition to the development requirements and other requirements generally
applicable in the C-1 Zone:
• Maximum number of persons to be served on any given night shall not exceed ten
(10).
• A minimum distance of three hundred feet (300’) shall be maintained from any other
emergency shelter.
San Marino – Final 2021-2029 Housing Element February 9, 2022
80
• The maximum stay at the facility shall not exceed ninety (90) days in a three hundred
and sixty-five (365) day period.
• On site client waiting and intake areas shall be located inside the building.
• A minimum of one manager, in addition to security personnel, shall be on duty and
remain on site during intake hours.
• Security personnel shall be provided on site at all times.
• Exterior lighting shall be provided for the entire outdoor area of the site consistent
with the provisions of The Code. Exterior lighting shall be stationary and shall be
directed away from adjacent properties and public rights of way.
• A minimum of one parking space for every five (5) beds, or one parking space for
each bedroom designated for families with children, plus one parking space for each
employee/volunteer on duty during the largest shift, shall be maintained.
• Hours of operation for client intake and discharge shall comply with The Code.
D. Transitional Housing and Supportive Housing
Changes were made to the City Code in 2021 to specify that transitional, supportive, and
employee housing types are considered permitted uses in all Districts that allow residential
uses, subject only to the same standards as other residential uses in the same District.
E. Residential Care Facility
Licensed residential care facilities are state licensed facilities maintained and operated to
provide non-medical residential care, day treatment, or foster agency services for six or fewer
adults, children, or adults and children. State law requires that these facilities be treated as a
single housekeeping unit for zoning purposes. Licensed residential care facilities are permitted
in the R-1 Zone in accordance with state law. The City currently has at least one residential
care facility in the R-1 Zone.
F. SRO (Single Room Occupancy) Housing
While the City of San Marino does not specifically address this use within the zoning code. the
C-1 Commercial Zone allows residential uses with the issuance of a conditional use permit.
The Code currently allows one residential unit per 5,000 square feet of land. Market conditions
and the relatively small size of C-1 zoned parcels are the likely factors as to why higher density
housing has not been pursued in the City.
G. Farmworker Housing/Employee Housing
Statewide, farmworker housing is of unique concern and importance. While only a small
number of SCAG jurisdictions have farmworkers living in them, they are essential to the
region’s economy and its food supply. According to the United States Department of
Agriculture (USDA), more than 80 percent of hired crop farmworkers are not migrant workers
but are considered settled and work farm(s) within 75 miles of their residences. This share is
up significantly from 41 percent in 1996-1998, reflecting a fundamental change in the nature
San Marino – Final 2021-2029 Housing Element February 9, 2022
81
of the crop farming workforce. The majority of farmworkers in California reside in metropolitan
areas, where the average hourly wage of $16.05 puts them in the extremely low to very-low-
income category (between 30-50 percent of the area median income).
According to the United Stated Department of Agriculture, the average age of the agricultural
workforce has risen significantly in the last few years and now stands at 41.6 years. A growing
percentage (26.1%) are women. While the median farm size in Los Angeles County is only
four acres, there are 25 “large” farms of 500 acres or more that rely on farmworkers (2017
County summary highlights, USDA). Most of the large farms in Los Angeles County are located
in or near the Palmdale-Lancaster area, and not near San Marino. (California Important
Farmland: 2016, CA DOC. Lands identified here are indicated as being used for agriculture in
the last four years in the Farmlands Mapping and Monitoring Program.) The 2014 – 2018 ACS
indicated that no farmworkers live in San Marino, and there is no nearby farmland that would
indicate a need for farmworker housing in San Marino. If employee housing were to be
proposed under the Employee Housing Act, it would be allowed as a residential use so long
as the program was licensed and administered by HCD.
Building Codes and Enforcement
A variety of building and safety codes, while adopted for purposes of preserving public health and
safety, and ensuring the construction of safe and decent housing, have the potential to increase
the cost of housing construction or maintenance.
The City of San Marino has adopted the California Building Code, 2019 edition, based on the 2018
International Building Code as published by the International Code Council. The Codes are based
on regulations necessary to protect the public health, safety, and welfare. The Building Codes
and related amendments do not seem to impede the development of housing. Many newer
requirements such as fire safety systems and green building requirements had been implemented
by residents prior to being required.
Code enforcement is conducted by way of Code Enforcement Officers patrolling the City and
investigating complaints received. The main issue that Code Enforcement addresses is
construction or remodeling without permits. Very rarely are substandard housing conditions or
other health and safety issues identified. The City’s older housing stock is very well maintained.
Housing for People with Disabilities
Americans with Disabilities Act
Americans with Disabilities Act (ADA) provisions include requirements for a minimum percentage
of units in new multi-family developments to be fully accessible to the physically disabled.
Development of fully accessible units may also increase the overall project costs. Enforcement of
ADA requirements is not at the discretion of the City but is mandated under federal law. The
provisions of the ADA applicable to residential uses would apply only to multi-family developments
and any residential components of a live-work project in a Commercial Zone.
Compliance with building codes and the ADA may increase the cost of housing production.
However, these regulations provide minimum standards that must be followed to ensure the
San Marino – Final 2021-2029 Housing Element February 9, 2022
82
development of safe and accessible housing. Therefore, the local enforcement of these codes
does not significantly constrain the development of housing.
Accessible Development
The City has seen an increase in projects such as handicapped accessible bathrooms, elevators,
and first floor master suites. These items are treated in the same manner as any other project in
terms of fees, permitting, and processing. Residential Care Facilities are also treated in the same
manner as a single-family home. There is no additional hindrance on the development of housing
for the disabled. No distance requirements have been adopted.
The City’s aging population, which includes residents with disabilities related to vision and
mobility, will need to be accommodated within this eight-year planning period. The City should
consider adopting a Universal Design program and applying it to new and remodeled dwellings
to ensure that residents can age in place and that homes are designed for all stages of life.
Reasonable Accommodation
The City has also adopted a reasonable accommodation ordinance. Under the ADA, cities must
reasonably modify policies when necessary to avoid discrimination because of disability, unless
they can show that the modifications “would fundamentally alter the nature of the service,
program or activity.” (28 Code of Federal Regulations 35.130(b)(7).) In general, the law states
that local agencies retain their ability to regulate land uses and to apply neutral, non-
discriminatory regulations, but are required to make accommodations to allow persons with
disabilities an equal opportunity to use and enjoy housing in the community. The City’s reasonable
accommodation ordinance establishes a process for considering these types of accommodations
and provides findings that must be met for an application to be approved as a reasonable
accommodation. This process makes it easier for a resident to obtain approval for an
accommodation, such as a wheelchair ramp or front yard parking space, which may not otherwise
meet the Code requirements. Two reasonable accommodations have been requested and both
have been granted within a reasonable time frame.
The City’s Zoning Code defines “family” as “an immediate family related by blood, marriage or
adoption, or a group of individuals who are unrelated and live together as a single housekeeping
unit in a dwelling unit. This shall not include an individual paying rent to a landlord for the purpose
of temporarily residing in a dwelling unit.” This definition is inclusive of all types of households
and does not serve to constrain housing for persons with disabilities.
Development and Permitting Fees
Various fees and assessments are charged by the City and other agencies to cover the cost of
processing development permits and providing local services. These fees help ensure quality
development and the provision of adequate public services. The City is legally required to set
permit and development fees in amounts that are no more than equal the cost of providing
services associated with these fees. The City recently conducted a comprehensive fee study to
ensure the cost of providing the services was consistent with the required fee for those services.
San Marino is a largely developed, suburban jurisdiction with most of its necessary infrastructure
such as streets, electrical, sewer and water facilities in place. Aside from fees collected to offset
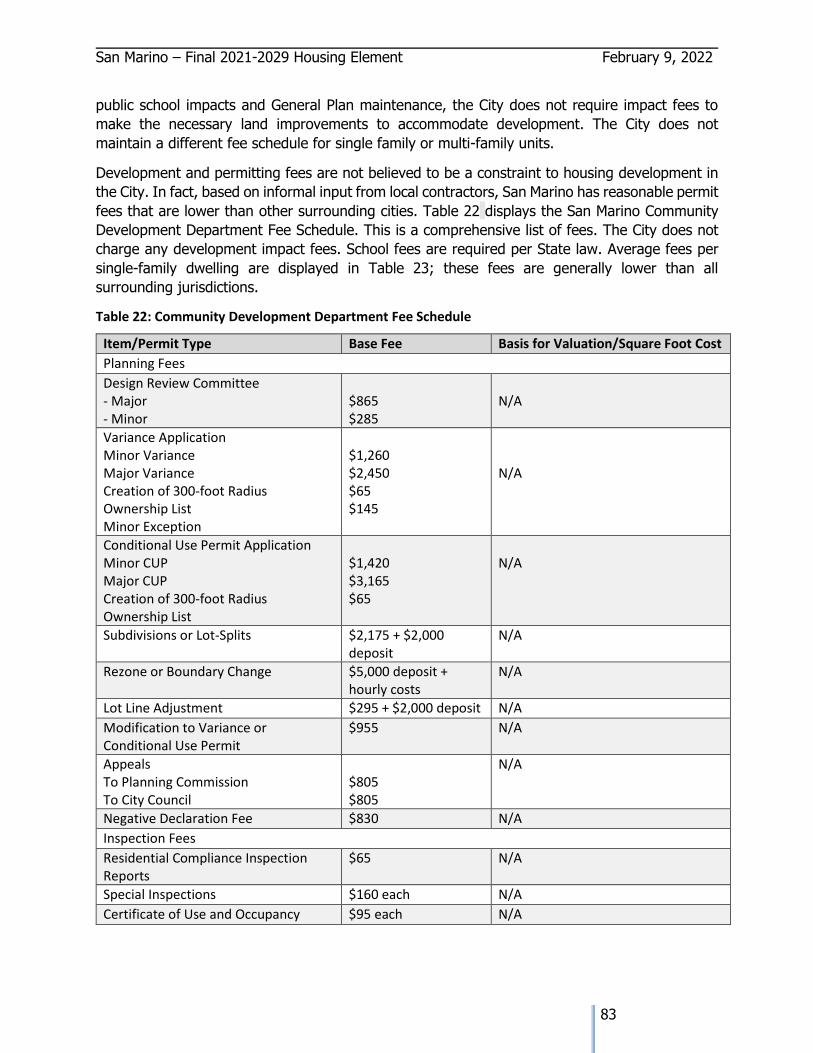
San Marino – Final 2021-2029 Housing Element February 9, 2022
83
public school impacts and General Plan maintenance, the City does not require impact fees to
make the necessary land improvements to accommodate development. The City does not
maintain a different fee schedule for single family or multi-family units.
Development and permitting fees are not believed to be a constraint to housing development in
the City. In fact, based on informal input from local contractors, San Marino has reasonable permit
fees that are lower than other surrounding cities. Table 22 displays the San Marino Community
Development Department Fee Schedule. This is a comprehensive list of fees. The City does not
charge any development impact fees. School fees are required per State law. Average fees per
single-family dwelling are displayed in Table 23; these fees are generally lower than all
surrounding jurisdictions.
Table 22: Community Development Department Fee Schedule
Item/Permit Type Base Fee Basis for Valuation/Square Foot Cost
Planning Fees
Design Review Committee - Major - Minor
$865 $285
N/A
Variance Application Minor Variance Major Variance Creation of 300-foot Radius Ownership List Minor Exception
$1,260 $2,450 $65 $145
N/A
Conditional Use Permit Application Minor CUP Major CUP Creation of 300-foot Radius Ownership List
$1,420 $3,165 $65
N/A
Subdivisions or Lot-Splits $2,175 + $2,000 deposit
N/A
Rezone or Boundary Change $5,000 deposit + hourly costs
N/A
Lot Line Adjustment $295 + $2,000 deposit N/A
Modification to Variance or Conditional Use Permit
$955 N/A
Appeals To Planning Commission To City Council
$805 $805
N/A
Negative Declaration Fee $830 N/A
Inspection Fees
Residential Compliance Inspection Reports
$65 N/A
Special Inspections $160 each N/A
Certificate of Use and Occupancy $95 each N/A
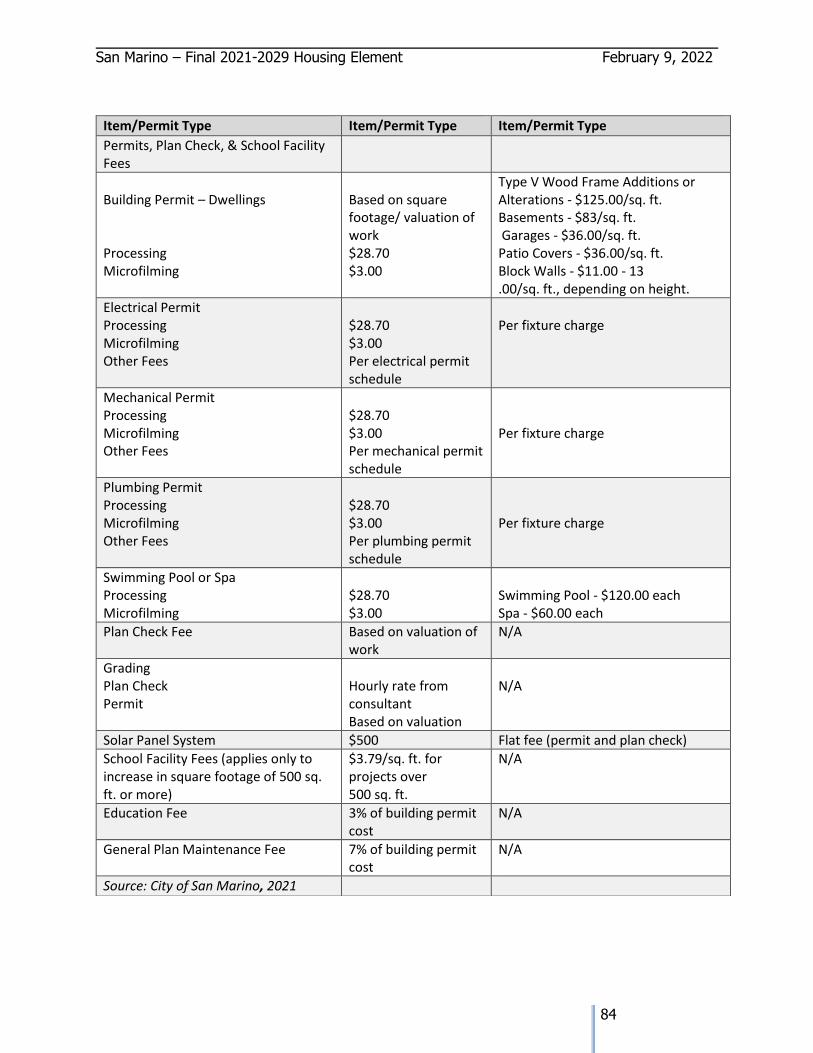
San Marino – Final 2021-2029 Housing Element February 9, 2022
84
Item/Permit Type Item/Permit Type Item/Permit Type
Permits, Plan Check, & School Facility Fees
Building Permit – Dwellings Processing Microfilming
Based on square footage/ valuation of work $28.70 $3.00
Type V Wood Frame Additions or Alterations - $125.00/sq. ft. Basements - $83/sq. ft. Garages - $36.00/sq. ft. Patio Covers - $36.00/sq. ft. Block Walls - $11.00 - 13 .00/sq. ft., depending on height.
Electrical Permit Processing Microfilming Other Fees
$28.70 $3.00 Per electrical permit schedule
Per fixture charge
Mechanical Permit Processing Microfilming Other Fees
$28.70 $3.00 Per mechanical permit schedule
Per fixture charge
Plumbing Permit Processing Microfilming Other Fees
$28.70 $3.00 Per plumbing permit schedule
Per fixture charge
Swimming Pool or Spa Processing Microfilming
$28.70 $3.00
Swimming Pool - $120.00 each Spa - $60.00 each
Plan Check Fee Based on valuation of work
N/A
Grading Plan Check Permit
Hourly rate from consultant Based on valuation
N/A
Solar Panel System $500 Flat fee (permit and plan check)
School Facility Fees (applies only to increase in square footage of 500 sq. ft. or more)
$3.79/sq. ft. for projects over 500 sq. ft.
N/A
Education Fee 3% of building permit cost
N/A
General Plan Maintenance Fee 7% of building permit cost
N/A
Source: City of San Marino, 2021
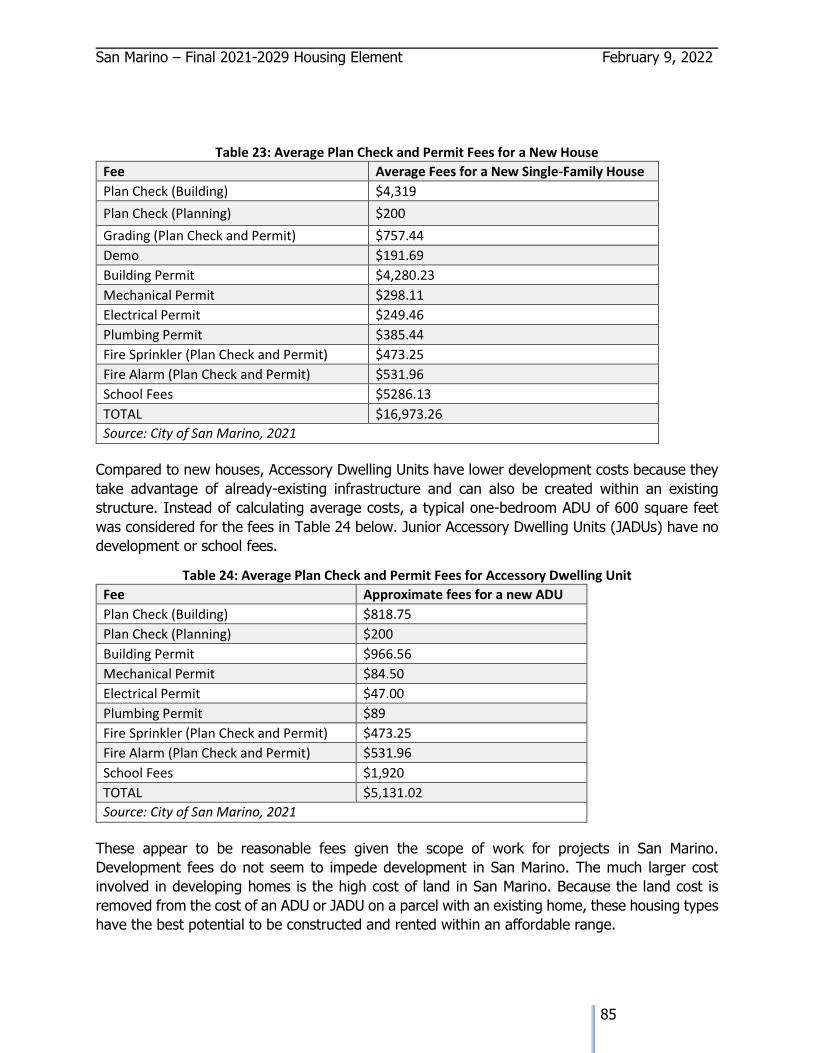
San Marino – Final 2021-2029 Housing Element February 9, 2022
85
Table 23: Average Plan Check and Permit Fees for a New House
Fee Average Fees for a New Single-Family House
Plan Check (Building) $4,319
Plan Check (Planning) $200
Grading (Plan Check and Permit) $757.44
Demo $191.69
Building Permit $4,280.23
Mechanical Permit $298.11
Electrical Permit $249.46
Plumbing Permit $385.44
Fire Sprinkler (Plan Check and Permit) $473.25
Fire Alarm (Plan Check and Permit) $531.96
School Fees $5286.13
TOTAL $16,973.26
Source: City of San Marino, 2021
Compared to new houses, Accessory Dwelling Units have lower development costs because they
take advantage of already-existing infrastructure and can also be created within an existing
structure. Instead of calculating average costs, a typical one-bedroom ADU of 600 square feet
was considered for the fees in Table 24 below. Junior Accessory Dwelling Units (JADUs) have no
development or school fees.
Table 24: Average Plan Check and Permit Fees for Accessory Dwelling Unit
Fee Approximate fees for a new ADU
Plan Check (Building) $818.75
Plan Check (Planning) $200
Building Permit $966.56
Mechanical Permit $84.50
Electrical Permit $47.00
Plumbing Permit $89
Fire Sprinkler (Plan Check and Permit) $473.25
Fire Alarm (Plan Check and Permit) $531.96
School Fees $1,920
TOTAL $5,131.02
Source: City of San Marino, 2021
These appear to be reasonable fees given the scope of work for projects in San Marino.
Development fees do not seem to impede development in San Marino. The much larger cost
involved in developing homes is the high cost of land in San Marino. Because the land cost is
removed from the cost of an ADU or JADU on a parcel with an existing home, these housing types
have the best potential to be constructed and rented within an affordable range.
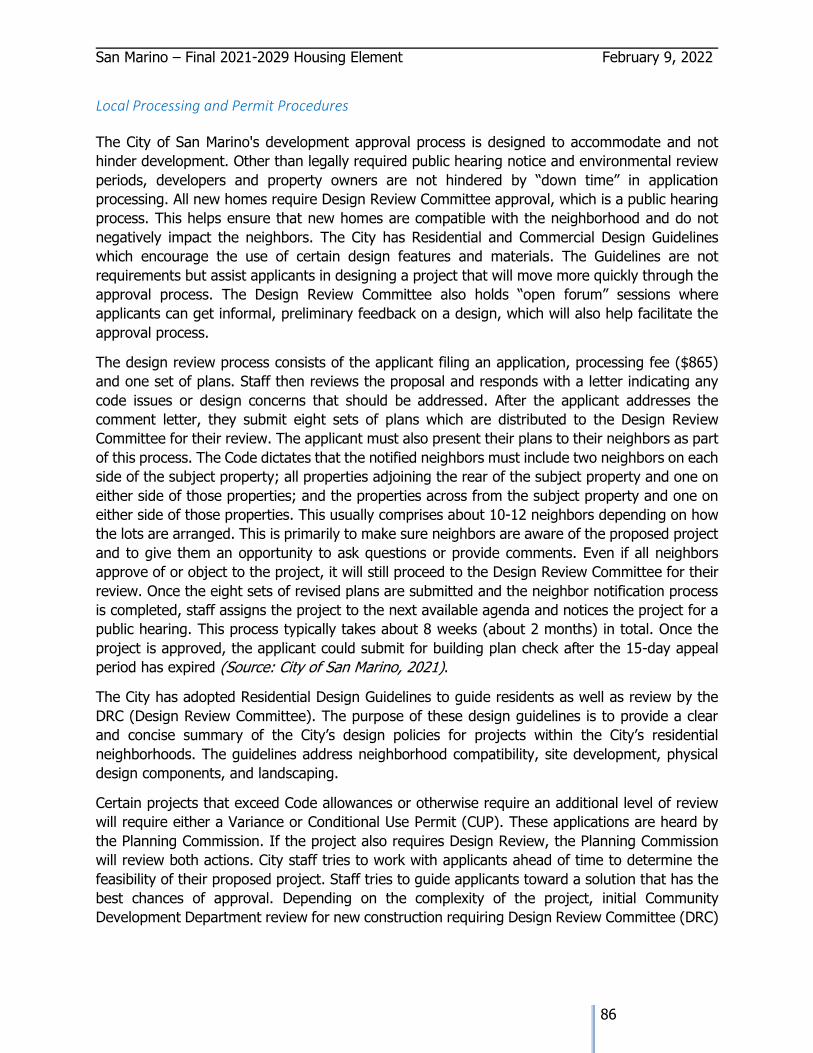
San Marino – Final 2021-2029 Housing Element February 9, 2022
86
Local Processing and Permit Procedures
The City of San Marino's development approval process is designed to accommodate and not
hinder development. Other than legally required public hearing notice and environmental review
periods, developers and property owners are not hindered by “down time” in application
processing. All new homes require Design Review Committee approval, which is a public hearing
process. This helps ensure that new homes are compatible with the neighborhood and do not
negatively impact the neighbors. The City has Residential and Commercial Design Guidelines
which encourage the use of certain design features and materials. The Guidelines are not
requirements but assist applicants in designing a project that will move more quickly through the
approval process. The Design Review Committee also holds “open forum” sessions where
applicants can get informal, preliminary feedback on a design, which will also help facilitate the
approval process.
The design review process consists of the applicant filing an application, processing fee ($865)
and one set of plans. Staff then reviews the proposal and responds with a letter indicating any
code issues or design concerns that should be addressed. After the applicant addresses the
comment letter, they submit eight sets of plans which are distributed to the Design Review
Committee for their review. The applicant must also present their plans to their neighbors as part
of this process. The Code dictates that the notified neighbors must include two neighbors on each
side of the subject property; all properties adjoining the rear of the subject property and one on
either side of those properties; and the properties across from the subject property and one on
either side of those properties. This usually comprises about 10-12 neighbors depending on how
the lots are arranged. This is primarily to make sure neighbors are aware of the proposed project
and to give them an opportunity to ask questions or provide comments. Even if all neighbors
approve of or object to the project, it will still proceed to the Design Review Committee for their
review. Once the eight sets of revised plans are submitted and the neighbor notification process
is completed, staff assigns the project to the next available agenda and notices the project for a
public hearing. This process typically takes about 8 weeks (about 2 months) in total. Once the
project is approved, the applicant could submit for building plan check after the 15-day appeal
period has expired (Source: City of San Marino, 2021).
The City has adopted Residential Design Guidelines to guide residents as well as review by the
DRC (Design Review Committee). The purpose of these design guidelines is to provide a clear
and concise summary of the City’s design policies for projects within the City’s residential
neighborhoods. The guidelines address neighborhood compatibility, site development, physical
design components, and landscaping.
Certain projects that exceed Code allowances or otherwise require an additional level of review
will require either a Variance or Conditional Use Permit (CUP). These applications are heard by
the Planning Commission. If the project also requires Design Review, the Planning Commission
will review both actions. City staff tries to work with applicants ahead of time to determine the
feasibility of their proposed project. Staff tries to guide applicants toward a solution that has the
best chances of approval. Depending on the complexity of the project, initial Community
Development Department review for new construction requiring Design Review Committee (DRC)
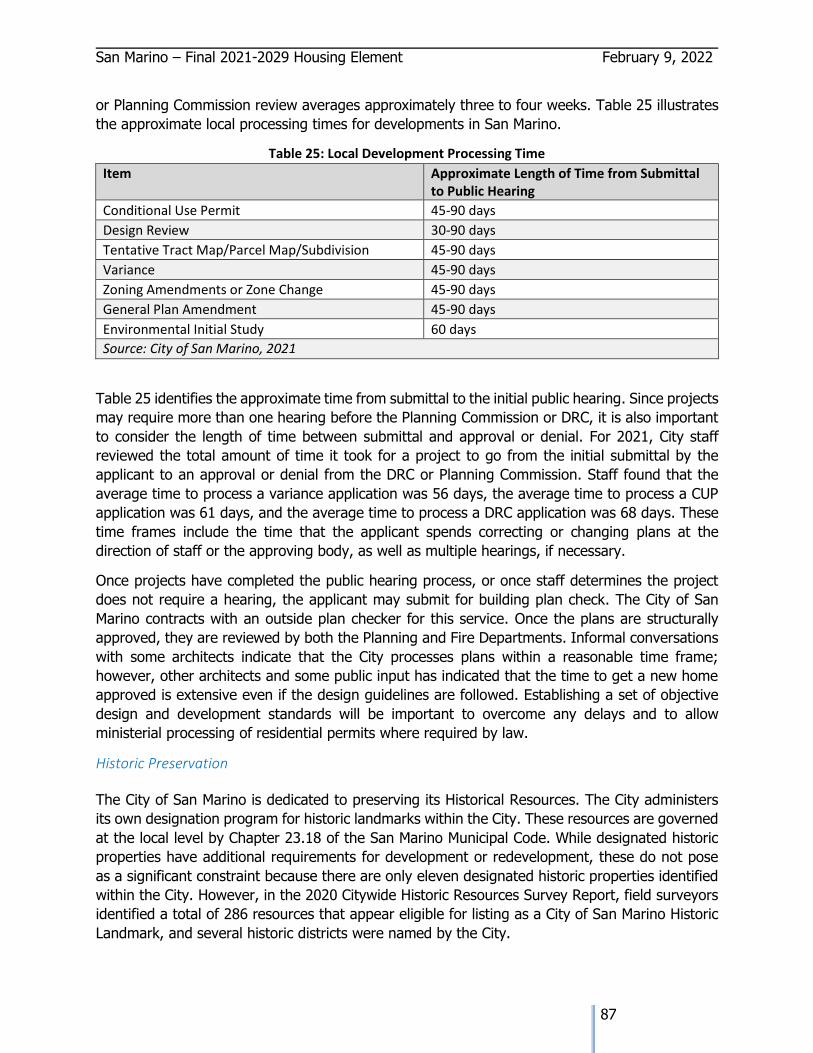
San Marino – Final 2021-2029 Housing Element February 9, 2022
87
or Planning Commission review averages approximately three to four weeks. Table 25 illustrates
the approximate local processing times for developments in San Marino.
Table 25: Local Development Processing Time
Item Approximate Length of Time from Submittal to Public Hearing
Conditional Use Permit 45-90 days
Design Review 30-90 days
Tentative Tract Map/Parcel Map/Subdivision 45-90 days
Variance 45-90 days
Zoning Amendments or Zone Change 45-90 days
General Plan Amendment 45-90 days
Environmental Initial Study 60 days
Source: City of San Marino, 2021
Table 25 identifies the approximate time from submittal to the initial public hearing. Since projects
may require more than one hearing before the Planning Commission or DRC, it is also important
to consider the length of time between submittal and approval or denial. For 2021, City staff
reviewed the total amount of time it took for a project to go from the initial submittal by the
applicant to an approval or denial from the DRC or Planning Commission. Staff found that the
average time to process a variance application was 56 days, the average time to process a CUP
application was 61 days, and the average time to process a DRC application was 68 days. These
time frames include the time that the applicant spends correcting or changing plans at the
direction of staff or the approving body, as well as multiple hearings, if necessary.
Once projects have completed the public hearing process, or once staff determines the project
does not require a hearing, the applicant may submit for building plan check. The City of San
Marino contracts with an outside plan checker for this service. Once the plans are structurally
approved, they are reviewed by both the Planning and Fire Departments. Informal conversations
with some architects indicate that the City processes plans within a reasonable time frame;
however, other architects and some public input has indicated that the time to get a new home
approved is extensive even if the design guidelines are followed. Establishing a set of objective
design and development standards will be important to overcome any delays and to allow
ministerial processing of residential permits where required by law.
Historic Preservation
The City of San Marino is dedicated to preserving its Historical Resources. The City administers
its own designation program for historic landmarks within the City. These resources are governed
at the local level by Chapter 23.18 of the San Marino Municipal Code. While designated historic
properties have additional requirements for development or redevelopment, these do not pose
as a significant constraint because there are only eleven designated historic properties identified
within the City. However, in the 2020 Citywide Historic Resources Survey Report, field surveyors
identified a total of 286 resources that appear eligible for listing as a City of San Marino Historic
Landmark, and several historic districts were named by the City.
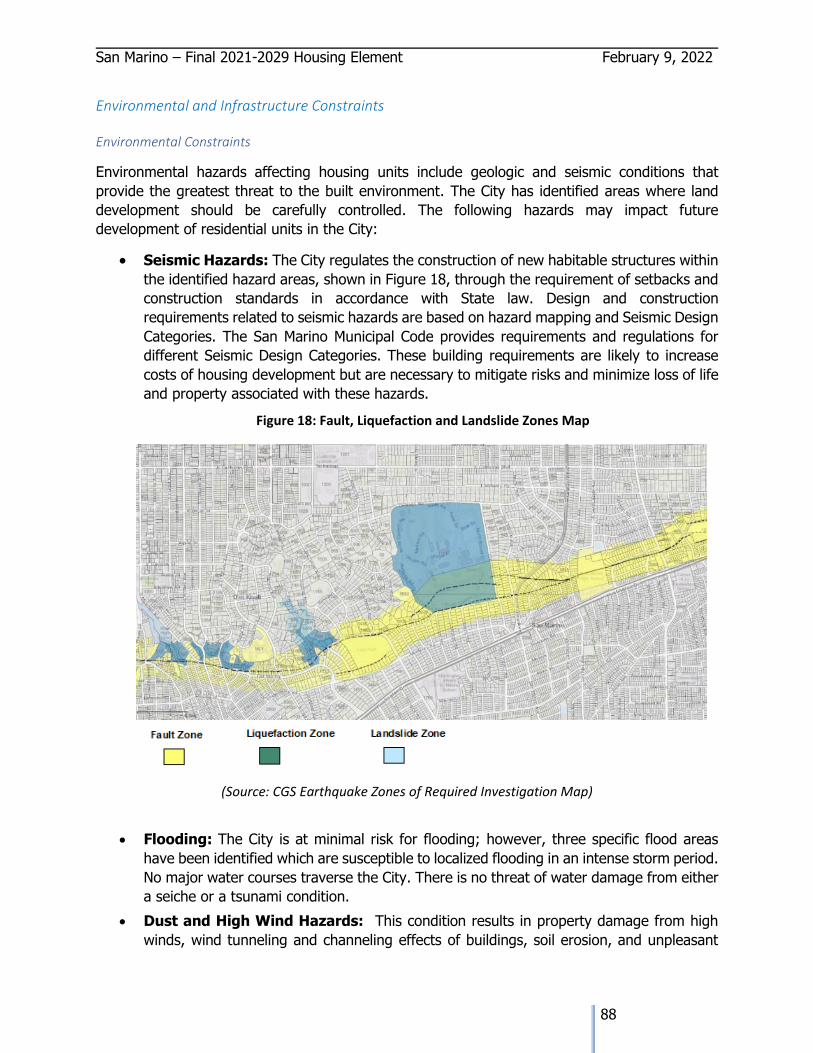
San Marino – Final 2021-2029 Housing Element February 9, 2022
88
Environmental and Infrastructure Constraints
Environmental Constraints
Environmental hazards affecting housing units include geologic and seismic conditions that
provide the greatest threat to the built environment. The City has identified areas where land
development should be carefully controlled. The following hazards may impact future
development of residential units in the City:
• Seismic Hazards: The City regulates the construction of new habitable structures within
the identified hazard areas, shown in Figure 18, through the requirement of setbacks and
construction standards in accordance with State law. Design and construction
requirements related to seismic hazards are based on hazard mapping and Seismic Design
Categories. The San Marino Municipal Code provides requirements and regulations for
different Seismic Design Categories. These building requirements are likely to increase
costs of housing development but are necessary to mitigate risks and minimize loss of life
and property associated with these hazards.
(Source: CGS Earthquake Zones of Required Investigation Map)
• Flooding: The City is at minimal risk for flooding; however, three specific flood areas
have been identified which are susceptible to localized flooding in an intense storm period.
No major water courses traverse the City. There is no threat of water damage from either
a seiche or a tsunami condition.
• Dust and High Wind Hazards: This condition results in property damage from high
winds, wind tunneling and channeling effects of buildings, soil erosion, and unpleasant
Figure 18: Fault, Liquefaction and Landslide Zones Map
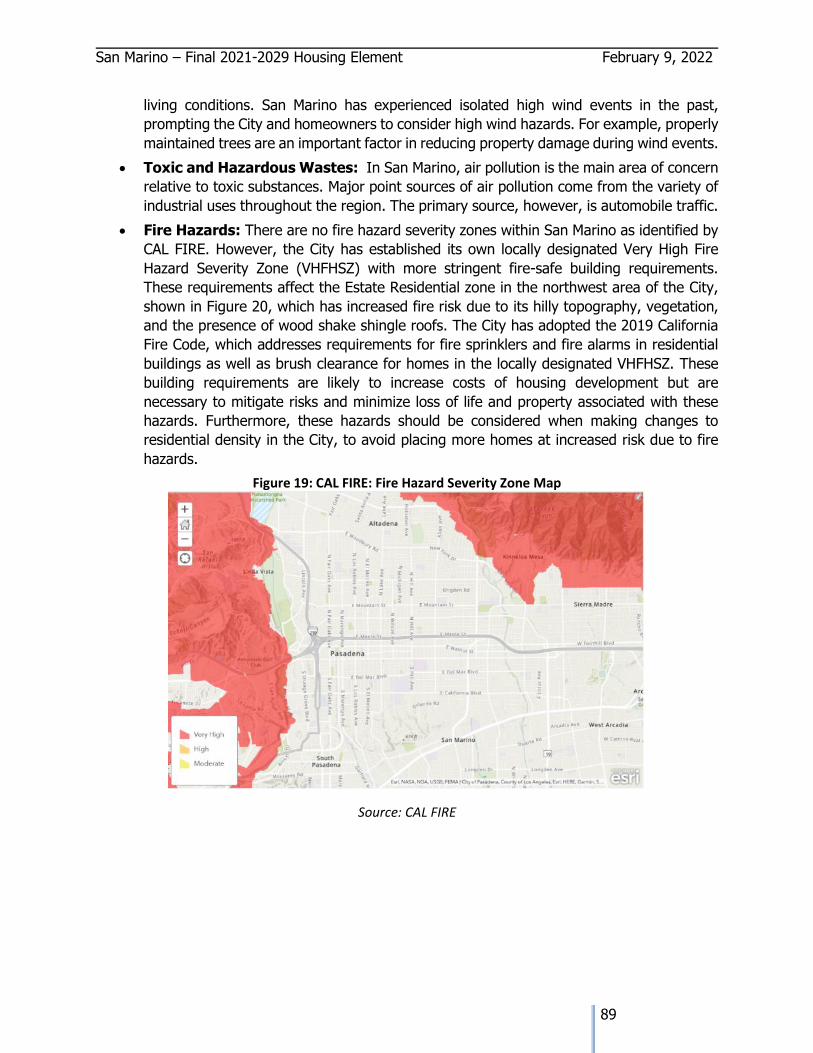
San Marino – Final 2021-2029 Housing Element February 9, 2022
89
living conditions. San Marino has experienced isolated high wind events in the past,
prompting the City and homeowners to consider high wind hazards. For example, properly
maintained trees are an important factor in reducing property damage during wind events.
• Toxic and Hazardous Wastes: In San Marino, air pollution is the main area of concern
relative to toxic substances. Major point sources of air pollution come from the variety of
industrial uses throughout the region. The primary source, however, is automobile traffic.
• Fire Hazards: There are no fire hazard severity zones within San Marino as identified by
CAL FIRE. However, the City has established its own locally designated Very High Fire
Hazard Severity Zone (VHFHSZ) with more stringent fire-safe building requirements.
These requirements affect the Estate Residential zone in the northwest area of the City,
shown in Figure 20, which has increased fire risk due to its hilly topography, vegetation,
and the presence of wood shake shingle roofs. The City has adopted the 2019 California
Fire Code, which addresses requirements for fire sprinklers and fire alarms in residential
buildings as well as brush clearance for homes in the locally designated VHFHSZ. These
building requirements are likely to increase costs of housing development but are
necessary to mitigate risks and minimize loss of life and property associated with these
hazards. Furthermore, these hazards should be considered when making changes to
residential density in the City, to avoid placing more homes at increased risk due to fire
hazards.
Figure 19: CAL FIRE: Fire Hazard Severity Zone Map
Source: CAL FIRE
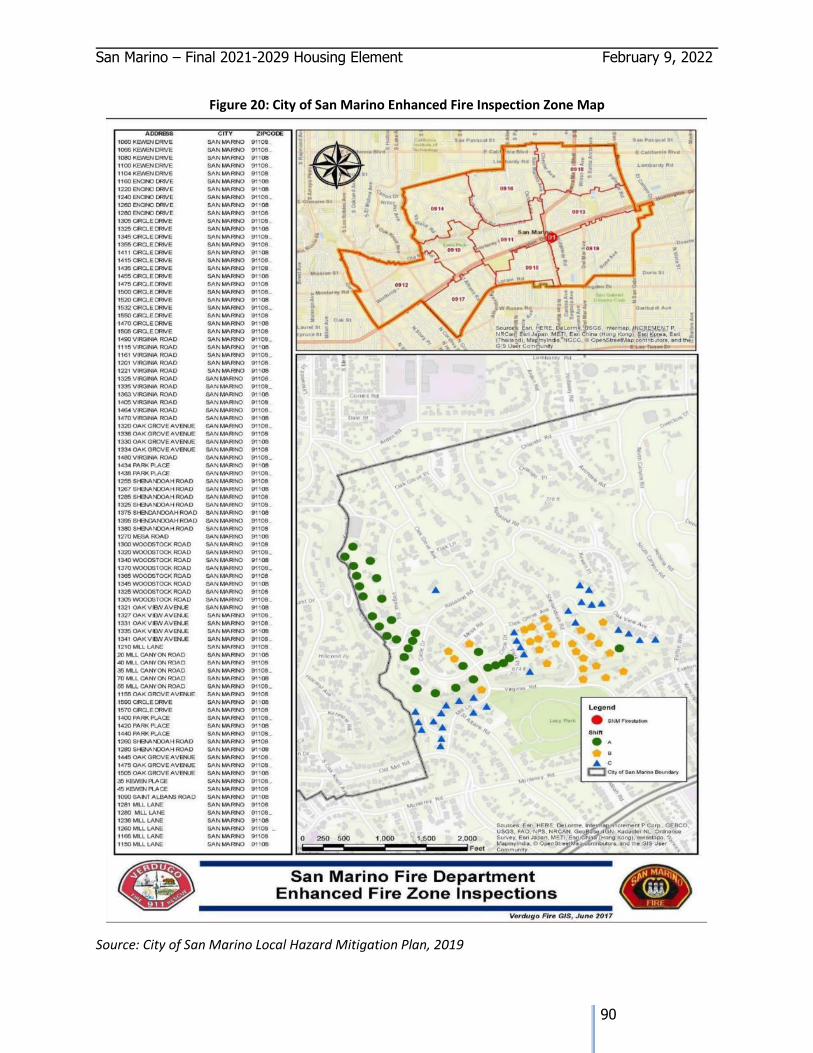
San Marino – Final 2021-2029 Housing Element February 9, 2022
90
Figure 20: City of San Marino Enhanced Fire Inspection Zone Map
Source: City of San Marino Local Hazard Mitigation Plan, 2019
San Marino – Final 2021-2029 Housing Element February 9, 2022
91
• Noise: Residential uses are considered a noise-sensitive use rather than a noise-
generating use and are the most sensitive to loud noise. The principal noise sources in
San Marino generate from local traffic, and noise measurement taken in 2021 indicate
that traffic noise levels have not increased over the last ten years. Noise is not considered
a significant problem in the City. Title 24 of the California Code of Regulations establishes
an interior noise standard of 45 dB(A) as suitable for residential spaces; this can typically
be achieved through standard construction methods.
Infrastructure Constraints
San Marino is a fully developed city and there are very few on or off-site improvements that are
required as part of the development of housing. Most housing construction involves the demolition
of an existing housing unit and the construction of a replacement unit, meaning all infrastructure
is already in place. As part of the building permit process, the City will occasionally require the
provision of on-site and off-site improvements necessitated by the development, such as
improvements to curbs and gutters, alleys, streets, sidewalks, streetlights, and utility
undergrounding. The cost of such improvements may increase the cost of development, which
would ultimately be passed through to future tenants or owners. While these costs may not render
a project infeasible, they contribute to the range of factors that affect the affordability of a project.
• Energy: Compliance with Title 24 of the California Administrative Code on the use of
energy efficient appliances and insulation has reduced energy demand stemming from
new residential development. Title 24, Part 6, California Energy Efficiency Standards, is a
set of requirements for energy conservation, green design, construction maintenance,
safety, and accessibility. Title 24 was published by the California Building Standards Code
and applies to all buildings in California, not just state-owned buildings and requires all
residential construction to meet minimum energy conservation standards through either
a prescriptive or performance-based approach. The former approach requires each
individual component of a building to meet an identified minimum energy requirement.
The performance approach, on the other hand, allows developers to choose a range of
measures which, in total, meet specified energy conservation targets. Title 24 regulations
and requirements are enforced when an applicant pulls a building permit for a proposed
project and have plans reviewed or a building inspected.
In addition to Title 24, all residential projects are required to meet state building codes,
which also include energy conservation standards. The California Building Standards
Commission adopted the California Building Codes based on model codes produced by
various professional organizations.
Promoting energy conservation has become a consistent theme in regulations, green
building practices, and general business operations. For San Marino, opportunities flourish
to promote energy-efficient practices in the siting, design, construction, and renovation of
housing stock. These practices not only respond to regulatory requirements, but also can
generate significant community, environmental, and economic benefits and do not
constitute constraints on housing development.
• Water: The California America Water Company provides water services for the City of
San Marino. Adequate water is available to serve existing and projected residences
San Marino – Final 2021-2029 Housing Element February 9, 2022
92
through 2021 and do not pose a constraint to development. See Section 3.6.1 for
additional discussion regarding infrastructure available to support residential
development.
4.5 FAIR HOUSING ANALYSIS
4.5.1 Introduction and Overview of AB 686
Assembly Bill 686 (Affirmatively Furthering Fair Housing, or AFFH) was adopted into law in 2018
and became effective on January 1, 2019. The law requires state and local agencies to take
proactive measures to correct any housing inequalities related to race, national origin, color,
ancestry, sex, marital status, disability, religion, or other protected characteristics. Agencies must
ensure that their laws and programs affirmatively further fair housing, and that they take no
actions that do not do so.
Under State law, affirmatively furthering fair housing, or AFFH, means “taking meaningful actions,
in addition to combatting discrimination, which overcome patterns of segregation and foster
inclusive communities free from barriers that restrict access to opportunity based on protected
characteristics.” Agencies must include in their Housing Elements a program that promotes fair
housing opportunities for all persons. In the context of a community’s housing needs, AFFH is not
just about the number of units needed, but also about where the units are located and who has
access to them..
AB 686 requires that the City adopt programs to overcome and reverse this pattern of exclusion,
and to identify locations for affordable housing through the AFFH lens. To do this, programs are
included that change the zoning to allow for all types of housing, including the multi-family
apartments and duplexes that have previously been banned in the City. Additionally, the location
of potential housing sites to meet the City’s lower-income RHNA is considered through an equity
lens, not only by choosing locations in areas throughout the City but also by including to promote
the development of duplexes. ADUs, and affordable JADUs in all the City’s exclusive residential
neighborhoods. Section 2 includes the policies and programs to reverse exclusionary zoning and
to affirmatively further fair housing; Section 3 contains the sites location information and maps.
As HCD guidance for fair housing assessments was released after the first administrative draft of
the Housing Element Update was complete, this section of the housing element was updated and
distributed separately for stakeholder input and public outreach. AB 686 makes certain
requirements for the analysis of fair housing issues. At the time of this draft, HCD guidance was
to provide analysis in five different subsections: enforcement and outreach capacity, segregation
and integration patterns and trends, disparities in access to opportunity, disproportionate housing
needs, and areas of concentration in poverty and affluence across racial and ethnic groups. For
the purpose of the required regional comparative analysis, the Assessment of Fair Housing will
include data for the San Gabriel Valley Council of Governments, the SCAG subregion of which the
City of San Marino is included, Los Angeles County, or the SCAG region overall.
San Marino – Final 2021-2029 Housing Element February 9, 2022
93
4.5.2 Summary of Fair Housing Issues and Contributing Factors
San Marino is more racially diverse than the average U.S. city. While there is a somewhat greater
White population in the northwestern part of the City and a slightly greater Asian population in
the southeastern part of the City, there are no areas of ethnic or economic concentration. Median
incomes are high and fairly stable throughout the City, as is the racial mix of its citizens. While
there are a considerable number of lower-income senior households in San Marino, most (89.2%)
own their homes and are not concentrated in any area or neighborhood. It is a well-integrated
community, and the entire City is designated as an Area of Opportunity. This designation is based
on the consideration of factors affecting the quality of life and health outcomes including
educational enrollment and attainment; employment rates; lack of overcrowding in housing or
overpayment for housing costs; transportation costs; and environmental health. However, the
City has faced constraints to providing affordable housing choices. Contributing factors to Fair
Housing Issues include:
• Community Opposition to Affordable Housing
• Lack of Available Developable Land/Built-out nature of City
• Lack of Affordable Housing Choices
• Past History of Exclusionary Practices (i.e., exclusive, single-family zoning)
Community Opposition to Affordable Housing
During outreach for the Housing Element update, comments opposing additional development
were received. The opposition cited concerns regarding the environmental (Traffic, Noise,
Crowding, Aesthetics) impacts associated with increased density in San Marino. Comments also
cited concerns for the loss of the quality of life and the historic and open space areas that make
up the San Marino community’s character.
Lack of Available Land
As detailed in Section 3.3, there are very few sites in San Marino with vacant land and fewer sites
with existing residential zoning. The City does not have zone districts that allow housing at
densities above 20 units per acre which is defined in Housing Law as appropriate for development
of affordable housing types.
Lack of Affordable Housing Choices
The City is notably more expensive than the surrounding areas, with median gross rents above
$3000 per month and most mortgages above $4000 per month. Although median household
incomes in San Marino are high compared to the surrounding areas, even moderate- and middle-
income households cannot afford a home in San Marino where the median sales price exceeds
$2 million. San Marino currently lacks homes for these households, which include young families
and first-time homebuyers, which perpetuates exclusivity and can lead to inequity.
San Marino – Final 2021-2029 Housing Element February 9, 2022
94
History of Exclusionary Practices
San Marino is almost entirely residential, with its built environment dominated by detached single-
family homes constructed primarily between the 1920s and the 1960s. As of 2021, there were no
areas zoned for multi-family residences, or for industry/manufacturing. Small areas on Huntington
Drive and Mission Street are zoned for commercial use, and the City has recently approved a
mixed-use project on a commercial street. While not intending to be exclusionary, San Marino’s
past prohibition of anything but single-family homes has had the effect of excluding persons who
do not have incomes high enough to live in the City. Because poverty occurs most often with
person of color, these practices have resulted in the exclusion of protected classes even though
they were not intended to.
San Marino’s rich and varied past that spans multiple eras of California history and is associated
with cultural and social themes that were definitive in the history of Los Angeles County and
Southern California. Since its 1913 incorporation, “the City envisioned itself as a residential
enclave for people of means, with zoning that ensured minimal commercial development and no
industry or multi-family residences” (Source: San Marino Historic Resources Survey Report,
October 2020). This exclusive designation has played out in the City’s zoning since its
establishment.
In its earliest days of development, zoning in San Marino was so strict that most commercial uses
and even churches were restricted. To ensure that property valuation would remain high,
developers established expensive minimum home building costs, and racially restrictive covenants
were incorporated into home deed sales – a practice that was common throughout Southern
California and much of the country in the 1920s. These practices, coupled with the formation of
the national Homeowner’s Loan Corporation (HOLC) in 1933 and passage of the National Housing
Act (NHA), established systemic redlining practices throughout the Los Angeles region, including
in San Marino. This practice led to the physical development pattern and exclusive single-family
feel that is still experienced throughout the City today.
This practiceError! Reference source not found. illustrates how San Marino was graded “Best” b
y the Homeowner’s Loan Corporation. This grade was given to upper- or upper-middle-class White
neighborhoods that HOLC defined as posing minimal risk for banks and other mortgage lenders,
as they were "ethnically homogeneous" and had room to be further developed. Banks received
federal backing to lend money for mortgages based on these grades. Many banks simply refused
to lend to areas with the lowest grade, making it impossible for people in many areas to become
homeowners. While this type of neighborhood classification is no longer legal thanks to the Fair
Housing Act of 1968, the effects of disinvestment due to redlining are still clearly observable today
(Source: University of Richmond's Digital Scholarship Lab, 2021).
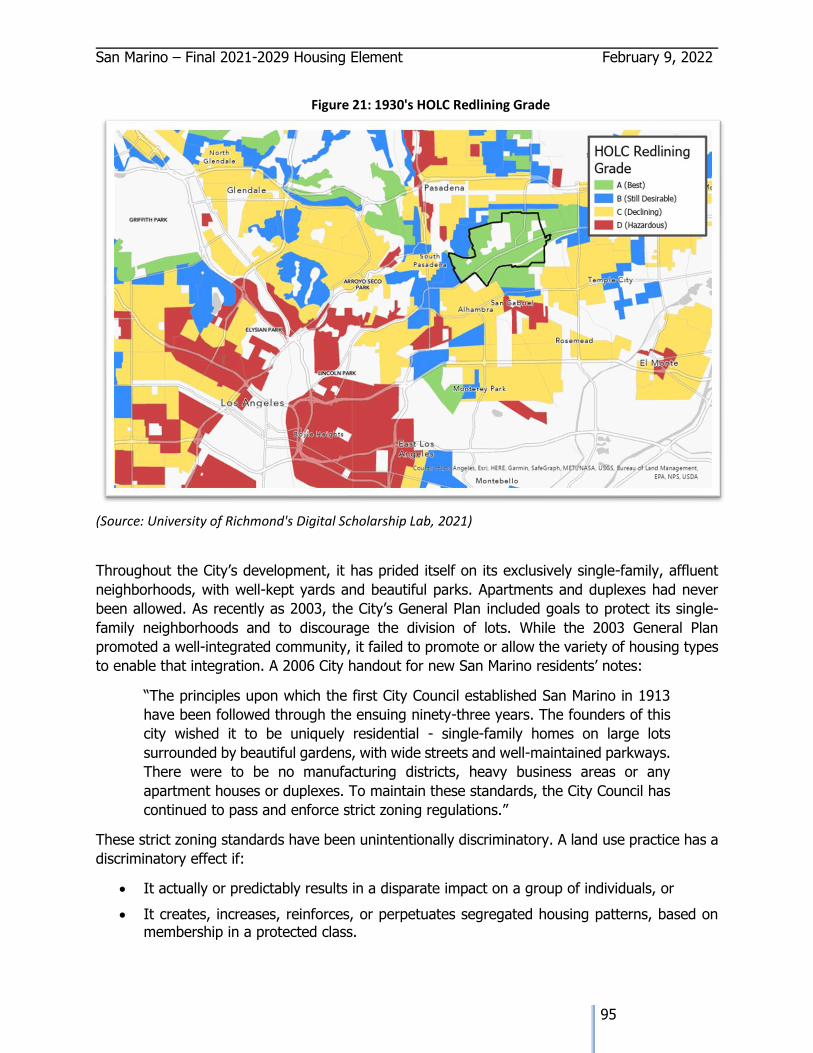
San Marino – Final 2021-2029 Housing Element February 9, 2022
95
Figure 21: 1930's HOLC Redlining Grade
(Source: University of Richmond's Digital Scholarship Lab, 2021)
Throughout the City’s development, it has prided itself on its exclusively single-family, affluent
neighborhoods, with well-kept yards and beautiful parks. Apartments and duplexes had never
been allowed. As recently as 2003, the City’s General Plan included goals to protect its single-
family neighborhoods and to discourage the division of lots. While the 2003 General Plan
promoted a well-integrated community, it failed to promote or allow the variety of housing types
to enable that integration. A 2006 City handout for new San Marino residents’ notes:
“The principles upon which the first City Council established San Marino in 1913
have been followed through the ensuing ninety-three years. The founders of this
city wished it to be uniquely residential - single-family homes on large lots
surrounded by beautiful gardens, with wide streets and well-maintained parkways.
There were to be no manufacturing districts, heavy business areas or any
apartment houses or duplexes. To maintain these standards, the City Council has
continued to pass and enforce strict zoning regulations.”
These strict zoning standards have been unintentionally discriminatory. A land use practice has a
discriminatory effect if:
• It actually or predictably results in a disparate impact on a group of individuals, or
• It creates, increases, reinforces, or perpetuates segregated housing patterns, based on membership in a protected class.
San Marino – Final 2021-2029 Housing Element February 9, 2022
96
By definition, single-family zoning is exclusionary when it occurs to the exclusion of other types
of residential use. Whether intended or not, San Marino’s past prohibition of anything but single-
family homes had the effect of excluding persons who do not have incomes high enough to live
in the City. Because poverty occurs most often with person of color, these practices have resulted
in the exclusion of protected classes even though they were never intended to. AB 686 requires
that the City adopt programs to overcome and reverse this pattern of exclusion, and to identify
housing sites through the Affirmatively Furthering Fair Housing lens.
Reversing Exclusionary Zoning Practices
The approach taken within this Housing Element update to address past exclusionary zoning
practices and to affirmatively further fair housing are two-fold: First, programs are included that
change the zoning to allow for all types of housing, including the multi-family apartments and
duplexes that have previously been banned in the City; and secondly, the location of potential
housing sites to meet the City’s lower-income RHNA is considered through an equity lens, not
only by choosing locations in areas throughout the City but also by including to promote the
development of duplexes. ADUs, and affordable JADUs in all of the City’s exclusive residential
neighborhoods. Section 2 includes the policies and programs to reverse exclusionary zoning and
to affirmatively further fair housing; Section 3 contains the sites location information and maps
4.5.3 Fair Housing Enforcement and Public Outreach
Federal and State Regulations and Enforcement
Federal, state, and local laws make it illegal to discriminate based on a person’s protected class.
At the federal level, the Fair Housing Act prohibits discrimination on the basis of race, color,
religion, sex, national origin, familial status, and disability. In California, the Fair Employment and
Housing Act (FEHA) and the Unruh Civil Rights Act also make it illegal to discriminate based on
marital status, ancestry, sexual orientation, source of income, or any other arbitrary forms of
discrimination. Federal and state fair housing law both prohibit intentional housing discrimination
and prohibit any actions or policies which may have a discriminatory effect on a protected group
of people. Examples of policies or practices with discriminatory effects include exclusionary zoning
and land use policies, mortgage lending and insurance practices, and residential rules that may
indirectly inhibit religious or cultural expression. Both the state and the federal government have
structures in place to process and investigate fair housing complaints. In California, the
Department of Fair Employment and Housing (DFEH) maintains the authority to investigate
complaints of discrimination related to employment, housing, public accommodations and hate
violence. The agency processes complaints online, over the phone and by mail. At a federal level,
HUD also processes, investigates, and enforces any complaints in violation of the Federal Fair
Housing Act.
Fair Housing Education and Enforcement at a Regional Level
Several organizations provide fair housing services in Los Angeles County, including outreach and
education, complaint intake, and testing and enforcement activities, for both providers and
consumers of housing. These organizations include the U.S. Department of Housing and Urban
San Marino – Final 2021-2029 Housing Element February 9, 2022
97
Development (HUD), the California Department of Fair Employment and Housing (DFEH), which
exists as substantially equivalent agency to HUD in the state, and the Housing Rights Center
(HRC), which primarily operates in Los Angeles County. The HRC receives a multi-year grant from
HUD to conduct systemic testing in areas within Los Angeles County where statistics point to any
form of discrimination covered by applicable fair housing laws and, in particular, persistent
housing discrimination based on race, national origin, familial status and disability. HRC also
provides intake of allegations of housing discrimination and provides resolution for housing
discrimination, including mediation. Other activities include: systemic rental tests; design and
construction inspections; accessibility surveys of tenants; referring tests that uncover
discriminatory activity to HUD; litigation for appropriate enforcement action; fair housing
counseling, investigation, and resolution for complainants; intakes of fair housing queries; training
of new testers; refresher courses; reasonable accommodation/modification requests for the
disabled; monitoring fair housing settlement agreements and zoning changes; as well as a host
of education and outreach activities.
The Housing Authority of the County of Los Angeles (HACoLA) provides fair housing resources
for residents via its website, such as links to file complaints of a violation of fair housing, a link to
the Housing Rights Center, a link to HUD’s webpage on Fair Housing and Equal Opportunity, link
to the National Fair Housing Advocate Online blog, a copy of HACoLA’s non-discrimination policy,
and a link to information on the Assessment of Fair Housing.
Fair Housing Education and Enforcement at a Local Level
The City has a robust Code Enforcement policy, but it is not relevant to Fair Housing as it is mainly
focused on Code violations pertaining to the erection, construction, reconstruction, moving,
conversion, and alteration of buildings.
Fair Housing Complaints
According to data from HUD, there have been zero Fair Housing and Equal Opportunity complaints
in the City. The City does not prescribe to any practices or policies that would impede existing
fair housing laws and regulations. Should a Fair Housing or Equal Opportunity complaint arise,
the City will take all necessary actions to remedy the compliant and maintain compliance.
Public Housing
The City of San Marino does not currently have any public housing buildings in the City limits.
Likewise, there are no residents receiving housing choice vouchers.
Public Outreach
The 6th cycle Housing Element Update has been undertaken during the COVID-19 global
pandemic. Public outreach, which is the cornerstone of the preparation process, had to be
adjusted to allow and encourage meaningful public participation and input without the ability to
meet or gather in-person. Staff and consultants made use of multiple digital platforms to facilitate
the public input. Through community opinion surveys, stakeholder interviews, public workshops,
and continued correspondence with advocacy groups, service providers, and developers the City
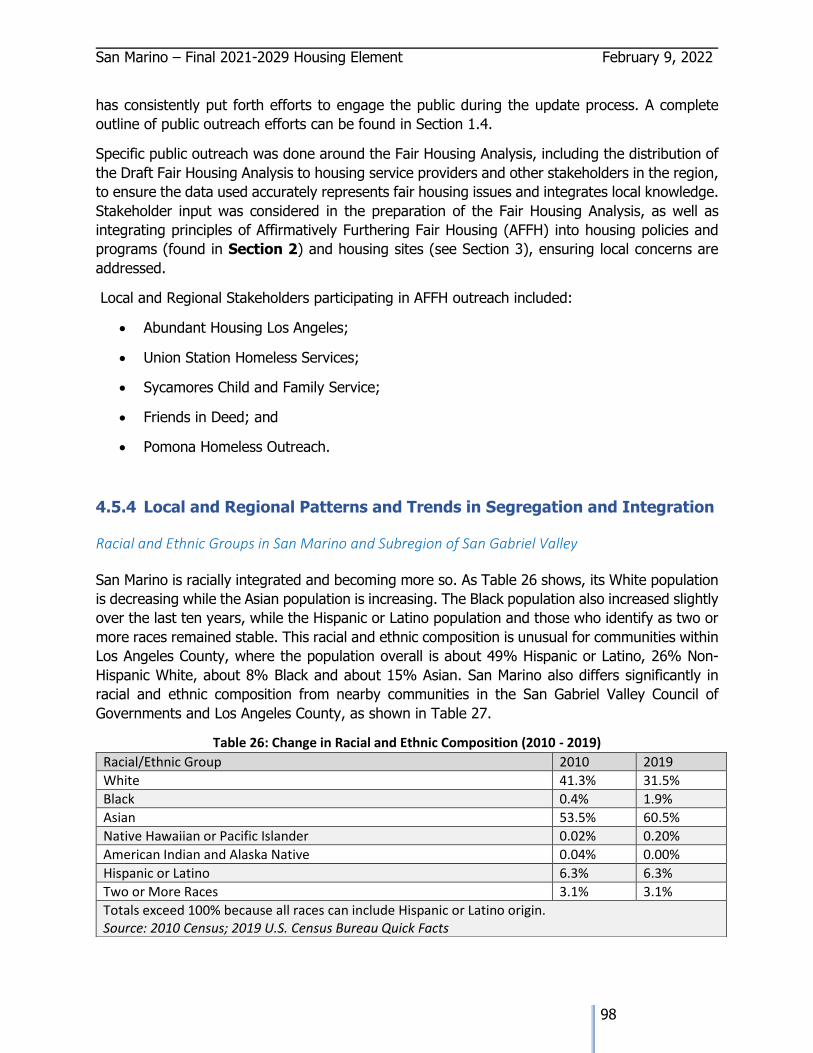
San Marino – Final 2021-2029 Housing Element February 9, 2022
98
has consistently put forth efforts to engage the public during the update process. A complete
outline of public outreach efforts can be found in Section 1.4.
Specific public outreach was done around the Fair Housing Analysis, including the distribution of
the Draft Fair Housing Analysis to housing service providers and other stakeholders in the region,
to ensure the data used accurately represents fair housing issues and integrates local knowledge.
Stakeholder input was considered in the preparation of the Fair Housing Analysis, as well as
integrating principles of Affirmatively Furthering Fair Housing (AFFH) into housing policies and
programs (found in Section 2) and housing sites (see Section 3), ensuring local concerns are
addressed.
Local and Regional Stakeholders participating in AFFH outreach included:
• Abundant Housing Los Angeles;
• Union Station Homeless Services;
• Sycamores Child and Family Service;
• Friends in Deed; and
• Pomona Homeless Outreach.
4.5.4 Local and Regional Patterns and Trends in Segregation and Integration
Racial and Ethnic Groups in San Marino and Subregion of San Gabriel Valley
San Marino is racially integrated and becoming more so. As Table 26 shows, its White population
is decreasing while the Asian population is increasing. The Black population also increased slightly
over the last ten years, while the Hispanic or Latino population and those who identify as two or
more races remained stable. This racial and ethnic composition is unusual for communities within
Los Angeles County, where the population overall is about 49% Hispanic or Latino, 26% Non-
Hispanic White, about 8% Black and about 15% Asian. San Marino also differs significantly in
racial and ethnic composition from nearby communities in the San Gabriel Valley Council of
Governments and Los Angeles County, as shown in Table 27.
Table 26: Change in Racial and Ethnic Composition (2010 - 2019)
Racial/Ethnic Group 2010 2019
White 41.3% 31.5%
Black 0.4% 1.9%
Asian 53.5% 60.5%
Native Hawaiian or Pacific Islander 0.02% 0.20%
American Indian and Alaska Native 0.04% 0.00%
Hispanic or Latino 6.3% 6.3%
Two or More Races 3.1% 3.1%
Totals exceed 100% because all races can include Hispanic or Latino origin. Source: 2010 Census; 2019 U.S. Census Bureau Quick Facts
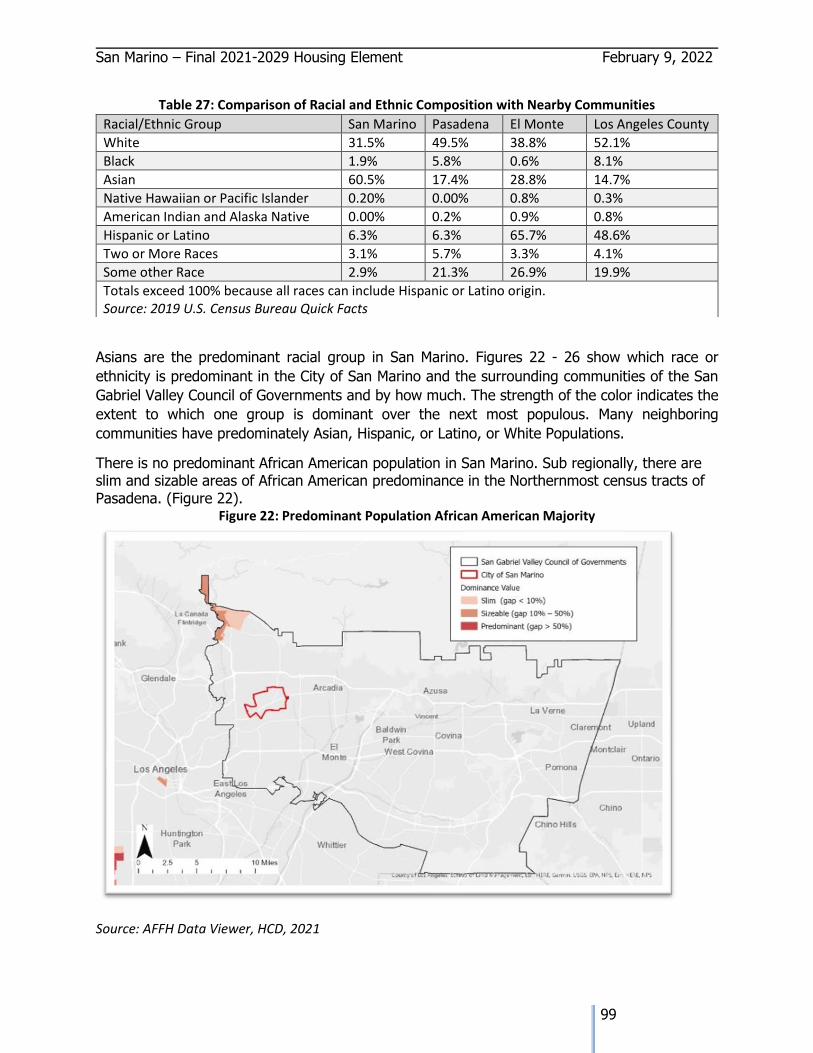
San Marino – Final 2021-2029 Housing Element February 9, 2022
99
Table 27: Comparison of Racial and Ethnic Composition with Nearby Communities
Asians are the predominant racial group in San Marino. Figures 22 - 26 show which race or
ethnicity is predominant in the City of San Marino and the surrounding communities of the San
Gabriel Valley Council of Governments and by how much. The strength of the color indicates the
extent to which one group is dominant over the next most populous. Many neighboring
communities have predominately Asian, Hispanic, or Latino, or White Populations.
There is no predominant African American population in San Marino. Sub regionally, there are slim and sizable areas of African American predominance in the Northernmost census tracts of Pasadena. (Figure 22).
Figure 22: Predominant Population African American Majority
Source: AFFH Data Viewer, HCD, 2021
Racial/Ethnic Group San Marino Pasadena El Monte Los Angeles County
White 31.5% 49.5% 38.8% 52.1%
Black 1.9% 5.8% 0.6% 8.1%
Asian 60.5% 17.4% 28.8% 14.7%
Native Hawaiian or Pacific Islander 0.20% 0.00% 0.8% 0.3%
American Indian and Alaska Native 0.00% 0.2% 0.9% 0.8%
Hispanic or Latino 6.3% 6.3% 65.7% 48.6%
Two or More Races 3.1% 5.7% 3.3% 4.1%
Some other Race 2.9% 21.3% 26.9% 19.9%
Totals exceed 100% because all races can include Hispanic or Latino origin. Source: 2019 U.S. Census Bureau Quick Facts
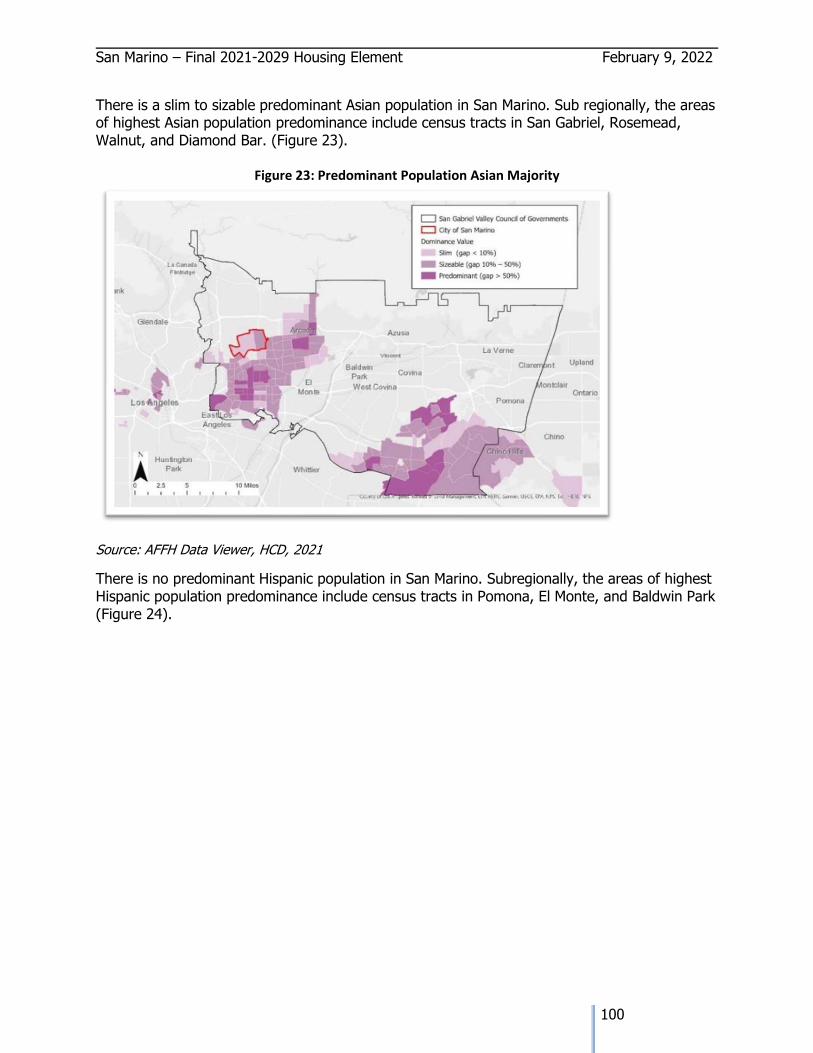
San Marino – Final 2021-2029 Housing Element February 9, 2022
100
There is a slim to sizable predominant Asian population in San Marino. Sub regionally, the areas of highest Asian population predominance include census tracts in San Gabriel, Rosemead, Walnut, and Diamond Bar. (Figure 23).
Figure 23: Predominant Population Asian Majority
Source: AFFH Data Viewer, HCD, 2021
There is no predominant Hispanic population in San Marino. Subregionally, the areas of highest Hispanic population predominance include census tracts in Pomona, El Monte, and Baldwin Park (Figure 24).
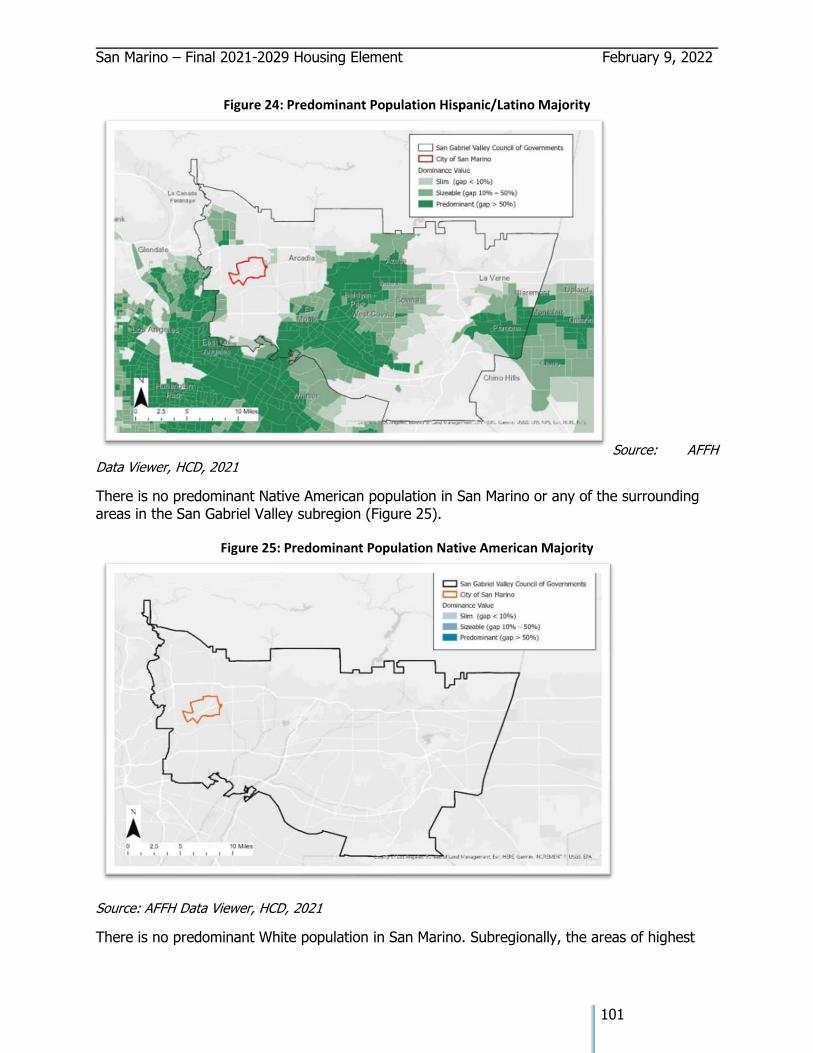
San Marino – Final 2021-2029 Housing Element February 9, 2022
101
Figure 24: Predominant Population Hispanic/Latino Majority
Source: AFFH
Data Viewer, HCD, 2021
There is no predominant Native American population in San Marino or any of the surrounding areas in the San Gabriel Valley subregion (Figure 25).
Figure 25: Predominant Population Native American Majority
Source: AFFH Data Viewer, HCD, 2021
There is no predominant White population in San Marino. Subregionally, the areas of highest
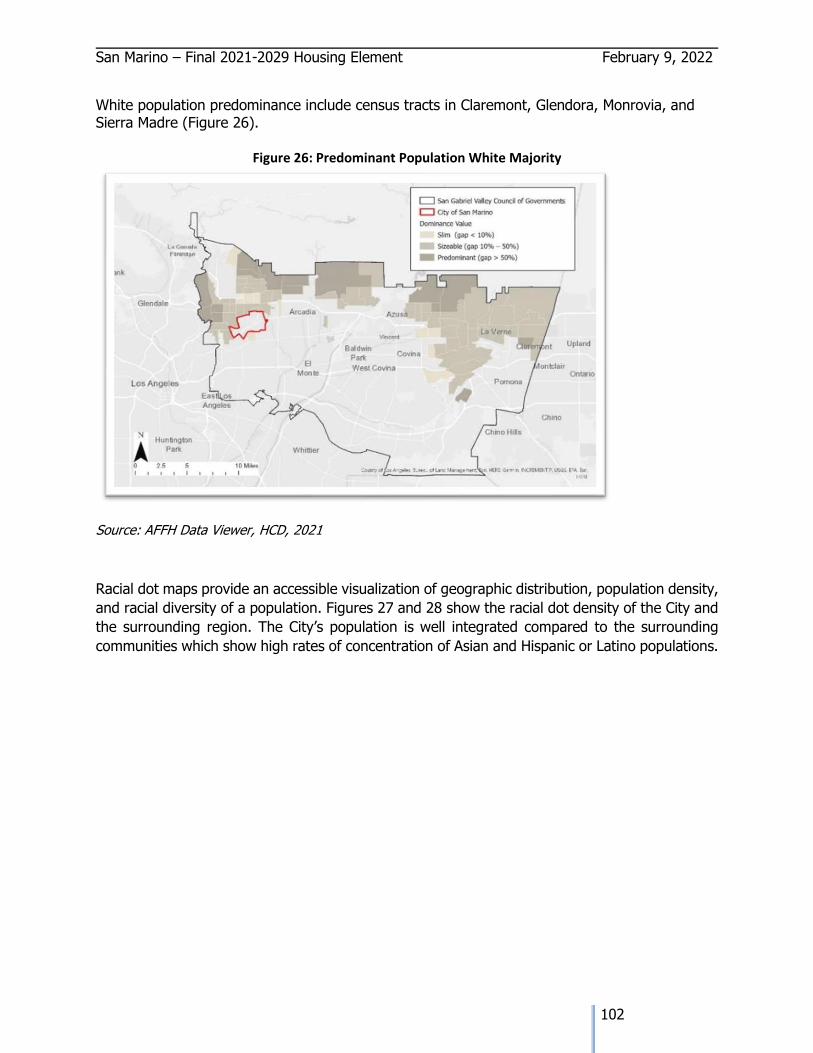
San Marino – Final 2021-2029 Housing Element February 9, 2022
102
White population predominance include census tracts in Claremont, Glendora, Monrovia, and Sierra Madre (Figure 26).
Figure 26: Predominant Population White Majority
Source: AFFH Data Viewer, HCD, 2021
Racial dot maps provide an accessible visualization of geographic distribution, population density,
and racial diversity of a population. Figures 27 and 28 show the racial dot density of the City and
the surrounding region. The City’s population is well integrated compared to the surrounding
communities which show high rates of concentration of Asian and Hispanic or Latino populations.
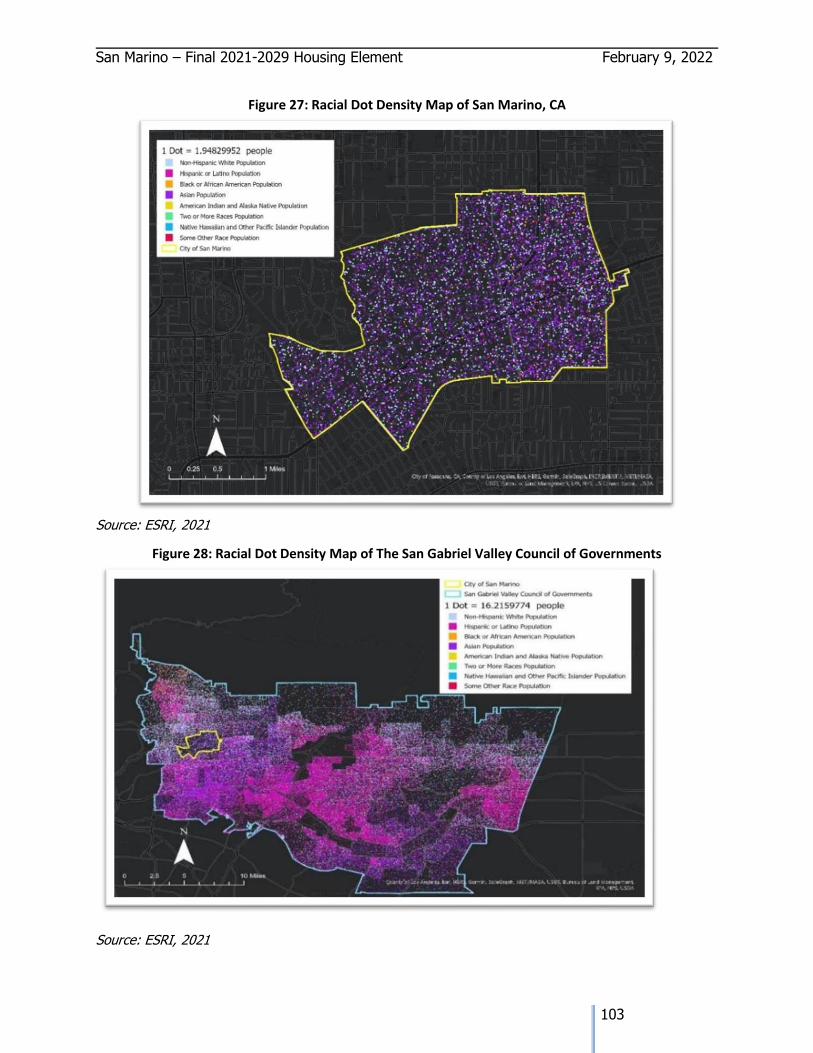
San Marino – Final 2021-2029 Housing Element February 9, 2022
103
Figure 27: Racial Dot Density Map of San Marino, CA
Source: ESRI, 2021
Figure 28: Racial Dot Density Map of The San Gabriel Valley Council of Governments
Source: ESRI, 2021
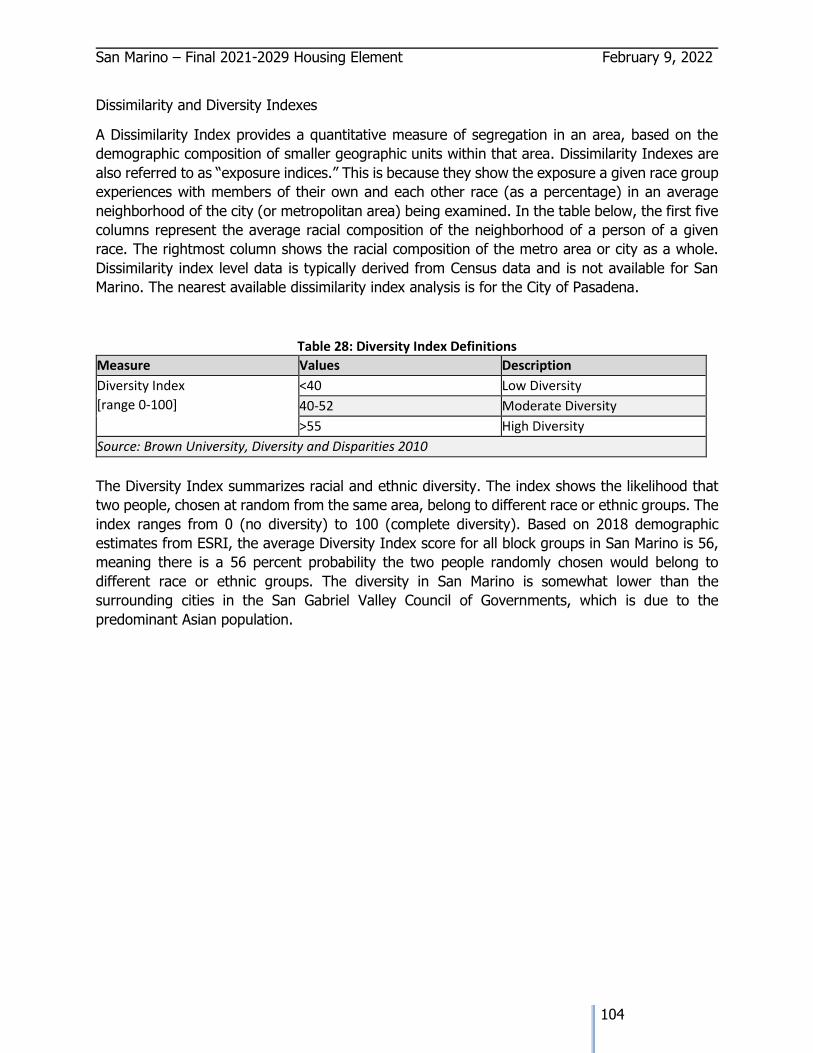
San Marino – Final 2021-2029 Housing Element February 9, 2022
104
Dissimilarity and Diversity Indexes
A Dissimilarity Index provides a quantitative measure of segregation in an area, based on the
demographic composition of smaller geographic units within that area. Dissimilarity Indexes are
also referred to as “exposure indices.” This is because they show the exposure a given race group
experiences with members of their own and each other race (as a percentage) in an average
neighborhood of the city (or metropolitan area) being examined. In the table below, the first five
columns represent the average racial composition of the neighborhood of a person of a given
race. The rightmost column shows the racial composition of the metro area or city as a whole.
Dissimilarity index level data is typically derived from Census data and is not available for San
Marino. The nearest available dissimilarity index analysis is for the City of Pasadena.
Table 28: Diversity Index Definitions
Measure Values Description
Diversity Index
[range 0-100]
<40 Low Diversity
40-52 Moderate Diversity
>55 High Diversity
Source: Brown University, Diversity and Disparities 2010
The Diversity Index summarizes racial and ethnic diversity. The index shows the likelihood that
two people, chosen at random from the same area, belong to different race or ethnic groups. The
index ranges from 0 (no diversity) to 100 (complete diversity). Based on 2018 demographic
estimates from ESRI, the average Diversity Index score for all block groups in San Marino is 56,
meaning there is a 56 percent probability the two people randomly chosen would belong to
different race or ethnic groups. The diversity in San Marino is somewhat lower than the
surrounding cities in the San Gabriel Valley Council of Governments, which is due to the
predominant Asian population.
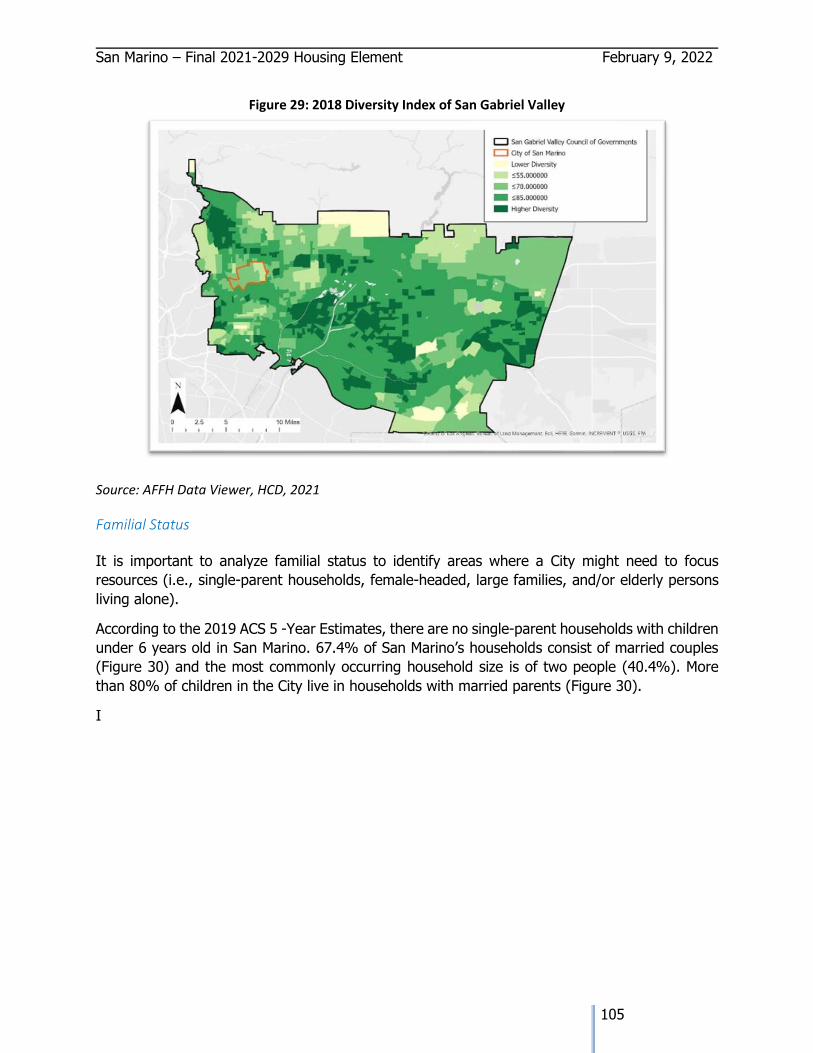
San Marino – Final 2021-2029 Housing Element February 9, 2022
105
Figure 29: 2018 Diversity Index of San Gabriel Valley
Source: AFFH Data Viewer, HCD, 2021
Familial Status
It is important to analyze familial status to identify areas where a City might need to focus
resources (i.e., single-parent households, female-headed, large families, and/or elderly persons
living alone).
According to the 2019 ACS 5 -Year Estimates, there are no single-parent households with children
under 6 years old in San Marino. 67.4% of San Marino’s households consist of married couples
(Figure 30) and the most commonly occurring household size is of two people (40.4%). More
than 80% of children in the City live in households with married parents (Figure 30).
I
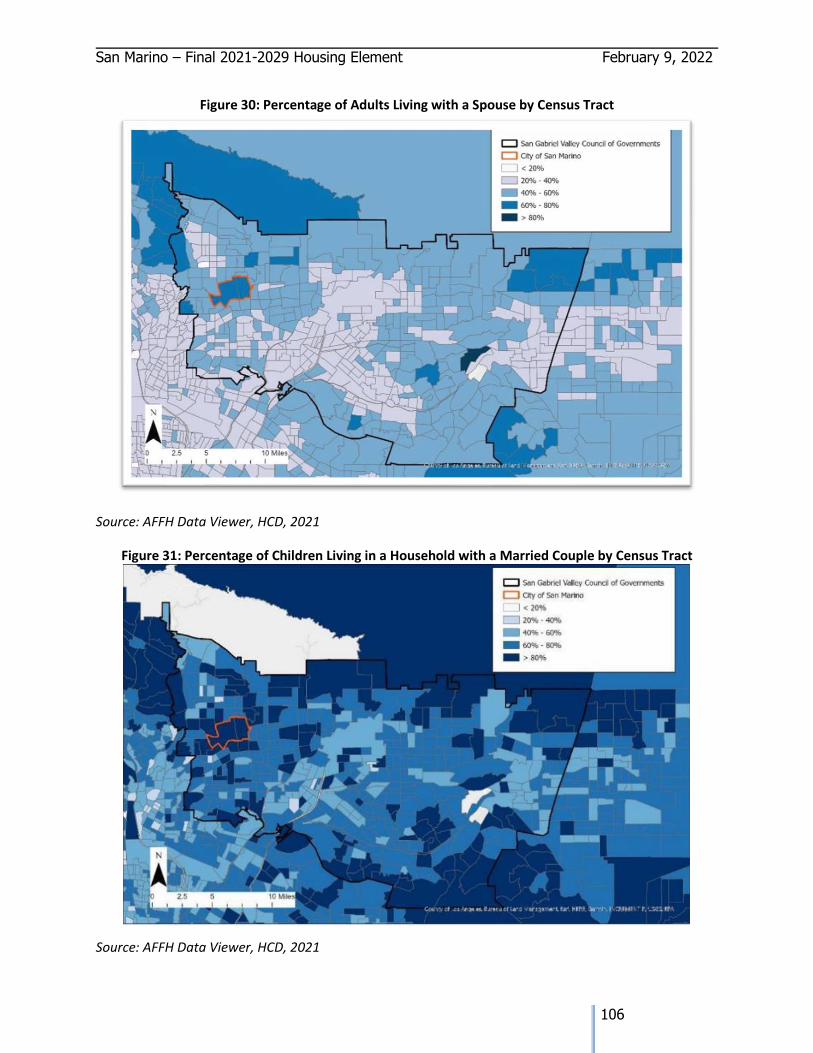
San Marino – Final 2021-2029 Housing Element February 9, 2022
106
Figure 30: Percentage of Adults Living with a Spouse by Census Tract
Source: AFFH Data Viewer, HCD, 2021
Figure 31: Percentage of Children Living in a Household with a Married Couple by Census Tract
Source: AFFH Data Viewer, HCD, 2021
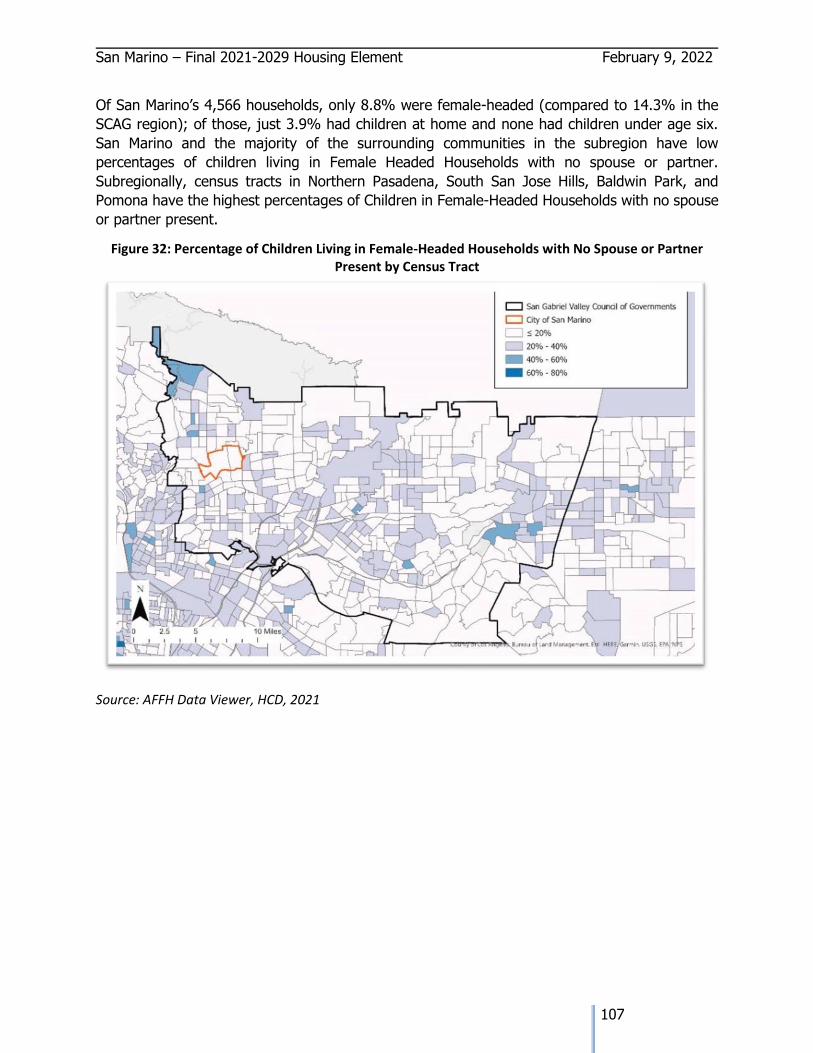
San Marino – Final 2021-2029 Housing Element February 9, 2022
107
Of San Marino’s 4,566 households, only 8.8% were female-headed (compared to 14.3% in the
SCAG region); of those, just 3.9% had children at home and none had children under age six.
San Marino and the majority of the surrounding communities in the subregion have low
percentages of children living in Female Headed Households with no spouse or partner.
Subregionally, census tracts in Northern Pasadena, South San Jose Hills, Baldwin Park, and
Pomona have the highest percentages of Children in Female-Headed Households with no spouse
or partner present.
Figure 32: Percentage of Children Living in Female-Headed Households with No Spouse or Partner Present by Census Tract
Source: AFFH Data Viewer, HCD, 2021
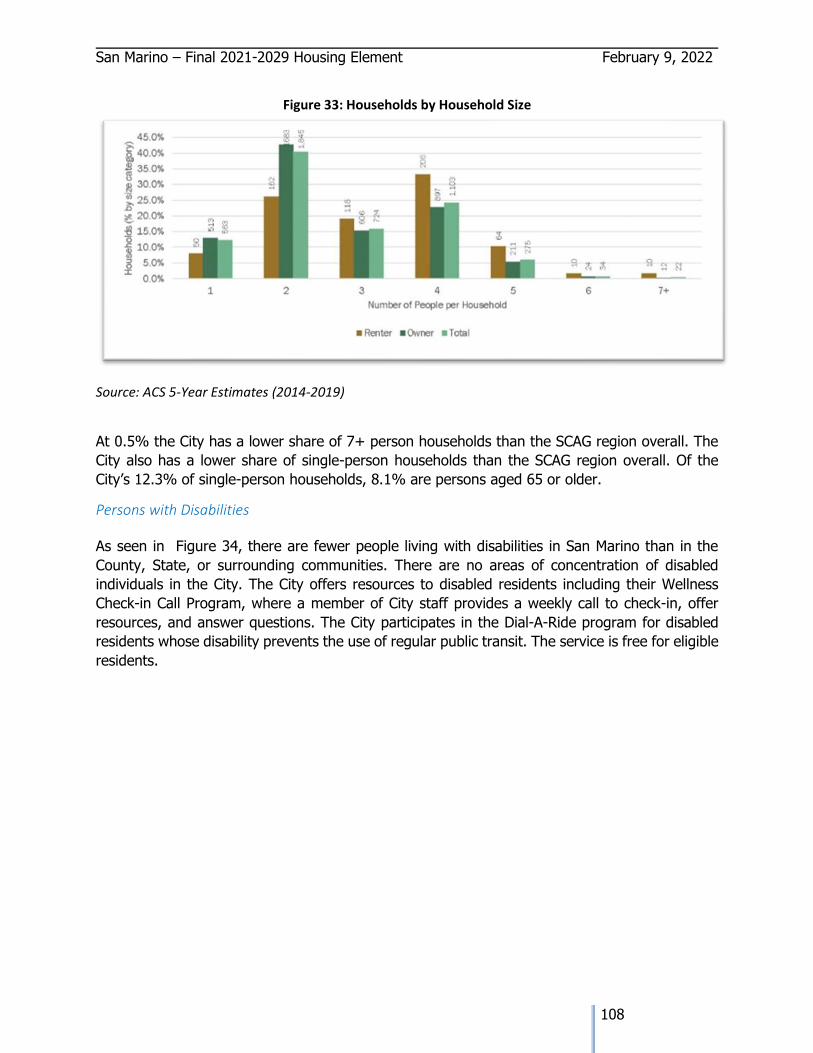
San Marino – Final 2021-2029 Housing Element February 9, 2022
108
Figure 33: Households by Household Size
Source: ACS 5-Year Estimates (2014-2019)
At 0.5% the City has a lower share of 7+ person households than the SCAG region overall. The
City also has a lower share of single-person households than the SCAG region overall. Of the
City’s 12.3% of single-person households, 8.1% are persons aged 65 or older.
Persons with Disabilities
As seen in Figure 34, there are fewer people living with disabilities in San Marino than in the
County, State, or surrounding communities. There are no areas of concentration of disabled
individuals in the City. The City offers resources to disabled residents including their Wellness
Check-in Call Program, where a member of City staff provides a weekly call to check-in, offer
resources, and answer questions. The City participates in the Dial-A-Ride program for disabled
residents whose disability prevents the use of regular public transit. The service is free for eligible
residents.
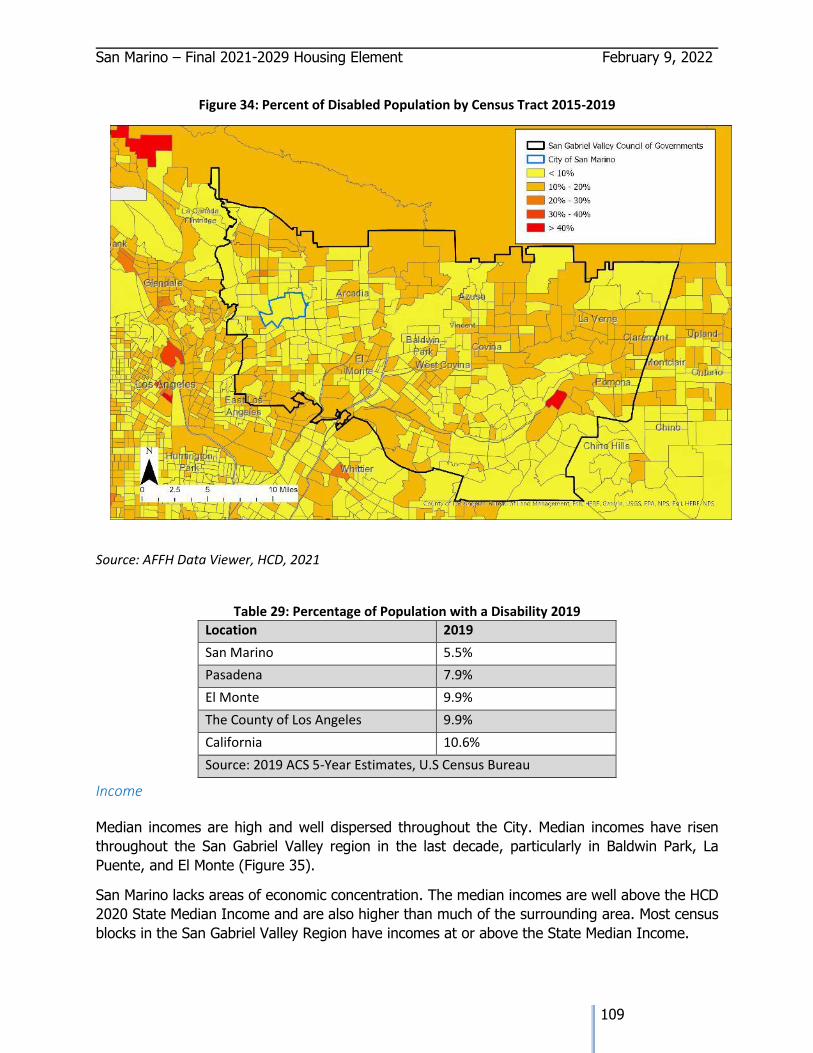
San Marino – Final 2021-2029 Housing Element February 9, 2022
109
Figure 34: Percent of Disabled Population by Census Tract 2015-2019
Source: AFFH Data Viewer, HCD, 2021
Table 29: Percentage of Population with a Disability 2019
Location 2019
San Marino 5.5%
Pasadena 7.9%
El Monte 9.9%
The County of Los Angeles 9.9%
California 10.6%
Source: 2019 ACS 5-Year Estimates, U.S Census Bureau
Income
Median incomes are high and well dispersed throughout the City. Median incomes have risen
throughout the San Gabriel Valley region in the last decade, particularly in Baldwin Park, La
Puente, and El Monte (Figure 35).
San Marino lacks areas of economic concentration. The median incomes are well above the HCD
2020 State Median Income and are also higher than much of the surrounding area. Most census
blocks in the San Gabriel Valley Region have incomes at or above the State Median Income.
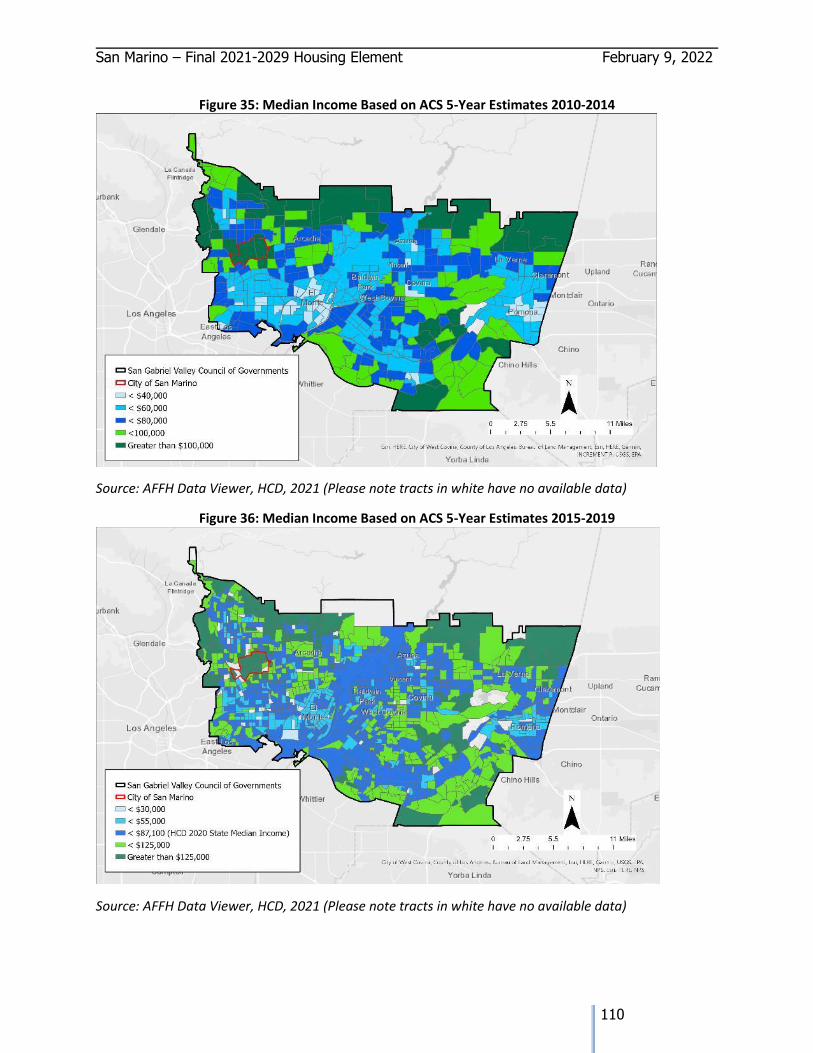
San Marino – Final 2021-2029 Housing Element February 9, 2022
110
Figure 35: Median Income Based on ACS 5-Year Estimates 2010-2014
Source: AFFH Data Viewer, HCD, 2021 (Please note tracts in white have no available data)
Figure 36: Median Income Based on ACS 5-Year Estimates 2015-2019
Source: AFFH Data Viewer, HCD, 2021 (Please note tracts in white have no available data)
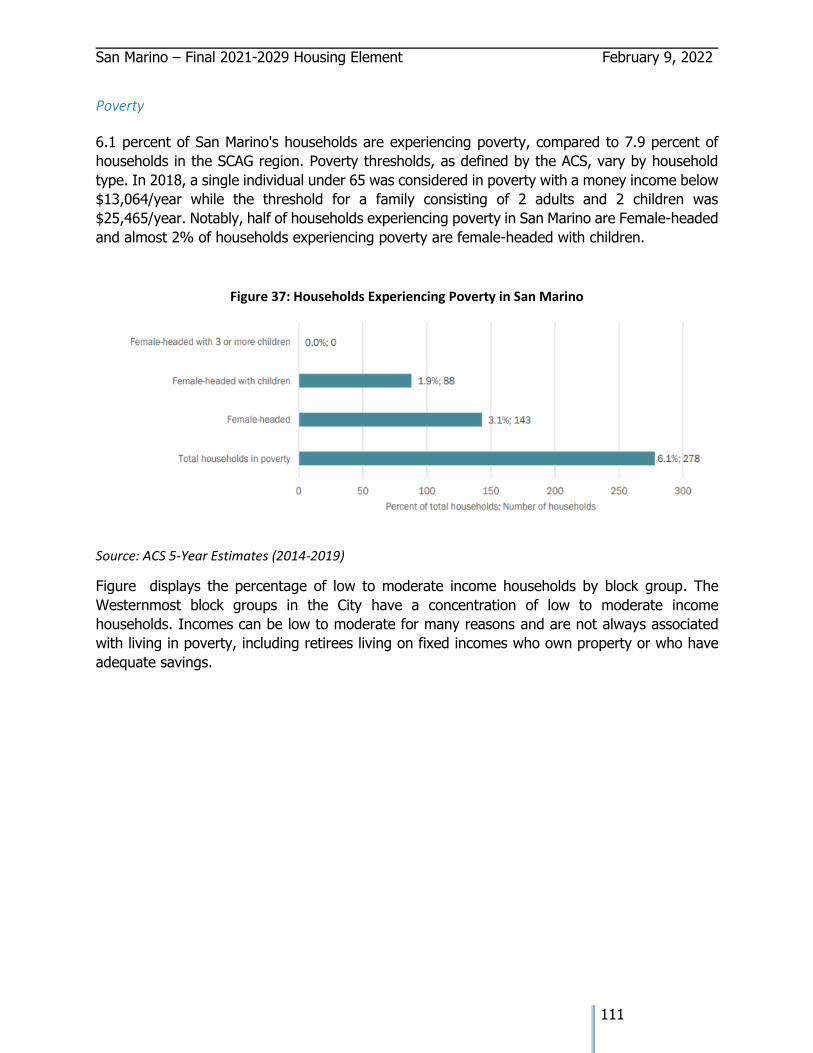
San Marino – Final 2021-2029 Housing Element February 9, 2022
111
Poverty
6.1 percent of San Marino's households are experiencing poverty, compared to 7.9 percent of
households in the SCAG region. Poverty thresholds, as defined by the ACS, vary by household
type. In 2018, a single individual under 65 was considered in poverty with a money income below
$13,064/year while the threshold for a family consisting of 2 adults and 2 children was
$25,465/year. Notably, half of households experiencing poverty in San Marino are Female-headed
and almost 2% of households experiencing poverty are female-headed with children.
Figure 37: Households Experiencing Poverty in San Marino
Source: ACS 5-Year Estimates (2014-2019)
Figure displays the percentage of low to moderate income households by block group. The
Westernmost block groups in the City have a concentration of low to moderate income
households. Incomes can be low to moderate for many reasons and are not always associated
with living in poverty, including retirees living on fixed incomes who own property or who have
adequate savings.
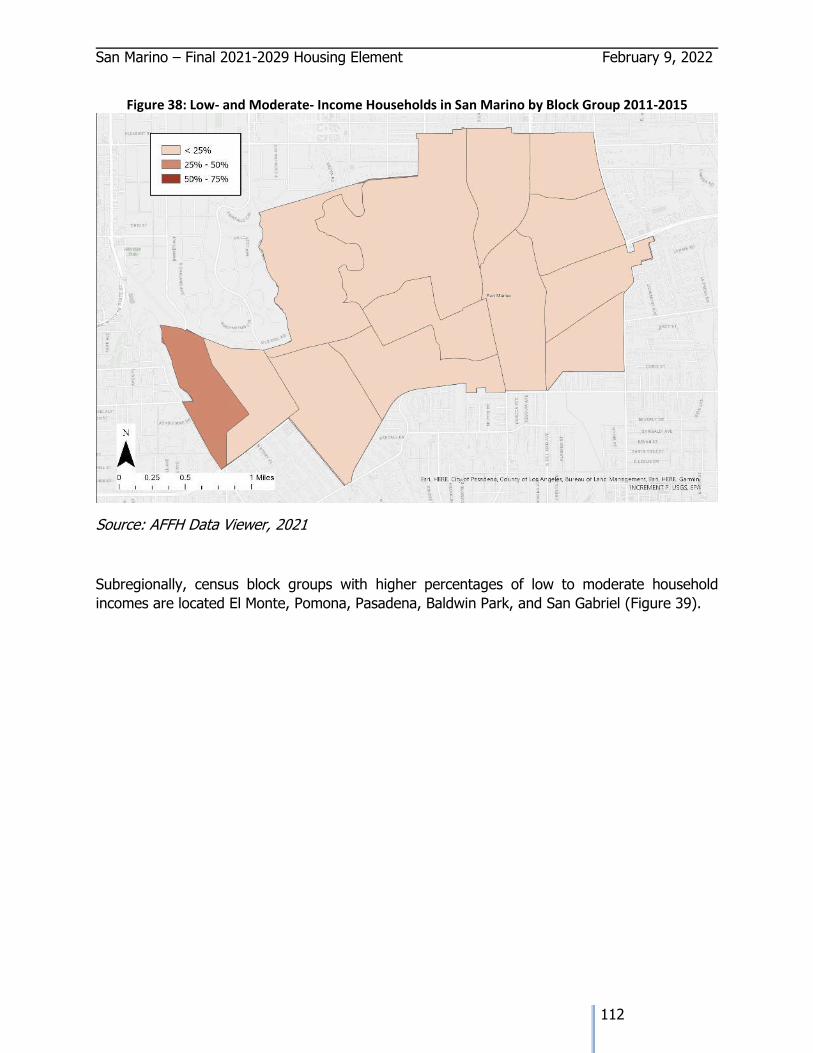
San Marino – Final 2021-2029 Housing Element February 9, 2022
112
Figure 38: Low- and Moderate- Income Households in San Marino by Block Group 2011-2015
Source: AFFH Data Viewer, 2021
Subregionally, census block groups with higher percentages of low to moderate household
incomes are located El Monte, Pomona, Pasadena, Baldwin Park, and San Gabriel (Figure 39).
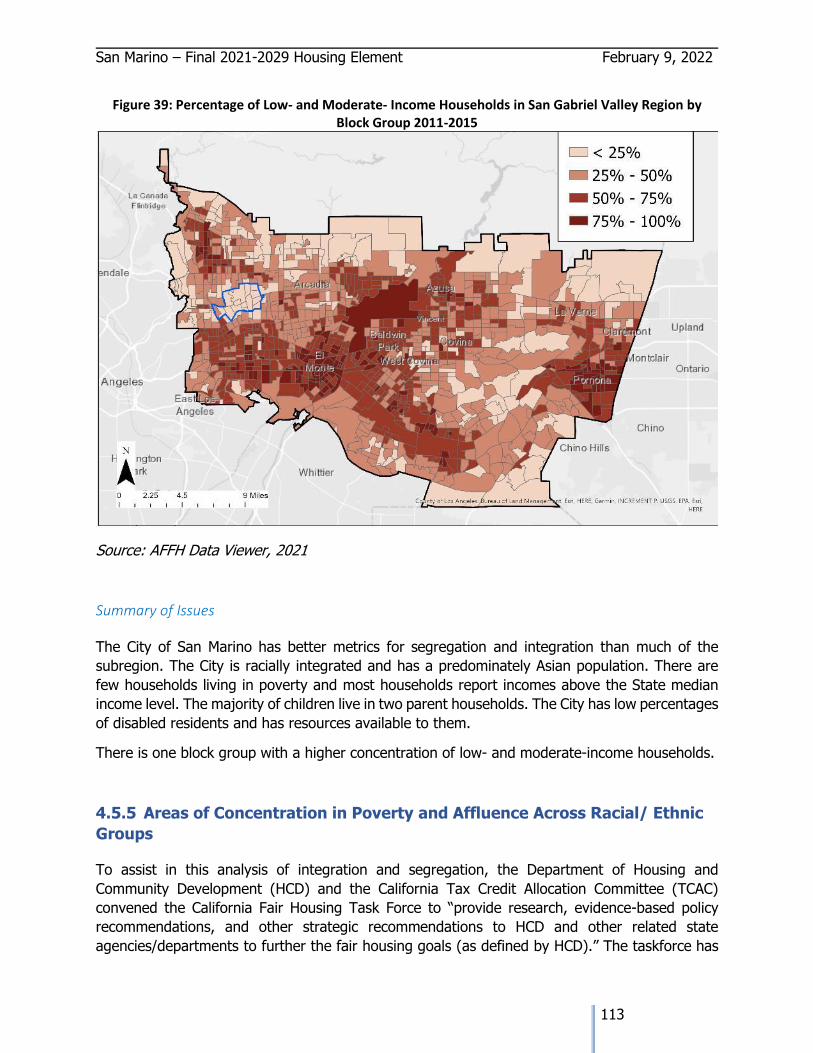
San Marino – Final 2021-2029 Housing Element February 9, 2022
113
Figure 39: Percentage of Low- and Moderate- Income Households in San Gabriel Valley Region by Block Group 2011-2015
Source: AFFH Data Viewer, 2021
Summary of Issues
The City of San Marino has better metrics for segregation and integration than much of the
subregion. The City is racially integrated and has a predominately Asian population. There are
few households living in poverty and most households report incomes above the State median
income level. The majority of children live in two parent households. The City has low percentages
of disabled residents and has resources available to them.
There is one block group with a higher concentration of low- and moderate-income households.
4.5.5 Areas of Concentration in Poverty and Affluence Across Racial/ Ethnic
Groups
To assist in this analysis of integration and segregation, the Department of Housing and
Community Development (HCD) and the California Tax Credit Allocation Committee (TCAC)
convened the California Fair Housing Task Force to “provide research, evidence-based policy
recommendations, and other strategic recommendations to HCD and other related state
agencies/departments to further the fair housing goals (as defined by HCD).” The taskforce has
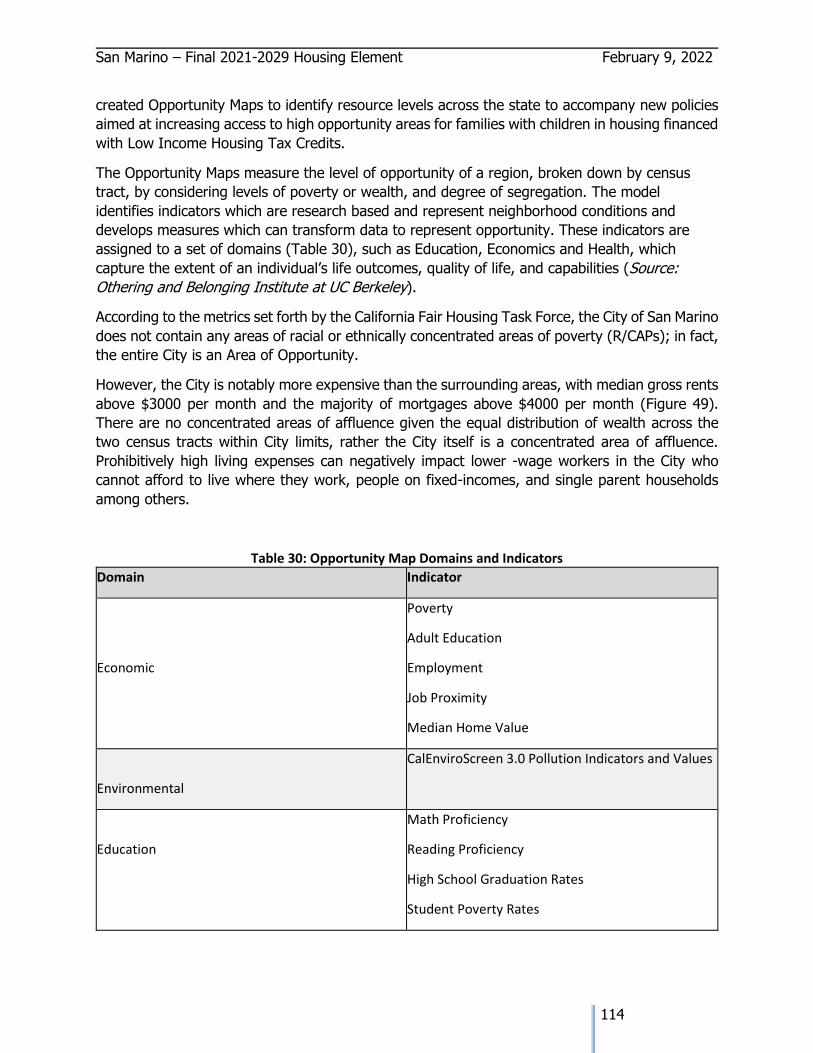
San Marino – Final 2021-2029 Housing Element February 9, 2022
114
created Opportunity Maps to identify resource levels across the state to accompany new policies
aimed at increasing access to high opportunity areas for families with children in housing financed
with Low Income Housing Tax Credits.
The Opportunity Maps measure the level of opportunity of a region, broken down by census
tract, by considering levels of poverty or wealth, and degree of segregation. The model
identifies indicators which are research based and represent neighborhood conditions and
develops measures which can transform data to represent opportunity. These indicators are
assigned to a set of domains (Table 30), such as Education, Economics and Health, which
capture the extent of an individual’s life outcomes, quality of life, and capabilities (Source:
Othering and Belonging Institute at UC Berkeley).
According to the metrics set forth by the California Fair Housing Task Force, the City of San Marino
does not contain any areas of racial or ethnically concentrated areas of poverty (R/CAPs); in fact,
the entire City is an Area of Opportunity.
However, the City is notably more expensive than the surrounding areas, with median gross rents
above $3000 per month and the majority of mortgages above $4000 per month (Figure 49).
There are no concentrated areas of affluence given the equal distribution of wealth across the
two census tracts within City limits, rather the City itself is a concentrated area of affluence.
Prohibitively high living expenses can negatively impact lower -wage workers in the City who
cannot afford to live where they work, people on fixed-incomes, and single parent households
among others.
Table 30: Opportunity Map Domains and Indicators
Domain Indicator
Economic
Poverty
Adult Education
Employment
Job Proximity
Median Home Value
Environmental
CalEnviroScreen 3.0 Pollution Indicators and Values
Education
Math Proficiency
Reading Proficiency
High School Graduation Rates
Student Poverty Rates
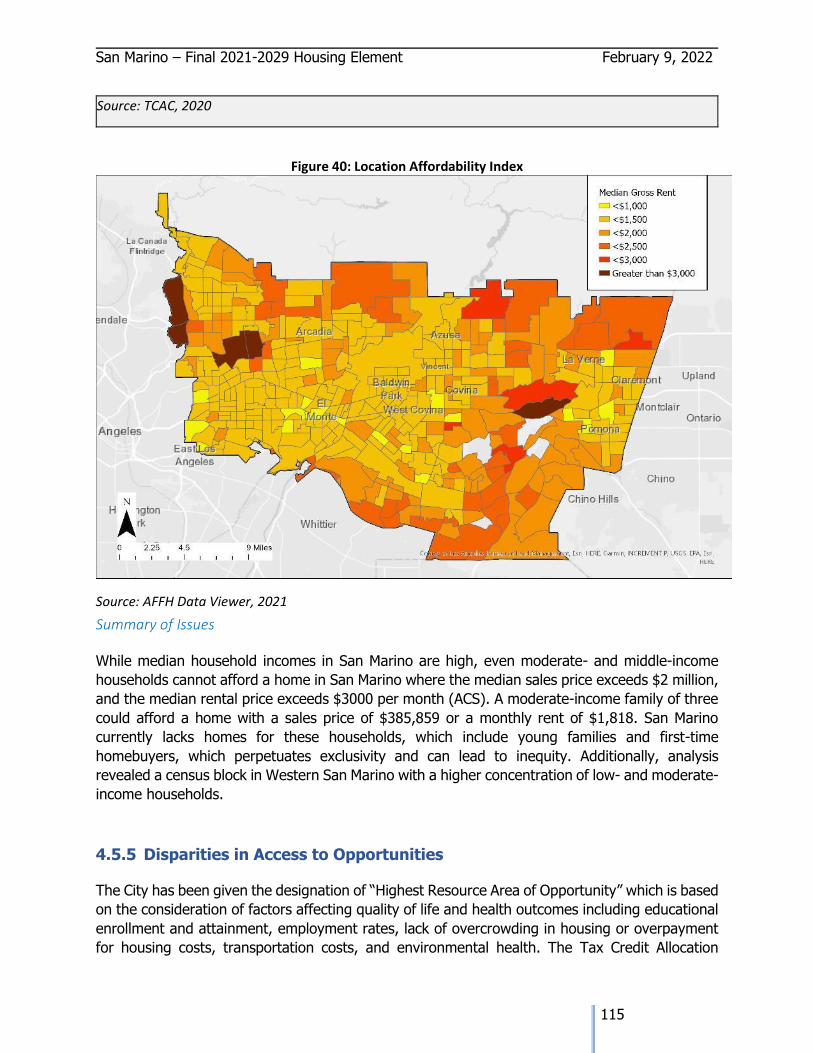
San Marino – Final 2021-2029 Housing Element February 9, 2022
115
Source: TCAC, 2020
Figure 40: Location Affordability Index
Source: AFFH Data Viewer, 2021
Summary of Issues
While median household incomes in San Marino are high, even moderate- and middle-income
households cannot afford a home in San Marino where the median sales price exceeds $2 million,
and the median rental price exceeds $3000 per month (ACS). A moderate-income family of three
could afford a home with a sales price of $385,859 or a monthly rent of $1,818. San Marino
currently lacks homes for these households, which include young families and first-time
homebuyers, which perpetuates exclusivity and can lead to inequity. Additionally, analysis
revealed a census block in Western San Marino with a higher concentration of low- and moderate-
income households.
4.5.5 Disparities in Access to Opportunities
The City has been given the designation of “Highest Resource Area of Opportunity” which is based
on the consideration of factors affecting quality of life and health outcomes including educational
enrollment and attainment, employment rates, lack of overcrowding in housing or overpayment
for housing costs, transportation costs, and environmental health. The Tax Credit Allocation
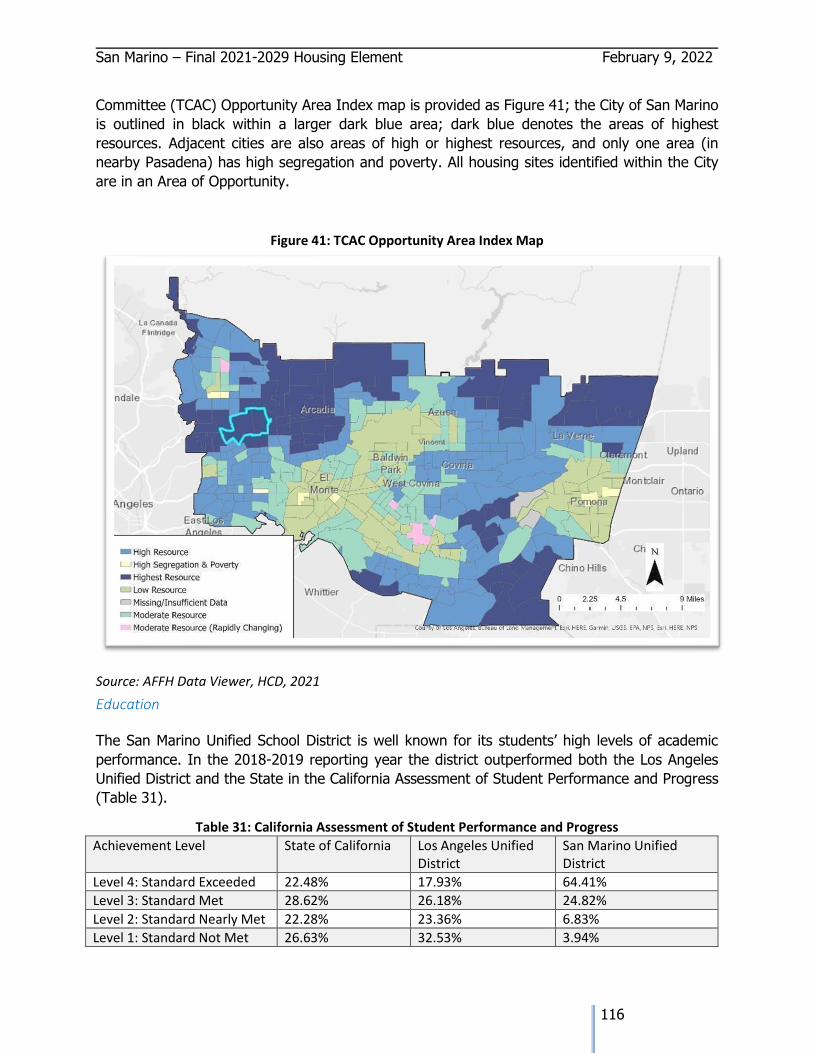
San Marino – Final 2021-2029 Housing Element February 9, 2022
116
Committee (TCAC) Opportunity Area Index map is provided as Figure 41; the City of San Marino
is outlined in black within a larger dark blue area; dark blue denotes the areas of highest
resources. Adjacent cities are also areas of high or highest resources, and only one area (in
nearby Pasadena) has high segregation and poverty. All housing sites identified within the City
are in an Area of Opportunity.
Figure 41: TCAC Opportunity Area Index Map
Source: AFFH Data Viewer, HCD, 2021
Education
The San Marino Unified School District is well known for its students’ high levels of academic
performance. In the 2018-2019 reporting year the district outperformed both the Los Angeles
Unified District and the State in the California Assessment of Student Performance and Progress
(Table 31).
Table 31: California Assessment of Student Performance and Progress
Achievement Level State of California Los Angeles Unified District
San Marino Unified District
Level 4: Standard Exceeded 22.48% 17.93% 64.41%
Level 3: Standard Met 28.62% 26.18% 24.82%
Level 2: Standard Nearly Met 22.28% 23.36% 6.83%
Level 1: Standard Not Met 26.63% 32.53% 3.94%
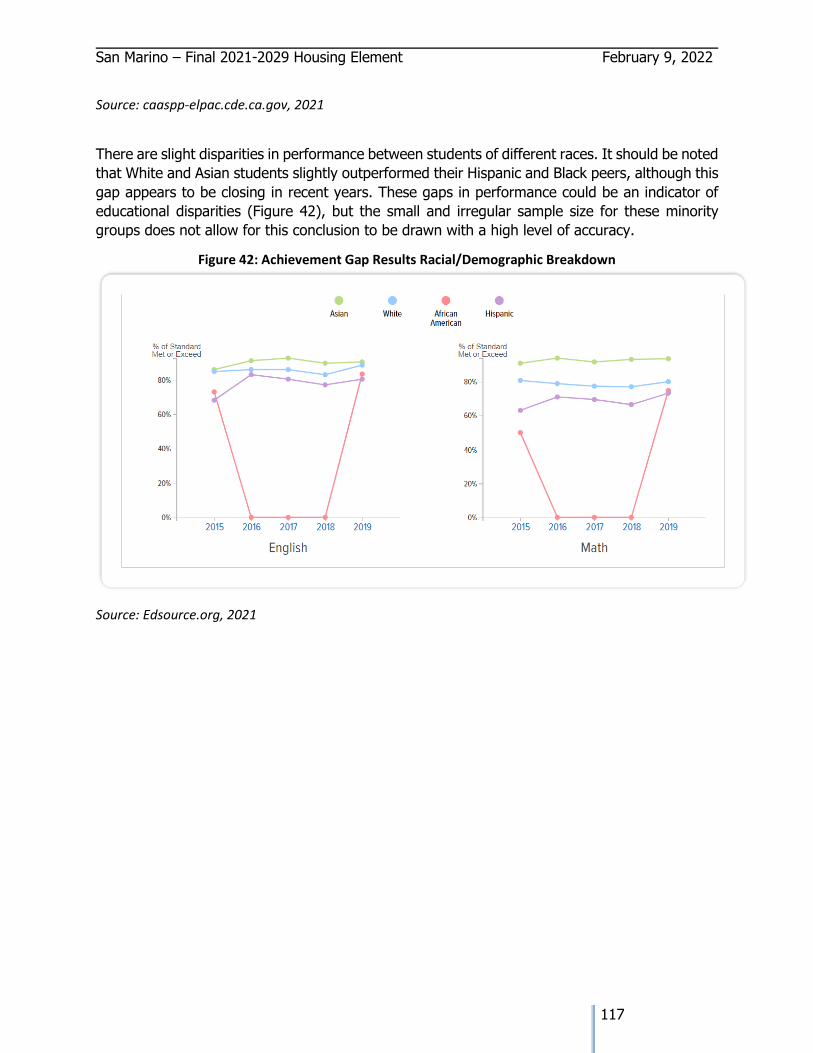
San Marino – Final 2021-2029 Housing Element February 9, 2022
117
Source: caaspp-elpac.cde.ca.gov, 2021
There are slight disparities in performance between students of different races. It should be noted
that White and Asian students slightly outperformed their Hispanic and Black peers, although this
gap appears to be closing in recent years. These gaps in performance could be an indicator of
educational disparities (Figure 42), but the small and irregular sample size for these minority
groups does not allow for this conclusion to be drawn with a high level of accuracy.
Figure 42: Achievement Gap Results Racial/Demographic Breakdown
Source: Edsource.org, 2021

San Marino – Final 2021-2029 Housing Element February 9, 2022
118
Figure 43: Educational Opportunity Index Scores in San Gabriel Valley Region
Source: AFFH Data Viewer, HCD, 2021
Environment
San Marino has low scores on the CalEnviroScreen Index, which means that San Marino is likely
to have more positive environment outcomes based upon aggregate measurements of the
following indicators:
• Exposure: Air Quality, Lead Risk in Housing, Diesel Particulate Matter, Drinking Water Contaminants, Pesticide Use, Toxic Releases from Facilities, Traffic Density
• Environmental Effects: Cleanup Sites, Groundwater Threats, Hazardous Waste Generators and Facilities, Impaired Water Bodies, Solid Waste Sites and Facilities
• Sensitive Populations: Asthma, Cardiovascular Disease, Low Birth Weight Infants
• Socioeconomic Factors: Educational Attainment, Housing Burden, Linguistic Isolation, Poverty, Unemployment
San Marino has two census tracts. The Western census tract scored in the top 12th percentile,
and the Eastern census tract scored in the top 10th percentile for overall environmental health,
meaning only 12 and 10 percent of other census tracts in the state had better overall composite
scores. Of the individual indicators analyzed, the biggest factors for potential adverse
environmental health outcomes in San Marino are pollution exposure, lead risk in housing, and
contaminated drinking water.
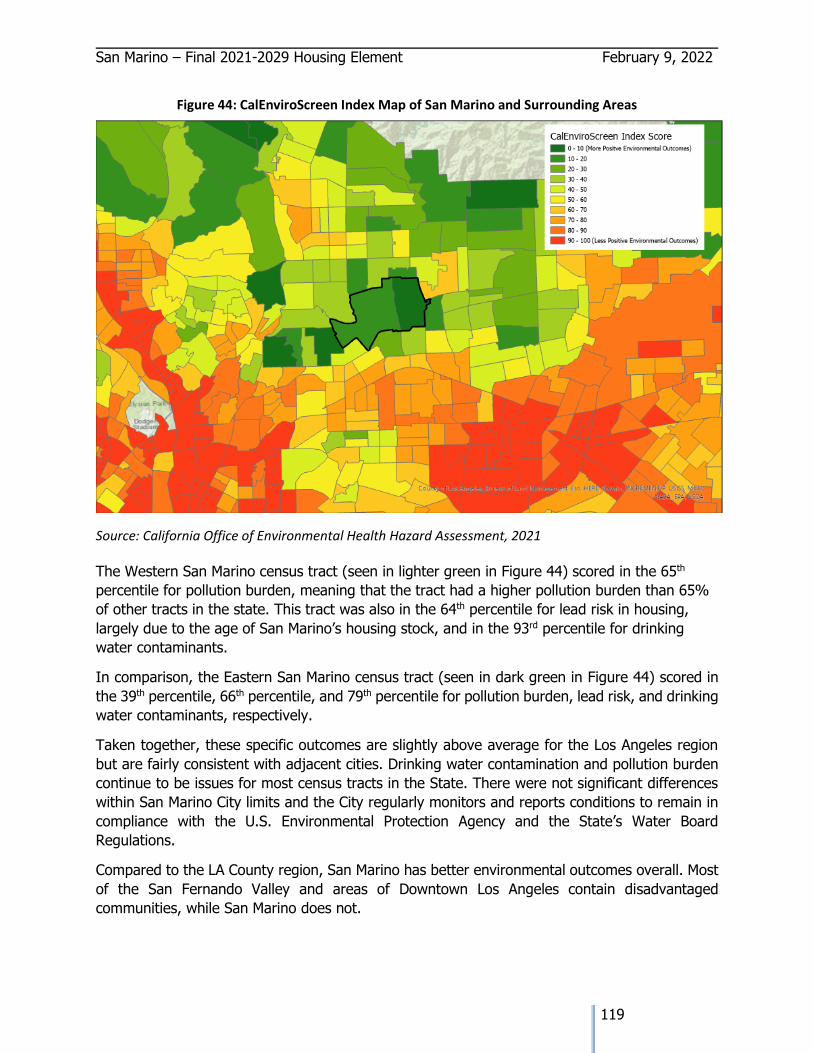
San Marino – Final 2021-2029 Housing Element February 9, 2022
119
Figure 44: CalEnviroScreen Index Map of San Marino and Surrounding Areas
Source: California Office of Environmental Health Hazard Assessment, 2021
The Western San Marino census tract (seen in lighter green in Figure 44) scored in the 65th
percentile for pollution burden, meaning that the tract had a higher pollution burden than 65%
of other tracts in the state. This tract was also in the 64th percentile for lead risk in housing,
largely due to the age of San Marino’s housing stock, and in the 93rd percentile for drinking
water contaminants.
In comparison, the Eastern San Marino census tract (seen in dark green in Figure 44) scored in
the 39th percentile, 66th percentile, and 79th percentile for pollution burden, lead risk, and drinking
water contaminants, respectively.
Taken together, these specific outcomes are slightly above average for the Los Angeles region
but are fairly consistent with adjacent cities. Drinking water contamination and pollution burden
continue to be issues for most census tracts in the State. There were not significant differences
within San Marino City limits and the City regularly monitors and reports conditions to remain in
compliance with the U.S. Environmental Protection Agency and the State’s Water Board
Regulations.
Compared to the LA County region, San Marino has better environmental outcomes overall. Most
of the San Fernando Valley and areas of Downtown Los Angeles contain disadvantaged
communities, while San Marino does not.
San Marino – Final 2021-2029 Housing Element February 9, 2022
120
Transportation
The LA Metro Bus Lines 78 Local and 487 Express service San Marino. According to
walkscore.com, the City has a Walk Score of 61 (out of 100) and is considered somewhat walkable
with some errands able to be carried out on foot. The City has a Bike Score of 50, which means
that there is some existing bike infrastructure. The City was not rated for transit. In comparison,
the neighboring City of Pasadena was given Walk Score of 69, Bike Score of 70, and Transit Score
of 71.
The City is part of a low-cost membership program for curb-to-curb ride services for seniors over
60 and for those under 60 with a disability. The service is available for residents who live in
Pasadena, San Marino, Altadena, and unincorporated Los Angeles County areas within the service
area.
The City has an AllTransit score of 5.6 which represents a “moderate combination of trips per
week and number of jobs accessible enabling moderate number of people to take transit to work.”
In San Marino, only 2% of residents report using transit to commute to work.
Neighboring Pasadena has an AllTransit score of 8.3 which represents an “Excellent combination
of trips per week and number of jobs accessible enabling numerous people to take transit to
work.”
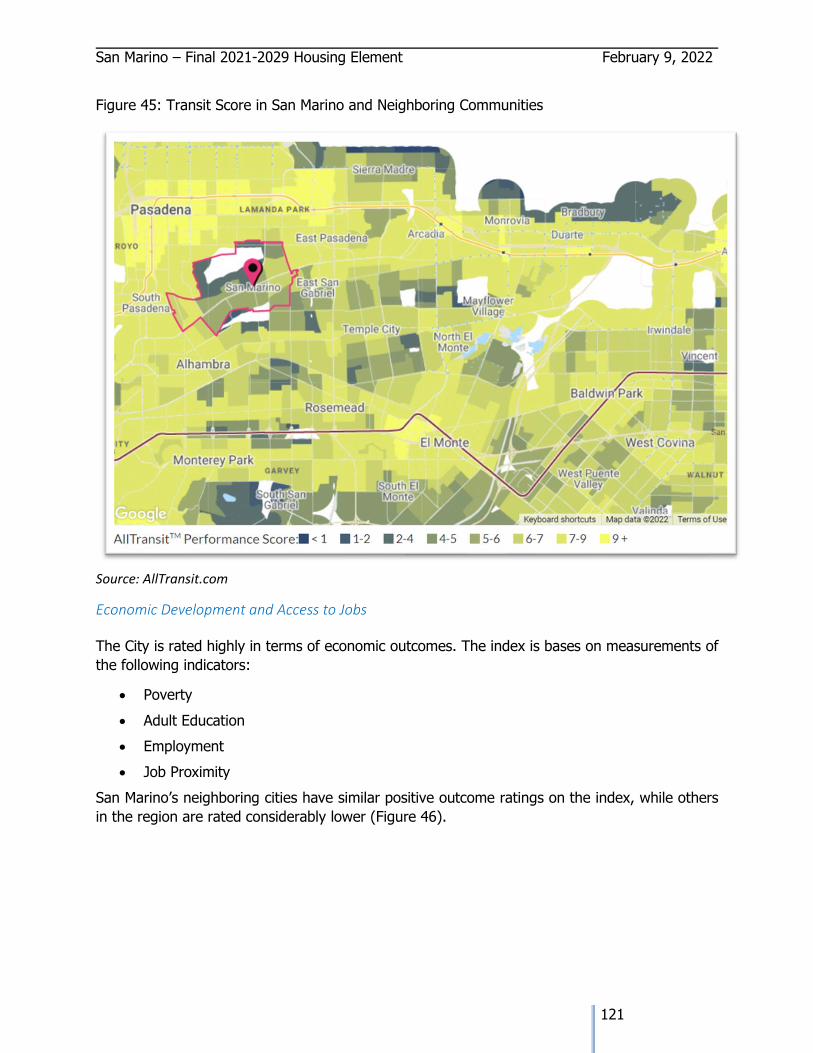
San Marino – Final 2021-2029 Housing Element February 9, 2022
121
Figure 45: Transit Score in San Marino and Neighboring Communities
Source: AllTransit.com
Economic Development and Access to Jobs
The City is rated highly in terms of economic outcomes. The index is bases on measurements of
the following indicators:
• Poverty
• Adult Education
• Employment
• Job Proximity
San Marino’s neighboring cities have similar positive outcome ratings on the index, while others
in the region are rated considerably lower (Figure 46).
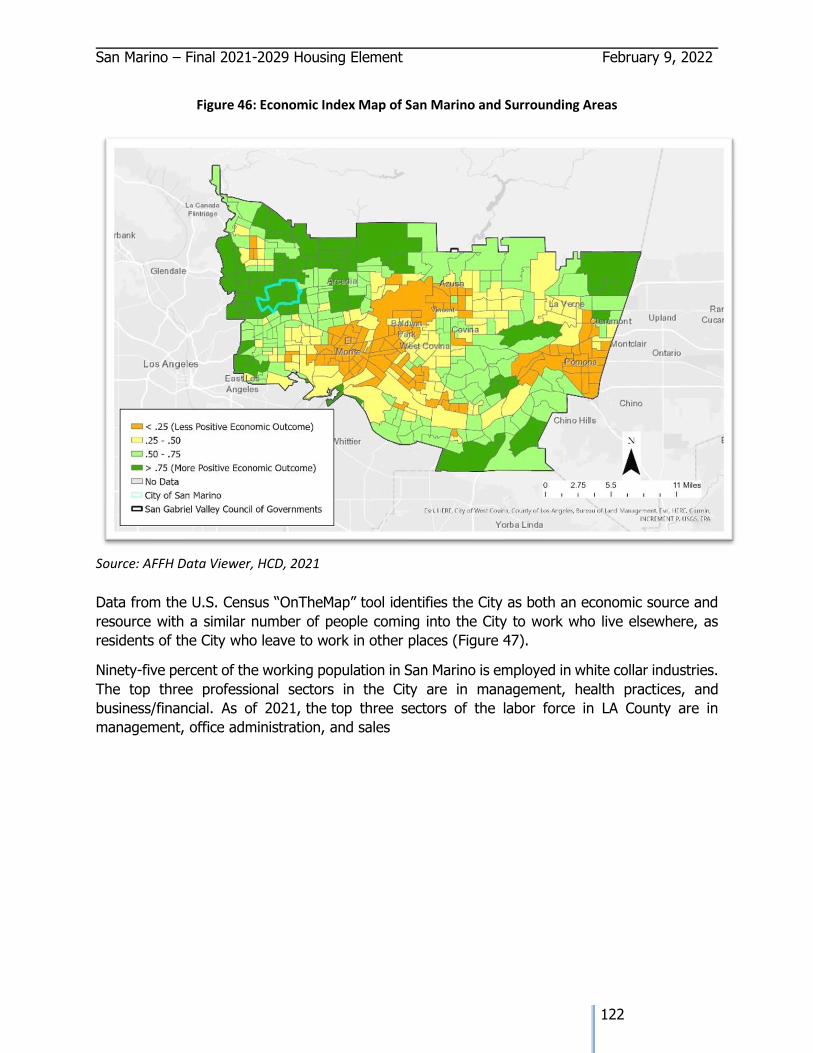
San Marino – Final 2021-2029 Housing Element February 9, 2022
122
Figure 46: Economic Index Map of San Marino and Surrounding Areas
Source: AFFH Data Viewer, HCD, 2021
Data from the U.S. Census “OnTheMap” tool identifies the City as both an economic source and
resource with a similar number of people coming into the City to work who live elsewhere, as
residents of the City who leave to work in other places (Figure 47).
Ninety-five percent of the working population in San Marino is employed in white collar industries.
The top three professional sectors in the City are in management, health practices, and
business/financial. As of 2021, the top three sectors of the labor force in LA County are in
management, office administration, and sales
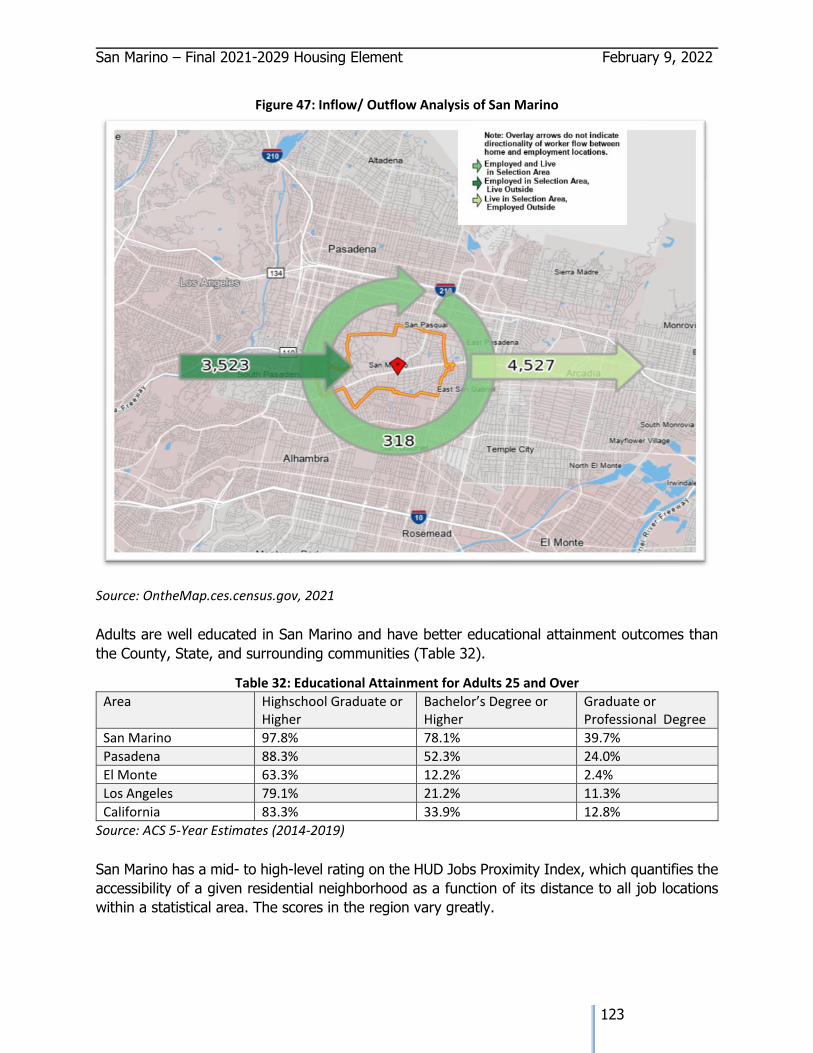
San Marino – Final 2021-2029 Housing Element February 9, 2022
123
Figure 47: Inflow/ Outflow Analysis of San Marino
Source: OntheMap.ces.census.gov, 2021
Adults are well educated in San Marino and have better educational attainment outcomes than
the County, State, and surrounding communities (Table 32).
Table 32: Educational Attainment for Adults 25 and Over
Area Highschool Graduate or Higher
Bachelor’s Degree or Higher
Graduate or Professional Degree
San Marino 97.8% 78.1% 39.7%
Pasadena 88.3% 52.3% 24.0%
El Monte 63.3% 12.2% 2.4%
Los Angeles 79.1% 21.2% 11.3%
California 83.3% 33.9% 12.8%
Source: ACS 5-Year Estimates (2014-2019)
San Marino has a mid- to high-level rating on the HUD Jobs Proximity Index, which quantifies the
accessibility of a given residential neighborhood as a function of its distance to all job locations
within a statistical area. The scores in the region vary greatly.
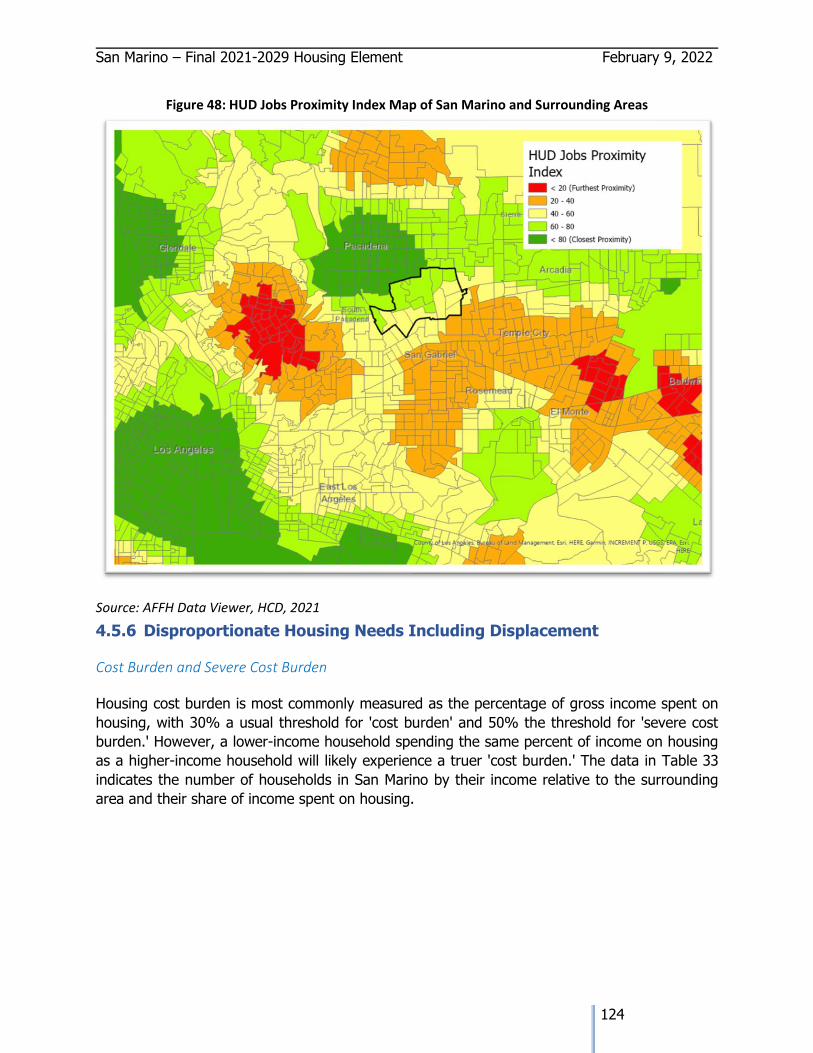
San Marino – Final 2021-2029 Housing Element February 9, 2022
124
Figure 48: HUD Jobs Proximity Index Map of San Marino and Surrounding Areas
Source: AFFH Data Viewer, HCD, 2021
4.5.6 Disproportionate Housing Needs Including Displacement
Cost Burden and Severe Cost Burden
Housing cost burden is most commonly measured as the percentage of gross income spent on
housing, with 30% a usual threshold for 'cost burden' and 50% the threshold for 'severe cost
burden.' However, a lower-income household spending the same percent of income on housing
as a higher-income household will likely experience a truer 'cost burden.' The data in Table 33
indicates the number of households in San Marino by their income relative to the surrounding
area and their share of income spent on housing.
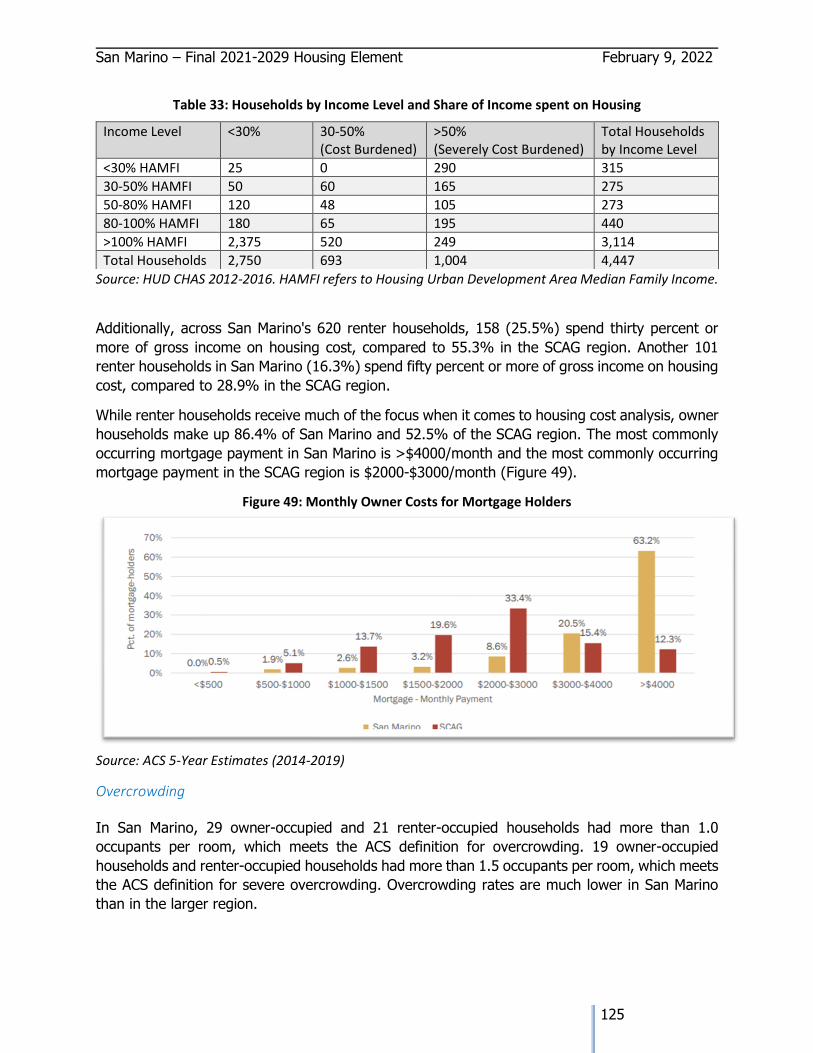
San Marino – Final 2021-2029 Housing Element February 9, 2022
125
Table 33: Households by Income Level and Share of Income spent on Housing
Source: HUD CHAS 2012-2016. HAMFI refers to Housing Urban Development Area Median Family Income.
Additionally, across San Marino's 620 renter households, 158 (25.5%) spend thirty percent or
more of gross income on housing cost, compared to 55.3% in the SCAG region. Another 101
renter households in San Marino (16.3%) spend fifty percent or more of gross income on housing
cost, compared to 28.9% in the SCAG region.
While renter households receive much of the focus when it comes to housing cost analysis, owner
households make up 86.4% of San Marino and 52.5% of the SCAG region. The most commonly
occurring mortgage payment in San Marino is >$4000/month and the most commonly occurring
mortgage payment in the SCAG region is $2000-$3000/month (Figure 49).
Figure 49: Monthly Owner Costs for Mortgage Holders
Source: ACS 5-Year Estimates (2014-2019)
Overcrowding
In San Marino, 29 owner-occupied and 21 renter-occupied households had more than 1.0
occupants per room, which meets the ACS definition for overcrowding. 19 owner-occupied
households and renter-occupied households had more than 1.5 occupants per room, which meets
the ACS definition for severe overcrowding. Overcrowding rates are much lower in San Marino
than in the larger region.
Income Level <30% 30-50% (Cost Burdened)
>50% (Severely Cost Burdened)
Total Households by Income Level
<30% HAMFI 25 0 290 315
30-50% HAMFI 50 60 165 275
50-80% HAMFI 120 48 105 273
80-100% HAMFI 180 65 195 440
>100% HAMFI 2,375 520 249 3,114
Total Households 2,750 693 1,004 4,447
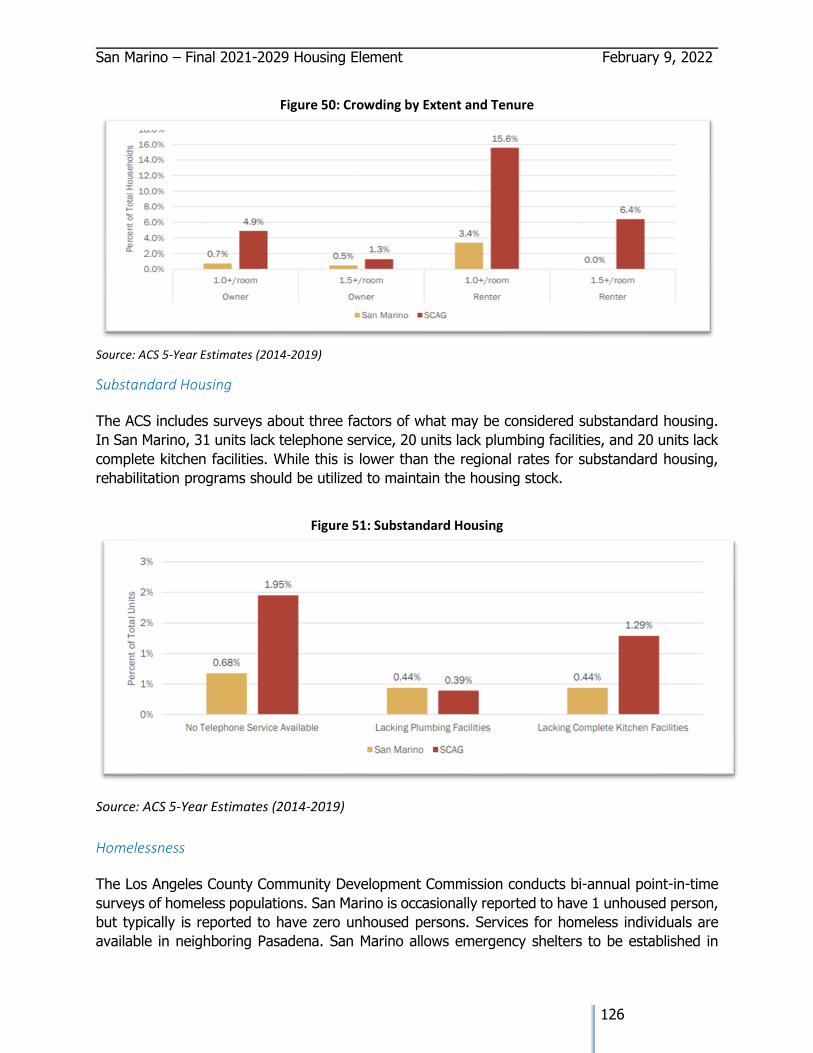
San Marino – Final 2021-2029 Housing Element February 9, 2022
126
Figure 50: Crowding by Extent and Tenure
Source: ACS 5-Year Estimates (2014-2019)
Substandard Housing
The ACS includes surveys about three factors of what may be considered substandard housing.
In San Marino, 31 units lack telephone service, 20 units lack plumbing facilities, and 20 units lack
complete kitchen facilities. While this is lower than the regional rates for substandard housing,
rehabilitation programs should be utilized to maintain the housing stock.
Figure 51: Substandard Housing
Source: ACS 5-Year Estimates (2014-2019)
Homelessness
The Los Angeles County Community Development Commission conducts bi-annual point-in-time
surveys of homeless populations. San Marino is occasionally reported to have 1 unhoused person,
but typically is reported to have zero unhoused persons. Services for homeless individuals are
available in neighboring Pasadena. San Marino allows emergency shelters to be established in
San Marino – Final 2021-2029 Housing Element February 9, 2022
127
any commercially zoned property as a permitted use; however, no interest has been shown on
the part of homeless service providers in initiating homeless services in San Marino.
Displacement
According to the Urban Displacement Project, there are no sensitive populations subject to
displacement in San Marino. However, there are approximately 225 very low-income, elderly
households in the City. Special attention should be given to these households, as aging in place
may become difficult for people with fixed incomes given the prohibitive cost of living in San
Marino.
.
San Marino – Final 2021-2029 Housing Element February 9, 2022
128
APPENDIX A: SCAG LOCAL HOUSING DATA
San Marino – Final 2021-2029 Housing Element February 9, 2022
129
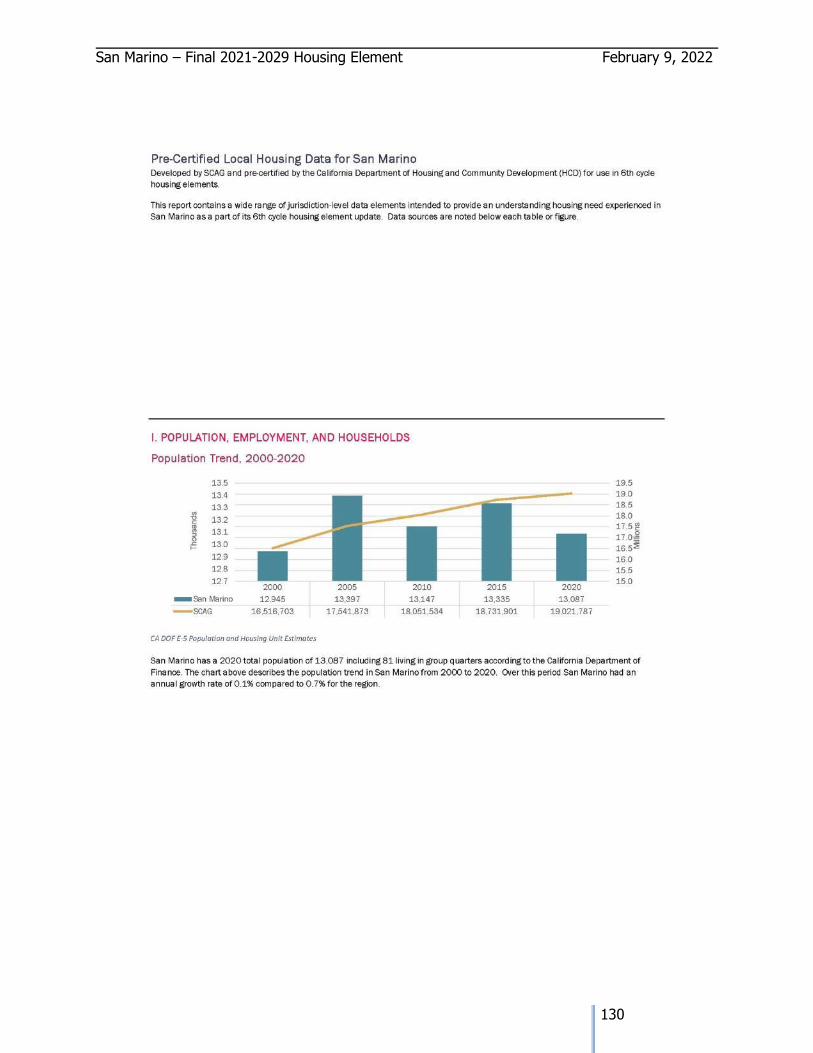
San Marino – Final 2021-2029 Housing Element February 9, 2022
130
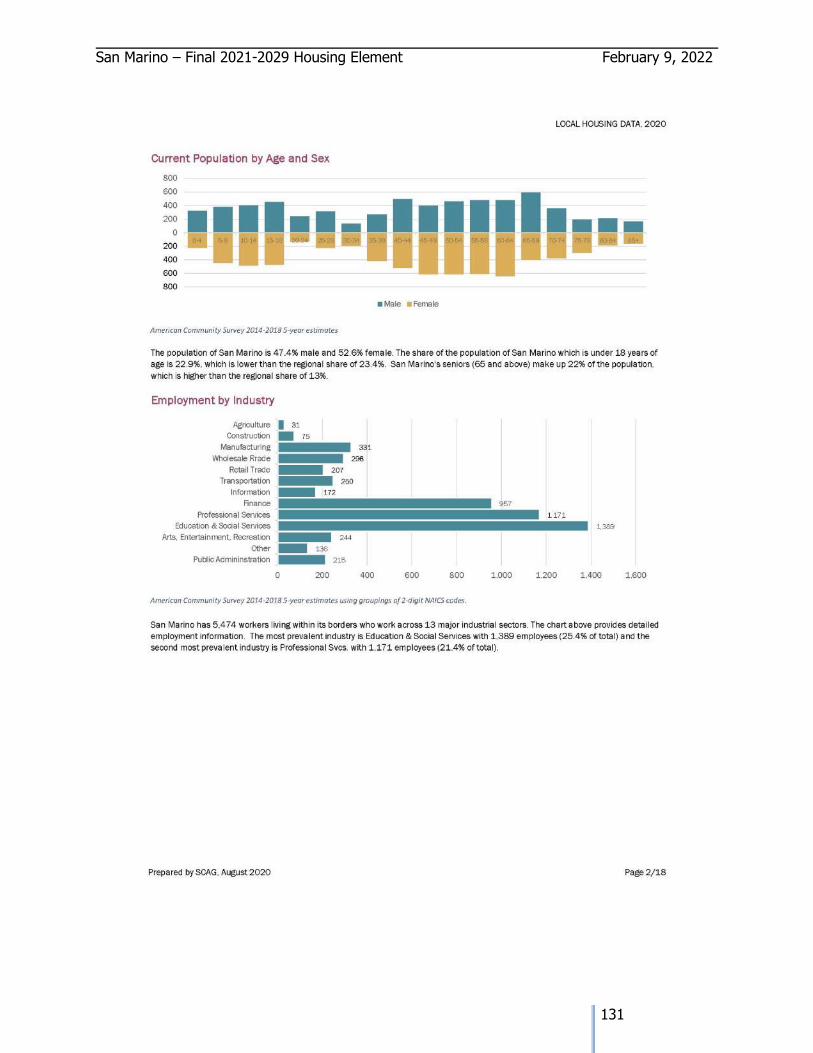
San Marino – Final 2021-2029 Housing Element February 9, 2022
131
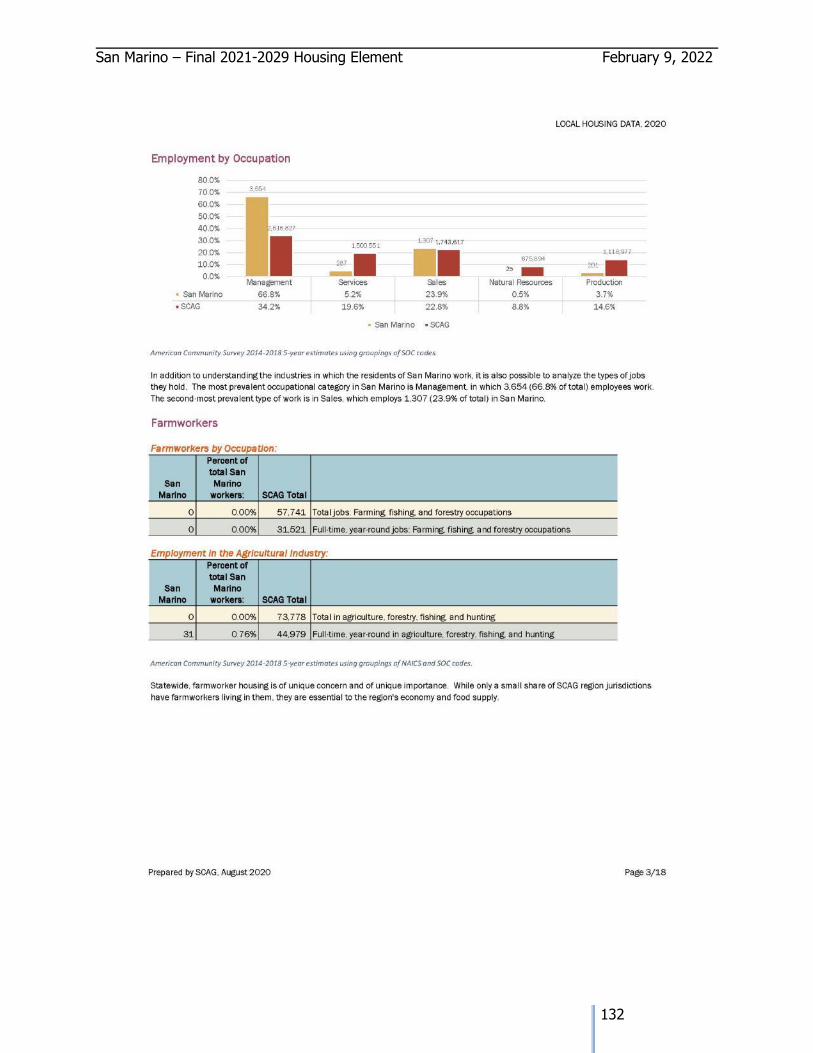
San Marino – Final 2021-2029 Housing Element February 9, 2022
132
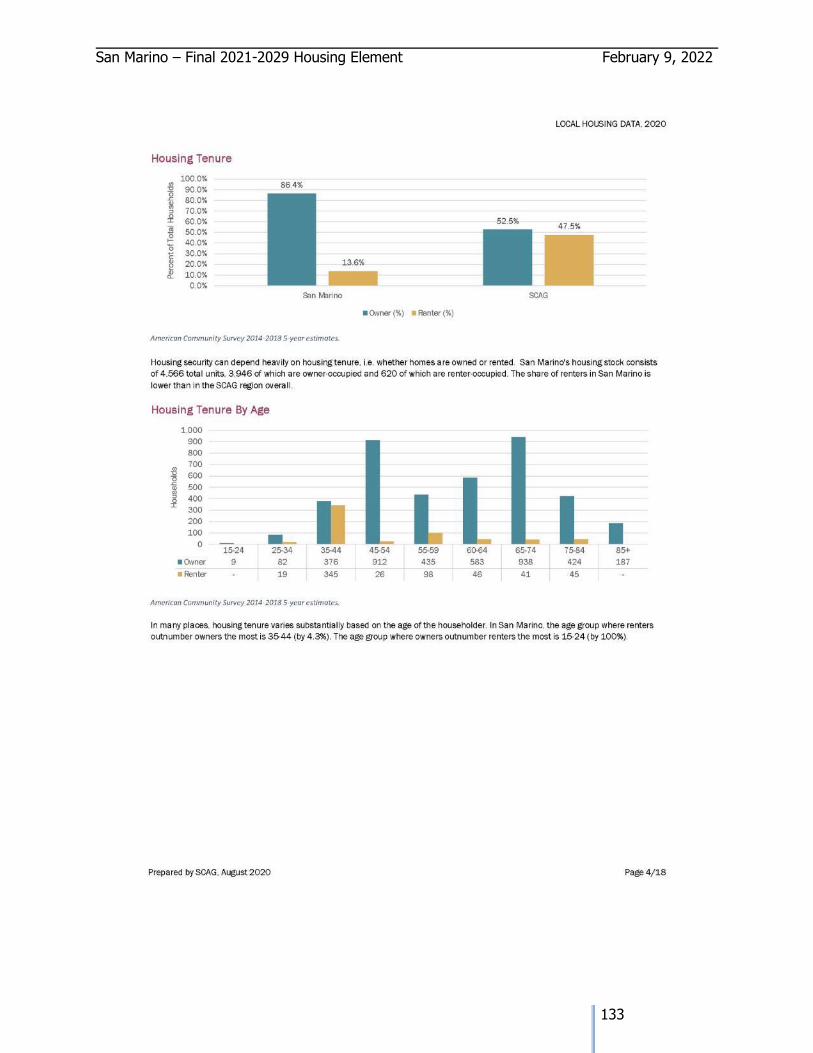
San Marino – Final 2021-2029 Housing Element February 9, 2022
133
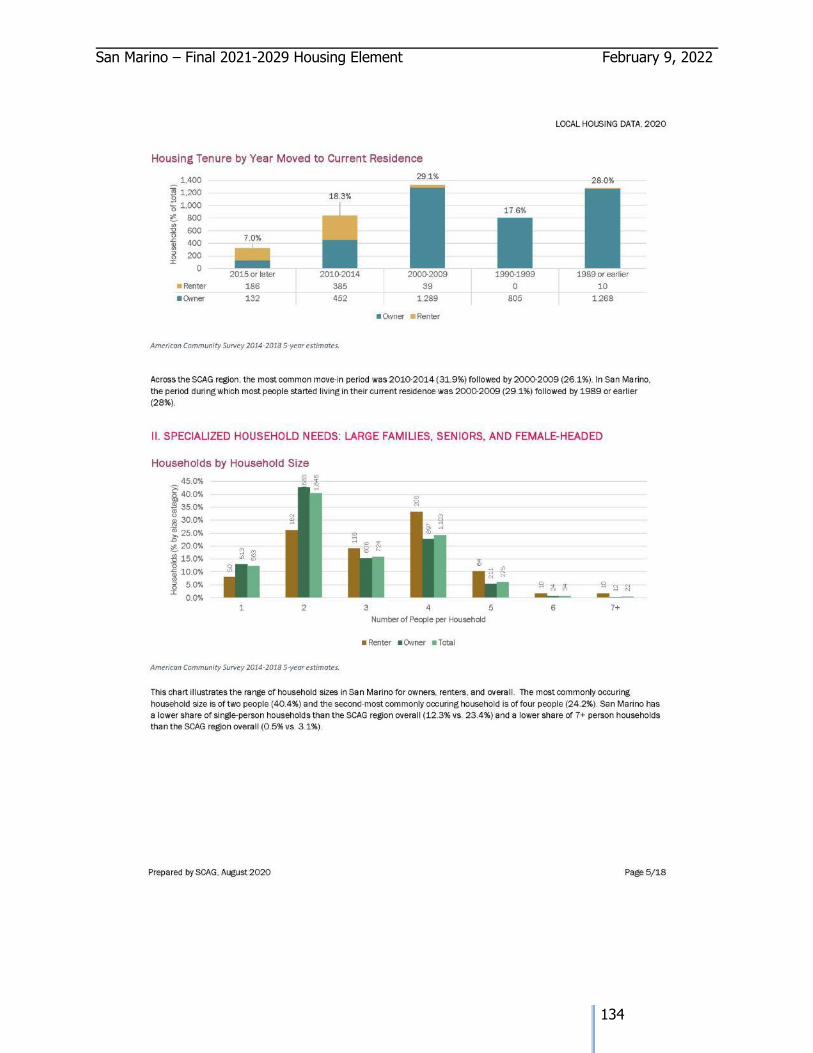
San Marino – Final 2021-2029 Housing Element February 9, 2022
134
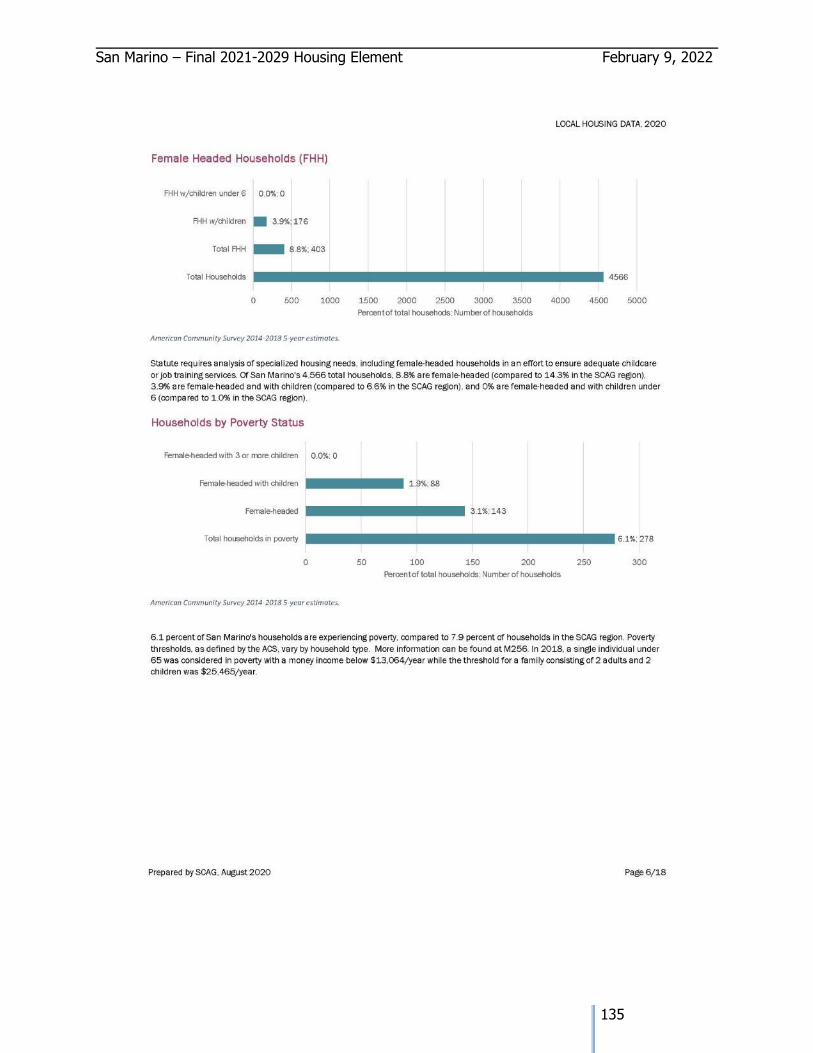
San Marino – Final 2021-2029 Housing Element February 9, 2022
135
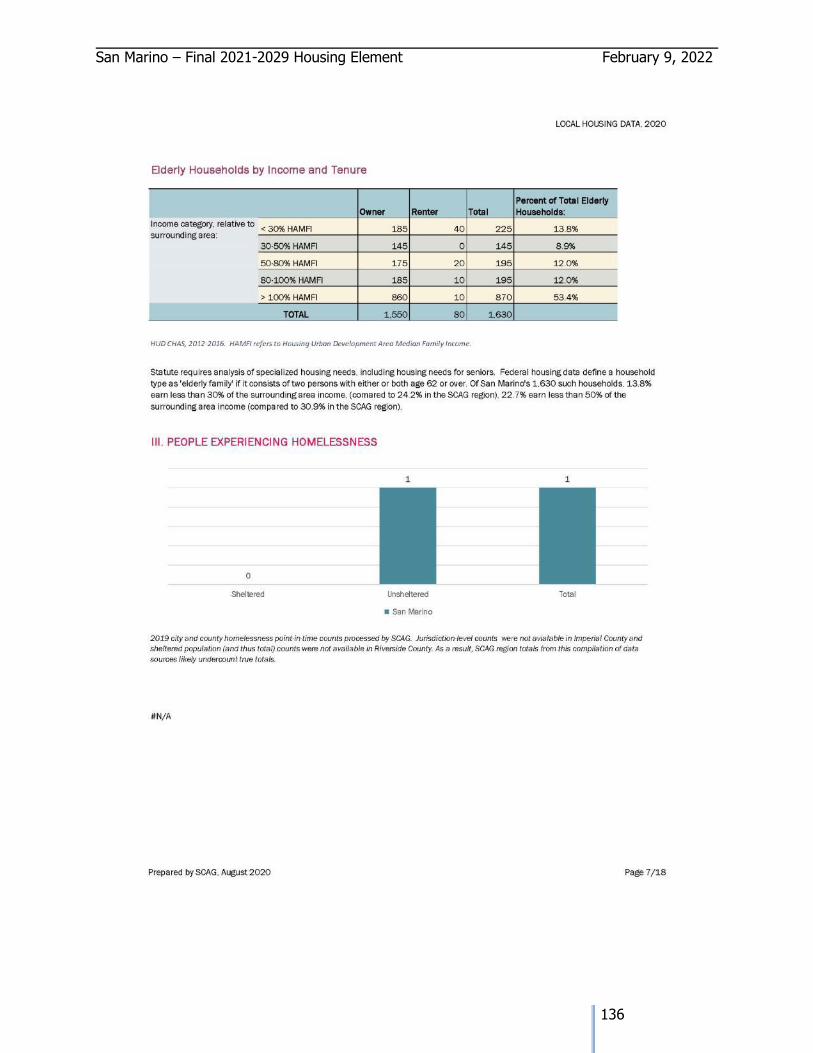
San Marino – Final 2021-2029 Housing Element February 9, 2022
136
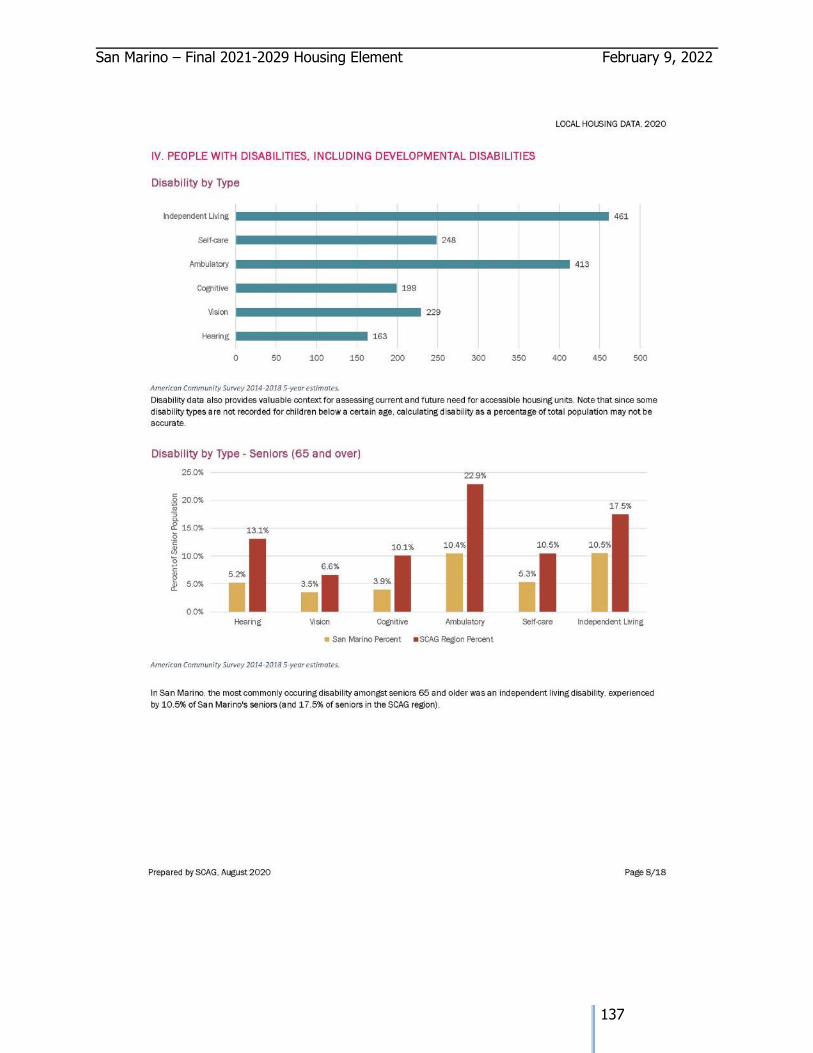
San Marino – Final 2021-2029 Housing Element February 9, 2022
137
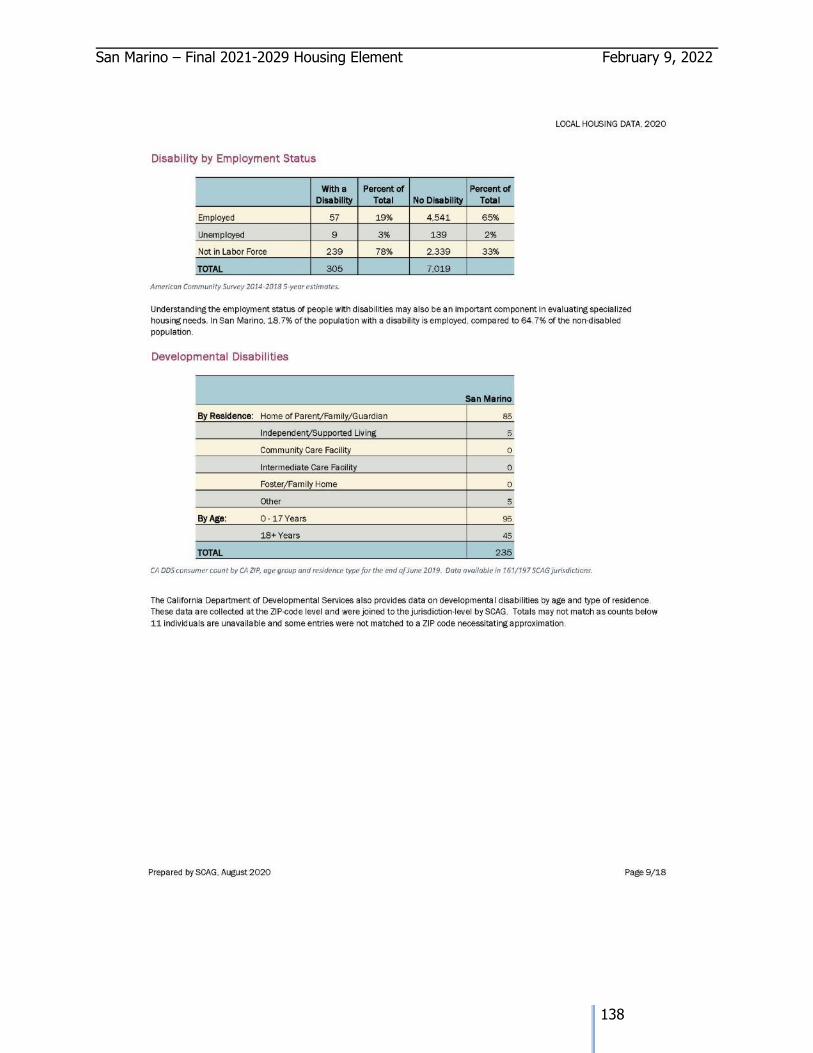
San Marino – Final 2021-2029 Housing Element February 9, 2022
138
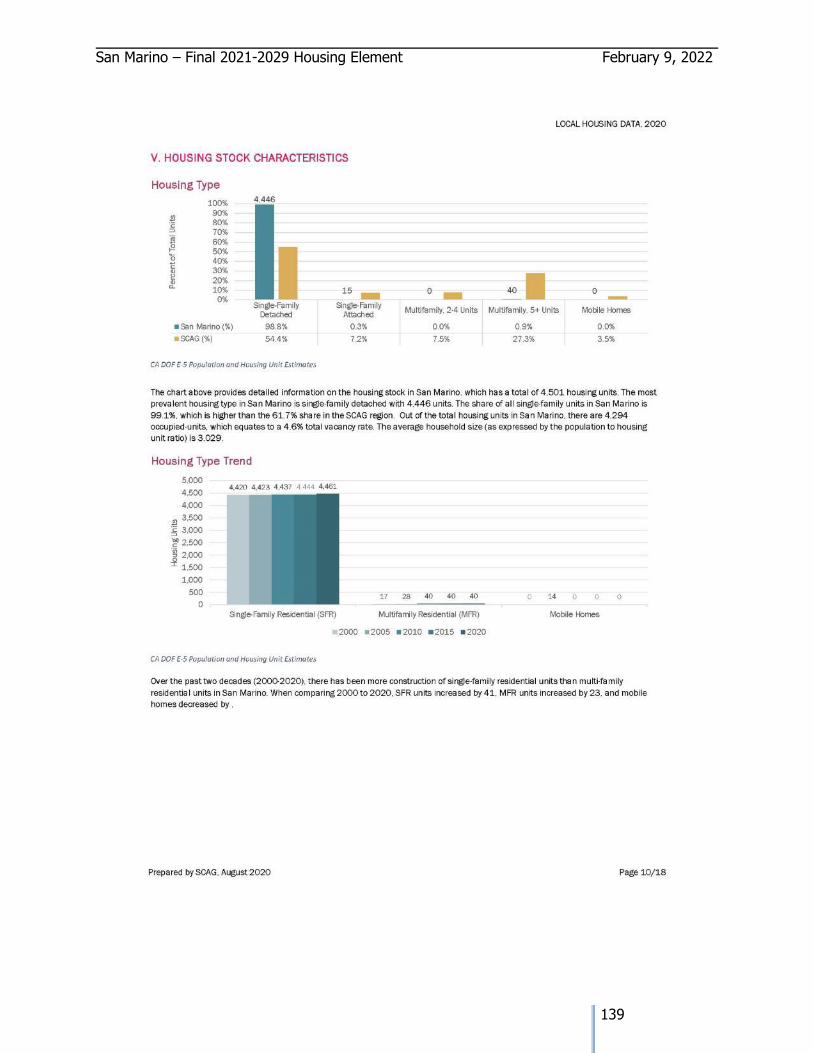
San Marino – Final 2021-2029 Housing Element February 9, 2022
139
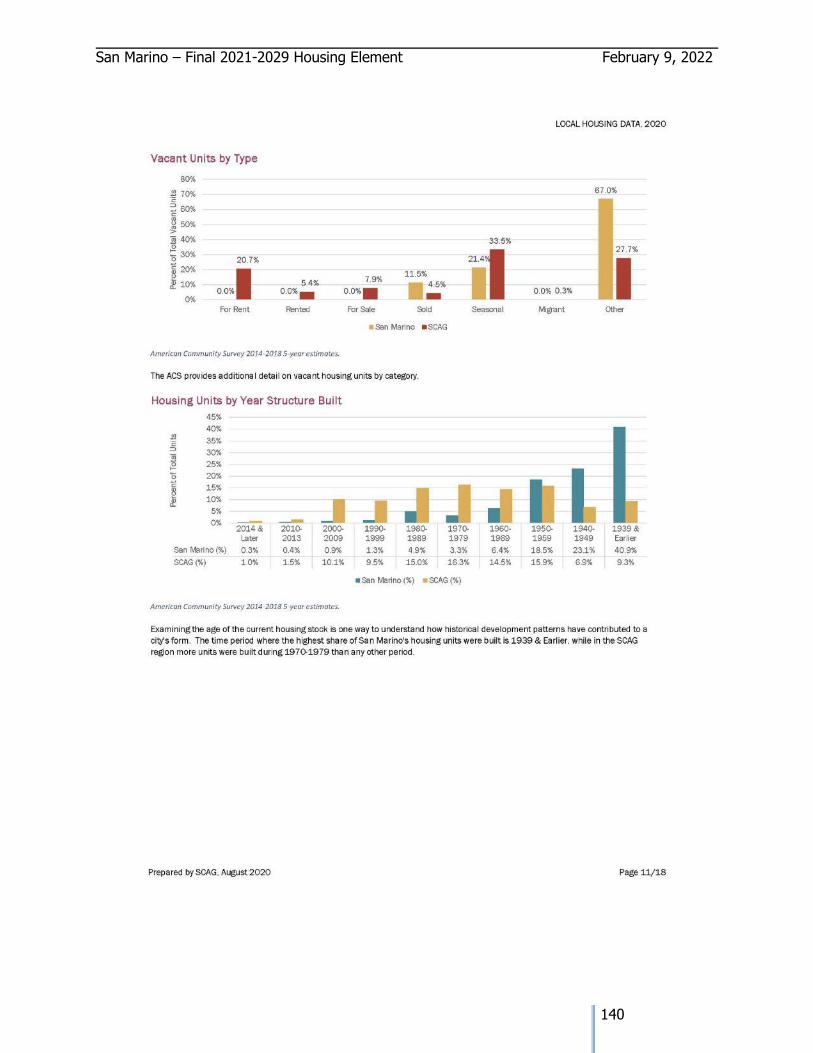
San Marino – Final 2021-2029 Housing Element February 9, 2022
140
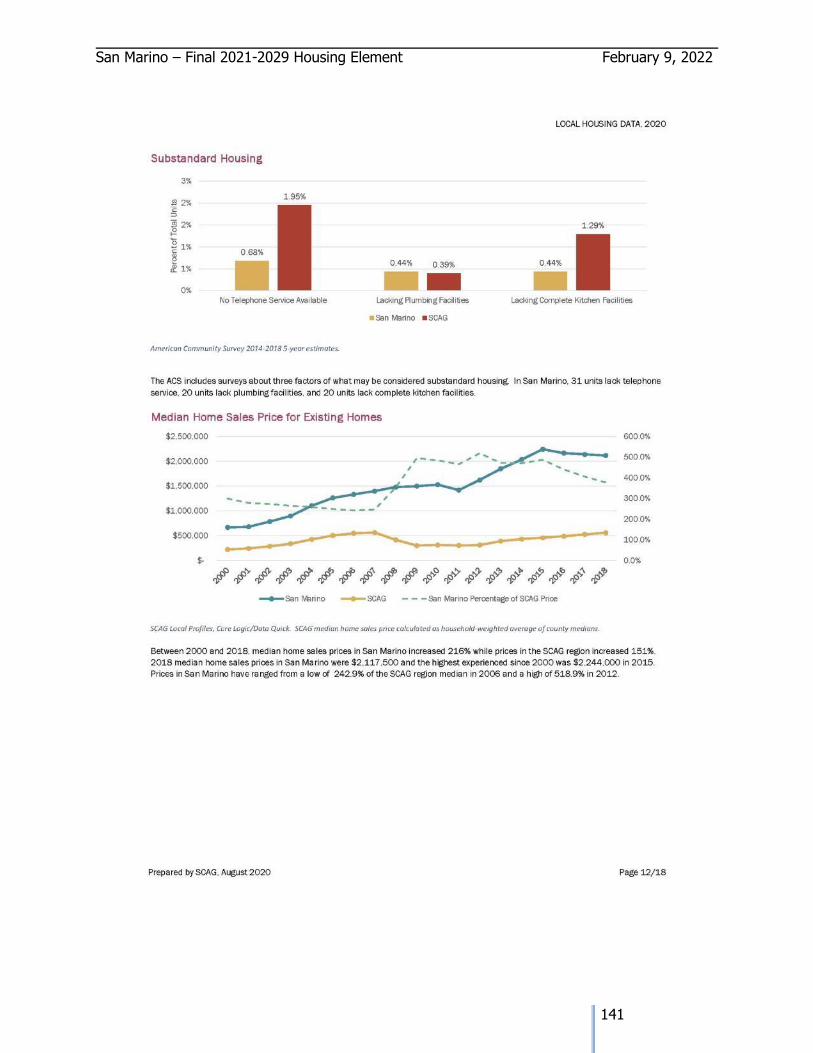
San Marino – Final 2021-2029 Housing Element February 9, 2022
141
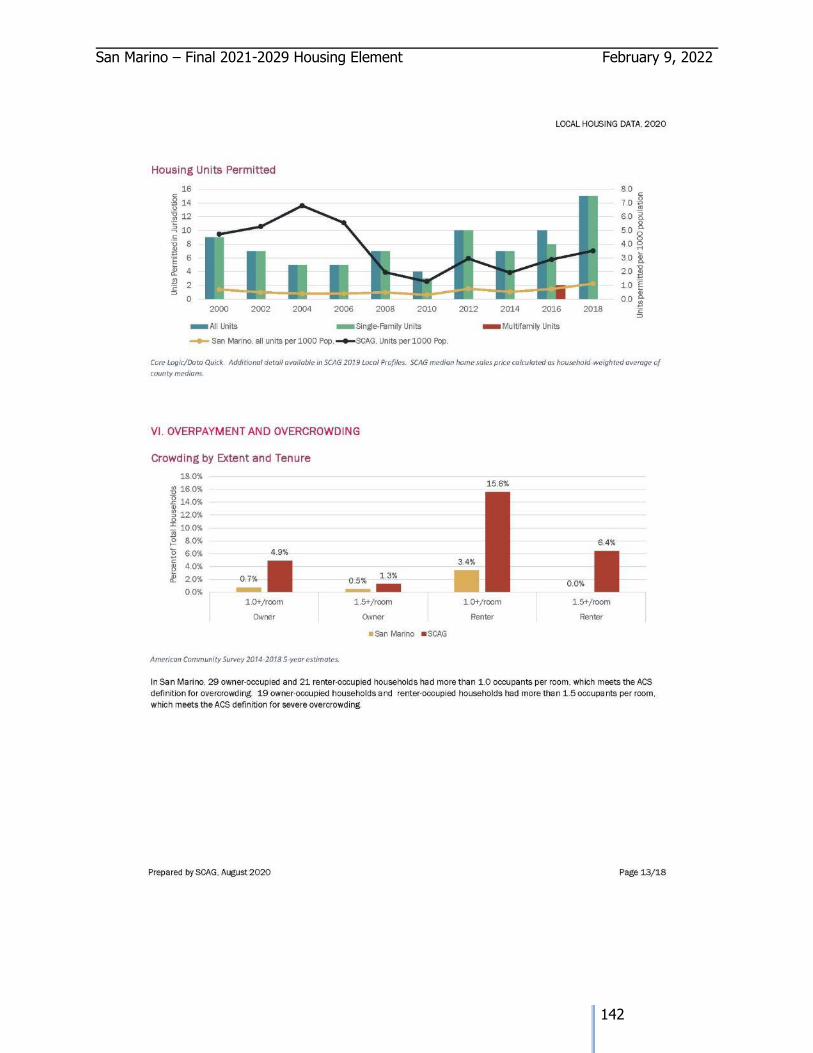
San Marino – Final 2021-2029 Housing Element February 9, 2022
142
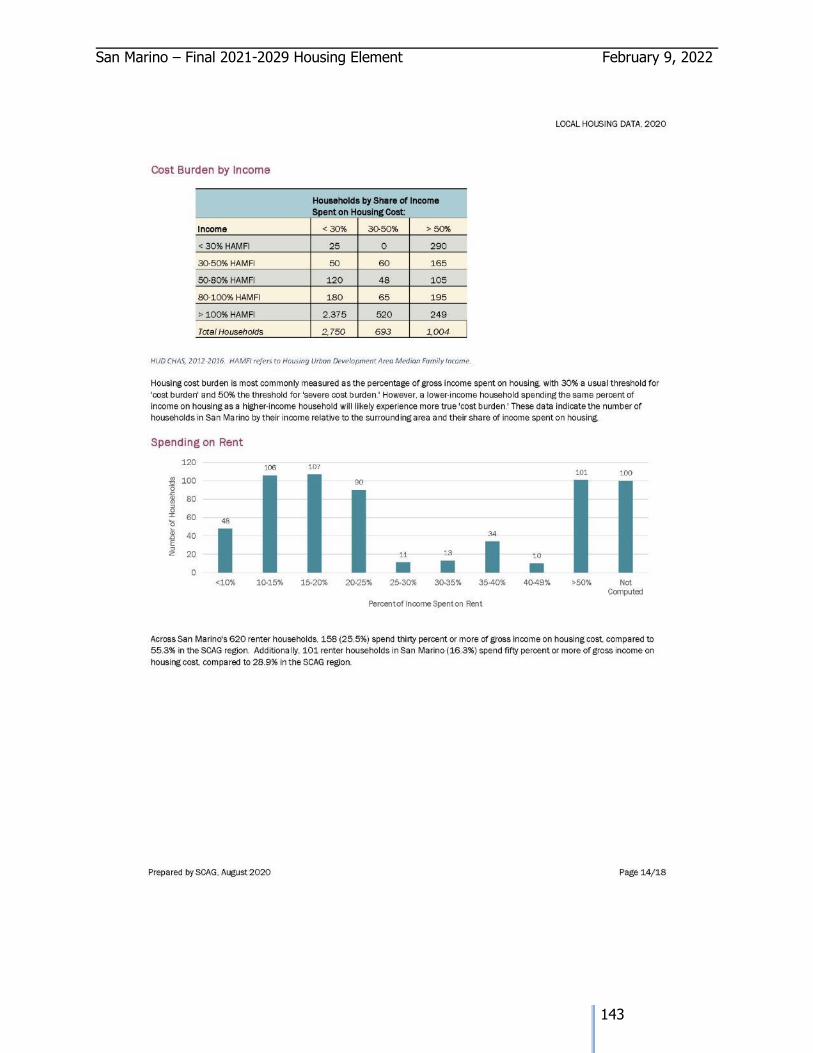
San Marino – Final 2021-2029 Housing Element February 9, 2022
143
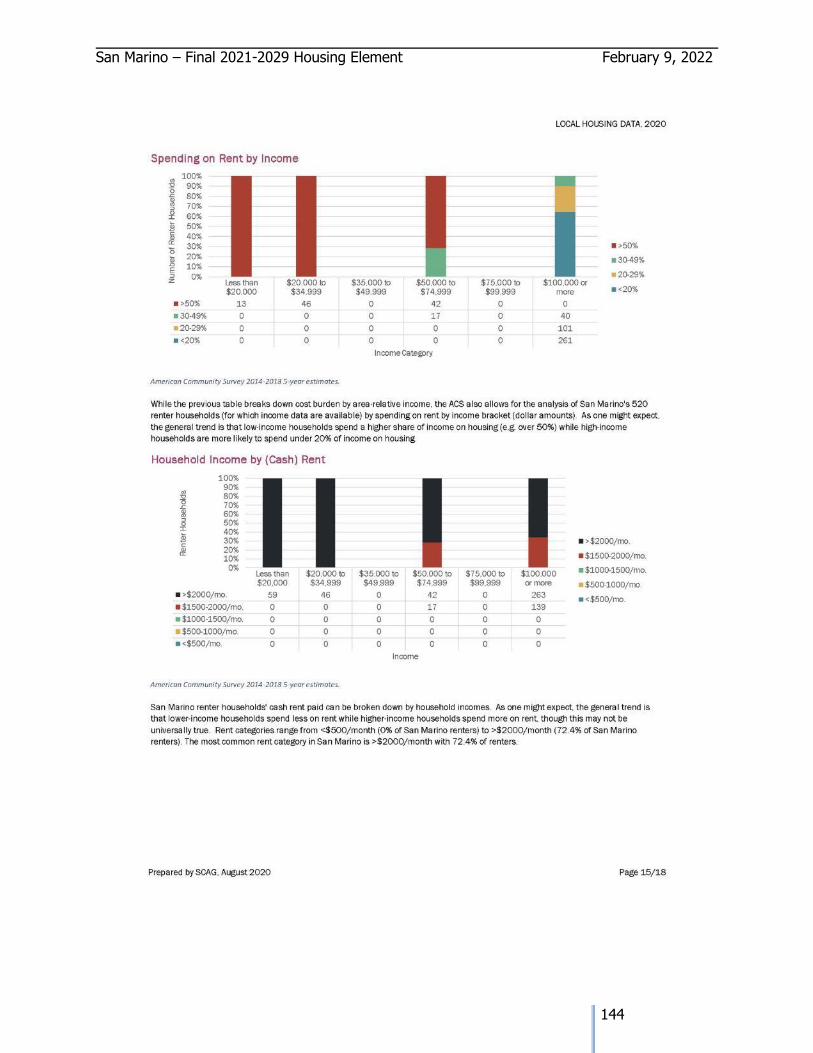
San Marino – Final 2021-2029 Housing Element February 9, 2022
144
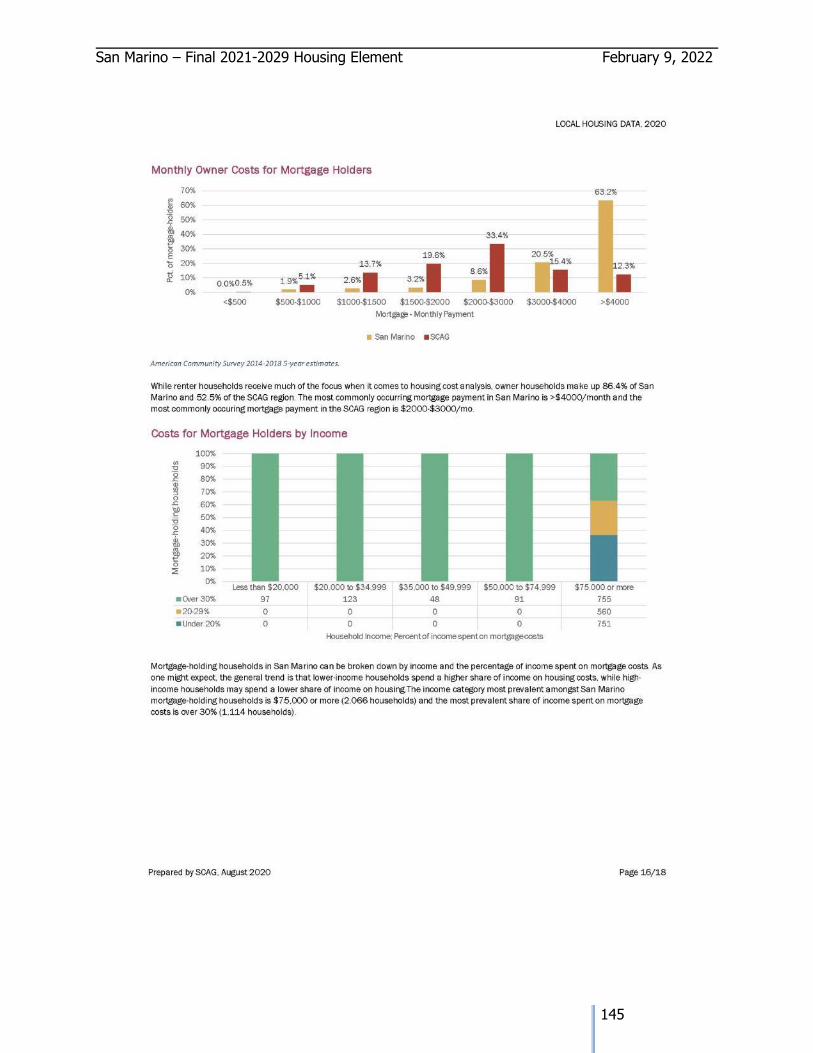
San Marino – Final 2021-2029 Housing Element February 9, 2022
145
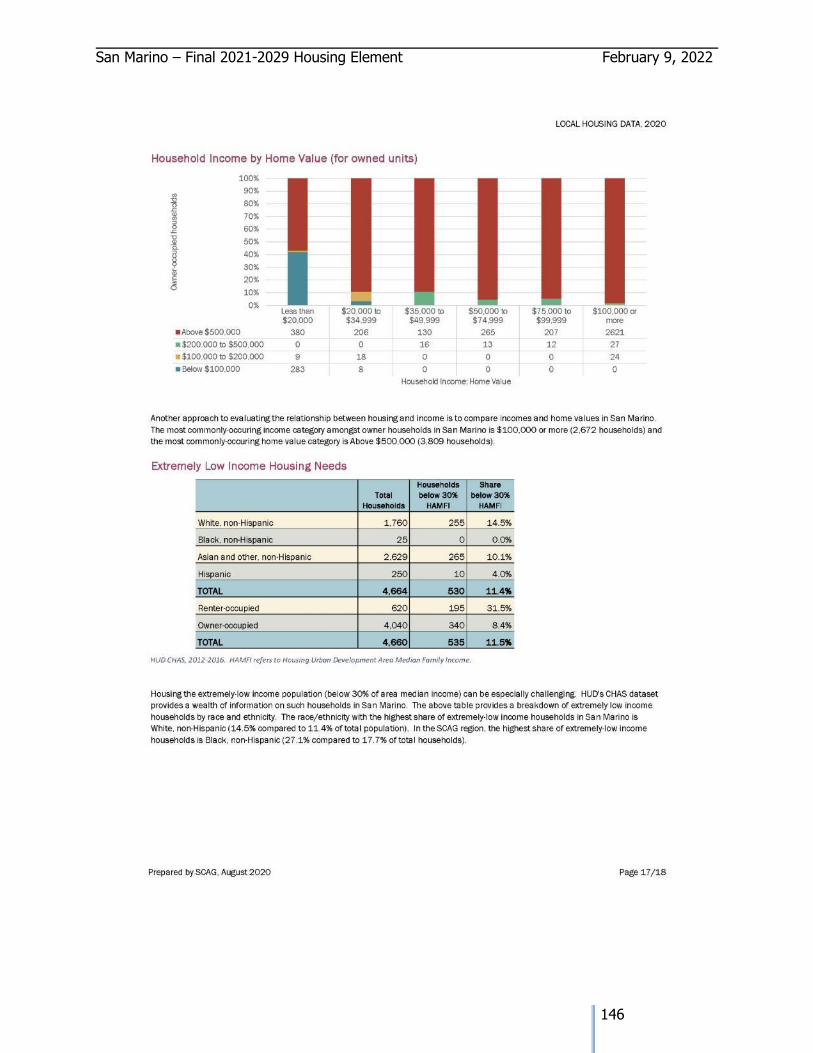
San Marino – Final 2021-2029 Housing Element February 9, 2022
146
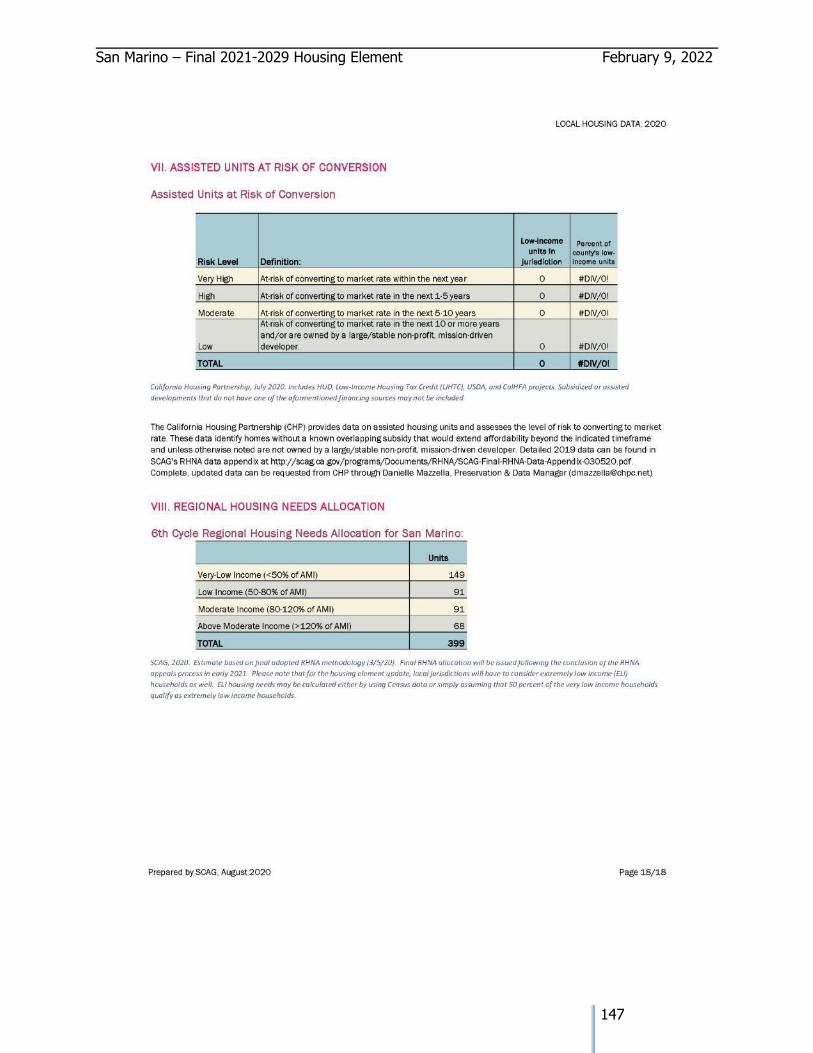
San Marino – Final 2021-2029 Housing Element February 9, 2022
147
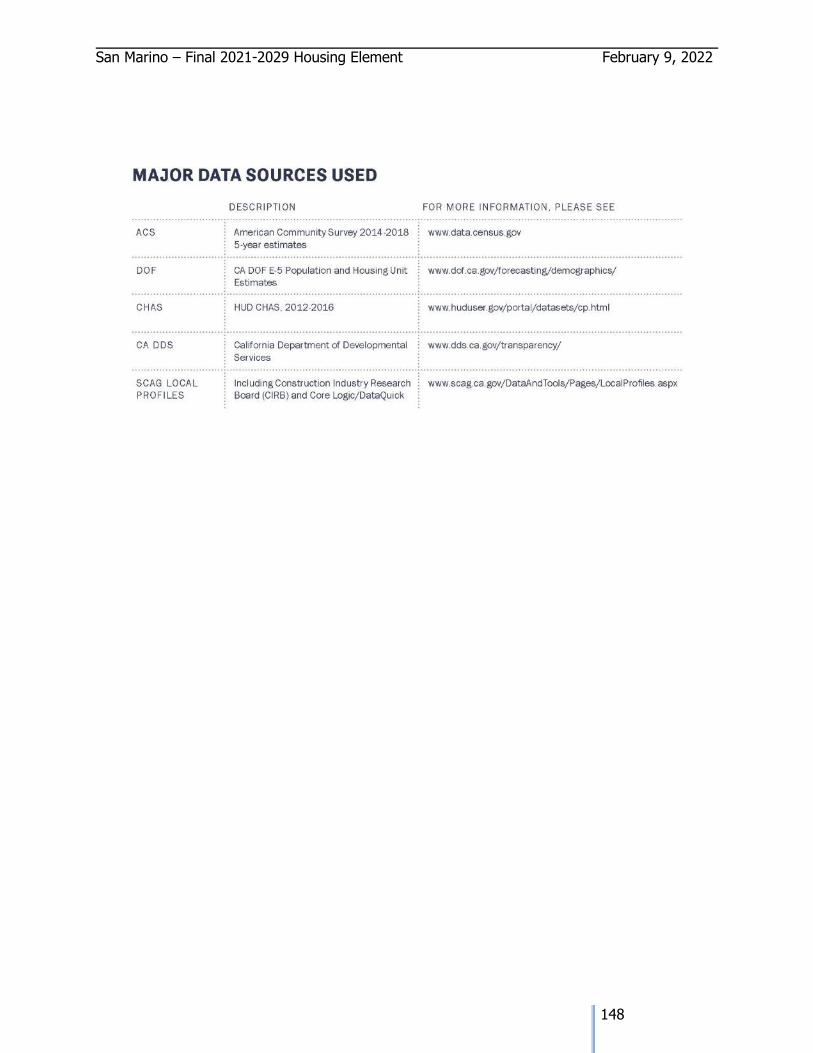
San Marino – Final 2021-2029 Housing Element February 9, 2022
148
San Marino – Final 2021-2029 Housing Element February 9, 2022
149
San Marino – Final 2021-2029 Housing Element February 9, 2022
150
APPENDIX B: COMMUNITY ENGAGEMENT
Government Code §65583 (c)(7) requires local government to “Include a diligent effort by the
local government to achieve public participation of all economic segments of the community in
the development of the housing element, and the program shall describe this effort”. The federal
Affirmatively Further Fair Housing Final Rule also requires community participation in the City's
Assessment of Fair Housing (AFH). Community engagement efforts undertaken for the 2021
Housing Element are summarized in Section 1.
Public Outreach Summary
Housing issues affect the entire community and can be confusing and contentious. State
requirements about what Housing Elements must allow often seem at odds with long-standing
community values. The public participation requirement of Housing Element law presents an
opportunity to engage constituents in defining housing issues, and in creating solutions that both
meet the needs of the community and the requirements of state law.
The ongoing restrictions on gatherings due to the COVID-19 pandemic have forced community
outreach
and engagement into a virtual world. While in some cases this has made it possible for more
people to be engaged in the process, a digital divide often exists in cases where households may
lack internet connections or may be unable to attend virtual meetings due to work obligations.
To ensure that community outreach during the pandemic has been as equitable as possible, the
community outreach program was designed to provide participation opportunities via cell phone
and at the convenience of the resident. San Marino’s Housing Element Update has included the
following public outreach efforts:
• December 7, 2020: City Council held a virtual Town Hall to introduce the
Housing Element update and to present an overview of the Housing Element
Update process and new laws.
• December 29, 2020: City developed and launched a webpage at
http://cityofsanmarino.org/housingelement dedicated to the update of the
Housing Element. The website includes a dedicated e-mail address for the
Housing Element Update, a background on the Housing Element and its purpose;
opportunities for participation; and links to meeting materials, presentations, and
document drafts for public review. An outreach and notification list were
developed and used throughout the update process.
• November 2020- January 2021: Community opinion surveys were conducted
in English, Spanish, and Chinese. The surveys were structured to allow full
participation via cell phone to overcome any digital divide. Survey results are
provided in Section 4.
• January-April 2021: Stakeholder interviews conducted with responsive
contacts representing for- and not-for-profit developers, advocacy groups, and
service providers, including Southern California Non-profit Housing Association;
San Marino – Final 2021-2029 Housing Element February 9, 2022
151
Milestone Housing Development Corporation; the Chinese Club of San Marino;
the Los Angeles County Economic Development Corporation; and the Pasadena-
Foothills Association of Realtors.
• February 24, 2021: Planning Commission held a publicly noticed workshop on
the Housing Element Update. The Commission discussed the challenges faced by
the City, took public input, and provided policy direction to staff in formulating
strategies for meeting the State Housing Element mandates and identifying
adequate sites to meet the City’s RHNA.
• April 16, 2021: City Council held a publicly noticed workshop on the Housing
Element Update and reviewed the Draft Housing Strategy (Policies and Programs
for the Housing Element) and a preliminary rezoning program to address the
City’s RHNA shortfall. The City Council reviewed the draft set of policies and
discussed options to meet the Housing Element requirements and community
housing needs. The City Council provided feedback and direction on the
preparation of a draft for review by the public and by the State Department of
Housing and Community Development (HCD). Notices for this workshop were
sent to the outreach and notification list, as well as to those who had provided
contact information on the community surveys and those that had spoken at
previous meetings.
• July 17, 2021: City Council held a publicly noticed workshop to review the Draft
Housing Element for possible transmittal to the State.
• July 21, 2021: Public Review Draft Housing Element was released and made
available on the established website. Notices of the release of the draft
document were sent to the outreach and notification list, including those who
had spoken at previous meetings.
• August 3, 2021: City Council held a publicly noticed meeting to receive public
input regarding the Housing Element Update and provided further direction to
staff and consultants regarding sites to include on the inventory lists to be
considered for rezoning.
• August 25, 2021: City held a Town Hall to continue to receive public input on
the Draft Housing Element and advise the community of future opportunities to
comments on the update document or meet with a planner individually to discuss
the update process. Announcements for this Town Hall were included in two
weekly community newsletters, advertised on social media, and mailed to
tenants and property owners of the sites added to the updated Sites Inventory
list.
• September 24, 2021: The City Council held a duly noticed public meeting to
take public comment and requested additional changes to be made to the Draft
Housing Element.
• October 29, 2021: The City Council held a public meeting and authorized staff
to transmit the Draft to HCD to begin their review.
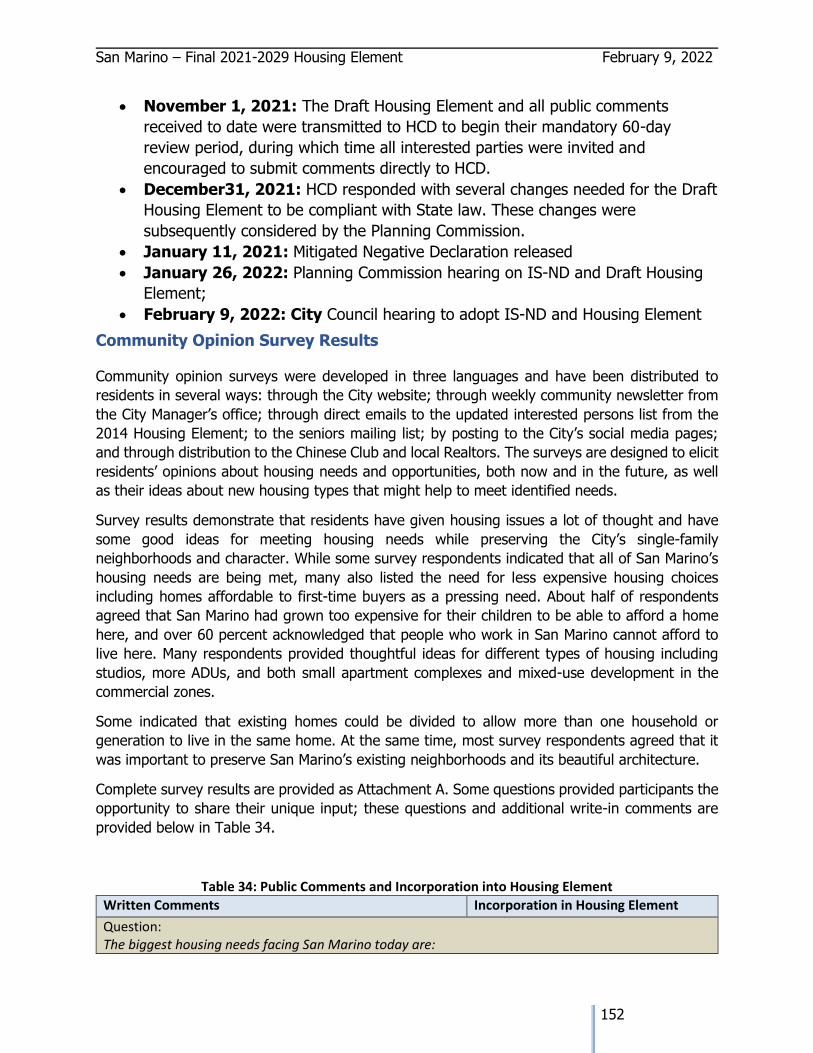
San Marino – Final 2021-2029 Housing Element February 9, 2022
152
• November 1, 2021: The Draft Housing Element and all public comments
received to date were transmitted to HCD to begin their mandatory 60-day
review period, during which time all interested parties were invited and
encouraged to submit comments directly to HCD.
• December31, 2021: HCD responded with several changes needed for the Draft
Housing Element to be compliant with State law. These changes were
subsequently considered by the Planning Commission.
• January 11, 2021: Mitigated Negative Declaration released
• January 26, 2022: Planning Commission hearing on IS-ND and Draft Housing
Element;
• February 9, 2022: City Council hearing to adopt IS-ND and Housing Element
Community Opinion Survey Results
Community opinion surveys were developed in three languages and have been distributed to
residents in several ways: through the City website; through weekly community newsletter from
the City Manager’s office; through direct emails to the updated interested persons list from the
2014 Housing Element; to the seniors mailing list; by posting to the City’s social media pages;
and through distribution to the Chinese Club and local Realtors. The surveys are designed to elicit
residents’ opinions about housing needs and opportunities, both now and in the future, as well
as their ideas about new housing types that might help to meet identified needs.
Survey results demonstrate that residents have given housing issues a lot of thought and have
some good ideas for meeting housing needs while preserving the City’s single-family
neighborhoods and character. While some survey respondents indicated that all of San Marino’s
housing needs are being met, many also listed the need for less expensive housing choices
including homes affordable to first-time buyers as a pressing need. About half of respondents
agreed that San Marino had grown too expensive for their children to be able to afford a home
here, and over 60 percent acknowledged that people who work in San Marino cannot afford to
live here. Many respondents provided thoughtful ideas for different types of housing including
studios, more ADUs, and both small apartment complexes and mixed-use development in the
commercial zones.
Some indicated that existing homes could be divided to allow more than one household or
generation to live in the same home. At the same time, most survey respondents agreed that it
was important to preserve San Marino’s existing neighborhoods and its beautiful architecture.
Complete survey results are provided as Attachment A. Some questions provided participants the
opportunity to share their unique input; these questions and additional write-in comments are
provided below in Table 34.
Table 34: Public Comments and Incorporation into Housing Element
Written Comments Incorporation in Housing Element
Question: The biggest housing needs facing San Marino today are:
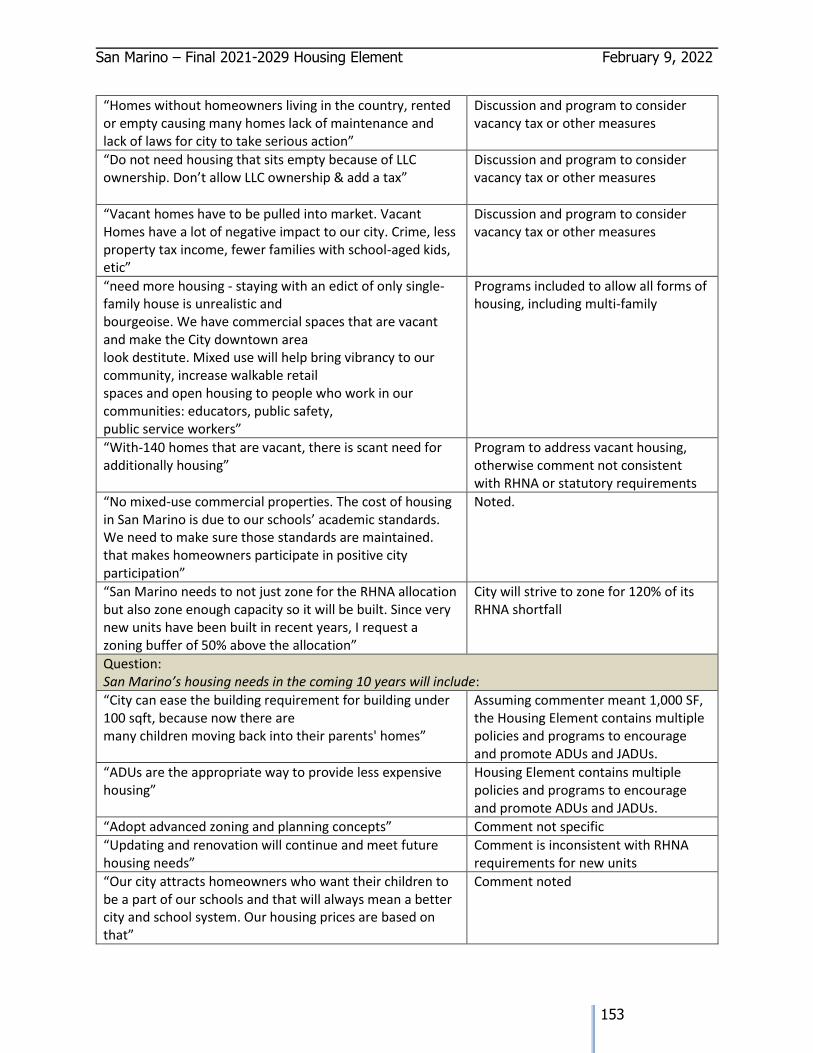
San Marino – Final 2021-2029 Housing Element February 9, 2022
153
“Homes without homeowners living in the country, rented or empty causing many homes lack of maintenance and lack of laws for city to take serious action”
Discussion and program to consider vacancy tax or other measures
“Do not need housing that sits empty because of LLC ownership. Don’t allow LLC ownership & add a tax”
Discussion and program to consider vacancy tax or other measures
“Vacant homes have to be pulled into market. Vacant Homes have a lot of negative impact to our city. Crime, less property tax income, fewer families with school-aged kids, etic”
Discussion and program to consider vacancy tax or other measures
“need more housing - staying with an edict of only single-family house is unrealistic and bourgeoise. We have commercial spaces that are vacant and make the City downtown area look destitute. Mixed use will help bring vibrancy to our community, increase walkable retail spaces and open housing to people who work in our communities: educators, public safety, public service workers”
Programs included to allow all forms of housing, including multi-family
“With-140 homes that are vacant, there is scant need for additionally housing”
Program to address vacant housing, otherwise comment not consistent with RHNA or statutory requirements
“No mixed-use commercial properties. The cost of housing in San Marino is due to our schools’ academic standards. We need to make sure those standards are maintained. that makes homeowners participate in positive city participation”
Noted.
“San Marino needs to not just zone for the RHNA allocation but also zone enough capacity so it will be built. Since very new units have been built in recent years, I request a zoning buffer of 50% above the allocation”
City will strive to zone for 120% of its RHNA shortfall
Question: San Marino’s housing needs in the coming 10 years will include:
“City can ease the building requirement for building under 100 sqft, because now there are many children moving back into their parents' homes”
Assuming commenter meant 1,000 SF, the Housing Element contains multiple policies and programs to encourage and promote ADUs and JADUs.
“ADUs are the appropriate way to provide less expensive housing”
Housing Element contains multiple policies and programs to encourage and promote ADUs and JADUs.
“Adopt advanced zoning and planning concepts” Comment not specific
“Updating and renovation will continue and meet future housing needs”
Comment is inconsistent with RHNA requirements for new units
“Our city attracts homeowners who want their children to be a part of our schools and that will always mean a better city and school system. Our housing prices are based on that”
Comment noted
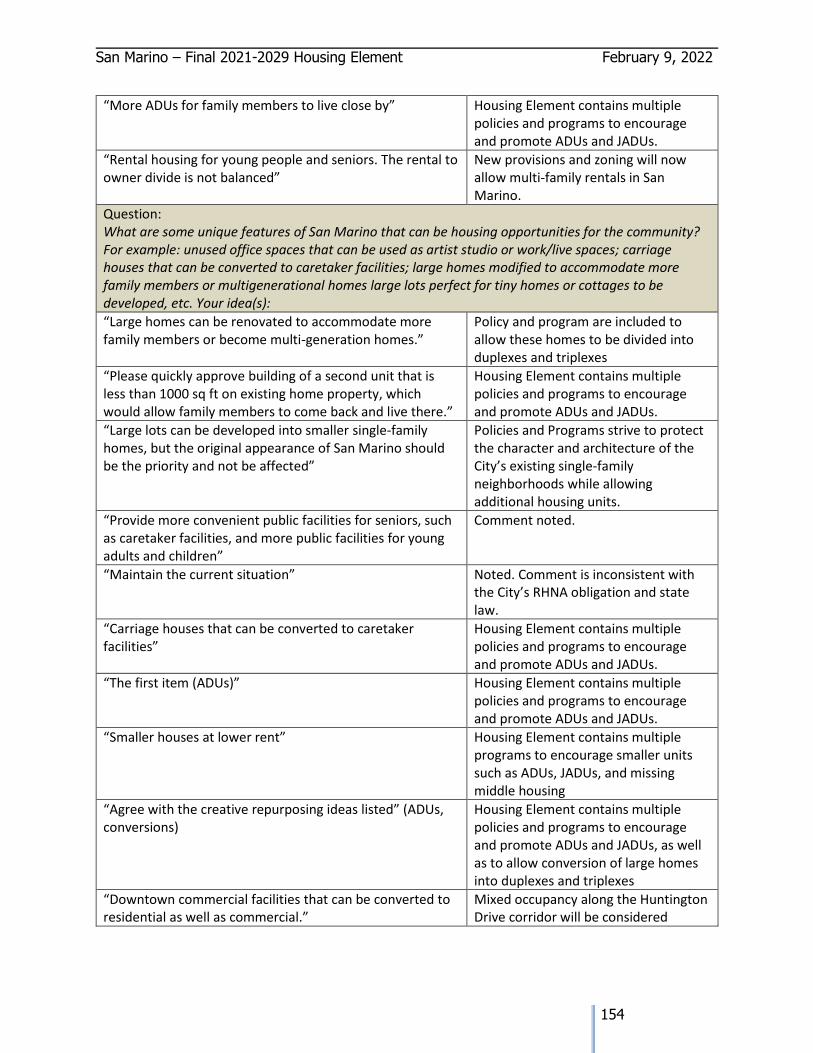
San Marino – Final 2021-2029 Housing Element February 9, 2022
154
“More ADUs for family members to live close by” Housing Element contains multiple policies and programs to encourage and promote ADUs and JADUs.
“Rental housing for young people and seniors. The rental to owner divide is not balanced”
New provisions and zoning will now allow multi-family rentals in San Marino.
Question: What are some unique features of San Marino that can be housing opportunities for the community? For example: unused office spaces that can be used as artist studio or work/live spaces; carriage houses that can be converted to caretaker facilities; large homes modified to accommodate more family members or multigenerational homes large lots perfect for tiny homes or cottages to be developed, etc. Your idea(s):
“Large homes can be renovated to accommodate more family members or become multi-generation homes.”
Policy and program are included to allow these homes to be divided into duplexes and triplexes
“Please quickly approve building of a second unit that is less than 1000 sq ft on existing home property, which would allow family members to come back and live there.”
Housing Element contains multiple policies and programs to encourage and promote ADUs and JADUs.
“Large lots can be developed into smaller single-family homes, but the original appearance of San Marino should be the priority and not be affected”
Policies and Programs strive to protect the character and architecture of the City’s existing single-family neighborhoods while allowing additional housing units.
“Provide more convenient public facilities for seniors, such as caretaker facilities, and more public facilities for young adults and children”
Comment noted.
“Maintain the current situation” Noted. Comment is inconsistent with the City’s RHNA obligation and state law.
“Carriage houses that can be converted to caretaker facilities”
Housing Element contains multiple policies and programs to encourage and promote ADUs and JADUs.
“The first item (ADUs)” Housing Element contains multiple policies and programs to encourage and promote ADUs and JADUs.
“Smaller houses at lower rent” Housing Element contains multiple programs to encourage smaller units such as ADUs, JADUs, and missing middle housing
“Agree with the creative repurposing ideas listed” (ADUs, conversions)
Housing Element contains multiple policies and programs to encourage and promote ADUs and JADUs, as well as to allow conversion of large homes into duplexes and triplexes
“Downtown commercial facilities that can be converted to residential as well as commercial.”
Mixed occupancy along the Huntington Drive corridor will be considered
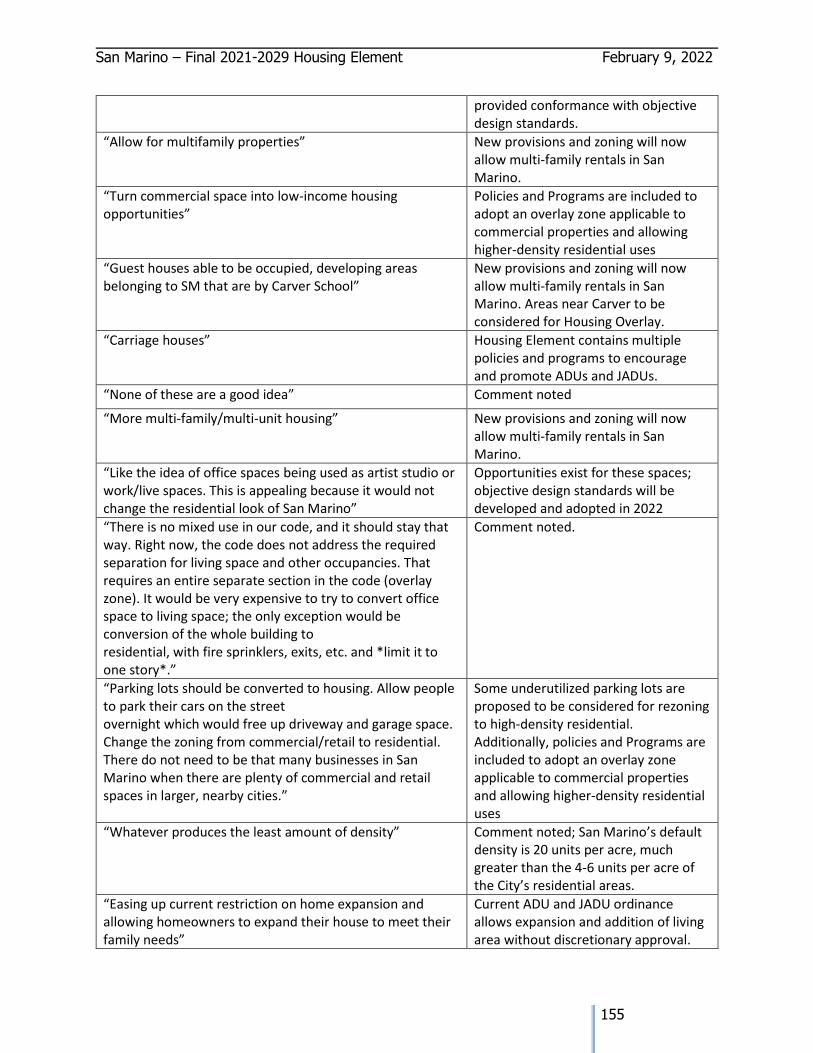
San Marino – Final 2021-2029 Housing Element February 9, 2022
155
provided conformance with objective design standards.
“Allow for multifamily properties” New provisions and zoning will now allow multi-family rentals in San Marino.
“Turn commercial space into low-income housing opportunities”
Policies and Programs are included to adopt an overlay zone applicable to commercial properties and allowing higher-density residential uses
“Guest houses able to be occupied, developing areas belonging to SM that are by Carver School”
New provisions and zoning will now allow multi-family rentals in San Marino. Areas near Carver to be considered for Housing Overlay.
“Carriage houses” Housing Element contains multiple policies and programs to encourage and promote ADUs and JADUs.
“None of these are a good idea” Comment noted
“More multi-family/multi-unit housing” New provisions and zoning will now allow multi-family rentals in San Marino.
“Like the idea of office spaces being used as artist studio or work/live spaces. This is appealing because it would not change the residential look of San Marino”
Opportunities exist for these spaces; objective design standards will be developed and adopted in 2022
“There is no mixed use in our code, and it should stay that way. Right now, the code does not address the required separation for living space and other occupancies. That requires an entire separate section in the code (overlay zone). It would be very expensive to try to convert office space to living space; the only exception would be conversion of the whole building to residential, with fire sprinklers, exits, etc. and *limit it to one story*.”
Comment noted.
“Parking lots should be converted to housing. Allow people to park their cars on the street overnight which would free up driveway and garage space. Change the zoning from commercial/retail to residential. There do not need to be that many businesses in San Marino when there are plenty of commercial and retail spaces in larger, nearby cities.”
Some underutilized parking lots are proposed to be considered for rezoning to high-density residential. Additionally, policies and Programs are included to adopt an overlay zone applicable to commercial properties and allowing higher-density residential uses
“Whatever produces the least amount of density” Comment noted; San Marino’s default density is 20 units per acre, much greater than the 4-6 units per acre of the City’s residential areas.
“Easing up current restriction on home expansion and allowing homeowners to expand their house to meet their family needs”
Current ADU and JADU ordinance allows expansion and addition of living area without discretionary approval.
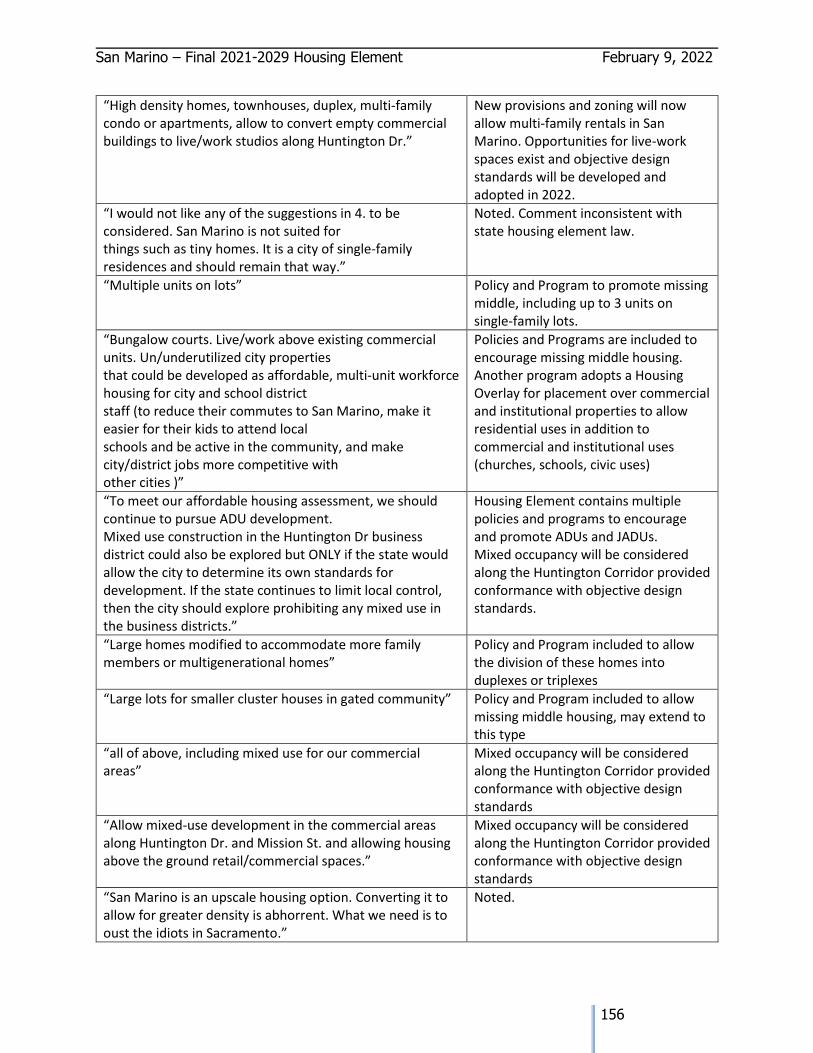
San Marino – Final 2021-2029 Housing Element February 9, 2022
156
“High density homes, townhouses, duplex, multi-family condo or apartments, allow to convert empty commercial buildings to live/work studios along Huntington Dr.”
New provisions and zoning will now allow multi-family rentals in San Marino. Opportunities for live-work spaces exist and objective design standards will be developed and adopted in 2022.
“I would not like any of the suggestions in 4. to be considered. San Marino is not suited for things such as tiny homes. It is a city of single-family residences and should remain that way.”
Noted. Comment inconsistent with state housing element law.
“Multiple units on lots” Policy and Program to promote missing middle, including up to 3 units on single-family lots.
“Bungalow courts. Live/work above existing commercial units. Un/underutilized city properties that could be developed as affordable, multi-unit workforce housing for city and school district staff (to reduce their commutes to San Marino, make it easier for their kids to attend local schools and be active in the community, and make city/district jobs more competitive with other cities )”
Policies and Programs are included to encourage missing middle housing. Another program adopts a Housing Overlay for placement over commercial and institutional properties to allow residential uses in addition to commercial and institutional uses (churches, schools, civic uses)
“To meet our affordable housing assessment, we should continue to pursue ADU development. Mixed use construction in the Huntington Dr business district could also be explored but ONLY if the state would allow the city to determine its own standards for development. If the state continues to limit local control, then the city should explore prohibiting any mixed use in the business districts.”
Housing Element contains multiple policies and programs to encourage and promote ADUs and JADUs. Mixed occupancy will be considered along the Huntington Corridor provided conformance with objective design standards.
“Large homes modified to accommodate more family members or multigenerational homes”
Policy and Program included to allow the division of these homes into duplexes or triplexes
“Large lots for smaller cluster houses in gated community” Policy and Program included to allow missing middle housing, may extend to this type
“all of above, including mixed use for our commercial areas”
Mixed occupancy will be considered along the Huntington Corridor provided conformance with objective design standards
“Allow mixed-use development in the commercial areas along Huntington Dr. and Mission St. and allowing housing above the ground retail/commercial spaces.”
Mixed occupancy will be considered along the Huntington Corridor provided conformance with objective design standards
“San Marino is an upscale housing option. Converting it to allow for greater density is abhorrent. What we need is to oust the idiots in Sacramento.”
Noted.
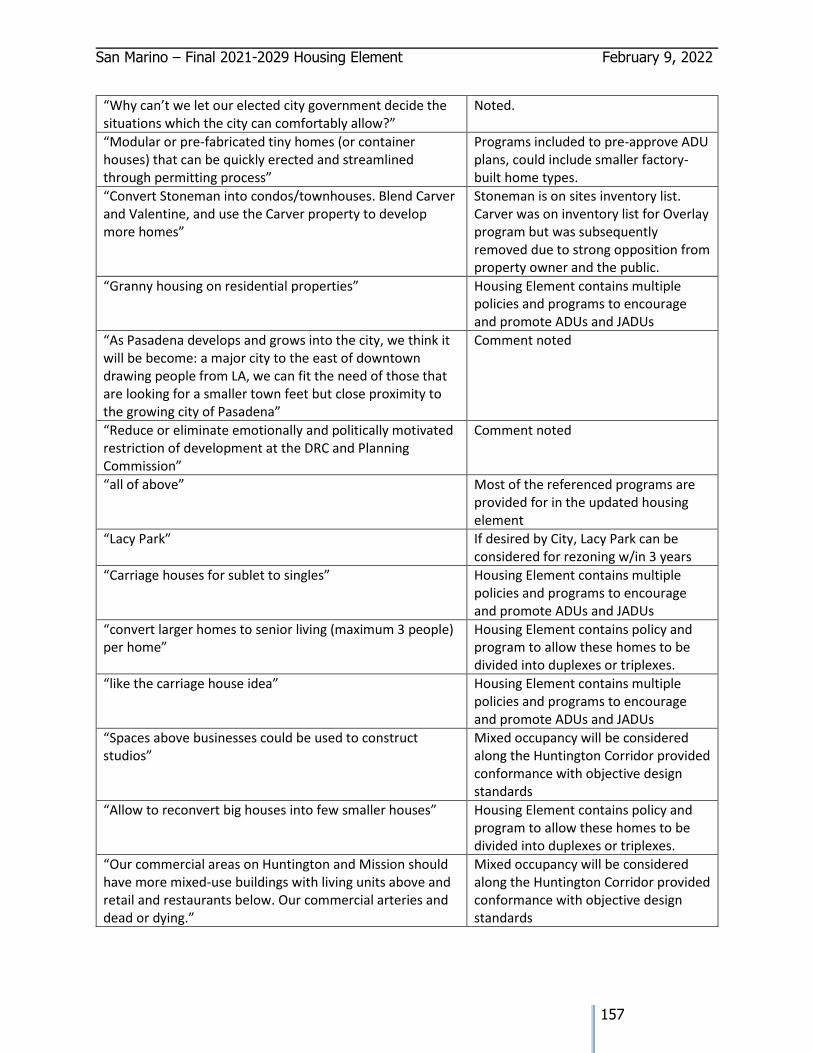
San Marino – Final 2021-2029 Housing Element February 9, 2022
157
“Why can’t we let our elected city government decide the situations which the city can comfortably allow?”
Noted.
“Modular or pre-fabricated tiny homes (or container houses) that can be quickly erected and streamlined through permitting process”
Programs included to pre-approve ADU plans, could include smaller factory-built home types.
“Convert Stoneman into condos/townhouses. Blend Carver and Valentine, and use the Carver property to develop more homes”
Stoneman is on sites inventory list. Carver was on inventory list for Overlay program but was subsequently removed due to strong opposition from property owner and the public.
“Granny housing on residential properties” Housing Element contains multiple policies and programs to encourage and promote ADUs and JADUs
“As Pasadena develops and grows into the city, we think it will be become: a major city to the east of downtown drawing people from LA, we can fit the need of those that are looking for a smaller town feet but close proximity to the growing city of Pasadena”
Comment noted
“Reduce or eliminate emotionally and politically motivated restriction of development at the DRC and Planning Commission”
Comment noted
“all of above” Most of the referenced programs are provided for in the updated housing element
“Lacy Park” If desired by City, Lacy Park can be considered for rezoning w/in 3 years
“Carriage houses for sublet to singles” Housing Element contains multiple policies and programs to encourage and promote ADUs and JADUs
“convert larger homes to senior living (maximum 3 people) per home”
Housing Element contains policy and program to allow these homes to be divided into duplexes or triplexes.
“like the carriage house idea” Housing Element contains multiple policies and programs to encourage and promote ADUs and JADUs
“Spaces above businesses could be used to construct studios”
Mixed occupancy will be considered along the Huntington Corridor provided conformance with objective design standards
“Allow to reconvert big houses into few smaller houses” Housing Element contains policy and program to allow these homes to be divided into duplexes or triplexes.
“Our commercial areas on Huntington and Mission should have more mixed-use buildings with living units above and retail and restaurants below. Our commercial arteries and dead or dying.”
Mixed occupancy will be considered along the Huntington Corridor provided conformance with objective design standards
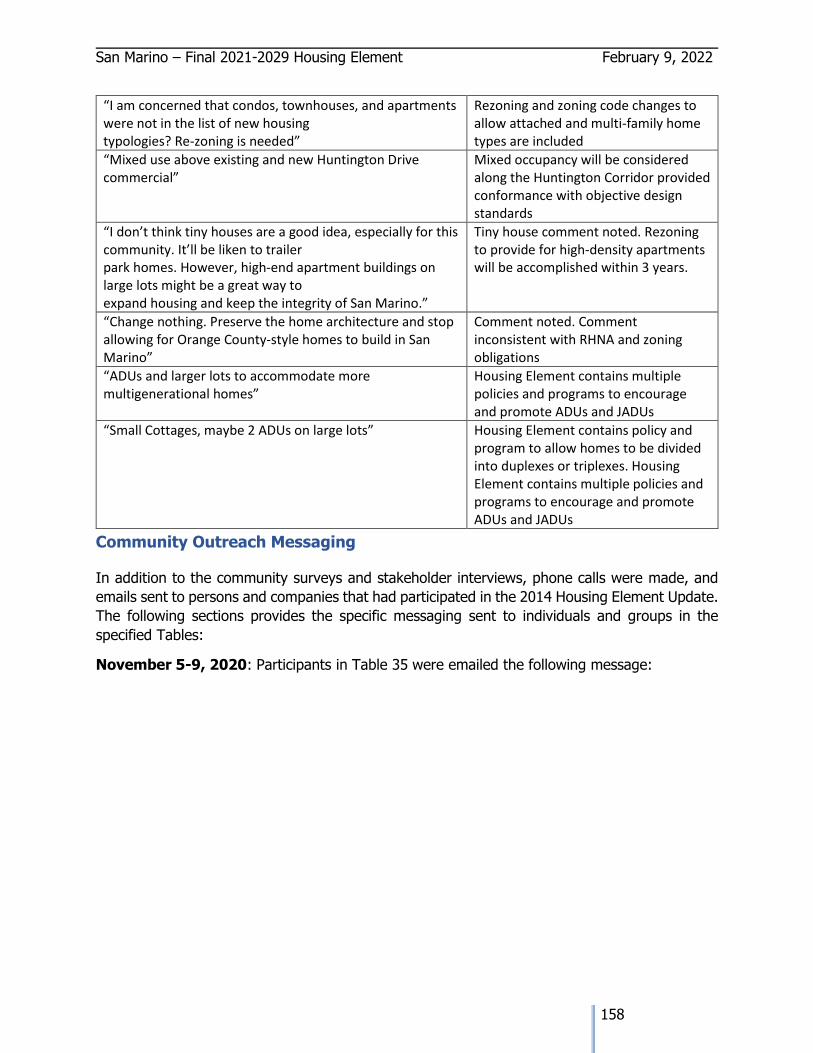
San Marino – Final 2021-2029 Housing Element February 9, 2022
158
“I am concerned that condos, townhouses, and apartments were not in the list of new housing typologies? Re-zoning is needed”
Rezoning and zoning code changes to allow attached and multi-family home types are included
“Mixed use above existing and new Huntington Drive commercial”
Mixed occupancy will be considered along the Huntington Corridor provided conformance with objective design standards
“I don’t think tiny houses are a good idea, especially for this community. It’ll be liken to trailer park homes. However, high-end apartment buildings on large lots might be a great way to expand housing and keep the integrity of San Marino.”
Tiny house comment noted. Rezoning to provide for high-density apartments will be accomplished within 3 years.
“Change nothing. Preserve the home architecture and stop allowing for Orange County-style homes to build in San Marino”
Comment noted. Comment inconsistent with RHNA and zoning obligations
“ADUs and larger lots to accommodate more multigenerational homes”
Housing Element contains multiple policies and programs to encourage and promote ADUs and JADUs
“Small Cottages, maybe 2 ADUs on large lots” Housing Element contains policy and program to allow homes to be divided into duplexes or triplexes. Housing Element contains multiple policies and programs to encourage and promote ADUs and JADUs
Community Outreach Messaging
In addition to the community surveys and stakeholder interviews, phone calls were made, and
emails sent to persons and companies that had participated in the 2014 Housing Element Update.
The following sections provides the specific messaging sent to individuals and groups in the
specified Tables:
November 5-9, 2020: Participants in Table 35 were emailed the following message:
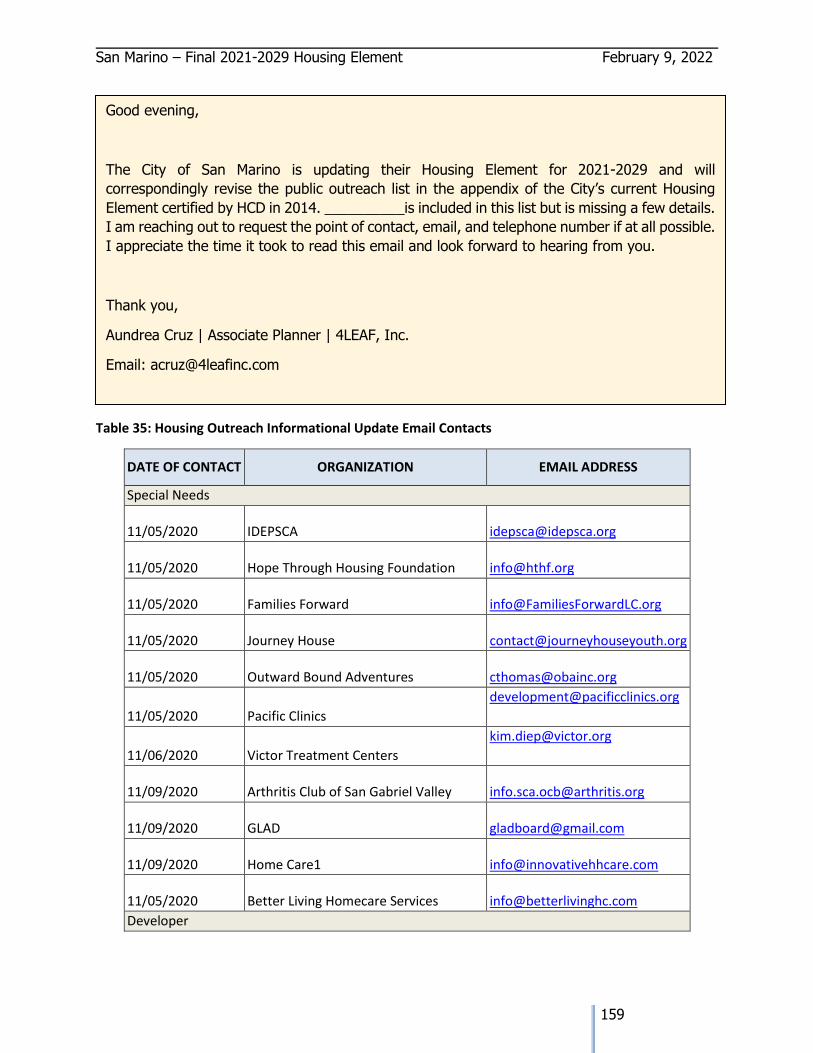
San Marino – Final 2021-2029 Housing Element February 9, 2022
159
Table 35: Housing Outreach Informational Update Email Contacts
DATE OF CONTACT ORGANIZATION EMAIL ADDRESS
Special Needs
11/05/2020 IDEPSCA [email protected]
11/05/2020 Hope Through Housing Foundation [email protected]
11/05/2020 Families Forward [email protected]
11/05/2020 Journey House [email protected]
11/05/2020 Outward Bound Adventures [email protected]
11/05/2020 Pacific Clinics
11/06/2020 Victor Treatment Centers
11/09/2020 Arthritis Club of San Gabriel Valley [email protected]
11/09/2020 GLAD [email protected]
11/09/2020 Home Care1 [email protected]
11/05/2020 Better Living Homecare Services [email protected]
Developer
Good evening,
The City of San Marino is updating their Housing Element for 2021-2029 and will
correspondingly revise the public outreach list in the appendix of the City’s current Housing
Element certified by HCD in 2014. __________is included in this list but is missing a few details.
I am reaching out to request the point of contact, email, and telephone number if at all possible.
I appreciate the time it took to read this email and look forward to hearing from you.
Thank you,
Aundrea Cruz | Associate Planner | 4LEAF, Inc.
Email: [email protected]
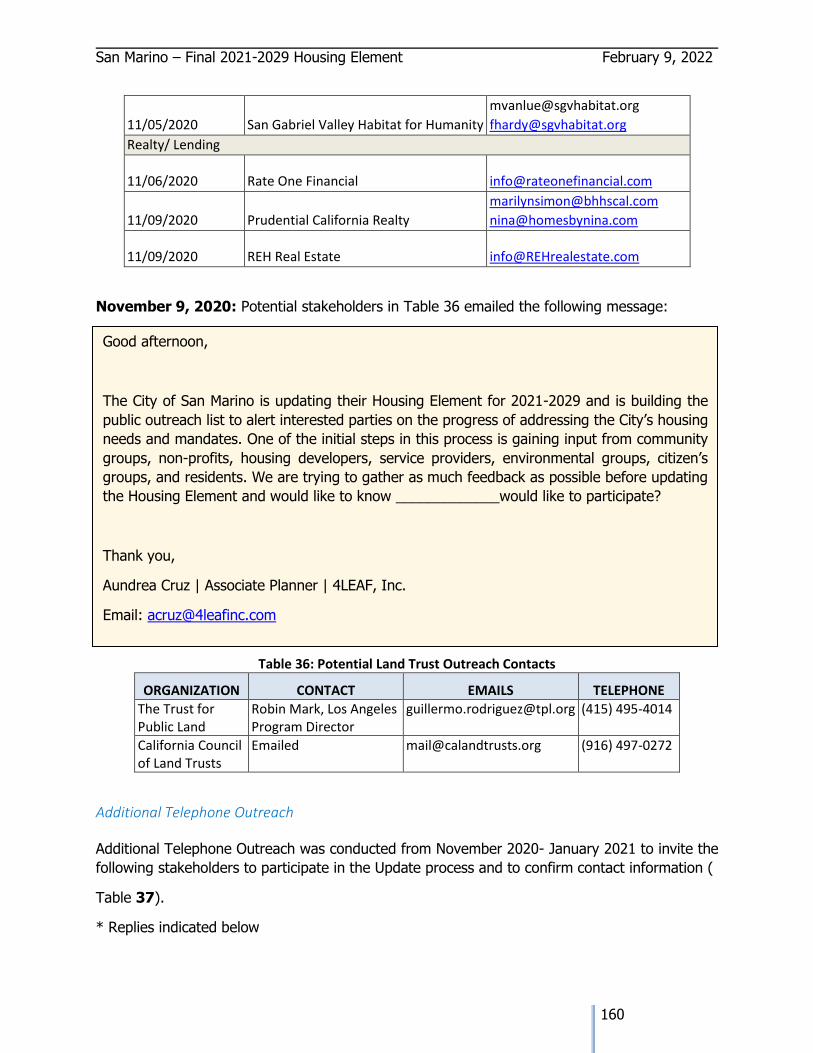
San Marino – Final 2021-2029 Housing Element February 9, 2022
160
11/05/2020 San Gabriel Valley Habitat for Humanity
Realty/ Lending
11/06/2020 Rate One Financial [email protected]
11/09/2020 Prudential California Realty
11/09/2020 REH Real Estate [email protected]
November 9, 2020: Potential stakeholders in Table 36 emailed the following message:
Table 36: Potential Land Trust Outreach Contacts
ORGANIZATION CONTACT EMAILS TELEPHONE
The Trust for Public Land
Robin Mark, Los Angeles Program Director
[email protected] (415) 495-4014
California Council of Land Trusts
Emailed [email protected] (916) 497-0272
Additional Telephone Outreach
Additional Telephone Outreach was conducted from November 2020- January 2021 to invite the
following stakeholders to participate in the Update process and to confirm contact information (
Table 37).
* Replies indicated below
Good afternoon,
The City of San Marino is updating their Housing Element for 2021-2029 and is building the
public outreach list to alert interested parties on the progress of addressing the City’s housing
needs and mandates. One of the initial steps in this process is gaining input from community
groups, non-profits, housing developers, service providers, environmental groups, citizen’s
groups, and residents. We are trying to gather as much feedback as possible before updating
the Housing Element and would like to know _____________would like to participate?
Thank you,
Aundrea Cruz | Associate Planner | 4LEAF, Inc.
Email: [email protected]
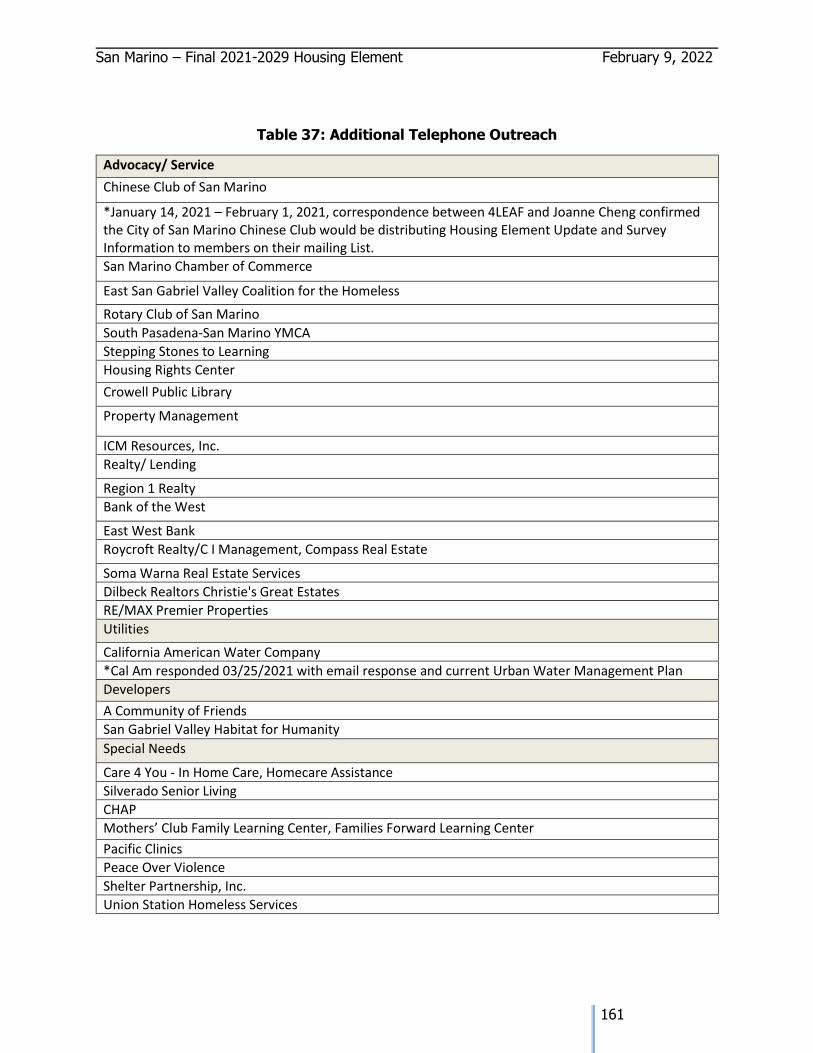
San Marino – Final 2021-2029 Housing Element February 9, 2022
161
Table 37: Additional Telephone Outreach
Advocacy/ Service
Chinese Club of San Marino
*January 14, 2021 – February 1, 2021, correspondence between 4LEAF and Joanne Cheng confirmed the City of San Marino Chinese Club would be distributing Housing Element Update and Survey Information to members on their mailing List.
San Marino Chamber of Commerce
East San Gabriel Valley Coalition for the Homeless
Rotary Club of San Marino
South Pasadena-San Marino YMCA
Stepping Stones to Learning
Housing Rights Center
Crowell Public Library
Property Management
ICM Resources, Inc.
Realty/ Lending
Region 1 Realty
Bank of the West
East West Bank
Roycroft Realty/C I Management, Compass Real Estate
Soma Warna Real Estate Services
Dilbeck Realtors Christie's Great Estates
RE/MAX Premier Properties
Utilities
California American Water Company
*Cal Am responded 03/25/2021 with email response and current Urban Water Management Plan
Developers
A Community of Friends
San Gabriel Valley Habitat for Humanity
Special Needs
Care 4 You - In Home Care, Homecare Assistance
Silverado Senior Living
CHAP
Mothers’ Club Family Learning Center, Families Forward Learning Center
Pacific Clinics
Peace Over Violence
Shelter Partnership, Inc.
Union Station Homeless Services
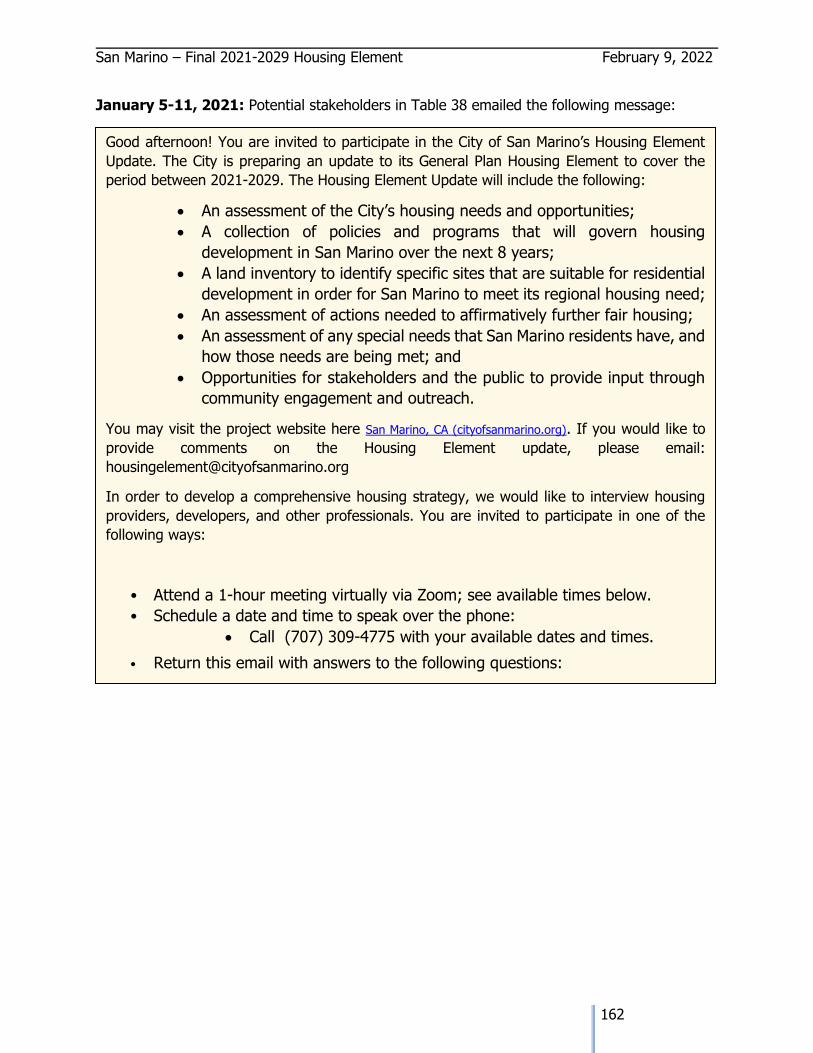
San Marino – Final 2021-2029 Housing Element February 9, 2022
162
January 5-11, 2021: Potential stakeholders in Table 38 emailed the following message:
Good afternoon! You are invited to participate in the City of San Marino’s Housing Element
Update. The City is preparing an update to its General Plan Housing Element to cover the
period between 2021-2029. The Housing Element Update will include the following:
• An assessment of the City’s housing needs and opportunities;
• A collection of policies and programs that will govern housing
development in San Marino over the next 8 years;
• A land inventory to identify specific sites that are suitable for residential
development in order for San Marino to meet its regional housing need;
• An assessment of actions needed to affirmatively further fair housing;
• An assessment of any special needs that San Marino residents have, and
how those needs are being met; and
• Opportunities for stakeholders and the public to provide input through
community engagement and outreach.
You may visit the project website here San Marino, CA (cityofsanmarino.org). If you would like to
provide comments on the Housing Element update, please email:
In order to develop a comprehensive housing strategy, we would like to interview housing
providers, developers, and other professionals. You are invited to participate in one of the
following ways:
• Attend a 1-hour meeting virtually via Zoom; see available times below.
• Schedule a date and time to speak over the phone:
• Call (707) 309-4775 with your available dates and times.
• Return this email with answers to the following questions:
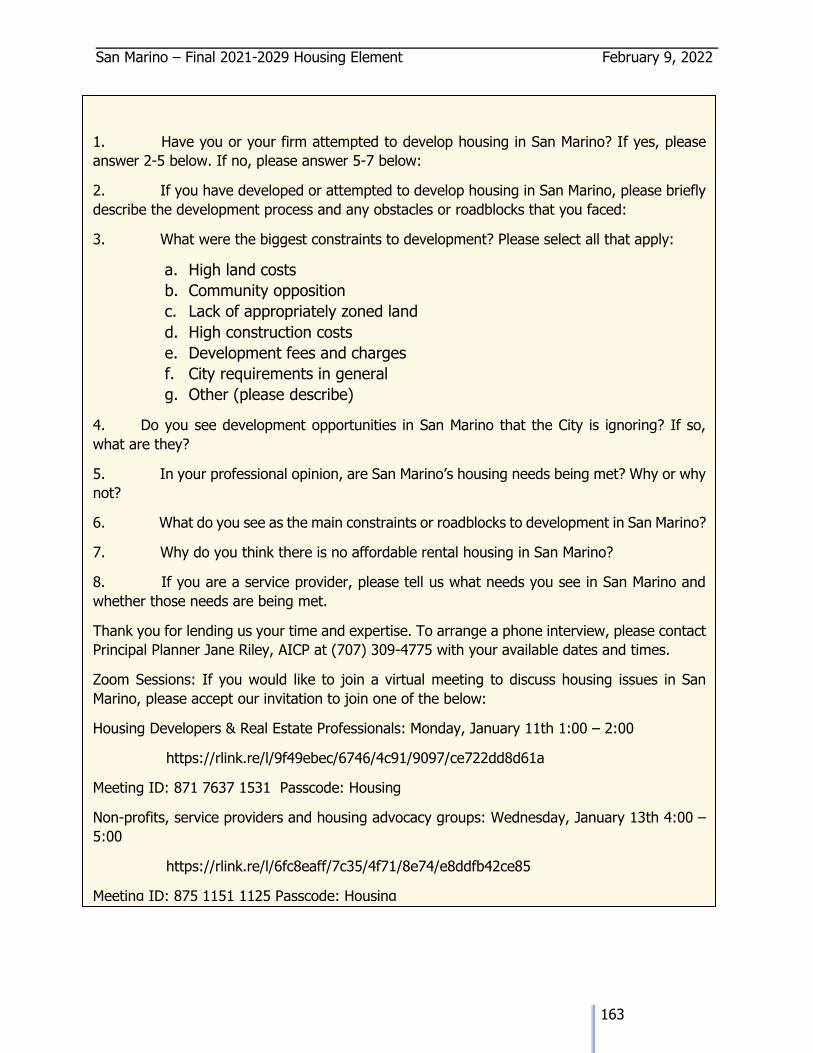
San Marino – Final 2021-2029 Housing Element February 9, 2022
163
1. Have you or your firm attempted to develop housing in San Marino? If yes, please
answer 2-5 below. If no, please answer 5-7 below:
2. If you have developed or attempted to develop housing in San Marino, please briefly
describe the development process and any obstacles or roadblocks that you faced:
3. What were the biggest constraints to development? Please select all that apply:
a. High land costs
b. Community opposition
c. Lack of appropriately zoned land
d. High construction costs
e. Development fees and charges
f. City requirements in general
g. Other (please describe)
4. Do you see development opportunities in San Marino that the City is ignoring? If so,
what are they?
5. In your professional opinion, are San Marino’s housing needs being met? Why or why
not?
6. What do you see as the main constraints or roadblocks to development in San Marino?
7. Why do you think there is no affordable rental housing in San Marino?
8. If you are a service provider, please tell us what needs you see in San Marino and
whether those needs are being met.
Thank you for lending us your time and expertise. To arrange a phone interview, please contact
Principal Planner Jane Riley, AICP at (707) 309-4775 with your available dates and times.
Zoom Sessions: If you would like to join a virtual meeting to discuss housing issues in San
Marino, please accept our invitation to join one of the below:
Housing Developers & Real Estate Professionals: Monday, January 11th 1:00 – 2:00
https://rlink.re/l/9f49ebec/6746/4c91/9097/ce722dd8d61a
Meeting ID: 871 7637 1531 Passcode: Housing
Non-profits, service providers and housing advocacy groups: Wednesday, January 13th 4:00 –
5:00
https://rlink.re/l/6fc8eaff/7c35/4f71/8e74/e8ddfb42ce85
Meeting ID: 875 1151 1125 Passcode: Housing
General meeting invitation: Friday January 8th 1:00 – 2:00
https://rlink.re/l/35be58b7/392b/4d7e/8d07/c522b33150fd
Meeting ID: 821 2912 5735 Passcode: Housing
If you know of other housing developers or service providers who have considered developing
in San Marino, please let us know via return email by Wednesday, January 13th so that we can
invite them to participate.
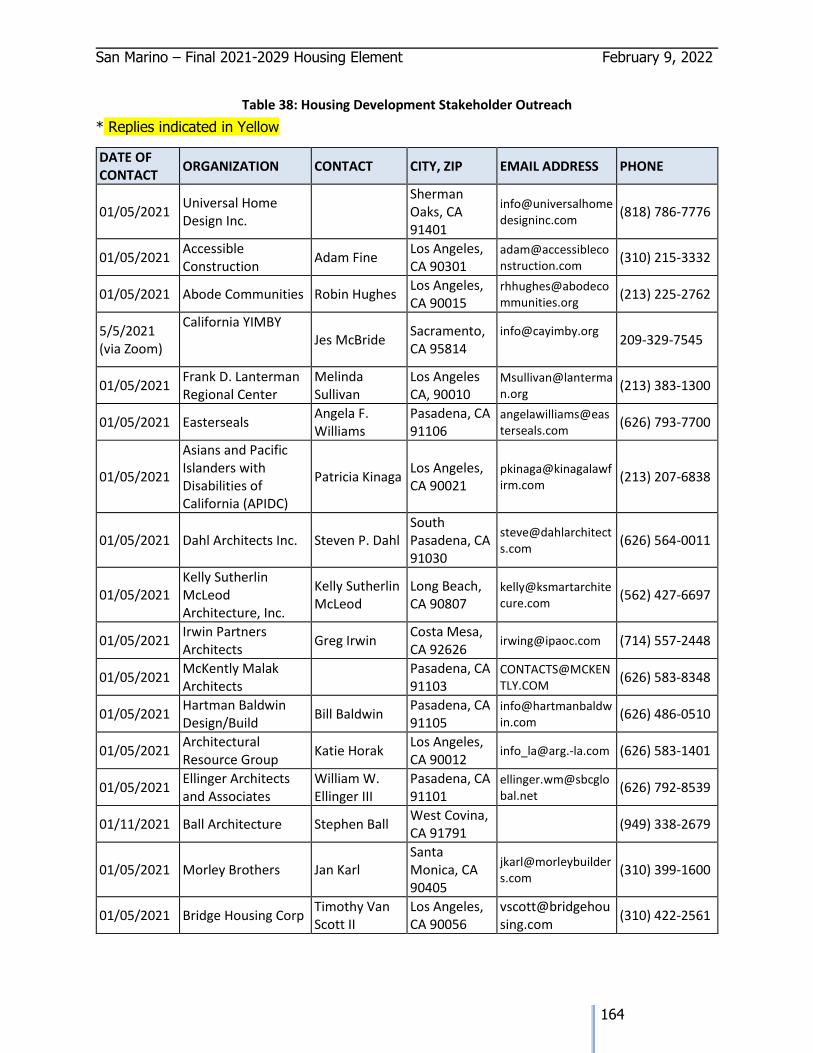
San Marino – Final 2021-2029 Housing Element February 9, 2022
164
Table 38: Housing Development Stakeholder Outreach
* Replies indicated in Yellow
DATE OF CONTACT
ORGANIZATION CONTACT CITY, ZIP EMAIL ADDRESS PHONE
01/05/2021 Universal Home Design Inc.
Sherman Oaks, CA 91401
(818) 786-7776
01/05/2021 Accessible Construction
Adam Fine Los Angeles, CA 90301
(310) 215-3332
01/05/2021 Abode Communities Robin Hughes Los Angeles, CA 90015
(213) 225-2762
5/5/2021 (via Zoom)
California YIMBY
Jes McBride Sacramento, CA 95814
209-329-7545
01/05/2021 Frank D. Lanterman Regional Center
Melinda Sullivan
Los Angeles CA, 90010
(213) 383-1300
01/05/2021 Easterseals Angela F. Williams
Pasadena, CA 91106
(626) 793-7700
01/05/2021
Asians and Pacific Islanders with Disabilities of California (APIDC)
Patricia Kinaga Los Angeles, CA 90021
(213) 207-6838
01/05/2021 Dahl Architects Inc. Steven P. Dahl South Pasadena, CA 91030
(626) 564-0011
01/05/2021 Kelly Sutherlin McLeod Architecture, Inc.
Kelly Sutherlin McLeod
Long Beach, CA 90807
(562) 427-6697
01/05/2021 Irwin Partners Architects
Greg Irwin Costa Mesa, CA 92626
[email protected] (714) 557-2448
01/05/2021 McKently Malak Architects
Pasadena, CA 91103
(626) 583-8348
01/05/2021 Hartman Baldwin Design/Build
Bill Baldwin Pasadena, CA 91105
(626) 486-0510
01/05/2021 Architectural Resource Group
Katie Horak Los Angeles, CA 90012
[email protected] (626) 583-1401
01/05/2021 Ellinger Architects and Associates
William W. Ellinger III
Pasadena, CA 91101
(626) 792-8539
01/11/2021 Ball Architecture Stephen Ball West Covina, CA 91791
(949) 338-2679
01/05/2021 Morley Brothers Jan Karl Santa Monica, CA 90405
(310) 399-1600
01/05/2021 Bridge Housing Corp Timothy Van Scott II
Los Angeles, CA 90056
(310) 422-2561
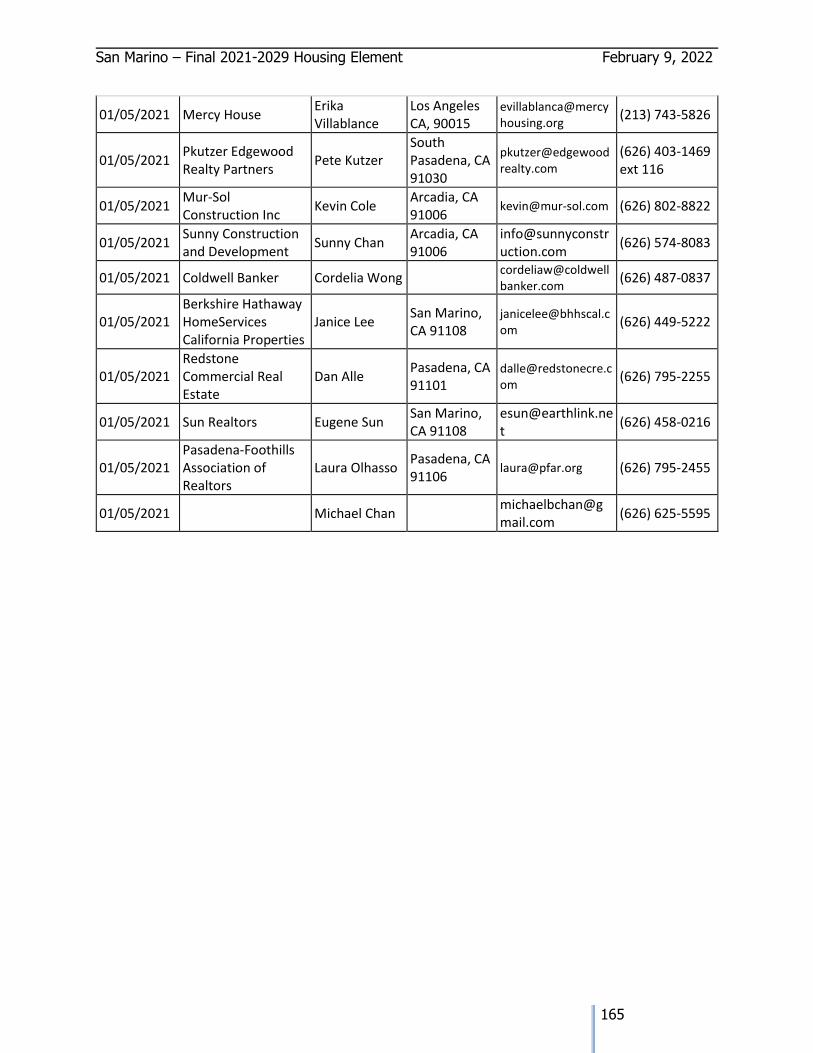
San Marino – Final 2021-2029 Housing Element February 9, 2022
165
01/05/2021 Mercy House Erika Villablance
Los Angeles CA, 90015
(213) 743-5826
01/05/2021 Pkutzer Edgewood Realty Partners
Pete Kutzer South Pasadena, CA 91030
(626) 403-1469 ext 116
01/05/2021 Mur-Sol Construction Inc
Kevin Cole Arcadia, CA 91006
[email protected] (626) 802-8822
01/05/2021 Sunny Construction and Development
Sunny Chan Arcadia, CA 91006
(626) 574-8083
01/05/2021 Coldwell Banker Cordelia Wong [email protected]
(626) 487-0837
01/05/2021 Berkshire Hathaway HomeServices California Properties
Janice Lee San Marino, CA 91108
(626) 449-5222
01/05/2021 Redstone Commercial Real Estate
Dan Alle Pasadena, CA 91101
(626) 795-2255
01/05/2021 Sun Realtors Eugene Sun San Marino, CA 91108
(626) 458-0216
01/05/2021 Pasadena-Foothills Association of Realtors
Laura Olhasso Pasadena, CA 91106
[email protected] (626) 795-2455
01/05/2021 Michael Chan [email protected]
(626) 625-5595
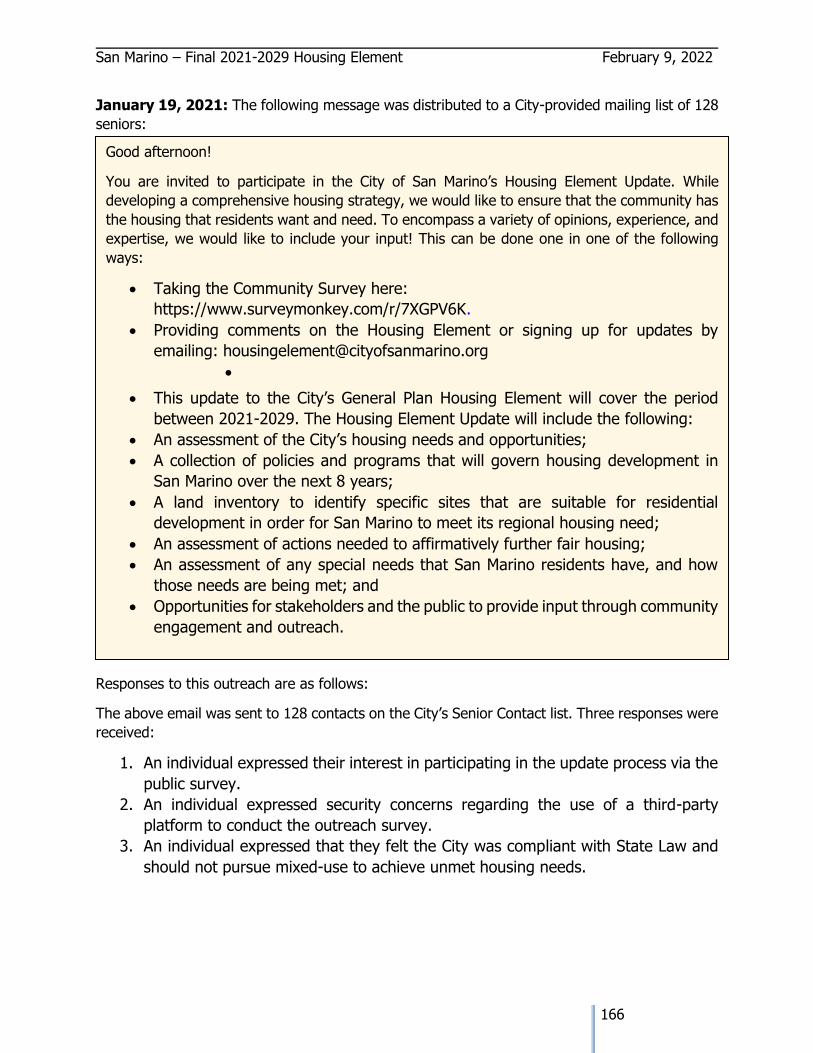
San Marino – Final 2021-2029 Housing Element February 9, 2022
166
January 19, 2021: The following message was distributed to a City-provided mailing list of 128
seniors:
Responses to this outreach are as follows:
The above email was sent to 128 contacts on the City’s Senior Contact list. Three responses were
received:
1. An individual expressed their interest in participating in the update process via the
public survey.
2. An individual expressed security concerns regarding the use of a third-party
platform to conduct the outreach survey.
3. An individual expressed that they felt the City was compliant with State Law and
should not pursue mixed-use to achieve unmet housing needs.
Good afternoon!
You are invited to participate in the City of San Marino’s Housing Element Update. While
developing a comprehensive housing strategy, we would like to ensure that the community has
the housing that residents want and need. To encompass a variety of opinions, experience, and
expertise, we would like to include your input! This can be done one in one of the following
ways:
• Taking the Community Survey here:
https://www.surveymonkey.com/r/7XGPV6K.
• Providing comments on the Housing Element or signing up for updates by
emailing: [email protected]
•
• This update to the City’s General Plan Housing Element will cover the period
between 2021-2029. The Housing Element Update will include the following:
• An assessment of the City’s housing needs and opportunities;
• A collection of policies and programs that will govern housing development in
San Marino over the next 8 years;
• A land inventory to identify specific sites that are suitable for residential
development in order for San Marino to meet its regional housing need;
• An assessment of actions needed to affirmatively further fair housing;
• An assessment of any special needs that San Marino residents have, and how
those needs are being met; and
• Opportunities for stakeholders and the public to provide input through community
engagement and outreach.
For more information, please visit the project website here: San Marino, CA
(cityofsanmarino.org).
This email is sent by 4LEAF staff. 4LEAF, Inc. is the consulting team that has been chosen to
assist the City in the update of its Housing Element, as well as the City’s Public Safety and Health
Element. 4LEAF is a full-service firm that has been providing services to numerous public
agencies across California for more than 20 years. You may find more information about 4LEAF
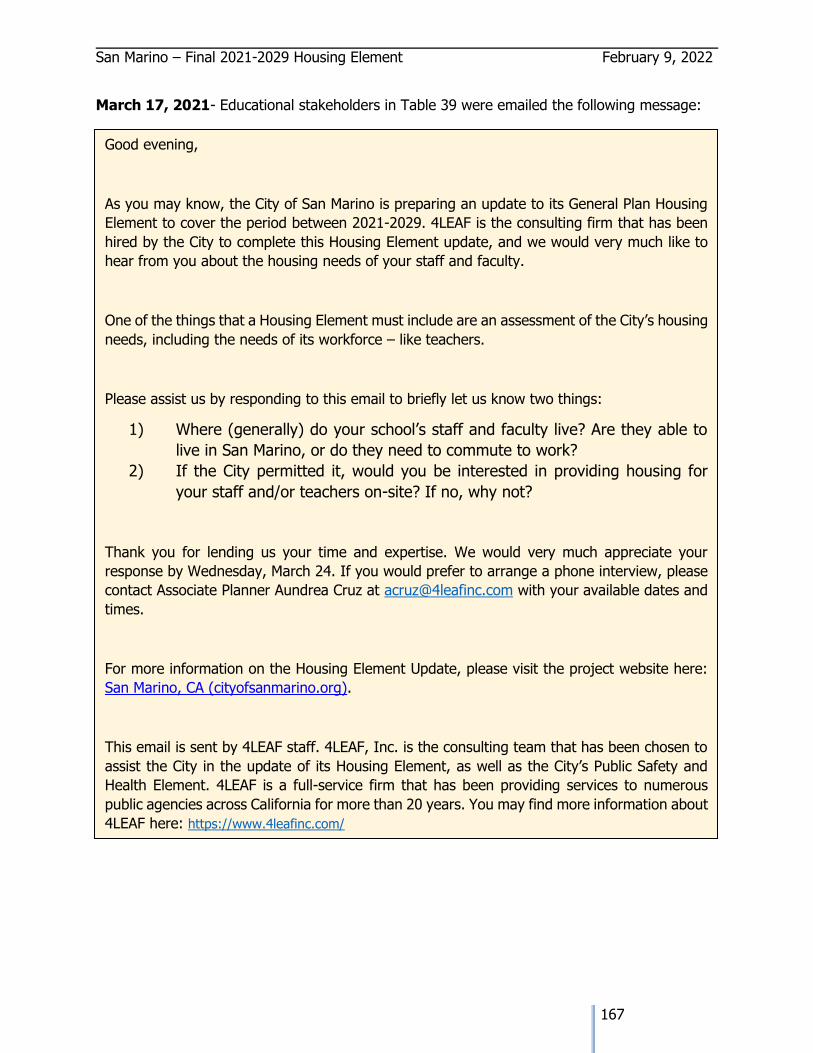
San Marino – Final 2021-2029 Housing Element February 9, 2022
167
March 17, 2021- Educational stakeholders in Table 39 were emailed the following message:
Good evening,
As you may know, the City of San Marino is preparing an update to its General Plan Housing
Element to cover the period between 2021-2029. 4LEAF is the consulting firm that has been
hired by the City to complete this Housing Element update, and we would very much like to
hear from you about the housing needs of your staff and faculty.
One of the things that a Housing Element must include are an assessment of the City’s housing
needs, including the needs of its workforce – like teachers.
Please assist us by responding to this email to briefly let us know two things:
1) Where (generally) do your school’s staff and faculty live? Are they able to
live in San Marino, or do they need to commute to work?
2) If the City permitted it, would you be interested in providing housing for
your staff and/or teachers on-site? If no, why not?
Thank you for lending us your time and expertise. We would very much appreciate your
response by Wednesday, March 24. If you would prefer to arrange a phone interview, please
contact Associate Planner Aundrea Cruz at [email protected] with your available dates and
times.
For more information on the Housing Element Update, please visit the project website here:
San Marino, CA (cityofsanmarino.org).
This email is sent by 4LEAF staff. 4LEAF, Inc. is the consulting team that has been chosen to
assist the City in the update of its Housing Element, as well as the City’s Public Safety and
Health Element. 4LEAF is a full-service firm that has been providing services to numerous
public agencies across California for more than 20 years. You may find more information about
4LEAF here: https://www.4leafinc.com/
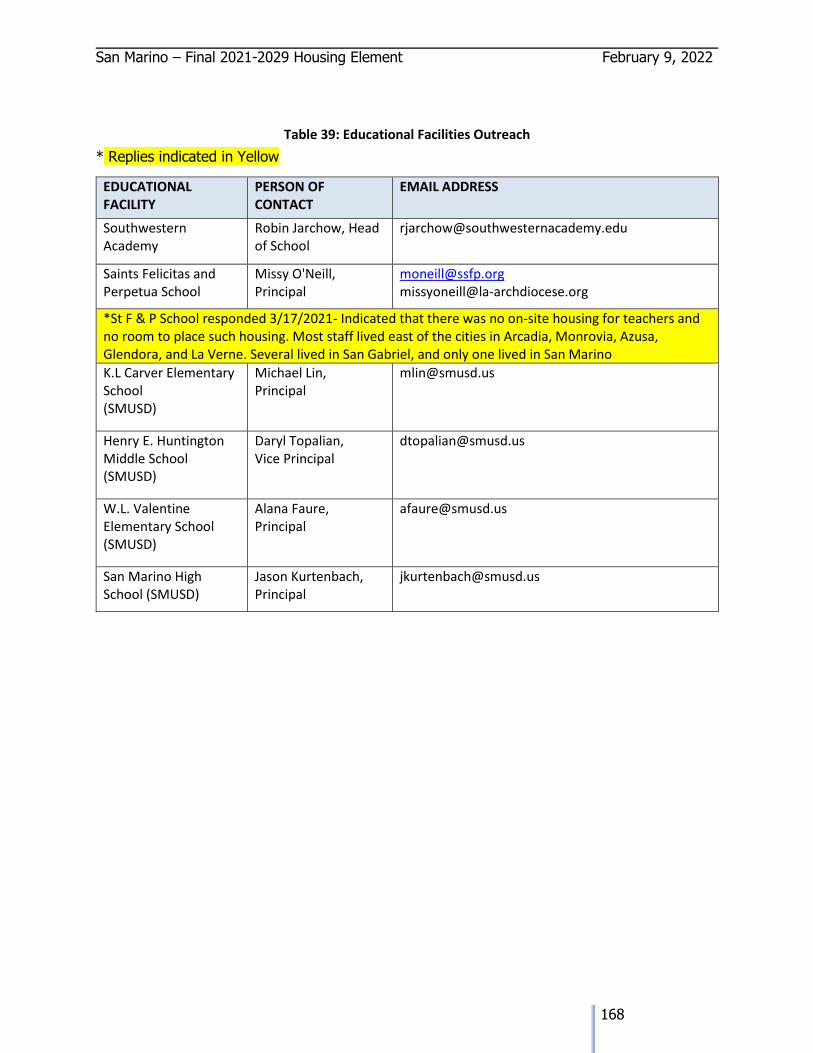
San Marino – Final 2021-2029 Housing Element February 9, 2022
168
Table 39: Educational Facilities Outreach
* Replies indicated in Yellow
EDUCATIONAL FACILITY
PERSON OF CONTACT
EMAIL ADDRESS
Southwestern Academy
Robin Jarchow, Head of School
Saints Felicitas and Perpetua School
Missy O'Neill, Principal
[email protected] [email protected]
*St F & P School responded 3/17/2021- Indicated that there was no on-site housing for teachers and no room to place such housing. Most staff lived east of the cities in Arcadia, Monrovia, Azusa, Glendora, and La Verne. Several lived in San Gabriel, and only one lived in San Marino
K.L Carver Elementary School (SMUSD)
Michael Lin, Principal
Henry E. Huntington Middle School (SMUSD)
Daryl Topalian, Vice Principal
W.L. Valentine Elementary School (SMUSD)
Alana Faure, Principal
San Marino High School (SMUSD)
Jason Kurtenbach, Principal
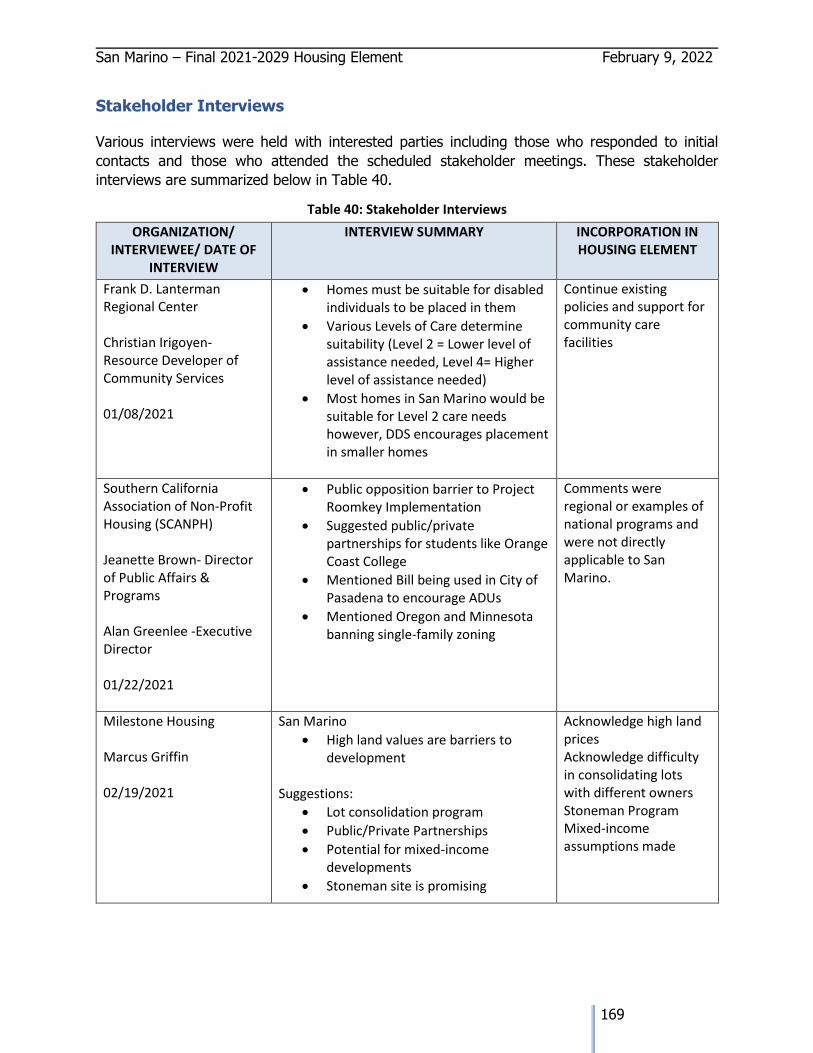
San Marino – Final 2021-2029 Housing Element February 9, 2022
169
Stakeholder Interviews
Various interviews were held with interested parties including those who responded to initial
contacts and those who attended the scheduled stakeholder meetings. These stakeholder
interviews are summarized below in Table 40.
Table 40: Stakeholder Interviews
ORGANIZATION/ INTERVIEWEE/ DATE OF
INTERVIEW
INTERVIEW SUMMARY INCORPORATION IN HOUSING ELEMENT
Frank D. Lanterman Regional Center Christian Irigoyen- Resource Developer of Community Services 01/08/2021
• Homes must be suitable for disabled individuals to be placed in them
• Various Levels of Care determine suitability (Level 2 = Lower level of assistance needed, Level 4= Higher level of assistance needed)
• Most homes in San Marino would be suitable for Level 2 care needs however, DDS encourages placement in smaller homes
Continue existing policies and support for community care facilities
Southern California Association of Non-Profit Housing (SCANPH) Jeanette Brown- Director of Public Affairs & Programs Alan Greenlee -Executive Director 01/22/2021
• Public opposition barrier to Project Roomkey Implementation
• Suggested public/private partnerships for students like Orange Coast College
• Mentioned Bill being used in City of Pasadena to encourage ADUs
• Mentioned Oregon and Minnesota banning single-family zoning
Comments were regional or examples of national programs and were not directly applicable to San Marino.
Milestone Housing Marcus Griffin 02/19/2021
San Marino
• High land values are barriers to development
Suggestions:
• Lot consolidation program
• Public/Private Partnerships
• Potential for mixed-income developments
• Stoneman site is promising
Acknowledge high land prices Acknowledge difficulty in consolidating lots with different owners Stoneman Program Mixed-income assumptions made
San Marino – Final 2021-2029 Housing Element February 9, 2022
184
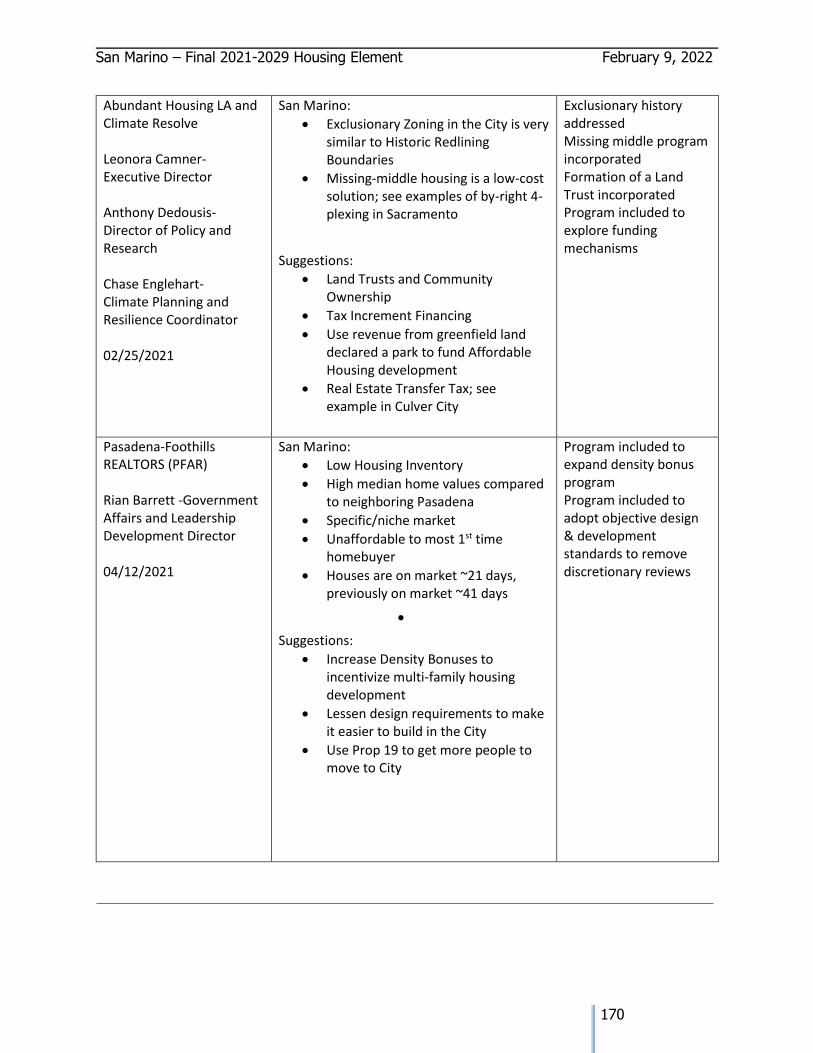
San Marino – Final 2021-2029 Housing Element February 9, 2022
170
Abundant Housing LA and Climate Resolve Leonora Camner- Executive Director Anthony Dedousis- Director of Policy and Research Chase Englehart- Climate Planning and Resilience Coordinator 02/25/2021
San Marino:
• Exclusionary Zoning in the City is very similar to Historic Redlining Boundaries
• Missing-middle housing is a low-cost solution; see examples of by-right 4-plexing in Sacramento
Suggestions:
• Land Trusts and Community Ownership
• Tax Increment Financing
• Use revenue from greenfield land declared a park to fund Affordable Housing development
• Real Estate Transfer Tax; see example in Culver City
Exclusionary history addressed Missing middle program incorporated Formation of a Land Trust incorporated Program included to explore funding mechanisms
Pasadena-Foothills REALTORS (PFAR) Rian Barrett -Government Affairs and Leadership Development Director 04/12/2021
San Marino:
• Low Housing Inventory
• High median home values compared to neighboring Pasadena
• Specific/niche market
• Unaffordable to most 1st time homebuyer
• Houses are on market ~21 days, previously on market ~41 days
•
Suggestions:
• Increase Density Bonuses to incentivize multi-family housing development
• Lessen design requirements to make it easier to build in the City
• Use Prop 19 to get more people to move to City
Program included to expand density bonus program Program included to adopt objective design & development standards to remove discretionary reviews
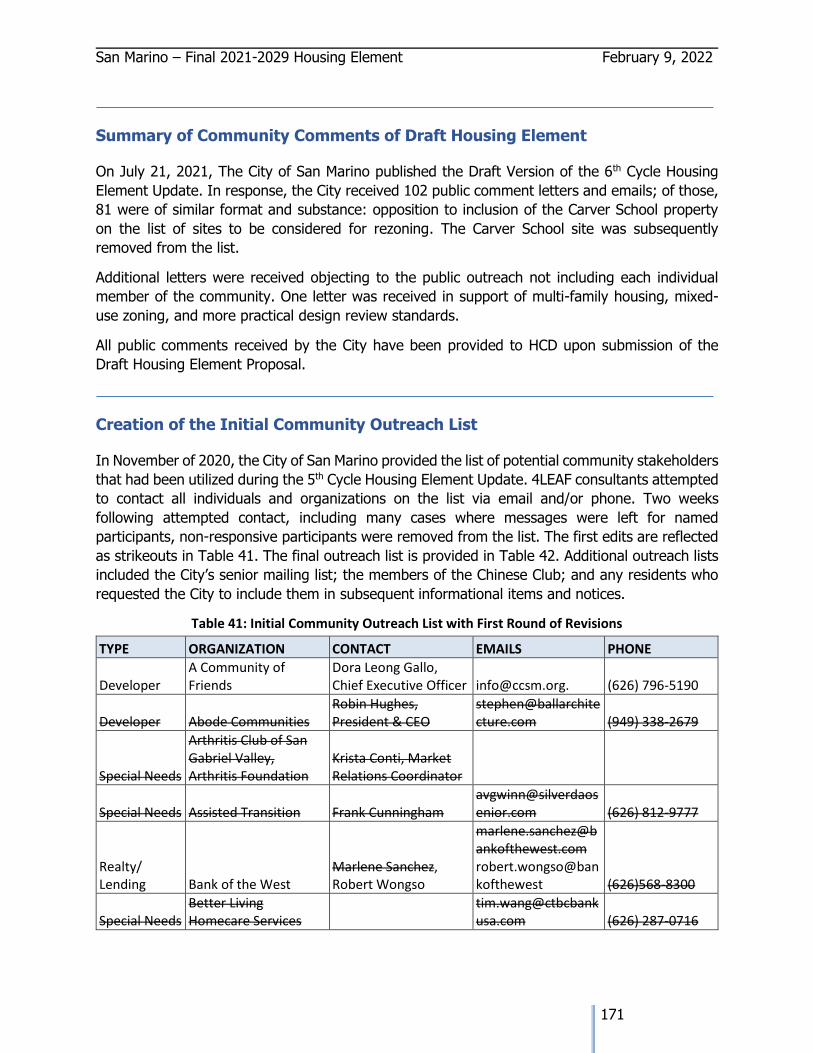
San Marino – Final 2021-2029 Housing Element February 9, 2022
171
Summary of Community Comments of Draft Housing Element
On July 21, 2021, The City of San Marino published the Draft Version of the 6th Cycle Housing
Element Update. In response, the City received 102 public comment letters and emails; of those,
81 were of similar format and substance: opposition to inclusion of the Carver School property
on the list of sites to be considered for rezoning. The Carver School site was subsequently
removed from the list.
Additional letters were received objecting to the public outreach not including each individual
member of the community. One letter was received in support of multi-family housing, mixed-
use zoning, and more practical design review standards.
All public comments received by the City have been provided to HCD upon submission of the
Draft Housing Element Proposal.
Creation of the Initial Community Outreach List
In November of 2020, the City of San Marino provided the list of potential community stakeholders
that had been utilized during the 5th Cycle Housing Element Update. 4LEAF consultants attempted
to contact all individuals and organizations on the list via email and/or phone. Two weeks
following attempted contact, including many cases where messages were left for named
participants, non-responsive participants were removed from the list. The first edits are reflected
as strikeouts in Table 41. The final outreach list is provided in Table 42. Additional outreach lists
included the City’s senior mailing list; the members of the Chinese Club; and any residents who
requested the City to include them in subsequent informational items and notices.
Table 41: Initial Community Outreach List with First Round of Revisions
TYPE ORGANIZATION CONTACT EMAILS PHONE
Developer A Community of Friends
Dora Leong Gallo, Chief Executive Officer [email protected]. (626) 796-5190
Developer Abode Communities Robin Hughes, President & CEO
[email protected] (949) 338-2679
Special Needs
Arthritis Club of San Gabriel Valley, Arthritis Foundation
Krista Conti, Market Relations Coordinator
Special Needs Assisted Transition Frank Cunningham [email protected] (626) 812-9777
Realty/ Lending Bank of the West
Marlene Sanchez, Robert Wongso
[email protected] robert.wongso@bankofthewest (626)568-8300
Special Needs Better Living Homecare Services
[email protected] (626) 287-0716
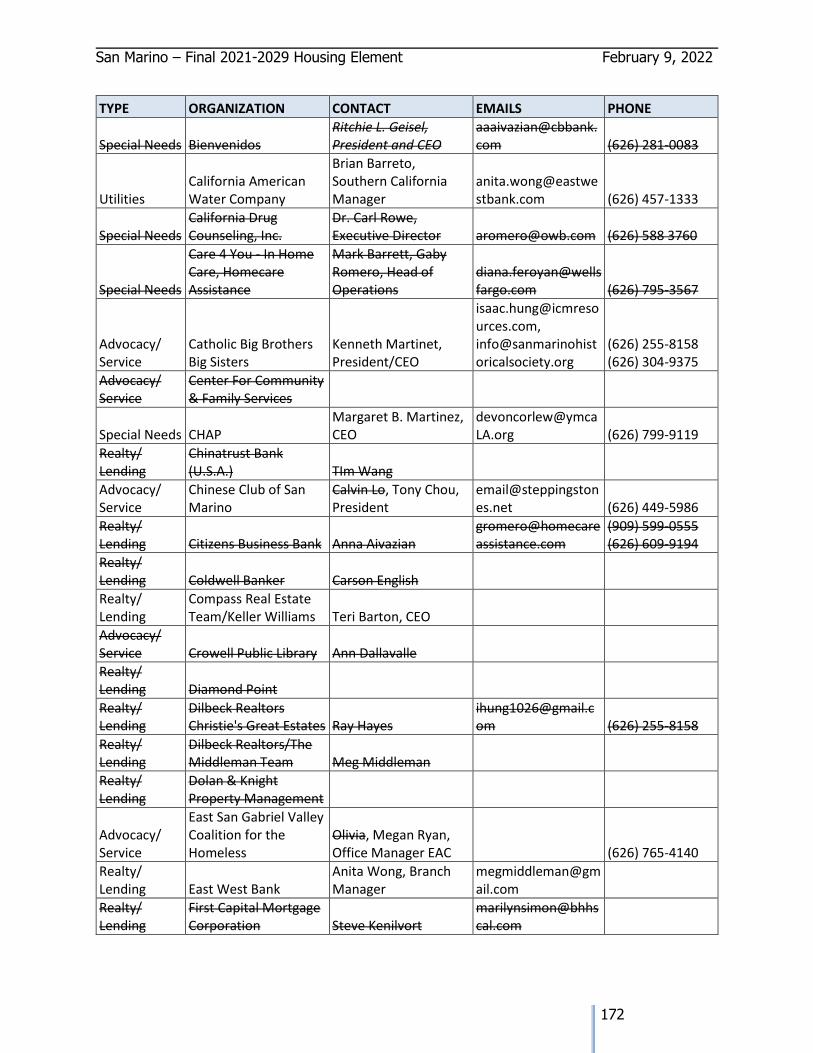
San Marino – Final 2021-2029 Housing Element February 9, 2022
172
TYPE ORGANIZATION CONTACT EMAILS PHONE
Special Needs Bienvenidos Ritchie L. Geisel, President and CEO
[email protected] (626) 281-0083
Utilities California American Water Company
Brian Barreto, Southern California Manager
[email protected] (626) 457-1333
Special Needs California Drug Counseling, Inc.
Dr. Carl Rowe, Executive Director [email protected] (626) 588 3760
Special Needs
Care 4 You - In Home Care, Homecare Assistance
Mark Barrett, Gaby Romero, Head of Operations
[email protected] (626) 795-3567
Advocacy/ Service
Catholic Big Brothers Big Sisters
Kenneth Martinet, President/CEO
[email protected], [email protected]
(626) 255-8158 (626) 304-9375
Advocacy/ Service
Center For Community & Family Services
Special Needs CHAP Margaret B. Martinez, CEO
[email protected] (626) 799-9119
Realty/ Lending
Chinatrust Bank (U.S.A.) TIm Wang
Advocacy/ Service
Chinese Club of San Marino
Calvin Lo, Tony Chou, President
[email protected] (626) 449-5986
Realty/ Lending Citizens Business Bank Anna Aivazian
(909) 599-0555 (626) 609-9194
Realty/ Lending Coldwell Banker Carson English Realty/ Lending
Compass Real Estate Team/Keller Williams Teri Barton, CEO
Advocacy/ Service Crowell Public Library Ann Dallavalle Realty/ Lending Diamond Point Realty/ Lending
Dilbeck Realtors Christie's Great Estates Ray Hayes
[email protected] (626) 255-8158
Realty/ Lending
Dilbeck Realtors/The Middleman Team Meg Middleman
Realty/ Lending
Dolan & Knight Property Management
Advocacy/ Service
East San Gabriel Valley Coalition for the Homeless
Olivia, Megan Ryan, Office Manager EAC (626) 765-4140
Realty/ Lending East West Bank
Anita Wong, Branch Manager
Realty/ Lending
First Capital Mortgage Corporation Steve Kenilvort
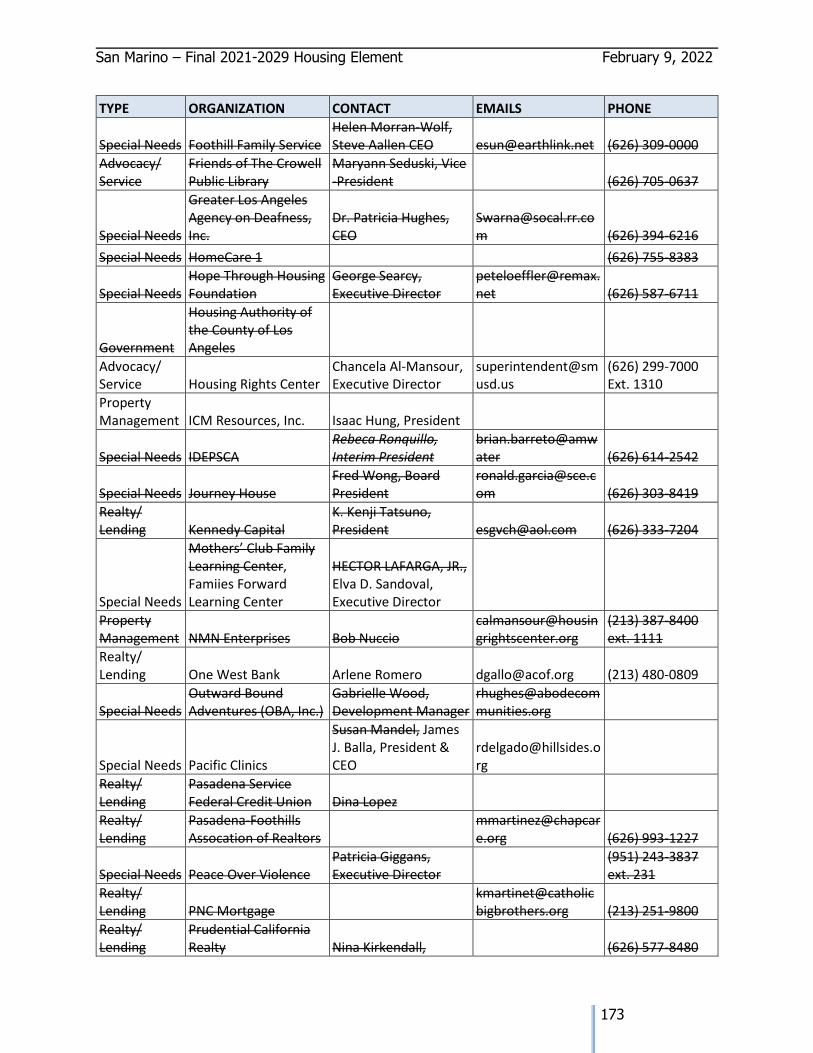
San Marino – Final 2021-2029 Housing Element February 9, 2022
173
TYPE ORGANIZATION CONTACT EMAILS PHONE
Special Needs Foothill Family Service Helen Morran-Wolf, Steve Aallen CEO [email protected] (626) 309-0000
Advocacy/ Service
Friends of The Crowell Public Library
Maryann Seduski, Vice -President (626) 705-0637
Special Needs
Greater Los Angeles Agency on Deafness, Inc.
Dr. Patricia Hughes, CEO
[email protected] (626) 394-6216
Special Needs HomeCare 1 (626) 755-8383
Special Needs Hope Through Housing Foundation
George Searcy, Executive Director
[email protected] (626) 587-6711
Government
Housing Authority of the County of Los Angeles
Advocacy/ Service Housing Rights Center
Chancela Al-Mansour, Executive Director
(626) 299-7000 Ext. 1310
Property Management ICM Resources, Inc. Isaac Hung, President
Special Needs IDEPSCA Rebeca Ronquillo, Interim President
brian.barreto@amwater (626) 614-2542
Special Needs Journey House Fred Wong, Board President
[email protected] (626) 303‐8419
Realty/ Lending Kennedy Capital
K. Kenji Tatsuno, President [email protected] (626) 333-7204
Special Needs
Mothers’ Club Family Learning Center, Famiies Forward Learning Center
HECTOR LAFARGA, JR., Elva D. Sandoval, Executive Director
Property Management NMN Enterprises Bob Nuccio
(213) 387-8400 ext. 1111
Realty/ Lending One West Bank Arlene Romero [email protected] (213) 480-0809
Special Needs Outward Bound Adventures (OBA, Inc.)
Gabrielle Wood, Development Manager
Special Needs Pacific Clinics
Susan Mandel, James J. Balla, President & CEO
Realty/ Lending
Pasadena Service Federal Credit Union Dina Lopez
Realty/ Lending
Pasadena-Foothills Assocation of Realtors
[email protected] (626) 993-1227
Special Needs Peace Over Violence Patricia Giggans, Executive Director
(951) 243-3837 ext. 231
Realty/ Lending PNC Mortgage
[email protected] (213) 251-9800
Realty/ Lending
Prudential California Realty Nina Kirkendall, (626) 577-8480
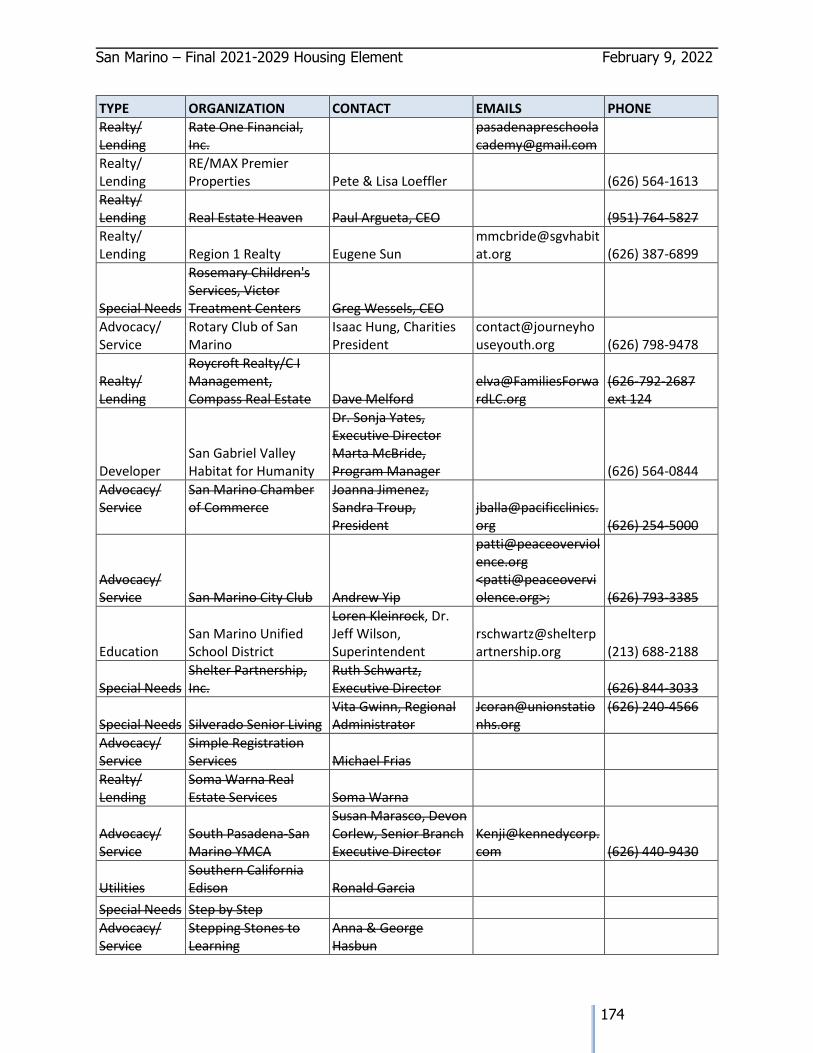
San Marino – Final 2021-2029 Housing Element February 9, 2022
174
TYPE ORGANIZATION CONTACT EMAILS PHONE
Realty/ Lending
Rate One Financial, Inc.
Realty/ Lending
RE/MAX Premier Properties Pete & Lisa Loeffler (626) 564-1613
Realty/ Lending Real Estate Heaven Paul Argueta, CEO (951) 764-5827
Realty/ Lending Region 1 Realty Eugene Sun
[email protected] (626) 387-6899
Special Needs
Rosemary Children's Services, Victor Treatment Centers Greg Wessels, CEO
Advocacy/ Service
Rotary Club of San Marino
Isaac Hung, Charities President
[email protected] (626) 798-9478
Realty/ Lending
Roycroft Realty/C I Management, Compass Real Estate Dave Melford
(626-792-2687 ext 124
Developer San Gabriel Valley Habitat for Humanity
Dr. Sonja Yates, Executive Director Marta McBride, Program Manager (626) 564-0844
Advocacy/ Service
San Marino Chamber of Commerce
Joanna Jimenez, Sandra Troup, President
[email protected] (626) 254-5000
Advocacy/ Service San Marino City Club Andrew Yip
[email protected] <[email protected]>; (626) 793-3385
Education San Marino Unified School District
Loren Kleinrock, Dr. Jeff Wilson, Superintendent
[email protected] (213) 688-2188
Special Needs Shelter Partnership, Inc.
Ruth Schwartz, Executive Director (626) 844-3033
Special Needs Silverado Senior Living Vita Gwinn, Regional Administrator
(626) 240-4566
Advocacy/ Service
Simple Registration Services Michael Frias
Realty/ Lending
Soma Warna Real Estate Services Soma Warna
Advocacy/ Service
South Pasadena-San Marino YMCA
Susan Marasco, Devon Corlew, Senior Branch Executive Director
[email protected] (626) 440-9430
Utilities Southern California Edison Ronald Garcia
Special Needs Step by Step Advocacy/ Service
Stepping Stones to Learning
Anna & George Hasbun
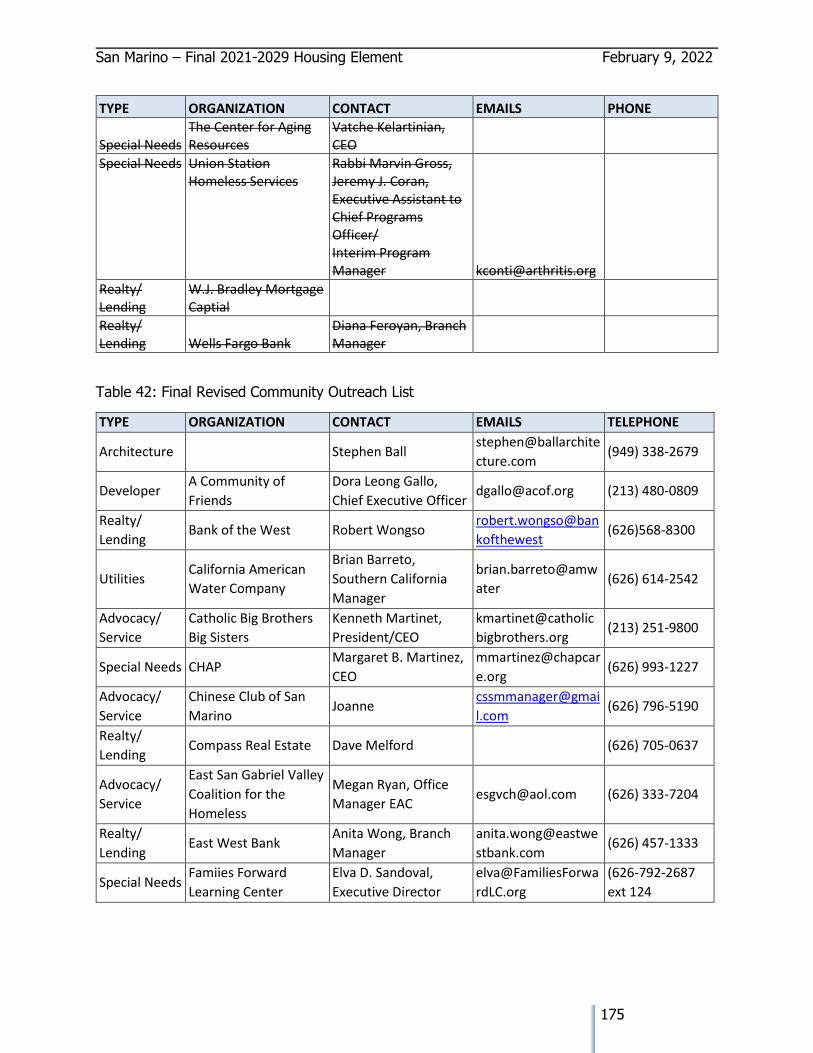
San Marino – Final 2021-2029 Housing Element February 9, 2022
175
TYPE ORGANIZATION CONTACT EMAILS PHONE
Special Needs The Center for Aging Resources
Vatche Kelartinian, CEO
Special Needs Union Station Homeless Services
Rabbi Marvin Gross, Jeremy J. Coran, Executive Assistant to Chief Programs Officer/ Interim Program Manager [email protected]
Realty/ Lending
W.J. Bradley Mortgage Captial
Realty/ Lending Wells Fargo Bank
Diana Feroyan, Branch Manager
Table 42: Final Revised Community Outreach List
TYPE ORGANIZATION CONTACT EMAILS TELEPHONE
Architecture Stephen Ball stephen@ballarchite
cture.com (949) 338-2679
Developer A Community of
Friends
Dora Leong Gallo,
Chief Executive Officer [email protected] (213) 480-0809
Realty/
Lending Bank of the West Robert Wongso
robert.wongso@ban
kofthewest
(626)568-8300
Utilities California American
Water Company
Brian Barreto,
Southern California
Manager
brian.barreto@amw
ater (626) 614-2542
Advocacy/
Service
Catholic Big Brothers
Big Sisters
Kenneth Martinet,
President/CEO
kmartinet@catholic
bigbrothers.org (213) 251-9800
Special Needs CHAP Margaret B. Martinez,
CEO
mmartinez@chapcar
e.org (626) 993-1227
Advocacy/
Service
Chinese Club of San
Marino Joanne
cssmmanager@gmai
l.com
(626) 796-5190
Realty/
Lending Compass Real Estate Dave Melford (626) 705-0637
Advocacy/
Service
East San Gabriel Valley
Coalition for the
Homeless
Megan Ryan, Office
Manager EAC [email protected] (626) 333-7204
Realty/
Lending East West Bank
Anita Wong, Branch
Manager
anita.wong@eastwe
stbank.com (626) 457-1333
Special Needs Famiies Forward
Learning Center
Elva D. Sandoval,
Executive Director
elva@FamiliesForwa
rdLC.org
(626-792-2687
ext 124
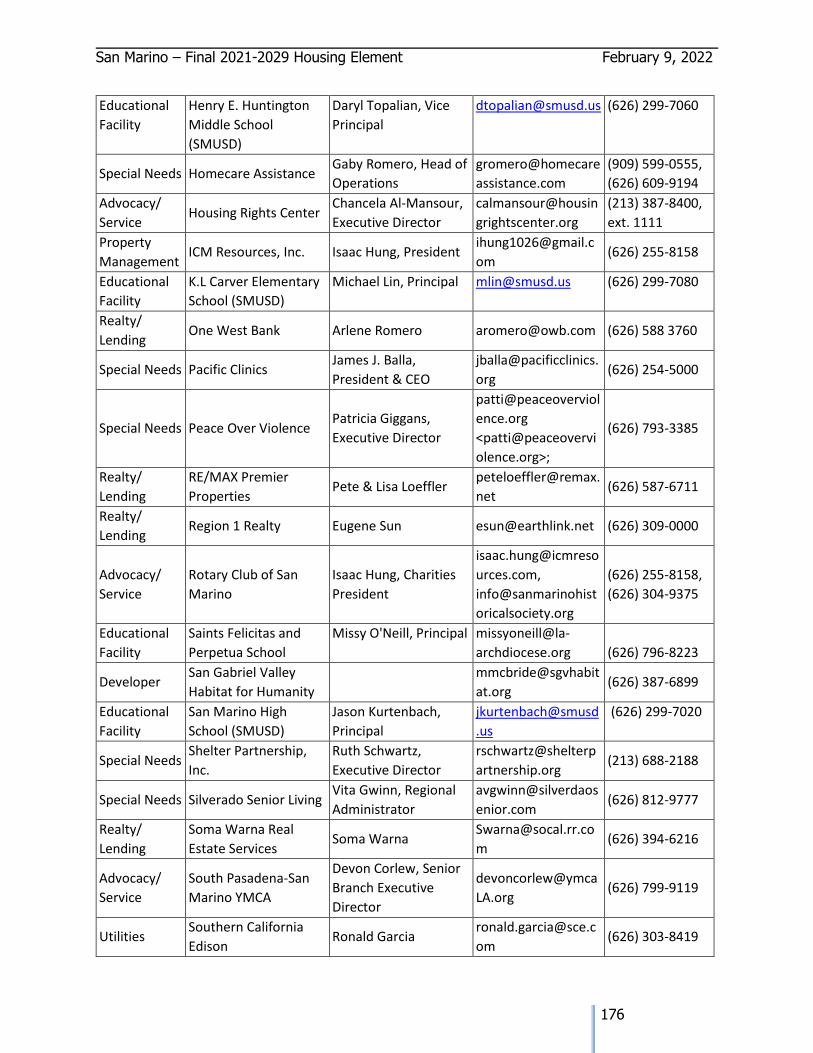
San Marino – Final 2021-2029 Housing Element February 9, 2022
176
Educational
Facility
Henry E. Huntington
Middle School
(SMUSD)
Daryl Topalian, Vice
Principal
[email protected] (626) 299-7060
Special Needs Homecare Assistance Gaby Romero, Head of
Operations
gromero@homecare
assistance.com
(909) 599-0555,
(626) 609-9194
Advocacy/
Service Housing Rights Center
Chancela Al-Mansour,
Executive Director
calmansour@housin
grightscenter.org
(213) 387-8400,
ext. 1111
Property
Management ICM Resources, Inc. Isaac Hung, President
om (626) 255-8158
Educational
Facility
K.L Carver Elementary
School (SMUSD)
Michael Lin, Principal [email protected] (626) 299-7080
Realty/
Lending One West Bank Arlene Romero [email protected] (626) 588 3760
Special Needs Pacific Clinics James J. Balla,
President & CEO
jballa@pacificclinics.
org (626) 254-5000
Special Needs Peace Over Violence Patricia Giggans,
Executive Director
patti@peaceoverviol
ence.org
<patti@peaceovervi
olence.org>;
(626) 793-3385
Realty/
Lending
RE/MAX Premier
Properties Pete & Lisa Loeffler
peteloeffler@remax.
net (626) 587-6711
Realty/
Lending Region 1 Realty Eugene Sun [email protected] (626) 309-0000
Advocacy/
Service
Rotary Club of San
Marino
Isaac Hung, Charities
President
isaac.hung@icmreso
urces.com,
info@sanmarinohist
oricalsociety.org
(626) 255-8158,
(626) 304-9375
Educational
Facility
Saints Felicitas and
Perpetua School
Missy O'Neill, Principal missyoneill@la-
archdiocese.org (626) 796-8223
Developer San Gabriel Valley
Habitat for Humanity mmcbride@sgvhabit
at.org (626) 387-6899
Educational
Facility
San Marino High
School (SMUSD)
Jason Kurtenbach,
Principal
jkurtenbach@smusd
.us
(626) 299-7020
Special Needs Shelter Partnership,
Inc.
Ruth Schwartz,
Executive Director
rschwartz@shelterp
artnership.org (213) 688-2188
Special Needs Silverado Senior Living Vita Gwinn, Regional
Administrator
avgwinn@silverdaos
enior.com (626) 812-9777
Realty/
Lending
Soma Warna Real
Estate Services Soma Warna
m (626) 394-6216
Advocacy/
Service
South Pasadena-San
Marino YMCA
Devon Corlew, Senior
Branch Executive
Director
devoncorlew@ymca
LA.org (626) 799-9119
Utilities Southern California
Edison Ronald Garcia
om (626) 303‐8419
San Marino – Final 2021-2029 Housing Element February 9, 2022
177
Educational
Facility
Southwestern
Academy
Robin Jarchow, Head
of School
rjarchow@southwes
ternacademy.edu
(626) 799-5010
Advocacy/
Service
Stepping Stones to
Learning
Anna & George
Hasbun
email@steppingston
es.net (626) 449-5986
Special Needs Union Station
Homeless Services
Jeremy J. Coran,
Executive Asst
Interim Program
Manager
Jcoran@unionstatio
nhs.org (626) 240-4566
Educational
Facility
W.L.Valentine
Elementary School
(SMUSD)
Alana Faure, Principal [email protected] (626) 299-7090
Realty/
Lending Wells Fargo Bank
Diana Feroyan, Branch
Manager
diana.feroyan@wells
fargo.com (626) 795-3567
ATTACHMENT A: COMMUNITY SURVEY RESULTS
One part of the community outreach and engagement plan included the distribution of community
opinion surveys about housing needs and opportunities in San Marino. These surveys were
designed to that they could be accessed and completed via cell phone in order to ensure equal
access to households without internet connections. The surveys were conducted in the City’s
three dominant languages (Chinese, English, and Spanish) to ensure that all residents had an
opportunity to participate in the language that they felt most comfortable with. Multiple digital
and social media platforms were used to facilitate the public input. Fill-in responses to questions
are listed above, in Table 34: Public Comments and Incorporation into Housing Element. The
remaining results of the community opinion surveys (all languages compiled) are presented here.
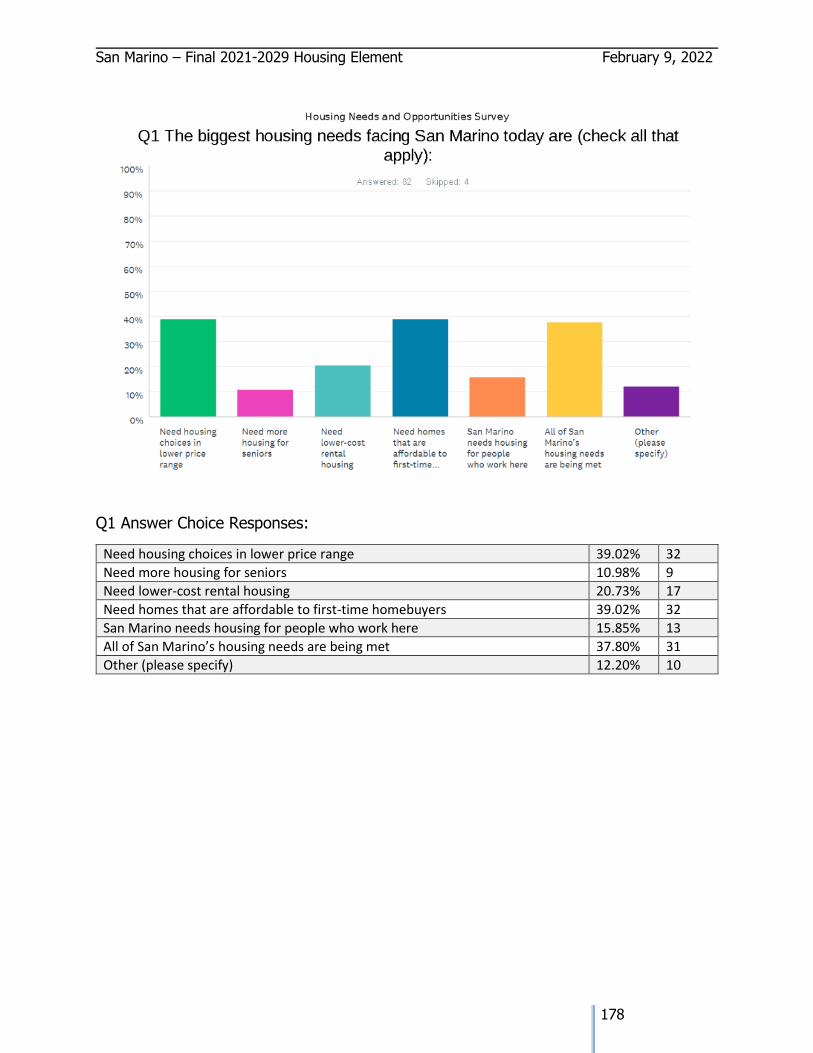
San Marino – Final 2021-2029 Housing Element February 9, 2022
178
Q1 Answer Choice Responses:
Need housing choices in lower price range 39.02% 32
Need more housing for seniors 10.98% 9
Need lower-cost rental housing 20.73% 17
Need homes that are affordable to first-time homebuyers 39.02% 32
San Marino needs housing for people who work here 15.85% 13
All of San Marino’s housing needs are being met 37.80% 31
Other (please specify) 12.20% 10
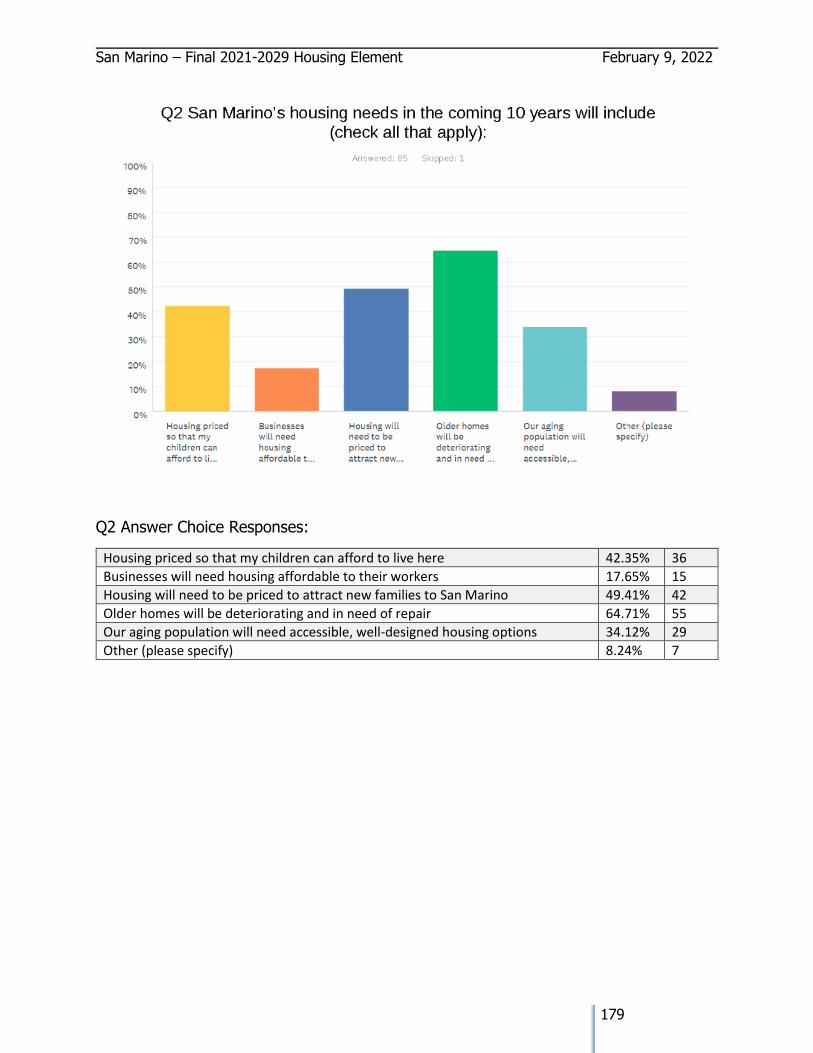
San Marino – Final 2021-2029 Housing Element February 9, 2022
179
Q2 Answer Choice Responses:
Housing priced so that my children can afford to live here 42.35% 36
Businesses will need housing affordable to their workers 17.65% 15
Housing will need to be priced to attract new families to San Marino 49.41% 42
Older homes will be deteriorating and in need of repair 64.71% 55
Our aging population will need accessible, well-designed housing options 34.12% 29
Other (please specify) 8.24% 7
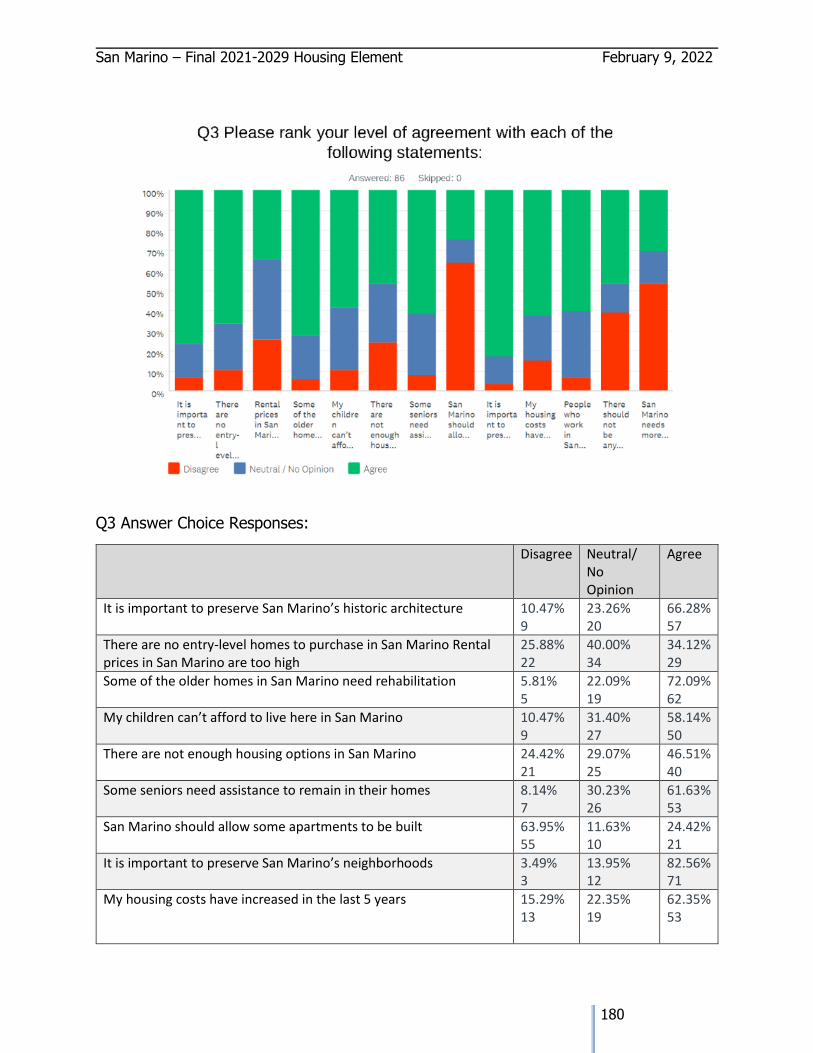
San Marino – Final 2021-2029 Housing Element February 9, 2022
180
Q3 Answer Choice Responses:
Disagree Neutral/ No Opinion
Agree
It is important to preserve San Marino’s historic architecture 10.47% 9
23.26% 20
66.28% 57
There are no entry-level homes to purchase in San Marino Rental prices in San Marino are too high
25.88% 22
40.00% 34
34.12% 29
Some of the older homes in San Marino need rehabilitation 5.81% 5
22.09% 19
72.09% 62
My children can’t afford to live here in San Marino 10.47% 9
31.40% 27
58.14% 50
There are not enough housing options in San Marino 24.42% 21
29.07% 25
46.51% 40
Some seniors need assistance to remain in their homes 8.14% 7
30.23% 26
61.63% 53
San Marino should allow some apartments to be built 63.95% 55
11.63% 10
24.42% 21
It is important to preserve San Marino’s neighborhoods 3.49% 3
13.95% 12
82.56% 71
My housing costs have increased in the last 5 years 15.29% 13
22.35% 19
62.35% 53
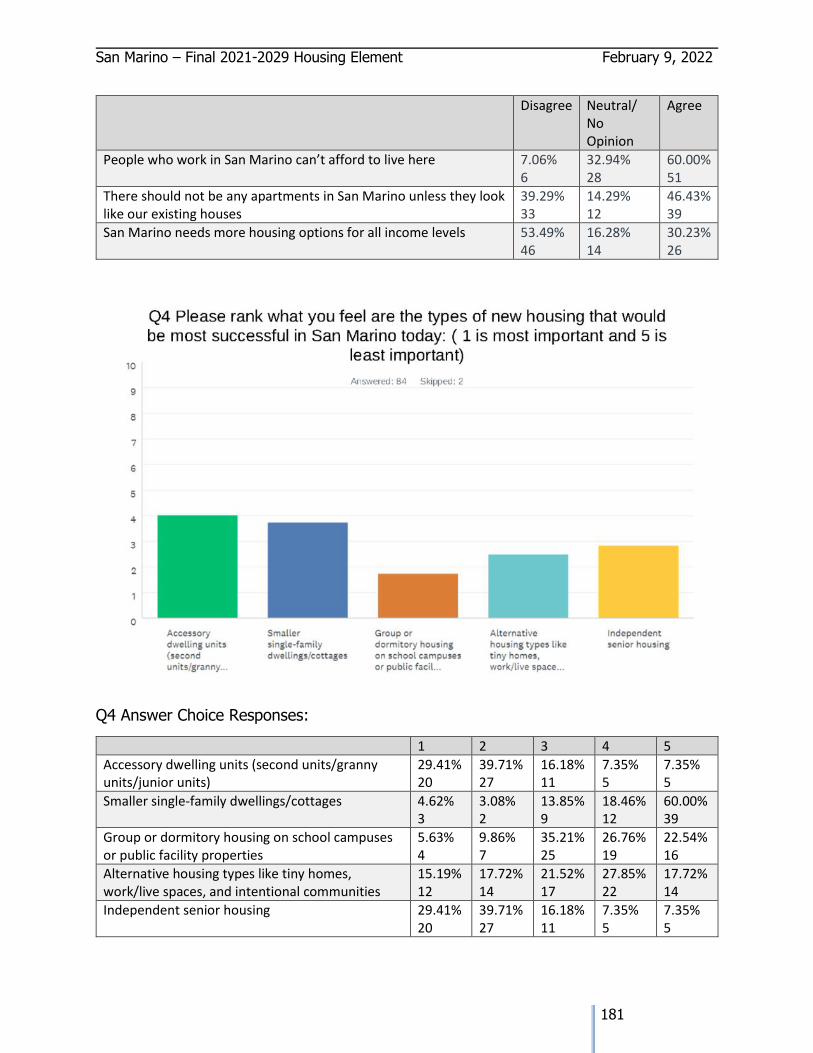
San Marino – Final 2021-2029 Housing Element February 9, 2022
181
Disagree Neutral/ No Opinion
Agree
People who work in San Marino can’t afford to live here 7.06% 6
32.94% 28
60.00% 51
There should not be any apartments in San Marino unless they look like our existing houses
39.29% 33
14.29% 12
46.43% 39
San Marino needs more housing options for all income levels 53.49% 46
16.28% 14
30.23% 26
Q4 Answer Choice Responses:
1 2 3 4 5
Accessory dwelling units (second units/granny units/junior units)
29.41% 20
39.71% 27
16.18% 11
7.35% 5
7.35% 5
Smaller single-family dwellings/cottages 4.62% 3
3.08% 2
13.85% 9
18.46% 12
60.00% 39
Group or dormitory housing on school campuses or public facility properties
5.63% 4
9.86% 7
35.21% 25
26.76% 19
22.54% 16
Alternative housing types like tiny homes, work/live spaces, and intentional communities
15.19% 12
17.72% 14
21.52% 17
27.85% 22
17.72% 14
Independent senior housing 29.41% 20
39.71% 27
16.18% 11
7.35% 5
7.35% 5
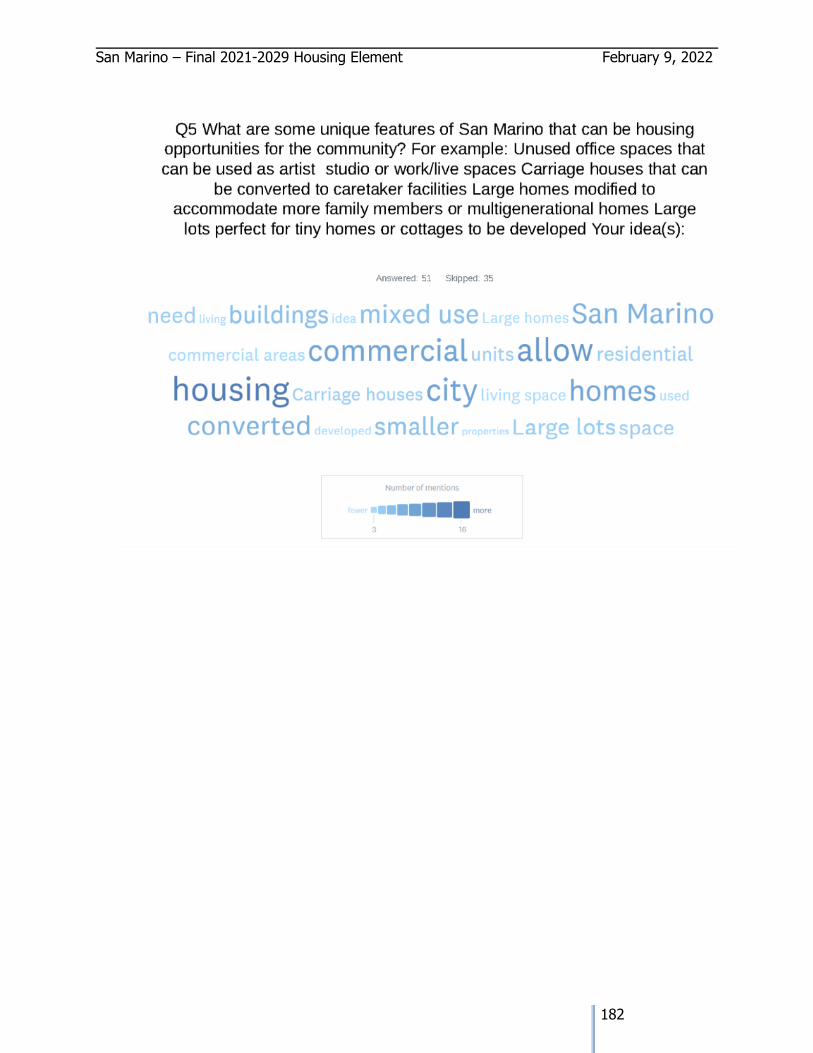
San Marino – Final 2021-2029 Housing Element February 9, 2022
182
San Marino – Final 2021-2029 Housing Element February 9, 2022
183
APPENDIX C: CITY OF SAN MARINO INSIGHT MARKET ANALYSIS, 2019.
CITY OF SAN MARINO, CA
Submitted by: ECONSolutions by HdL
120 S. State College Blvd., Suite 200 Brea, CA 92821
www.hdlcompanies.com
Contact: Barry Foster
714-879-5000 [email protected]
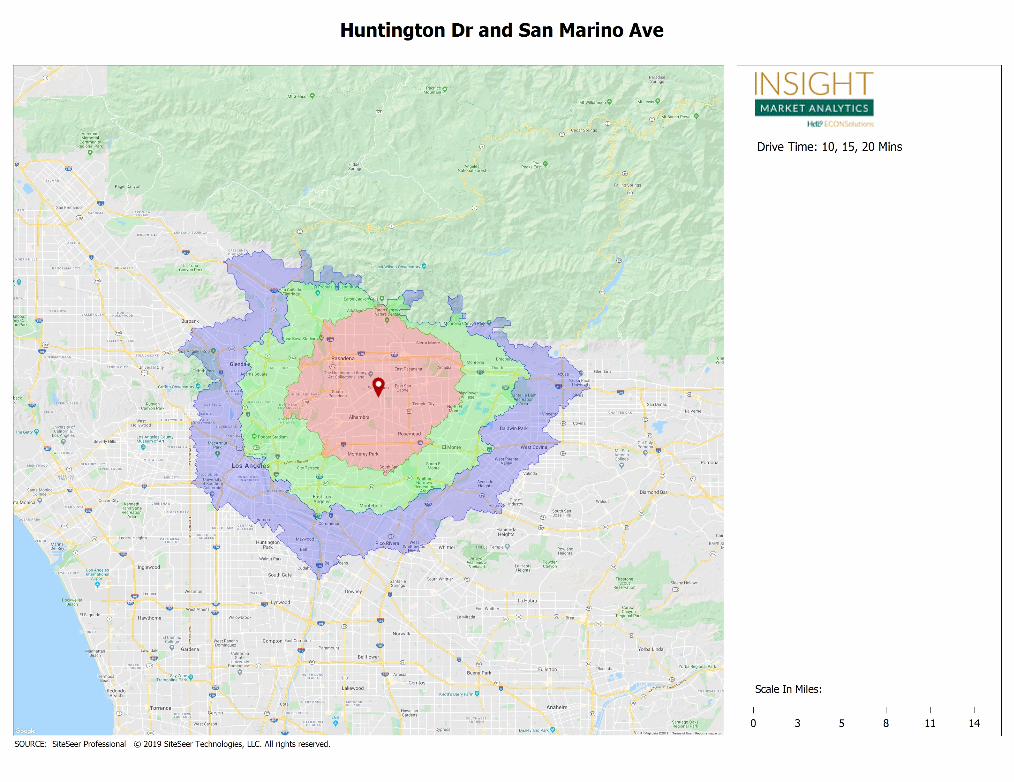
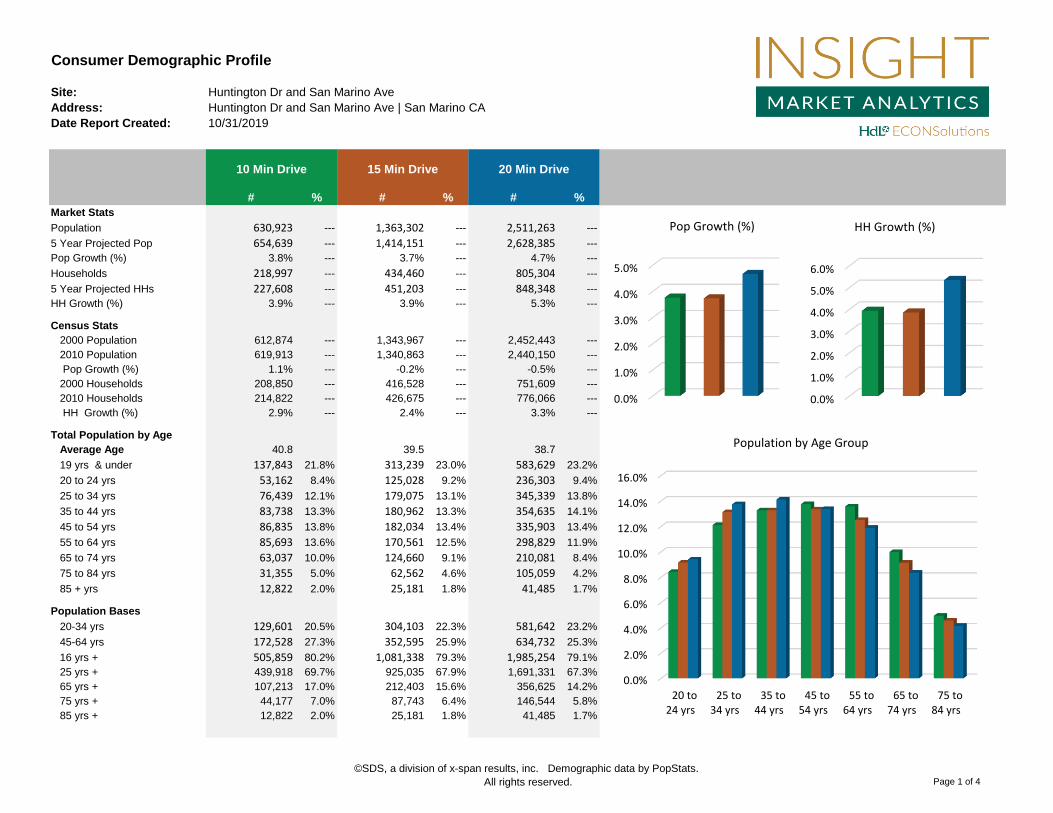
Consumer Demographic Profile
Site: Huntington Dr and San Marino Ave
Address: Huntington Dr and San Marino Ave | San Marino CA
Date Report Created: 10/31/2019
# % # % # %
Market Stats
Population 630,923 --- 1,363,302 --- 2,511,263 ---
5 Year Projected Pop 654,639 --- 1,414,151 --- 2,628,385 ---
Pop Growth (%) 3.8% --- 3.7% --- 4.7% ---
Households 218,997 --- 434,460 --- 805,304 ---
5 Year Projected HHs 227,608 --- 451,203 --- 848,348 ---
HH Growth (%) 3.9% --- 3.9% --- 5.3% ---
Census Stats
2000 Population 612,874 --- 1,343,967 --- 2,452,443 ---
2010 Population 619,913 --- 1,340,863 --- 2,440,150 ---
Pop Growth (%) 1.1% --- -0.2% --- -0.5% ---
2000 Households 208,850 --- 416,528 --- 751,609 ---
2010 Households 214,822 --- 426,675 --- 776,066 ---
HH Growth (%) 2.9% --- 2.4% --- 3.3% ---
Total Population by Age
Average Age 40.8 39.5 38.7
19 yrs & under 137,843 21.8% 313,239 23.0% 583,629 23.2%
20 to 24 yrs 53,162 8.4% 125,028 9.2% 236,303 9.4%
25 to 34 yrs 76,439 12.1% 179,075 13.1% 345,339 13.8%
35 to 44 yrs 83,738 13.3% 180,962 13.3% 354,635 14.1%
45 to 54 yrs 86,835 13.8% 182,034 13.4% 335,903 13.4%
55 to 64 yrs 85,693 13.6% 170,561 12.5% 298,829 11.9%
65 to 74 yrs 63,037 10.0% 124,660 9.1% 210,081 8.4%
75 to 84 yrs 31,355 5.0% 62,562 4.6% 105,059 4.2%
85 + yrs 12,822 2.0% 25,181 1.8% 41,485 1.7%
Population Bases
20-34 yrs 129,601 20.5% 304,103 22.3% 581,642 23.2%
45-64 yrs 172,528 27.3% 352,595 25.9% 634,732 25.3%
16 yrs + 505,859 80.2% 1,081,338 79.3% 1,985,254 79.1%
25 yrs + 439,918 69.7% 925,035 67.9% 1,691,331 67.3%
65 yrs + 107,213 17.0% 212,403 15.6% 356,625 14.2%
75 yrs + 44,177 7.0% 87,743 6.4% 146,544 5.8%
85 yrs + 12,822 2.0% 25,181 1.8% 41,485 1.7%
10 Min Drive 15 Min Drive 20 Min Drive
0.0%
1.0%
2.0%
3.0%
4.0%
5.0%
Pop Growth (%)
0.0%
1.0%
2.0%
3.0%
4.0%
5.0%
6.0%
HH Growth (%)
0.0%
2.0%
4.0%
6.0%
8.0%
10.0%
12.0%
14.0%
16.0%
20 to24 yrs
25 to34 yrs
35 to44 yrs
45 to54 yrs
55 to64 yrs
65 to74 yrs
75 to84 yrs
Population by Age Group
©SDS, a division of x-span results, inc. Demographic data by PopStats.
All rights reserved. Page 1 of 4
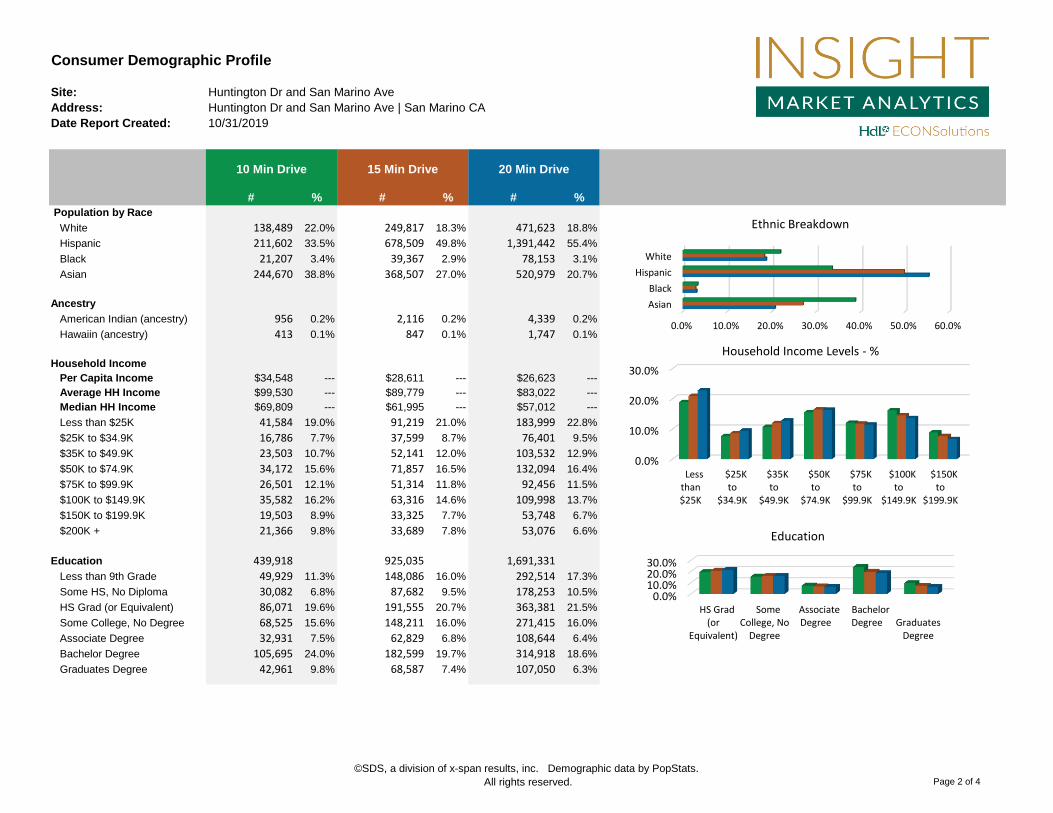
Consumer Demographic Profile
Site: Huntington Dr and San Marino Ave
Address: Huntington Dr and San Marino Ave | San Marino CA
Date Report Created: 10/31/2019
# % # % # %
10 Min Drive 15 Min Drive 20 Min Drive
Population by Race
White 138,489 22.0% 249,817 18.3% 471,623 18.8%
Hispanic 211,602 33.5% 678,509 49.8% 1,391,442 55.4%
Black 21,207 3.4% 39,367 2.9% 78,153 3.1%
Asian 244,670 38.8% 368,507 27.0% 520,979 20.7%
Ancestry
American Indian (ancestry) 956 0.2% 2,116 0.2% 4,339 0.2%
Hawaiin (ancestry) 413 0.1% 847 0.1% 1,747 0.1%
Household Income
Per Capita Income $34,548 --- $28,611 --- $26,623 ---
Average HH Income $99,530 --- $89,779 --- $83,022 ---
Median HH Income $69,809 --- $61,995 --- $57,012 ---
Less than $25K 41,584 19.0% 91,219 21.0% 183,999 22.8%
$25K to $34.9K 16,786 7.7% 37,599 8.7% 76,401 9.5%
$35K to $49.9K 23,503 10.7% 52,141 12.0% 103,532 12.9%
$50K to $74.9K 34,172 15.6% 71,857 16.5% 132,094 16.4%
$75K to $99.9K 26,501 12.1% 51,314 11.8% 92,456 11.5%
$100K to $149.9K 35,582 16.2% 63,316 14.6% 109,998 13.7%
$150K to $199.9K 19,503 8.9% 33,325 7.7% 53,748 6.7%
$200K + 21,366 9.8% 33,689 7.8% 53,076 6.6%
Education 439,918 925,035 1,691,331
Less than 9th Grade 49,929 11.3% 148,086 16.0% 292,514 17.3%
Some HS, No Diploma 30,082 6.8% 87,682 9.5% 178,253 10.5%
HS Grad (or Equivalent) 86,071 19.6% 191,555 20.7% 363,381 21.5%
Some College, No Degree 68,525 15.6% 148,211 16.0% 271,415 16.0%
Associate Degree 32,931 7.5% 62,829 6.8% 108,644 6.4%
Bachelor Degree 105,695 24.0% 182,599 19.7% 314,918 18.6%
Graduates Degree 42,961 9.8% 68,587 7.4% 107,050 6.3%
0.0%
10.0%
20.0%
30.0%
Lessthan$25K
$25Kto
$34.9K
$35Kto
$49.9K
$50Kto
$74.9K
$75Kto
$99.9K
$100Kto
$149.9K
$150Kto
$199.9K
Household Income Levels - %
0.0%10.0%20.0%30.0%
HS Grad(or
Equivalent)
SomeCollege, No
Degree
AssociateDegree
BachelorDegree Graduates
Degree
Education
0.0% 10.0% 20.0% 30.0% 40.0% 50.0% 60.0%
White
Hispanic
Black
Asian
Ethnic Breakdown
©SDS, a division of x-span results, inc. Demographic data by PopStats.
All rights reserved. Page 2 of 4
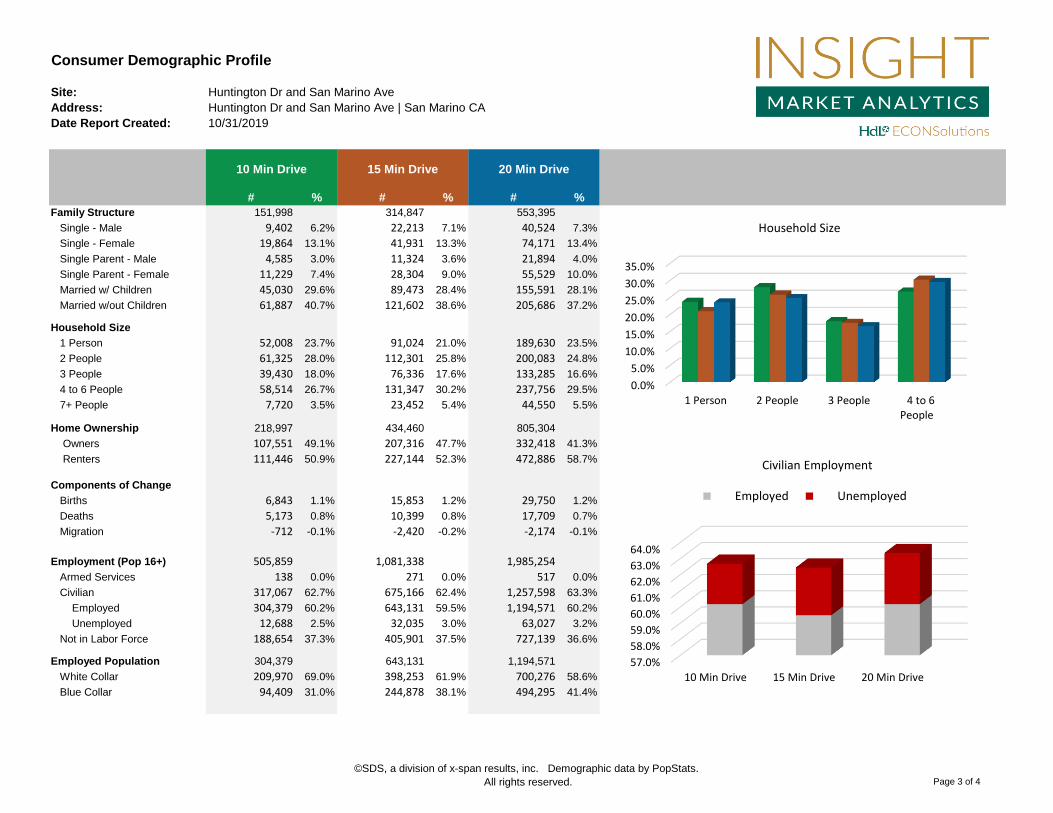
Consumer Demographic Profile
Site: Huntington Dr and San Marino Ave
Address: Huntington Dr and San Marino Ave | San Marino CA
Date Report Created: 10/31/2019
# % # % # %
10 Min Drive 15 Min Drive 20 Min Drive
Family Structure 151,998 314,847 553,395
Single - Male 9,402 6.2% 22,213 7.1% 40,524 7.3%
Single - Female 19,864 13.1% 41,931 13.3% 74,171 13.4%
Single Parent - Male 4,585 3.0% 11,324 3.6% 21,894 4.0%
Single Parent - Female 11,229 7.4% 28,304 9.0% 55,529 10.0%
Married w/ Children 45,030 29.6% 89,473 28.4% 155,591 28.1%
Married w/out Children 61,887 40.7% 121,602 38.6% 205,686 37.2%
Household Size
1 Person 52,008 23.7% 91,024 21.0% 189,630 23.5%
2 People 61,325 28.0% 112,301 25.8% 200,083 24.8%
3 People 39,430 18.0% 76,336 17.6% 133,285 16.6%
4 to 6 People 58,514 26.7% 131,347 30.2% 237,756 29.5%
7+ People 7,720 3.5% 23,452 5.4% 44,550 5.5%
Home Ownership 218,997 434,460 805,304
Owners 107,551 49.1% 207,316 47.7% 332,418 41.3%
Renters 111,446 50.9% 227,144 52.3% 472,886 58.7%
Components of Change
Births 6,843 1.1% 15,853 1.2% 29,750 1.2%
Deaths 5,173 0.8% 10,399 0.8% 17,709 0.7%
Migration -712 -0.1% -2,420 -0.2% -2,174 -0.1%
Employment (Pop 16+) 505,859 1,081,338 1,985,254
Armed Services 138 0.0% 271 0.0% 517 0.0%
Civilian 317,067 62.7% 675,166 62.4% 1,257,598 63.3%
Employed 304,379 60.2% 643,131 59.5% 1,194,571 60.2% 10 Min Drive 15 Min Drive 20 Min Drive
Unemployed 12,688 2.5% 32,035 3.0% 63,027 3.2%
Not in Labor Force 188,654 37.3% 405,901 37.5% 727,139 36.6%
Employed Population 304,379 643,131 1,194,571
White Collar 209,970 69.0% 398,253 61.9% 700,276 58.6%
Blue Collar 94,409 31.0% 244,878 38.1% 494,295 41.4%
0.0%
5.0%
10.0%
15.0%
20.0%
25.0%
30.0%
35.0%
1 Person 2 People 3 People 4 to 6People
Household Size
57.0%
58.0%
59.0%
60.0%
61.0%
62.0%
63.0%
64.0%
10 Min Drive 15 Min Drive 20 Min Drive
Civilian Employment
Employed Unemployed
©SDS, a division of x-span results, inc. Demographic data by PopStats.
All rights reserved. Page 3 of 4
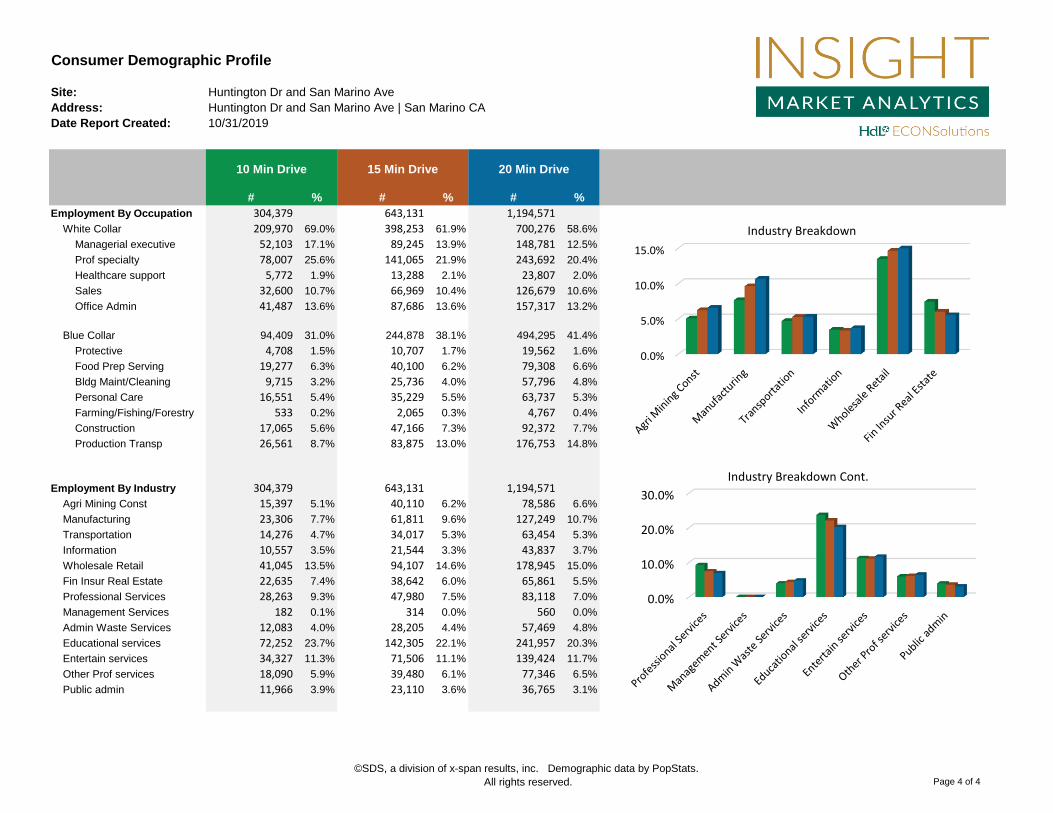
Consumer Demographic Profile
Site: Huntington Dr and San Marino Ave
Address: Huntington Dr and San Marino Ave | San Marino CA
Date Report Created: 10/31/2019
# % # % # %
10 Min Drive 15 Min Drive 20 Min Drive
Employment By Occupation 304,379 643,131 1,194,571
White Collar 209,970 69.0% 398,253 61.9% 700,276 58.6%
Managerial executive 52,103 17.1% 89,245 13.9% 148,781 12.5%
Prof specialty 78,007 25.6% 141,065 21.9% 243,692 20.4%
Healthcare support 5,772 1.9% 13,288 2.1% 23,807 2.0%
Sales 32,600 10.7% 66,969 10.4% 126,679 10.6%
Office Admin 41,487 13.6% 87,686 13.6% 157,317 13.2%
Blue Collar 94,409 31.0% 244,878 38.1% 494,295 41.4%
Protective 4,708 1.5% 10,707 1.7% 19,562 1.6%
Food Prep Serving 19,277 6.3% 40,100 6.2% 79,308 6.6%
Bldg Maint/Cleaning 9,715 3.2% 25,736 4.0% 57,796 4.8%
Personal Care 16,551 5.4% 35,229 5.5% 63,737 5.3%
Farming/Fishing/Forestry 533 0.2% 2,065 0.3% 4,767 0.4%
Construction 17,065 5.6% 47,166 7.3% 92,372 7.7%
Production Transp 26,561 8.7% 83,875 13.0% 176,753 14.8%
Employment By Industry 304,379 643,131 1,194,571
Agri Mining Const 15,397 5.1% 40,110 6.2% 78,586 6.6%
Manufacturing 23,306 7.7% 61,811 9.6% 127,249 10.7%
Transportation 14,276 4.7% 34,017 5.3% 63,454 5.3%
Information 10,557 3.5% 21,544 3.3% 43,837 3.7%
Wholesale Retail 41,045 13.5% 94,107 14.6% 178,945 15.0%
Fin Insur Real Estate 22,635 7.4% 38,642 6.0% 65,861 5.5%
Professional Services 28,263 9.3% 47,980 7.5% 83,118 7.0%
Management Services 182 0.1% 314 0.0% 560 0.0%
Admin Waste Services 12,083 4.0% 28,205 4.4% 57,469 4.8%
Educational services 72,252 23.7% 142,305 22.1% 241,957 20.3%
Entertain services 34,327 11.3% 71,506 11.1% 139,424 11.7%
Other Prof services 18,090 5.9% 39,480 6.1% 77,346 6.5%
Public admin 11,966 3.9% 23,110 3.6% 36,765 3.1%
0.0%
5.0%
10.0%
15.0%
Industry Breakdown
0.0%
10.0%
20.0%
30.0%
Industry Breakdown Cont.
©SDS, a division of x-span results, inc. Demographic data by PopStats.
All rights reserved. Page 4 of 4
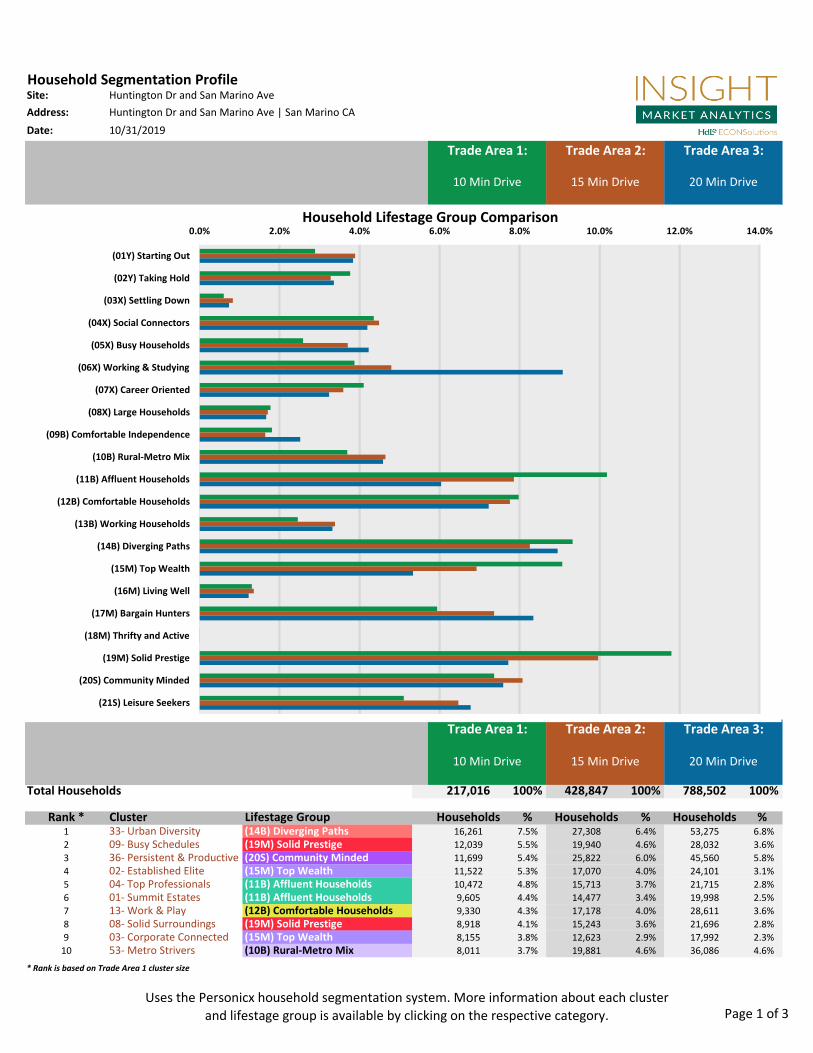
Site: Huntington Dr and San Marino Ave
Address: Huntington Dr and San Marino Ave | San Marino CA
Date: 10/31/2019
10 Min Drive 15 Min Drive 20 Min Drive
(01Y) Starting Out 2.9% 3.9% ##
(02Y) Taking Hold 3.8% 3.3% ##
(03X) Settling Down 0.6% 0.8% ##
(04X) Social Connectors 4.4% 4.5% ##
(05X) Busy Households 2.6% 3.7% ##
(06X) Working & Studying 3.9% 4.8% ##
(07X) Career Oriented 4.1% 3.6% ##
(08X) Large Households 1.8% 1.7% ##
(09B) Comfortable Independence 1.8% 1.6% ##
(10B) Rural-Metro Mix 3.7% 4.6% ##
(11B) Affluent Households 10.2% 7.9% ##
(12B) Comfortable Households 8.0% 7.8% ##
(13B) Working Households 2.5% 3.4% ##
(14B) Diverging Paths 9.3% 8.3% ##
(15M) Top Wealth 9.1% 6.9% ##
(16M) Living Well 1.3% 1.4% ##
(17M) Bargain Hunters 5.9% 7.4% ##
(18M) Thrifty and Active 0.0% 0.0% ##
(19M) Solid Prestige 11.8% 10.0% ##
(20S) Community Minded 7.4% 8.1% ##
(21S) Leisure Seekers 5.1% 6.5% ##
Total Households 217,016 100% 428,847 100% 788,502 100%
Rank * Cluster Lifestage Group Households % Households % Households % 1 33- Urban Diversity (14B) Diverging Paths 16,261 7.5% 27,308 6.4% 53,275 6.8%
2 09- Busy Schedules (19M) Solid Prestige 12,039 5.5% 19,940 4.6% 28,032 3.6%
3 36- Persistent & Productive (20S) Community Minded 11,699 5.4% 25,822 6.0% 45,560 5.8%
4 02- Established Elite (15M) Top Wealth 11,522 5.3% 17,070 4.0% 24,101 3.1%
5 04- Top Professionals (11B) Affluent Households 10,472 4.8% 15,713 3.7% 21,715 2.8%
6 01- Summit Estates (11B) Affluent Households 9,605 4.4% 14,477 3.4% 19,998 2.5%
7 13- Work & Play (12B) Comfortable Households 9,330 4.3% 17,178 4.0% 28,611 3.6%
8 08- Solid Surroundings (19M) Solid Prestige 8,918 4.1% 15,243 3.6% 21,696 2.8%
9 03- Corporate Connected (15M) Top Wealth 8,155 3.8% 12,623 2.9% 17,992 2.3%
10 53- Metro Strivers (10B) Rural-Metro Mix 8,011 3.7% 19,881 4.6% 36,086 4.6%
* Rank is based on Trade Area 1 cluster size
Household Segmentation Profile
Trade Area 1: Trade Area 2: Trade Area 3:
10 Min Drive 15 Min Drive 20 Min Drive
10 Min Drive 15 Min Drive 20 Min Drive
Trade Area 1: Trade Area 2: Trade Area 3:
0.0% 2.0% 4.0% 6.0% 8.0% 10.0% 12.0% 14.0%
(01Y) Starting Out
(02Y) Taking Hold
(03X) Settling Down
(04X) Social Connectors
(05X) Busy Households
(06X) Working & Studying
(07X) Career Oriented
(08X) Large Households
(09B) Comfortable Independence
(10B) Rural-Metro Mix
(11B) Affluent Households
(12B) Comfortable Households
(13B) Working Households
(14B) Diverging Paths
(15M) Top Wealth
(16M) Living Well
(17M) Bargain Hunters
(18M) Thrifty and Active
(19M) Solid Prestige
(20S) Community Minded
(21S) Leisure Seekers
Household Lifestage Group Comparison
Uses the Personicx household segmentation system. More information about each cluster
and lifestage group is available by clicking on the respective category. Page 1 of 3
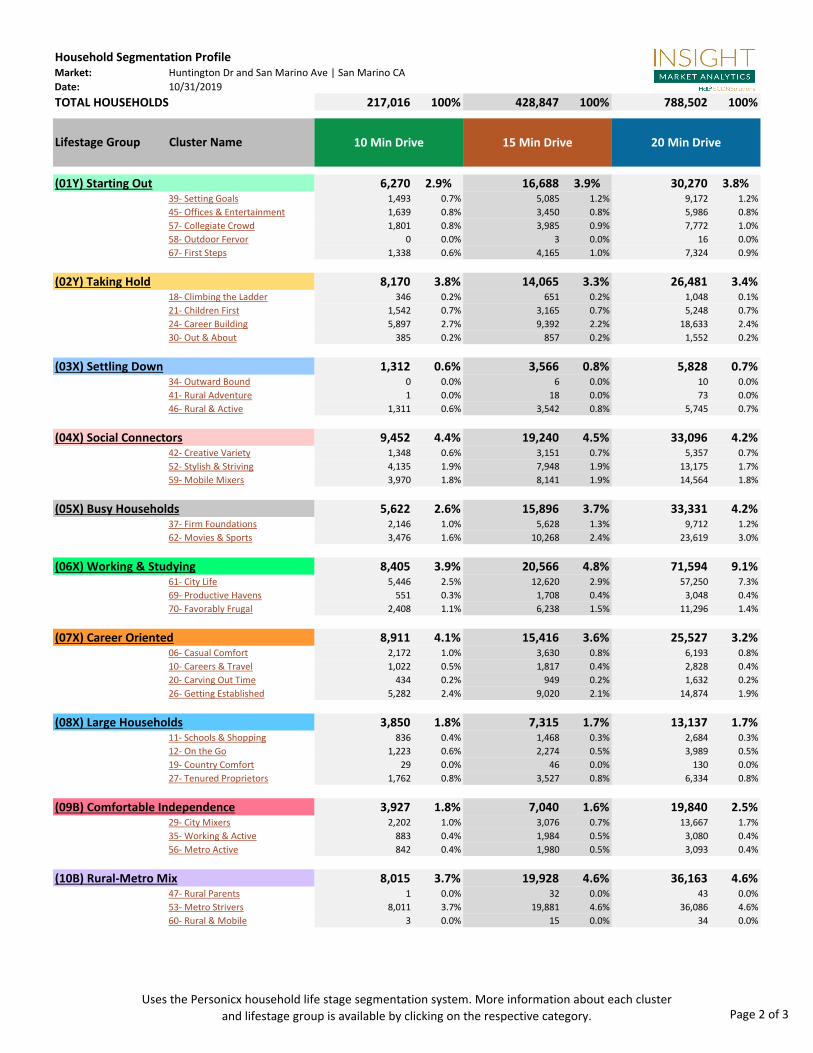
Household Segmentation ProfileMarket: Huntington Dr and San Marino Ave | San Marino CA
Date: 10/31/2019
TOTAL HOUSEHOLDS 217,016 100% 428,847 100% 788,502 100%
Lifestage Group Cluster Name
6,270 2.9% 16,688 3.9% 30,270 3.8%39- Setting Goals 1,493 0.7% 5,085 1.2% 9,172 1.2%
45- Offices & Entertainment 1,639 0.8% 3,450 0.8% 5,986 0.8%
57- Collegiate Crowd 1,801 0.8% 3,985 0.9% 7,772 1.0%
58- Outdoor Fervor 0 0.0% 3 0.0% 16 0.0%
67- First Steps 1,338 0.6% 4,165 1.0% 7,324 0.9%
8,170 3.8% 14,065 3.3% 26,481 3.4%18- Climbing the Ladder 346 0.2% 651 0.2% 1,048 0.1%
21- Children First 1,542 0.7% 3,165 0.7% 5,248 0.7%
24- Career Building 5,897 2.7% 9,392 2.2% 18,633 2.4%
30- Out & About 385 0.2% 857 0.2% 1,552 0.2%
1,312 0.6% 3,566 0.8% 5,828 0.7%34- Outward Bound 0 0.0% 6 0.0% 10 0.0%
41- Rural Adventure 1 0.0% 18 0.0% 73 0.0%
46- Rural & Active 1,311 0.6% 3,542 0.8% 5,745 0.7%
9,452 4.4% 19,240 4.5% 33,096 4.2%42- Creative Variety 1,348 0.6% 3,151 0.7% 5,357 0.7%
52- Stylish & Striving 4,135 1.9% 7,948 1.9% 13,175 1.7%
59- Mobile Mixers 3,970 1.8% 8,141 1.9% 14,564 1.8%
5,622 2.6% 15,896 3.7% 33,331 4.2%37- Firm Foundations 2,146 1.0% 5,628 1.3% 9,712 1.2%
62- Movies & Sports 3,476 1.6% 10,268 2.4% 23,619 3.0%
8,405 3.9% 20,566 4.8% 71,594 9.1%61- City Life 5,446 2.5% 12,620 2.9% 57,250 7.3%
69- Productive Havens 551 0.3% 1,708 0.4% 3,048 0.4%
70- Favorably Frugal 2,408 1.1% 6,238 1.5% 11,296 1.4%
8,911 4.1% 15,416 3.6% 25,527 3.2%06- Casual Comfort 2,172 1.0% 3,630 0.8% 6,193 0.8%
10- Careers & Travel 1,022 0.5% 1,817 0.4% 2,828 0.4%
20- Carving Out Time 434 0.2% 949 0.2% 1,632 0.2%
26- Getting Established 5,282 2.4% 9,020 2.1% 14,874 1.9%
3,850 1.8% 7,315 1.7% 13,137 1.7%11- Schools & Shopping 836 0.4% 1,468 0.3% 2,684 0.3%
12- On the Go 1,223 0.6% 2,274 0.5% 3,989 0.5%
19- Country Comfort 29 0.0% 46 0.0% 130 0.0%
27- Tenured Proprietors 1,762 0.8% 3,527 0.8% 6,334 0.8%
3,927 1.8% 7,040 1.6% 19,840 2.5%29- City Mixers 2,202 1.0% 3,076 0.7% 13,667 1.7%
35- Working & Active 883 0.4% 1,984 0.5% 3,080 0.4%
56- Metro Active 842 0.4% 1,980 0.5% 3,093 0.4%
8,015 3.7% 19,928 4.6% 36,163 4.6%47- Rural Parents 1 0.0% 32 0.0% 43 0.0%
53- Metro Strivers 8,011 3.7% 19,881 4.6% 36,086 4.6%
60- Rural & Mobile 3 0.0% 15 0.0% 34 0.0%
10 Min Drive 15 Min Drive 20 Min Drive
(01Y) Starting Out
(02Y) Taking Hold
(03X) Settling Down
(04X) Social Connectors
(05X) Busy Households
(06X) Working & Studying
(07X) Career Oriented
(08X) Large Households
(09B) Comfortable Independence
(10B) Rural-Metro Mix
Uses the Personicx household life stage segmentation system. More information about each cluster
and lifestage group is available by clicking on the respective category. Page 2 of 3

Household Segmentation ProfileMarket: Huntington Dr and San Marino Ave | San Marino CA
Date: 10/31/2019
TOTAL HOUSEHOLDS 217,016 100% 428,847 100% 788,502 100%
Lifestage Group Cluster Name 10 Min Drive 15 Min Drive 20 Min Drive
22,104 10.2% 33,699 7.9% 47,617 6.0%01- Summit Estates 9,605 4.4% 14,477 3.4% 19,998 2.5%
04- Top Professionals 10,472 4.8% 15,713 3.7% 21,715 2.8%
07- Active Lifestyles 2,027 0.9% 3,509 0.8% 5,904 0.7%
17,316 8.0% 33,274 7.8% 56,988 7.2%13- Work & Play 9,330 4.3% 17,178 4.0% 28,611 3.6%
17- Firmly Established 7,986 3.7% 16,096 3.8% 28,377 3.6%
5,336 2.5% 14,522 3.4% 26,209 3.3%38- Occupational Mix 5,336 2.5% 14,515 3.4% 26,197 3.3%
48- Farm & Home 0 0.0% 7 0.0% 12 0.0%
20,241 9.3% 35,411 8.3% 70,605 9.0%16- Country Enthusiasts 1 0.0% 9 0.0% 13 0.0%
22- Comfortable Cornerstones 373 0.2% 889 0.2% 1,594 0.2%
31- Mid-Americana 1,194 0.6% 2,679 0.6% 4,083 0.5%
32- Metro Mix 2,412 1.1% 4,526 1.1% 11,640 1.5%
33- Urban Diversity 16,261 7.5% 27,308 6.4% 53,275 6.8%
19,677 9.1% 29,693 6.9% 42,093 5.3%02- Established Elite 11,522 5.3% 17,070 4.0% 24,101 3.1%
03- Corporate Connected 8,155 3.8% 12,623 2.9% 17,992 2.3%
2,843 1.3% 5,816 1.4% 9,690 1.2%14- Career Centered 2,367 1.1% 4,587 1.1% 7,392 0.9%
15- Country Ways 0 0.0% 5 0.0% 8 0.0%
23- Good Neighbors 476 0.2% 1,224 0.3% 2,290 0.3%
12,895 5.9% 31,583 7.4% 65,820 8.3%43- Work & Causes 1,592 0.7% 3,482 0.8% 5,493 0.7%
44- Open Houses 1,910 0.9% 4,305 1.0% 6,792 0.9%
55- Community Life 1,601 0.7% 4,228 1.0% 6,737 0.9%
63- Staying Home 6,778 3.1% 16,830 3.9% 41,369 5.2%
68- Staying Healthy 1,014 0.5% 2,738 0.6% 5,429 0.7%
1 0.0% 20 0.0% 28 0.0%40- Great Outdoors 0 0.0% 3 0.0% 5 0.0%
50- Rural Community 1 0.0% 9 0.0% 13 0.0%
54- Work & Outdoors 0 0.0% 8 0.0% 10 0.0%
25,605 11.8% 42,731 10.0% 60,861 7.7%05- Active & Involved 4,647 2.1% 7,548 1.8% 11,133 1.4%
08- Solid Surroundings 8,918 4.1% 15,243 3.6% 21,696 2.8%
09- Busy Schedules 12,039 5.5% 19,940 4.6% 28,032 3.6%
15,982 7.4% 34,632 8.1% 59,873 7.6%25- Clubs & Causes 1,610 0.7% 3,673 0.9% 5,989 0.8%
28- Community Pillars 2,672 1.2% 5,137 1.2% 8,324 1.1%
36- Persistent & Productive 11,699 5.4% 25,822 6.0% 45,560 5.8%
11,082 5.1% 27,746 6.5% 53,451 6.8%49- Home & Garden 2,383 1.1% 5,590 1.3% 9,848 1.2%
51- Role Models 1,858 0.9% 4,611 1.1% 7,517 1.0%
64- Practical & Careful 1,735 0.8% 4,234 1.0% 7,862 1.0%
65- Hobbies & Shopping 1,919 0.9% 4,909 1.1% 8,044 1.0%
66- Helping Hands 3,188 1.5% 8,402 2.0% 20,180 2.6%
(11B) Affluent Households
(12B) Comfortable Households
(13B) Working Households
(14B) Diverging Paths
(15M) Top Wealth
(20S) Community Minded
(21S) Leisure Seekers
(16M) Living Well
(17M)Bargain Hunters
(18M) Thrifty & Active
(19M) Solid Prestige
Uses the Personicx household life stage segmentation system. More information about each cluster
and lifestage group is available by clicking on the respective category. Page 3 of 3
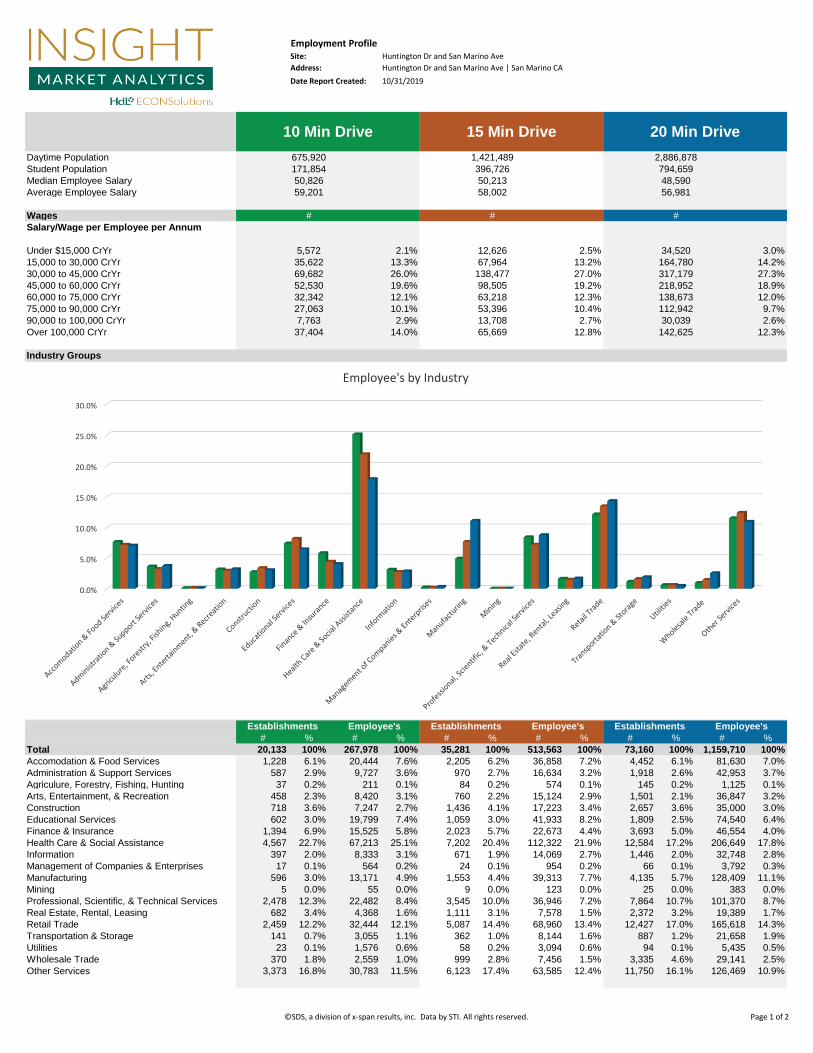
Employment ProfileSite: Huntington Dr and San Marino Ave
Address: Huntington Dr and San Marino Ave | San Marino CA
Date Report Created:
Daytime Population
Student Population
Median Employee Salary
Average Employee Salary
Wages
Salary/Wage per Employee per Annum
Under $15,000 CrYr 2.1% 2.5% 3.0%
15,000 to 30,000 CrYr 13.3% 13.2% 14.2%
30,000 to 45,000 CrYr 26.0% 27.0% 27.3%
45,000 to 60,000 CrYr 19.6% 19.2% 18.9%
60,000 to 75,000 CrYr 12.1% 12.3% 12.0%
75,000 to 90,000 CrYr 10.1% 10.4% 9.7%
90,000 to 100,000 CrYr 2.9% 2.7% 2.6%
Over 100,000 CrYr 14.0% 12.8% 12.3%
Industry Groups
# % # % # % # % # % # %
Total 20,133 100% 267,978 100% 35,281 100% 513,563 100% 73,160 100% 1,159,710 100%
Accomodation & Food Services 1,228 6.1% 20,444 7.6% 2,205 6.2% 36,858 7.2% 4,452 6.1% 81,630 7.0%
Administration & Support Services 587 2.9% 9,727 3.6% 970 2.7% 16,634 3.2% 1,918 2.6% 42,953 3.7%
Agriculure, Forestry, Fishing, Hunting 37 0.2% 211 0.1% 84 0.2% 574 0.1% 145 0.2% 1,125 0.1%
Arts, Entertainment, & Recreation 458 2.3% 8,420 3.1% 760 2.2% 15,124 2.9% 1,501 2.1% 36,847 3.2%
Construction 718 3.6% 7,247 2.7% 1,436 4.1% 17,223 3.4% 2,657 3.6% 35,000 3.0%
Educational Services 602 3.0% 19,799 7.4% 1,059 3.0% 41,933 8.2% 1,809 2.5% 74,540 6.4%
Finance & Insurance 1,394 6.9% 15,525 5.8% 2,023 5.7% 22,673 4.4% 3,693 5.0% 46,554 4.0%
Health Care & Social Assistance 4,567 22.7% 67,213 25.1% 7,202 20.4% 112,322 21.9% 12,584 17.2% 206,649 17.8%
Information 397 2.0% 8,333 3.1% 671 1.9% 14,069 2.7% 1,446 2.0% 32,748 2.8%
Management of Companies & Enterprises 17 0.1% 564 0.2% 24 0.1% 954 0.2% 66 0.1% 3,792 0.3%
Manufacturing 596 3.0% 13,171 4.9% 1,553 4.4% 39,313 7.7% 4,135 5.7% 128,409 11.1%
Mining 5 0.0% 55 0.0% 9 0.0% 123 0.0% 25 0.0% 383 0.0%
Professional, Scientific, & Technical Services 2,478 12.3% 22,482 8.4% 3,545 10.0% 36,946 7.2% 7,864 10.7% 101,370 8.7%
Real Estate, Rental, Leasing 682 3.4% 4,368 1.6% 1,111 3.1% 7,578 1.5% 2,372 3.2% 19,389 1.7%
Retail Trade 2,459 12.2% 32,444 12.1% 5,087 14.4% 68,960 13.4% 12,427 17.0% 165,618 14.3%
Transportation & Storage 141 0.7% 3,055 1.1% 362 1.0% 8,144 1.6% 887 1.2% 21,658 1.9%
Utilities 23 0.1% 1,576 0.6% 58 0.2% 3,094 0.6% 94 0.1% 5,435 0.5%
Wholesale Trade 370 1.8% 2,559 1.0% 999 2.8% 7,456 1.5% 3,335 4.6% 29,141 2.5%
Other Services 3,373 16.8% 30,783 11.5% 6,123 17.4% 63,585 12.4% 11,750 16.1% 126,469 10.9%
7,763 30,039
37,404 142,625
53,396
13,708
65,669
# # #
27,063 112,942
5,572 34,520
Establishments Employee'sEstablishments Employee's Establishments
317,179
52,530 218,952
32,342 138,673
138,477
98,505
63,218
35,622 164,780
12,626
67,964
69,682
50,826 48,590
58,002
Employee's
171,854 794,659
1,421,489
396,726
50,213
59,201 56,981
10 Min Drive 20 Min Drive15 Min Drive
10/31/2019
675,920 2,886,878
0.0%
5.0%
10.0%
15.0%
20.0%
25.0%
30.0%
Employee's by Industry
©SDS, a division of x-span results, inc. Data by STI. All rights reserved. Page 1 of 2
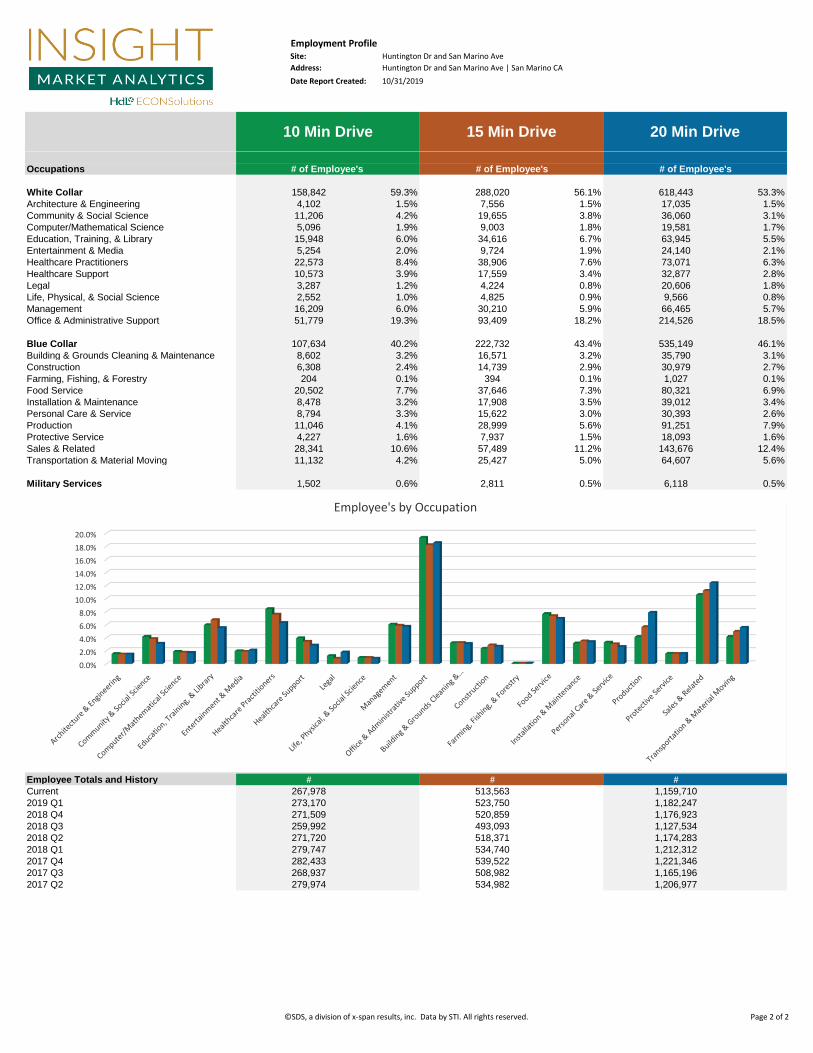
Employment ProfileSite: Huntington Dr and San Marino Ave
Address: Huntington Dr and San Marino Ave | San Marino CA
Date Report Created:
10 Min Drive 20 Min Drive15 Min Drive
10/31/2019
Occupations
White Collar 59.3% 56.1% 53.3%
Architecture & Engineering 1.5% 1.5% 1.5%
Community & Social Science 4.2% 3.8% 3.1%
Computer/Mathematical Science 1.9% 1.8% 1.7%
Education, Training, & Library 6.0% 6.7% 5.5%
Entertainment & Media 2.0% 1.9% 2.1%
Healthcare Practitioners 8.4% 7.6% 6.3%
Healthcare Support 3.9% 3.4% 2.8%
Legal 1.2% 0.8% 1.8%
Life, Physical, & Social Science 1.0% 0.9% 0.8%
Management 6.0% 5.9% 5.7%
Office & Administrative Support 19.3% 18.2% 18.5%
Blue Collar 40.2% 43.4% 46.1%
Building & Grounds Cleaning & Maintenance 3.2% 3.2% 3.1%
Construction 2.4% 2.9% 2.7%
Farming, Fishing, & Forestry 0.1% 0.1% 0.1%
Food Service 7.7% 7.3% 6.9%
Installation & Maintenance 3.2% 3.5% 3.4%
Personal Care & Service 3.3% 3.0% 2.6%
Production 4.1% 5.6% 7.9%
Protective Service 1.6% 1.5% 1.6%
Sales & Related 10.6% 11.2% 12.4%
Transportation & Material Moving 4.2% 5.0% 5.6%
Military Services 0.6% 0.5% 0.5%
Employee Totals and History
Current
2019 Q1
2018 Q4
2018 Q3
2018 Q2
2018 Q1
2017 Q4
2017 Q3
2017 Q2
# of Employee's
8,794 30,393
11,046
# # #
6,1182,811
28,999
288,020
93,409
15,622
20,502
8,478
51,779 214,526
1,502
91,251
4,227 18,093
28,341 143,676
11,132 64,607
14,739
394
37,646
17,908
57,489
25,427
80,321
39,012
7,937
8,602 35,790
6,308 30,979
204 1,027
16,571
2,552 9,566
16,209 66,465
107,634 535,149
4,825
30,210
222,732
22,573 73,071
10,573 32,877
3,287 20,606
38,906
17,559
4,224
15,948 63,945
5,254 24,140
9,003
34,616
9,724
17,035
11,206 36,060
7,556
19,655
5,096 19,581
518,371
268,937 1,165,196
279,974 1,206,977
534,740
539,522
508,982
534,982
271,720 1,174,283
279,747 1,212,312
282,433 1,221,346
618,443
273,170 1,182,247
271,509 1,176,923
259,992 1,127,534
523,750
520,859
4,102
513,563
# of Employee's # of Employee's
158,842
493,093
267,978 1,159,710
0.0%
2.0%
4.0%
6.0%
8.0%
10.0%
12.0%
14.0%
16.0%
18.0%
20.0%
Employee's by Occupation
©SDS, a division of x-span results, inc. Data by STI. All rights reserved. Page 2 of 2
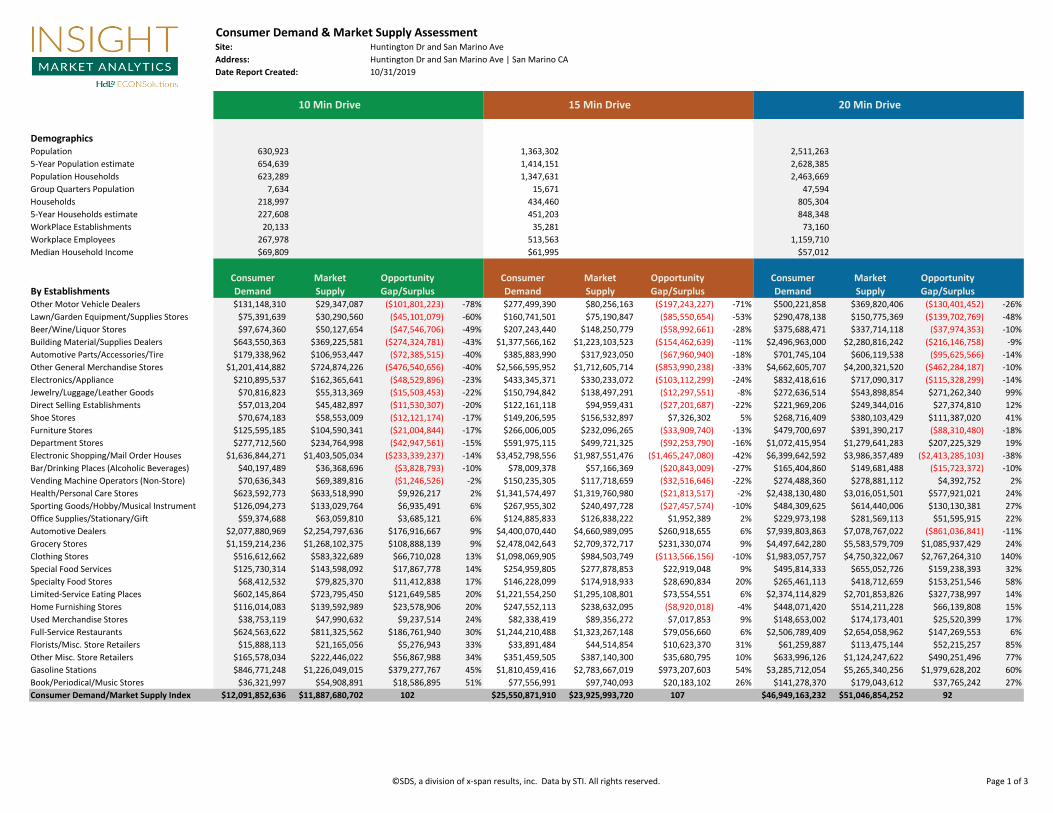
Consumer Demand & Market Supply AssessmentSite: Huntington Dr and San Marino Ave
Address: Huntington Dr and San Marino Ave | San Marino CA
Date Report Created: 10/31/2019
DemographicsPopulation 630,923 1,363,302 2,511,263
5-Year Population estimate 654,639 1,414,151 2,628,385
Population Households 623,289 1,347,631 2,463,669
Group Quarters Population 7,634 15,671 47,594
Households 218,997 434,460 805,304
5-Year Households estimate 227,608 451,203 848,348
WorkPlace Establishments 20,133 35,281 73,160
Workplace Employees 267,978 513,563 1,159,710
Median Household Income $69,809 $61,995 $57,012
Consumer Market Opportunity Consumer Market Opportunity Consumer Market Opportunity
By Establishments Demand Supply Gap/Surplus Demand Supply Gap/Surplus Demand Supply Gap/SurplusOther Motor Vehicle Dealers $131,148,310 $29,347,087 ($101,801,223) -78% $277,499,390 $80,256,163 ($197,243,227) -71% $500,221,858 $369,820,406 ($130,401,452) -26%
Lawn/Garden Equipment/Supplies Stores $75,391,639 $30,290,560 ($45,101,079) -60% $160,741,501 $75,190,847 ($85,550,654) -53% $290,478,138 $150,775,369 ($139,702,769) -48%
Beer/Wine/Liquor Stores $97,674,360 $50,127,654 ($47,546,706) -49% $207,243,440 $148,250,779 ($58,992,661) -28% $375,688,471 $337,714,118 ($37,974,353) -10%
Building Material/Supplies Dealers $643,550,363 $369,225,581 ($274,324,781) -43% $1,377,566,162 $1,223,103,523 ($154,462,639) -11% $2,496,963,000 $2,280,816,242 ($216,146,758) -9%
Automotive Parts/Accessories/Tire $179,338,962 $106,953,447 ($72,385,515) -40% $385,883,990 $317,923,050 ($67,960,940) -18% $701,745,104 $606,119,538 ($95,625,566) -14%
Other General Merchandise Stores $1,201,414,882 $724,874,226 ($476,540,656) -40% $2,566,595,952 $1,712,605,714 ($853,990,238) -33% $4,662,605,707 $4,200,321,520 ($462,284,187) -10%
Electronics/Appliance $210,895,537 $162,365,641 ($48,529,896) -23% $433,345,371 $330,233,072 ($103,112,299) -24% $832,418,616 $717,090,317 ($115,328,299) -14%
Jewelry/Luggage/Leather Goods $70,816,823 $55,313,369 ($15,503,453) -22% $150,794,842 $138,497,291 ($12,297,551) -8% $272,636,514 $543,898,854 $271,262,340 99%
Direct Selling Establishments $57,013,204 $45,482,897 ($11,530,307) -20% $122,161,118 $94,959,431 ($27,201,687) -22% $221,969,206 $249,344,016 $27,374,810 12%
Shoe Stores $70,674,183 $58,553,009 ($12,121,174) -17% $149,206,595 $156,532,897 $7,326,302 5% $268,716,409 $380,103,429 $111,387,020 41%
Furniture Stores $125,595,185 $104,590,341 ($21,004,844) -17% $266,006,005 $232,096,265 ($33,909,740) -13% $479,700,697 $391,390,217 ($88,310,480) -18%
Department Stores $277,712,560 $234,764,998 ($42,947,561) -15% $591,975,115 $499,721,325 ($92,253,790) -16% $1,072,415,954 $1,279,641,283 $207,225,329 19%
Electronic Shopping/Mail Order Houses $1,636,844,271 $1,403,505,034 ($233,339,237) -14% $3,452,798,556 $1,987,551,476 ($1,465,247,080) -42% $6,399,642,592 $3,986,357,489 ($2,413,285,103) -38%
Bar/Drinking Places (Alcoholic Beverages) $40,197,489 $36,368,696 ($3,828,793) -10% $78,009,378 $57,166,369 ($20,843,009) -27% $165,404,860 $149,681,488 ($15,723,372) -10%
Vending Machine Operators (Non-Store) $70,636,343 $69,389,816 ($1,246,526) -2% $150,235,305 $117,718,659 ($32,516,646) -22% $274,488,360 $278,881,112 $4,392,752 2%
Health/Personal Care Stores $623,592,773 $633,518,990 $9,926,217 2% $1,341,574,497 $1,319,760,980 ($21,813,517) -2% $2,438,130,480 $3,016,051,501 $577,921,021 24%
Sporting Goods/Hobby/Musical Instrument $126,094,273 $133,029,764 $6,935,491 6% $267,955,302 $240,497,728 ($27,457,574) -10% $484,309,625 $614,440,006 $130,130,381 27%
Office Supplies/Stationary/Gift $59,374,688 $63,059,810 $3,685,121 6% $124,885,833 $126,838,222 $1,952,389 2% $229,973,198 $281,569,113 $51,595,915 22%
Automotive Dealers $2,077,880,969 $2,254,797,636 $176,916,667 9% $4,400,070,440 $4,660,989,095 $260,918,655 6% $7,939,803,863 $7,078,767,022 ($861,036,841) -11%
Grocery Stores $1,159,214,236 $1,268,102,375 $108,888,139 9% $2,478,042,643 $2,709,372,717 $231,330,074 9% $4,497,642,280 $5,583,579,709 $1,085,937,429 24%
Clothing Stores $516,612,662 $583,322,689 $66,710,028 13% $1,098,069,905 $984,503,749 ($113,566,156) -10% $1,983,057,757 $4,750,322,067 $2,767,264,310 140%
Special Food Services $125,730,314 $143,598,092 $17,867,778 14% $254,959,805 $277,878,853 $22,919,048 9% $495,814,333 $655,052,726 $159,238,393 32%
Specialty Food Stores $68,412,532 $79,825,370 $11,412,838 17% $146,228,099 $174,918,933 $28,690,834 20% $265,461,113 $418,712,659 $153,251,546 58%
Limited-Service Eating Places $602,145,864 $723,795,450 $121,649,585 20% $1,221,554,250 $1,295,108,801 $73,554,551 6% $2,374,114,829 $2,701,853,826 $327,738,997 14%
Home Furnishing Stores $116,014,083 $139,592,989 $23,578,906 20% $247,552,113 $238,632,095 ($8,920,018) -4% $448,071,420 $514,211,228 $66,139,808 15%
Used Merchandise Stores $38,753,119 $47,990,632 $9,237,514 24% $82,338,419 $89,356,272 $7,017,853 9% $148,653,002 $174,173,401 $25,520,399 17%
Full-Service Restaurants $624,563,622 $811,325,562 $186,761,940 30% $1,244,210,488 $1,323,267,148 $79,056,660 6% $2,506,789,409 $2,654,058,962 $147,269,553 6%
Florists/Misc. Store Retailers $15,888,113 $21,165,056 $5,276,943 33% $33,891,484 $44,514,854 $10,623,370 31% $61,259,887 $113,475,144 $52,215,257 85%
Other Misc. Store Retailers $165,578,034 $222,446,022 $56,867,988 34% $351,459,505 $387,140,300 $35,680,795 10% $633,996,126 $1,124,247,622 $490,251,496 77%
Gasoline Stations $846,771,248 $1,226,049,015 $379,277,767 45% $1,810,459,416 $2,783,667,019 $973,207,603 54% $3,285,712,054 $5,265,340,256 $1,979,628,202 60%
Book/Periodical/Music Stores $36,321,997 $54,908,891 $18,586,895 51% $77,556,991 $97,740,093 $20,183,102 26% $141,278,370 $179,043,612 $37,765,242 27%
Consumer Demand/Market Supply Index $12,091,852,636 $11,887,680,702 102 $25,550,871,910 $23,925,993,720 107 $46,949,163,232 $51,046,854,252 92
10 Min Drive 15 Min Drive 20 Min Drive
©SDS, a division of x-span results, inc. Data by STI. All rights reserved. Page 1 of 3
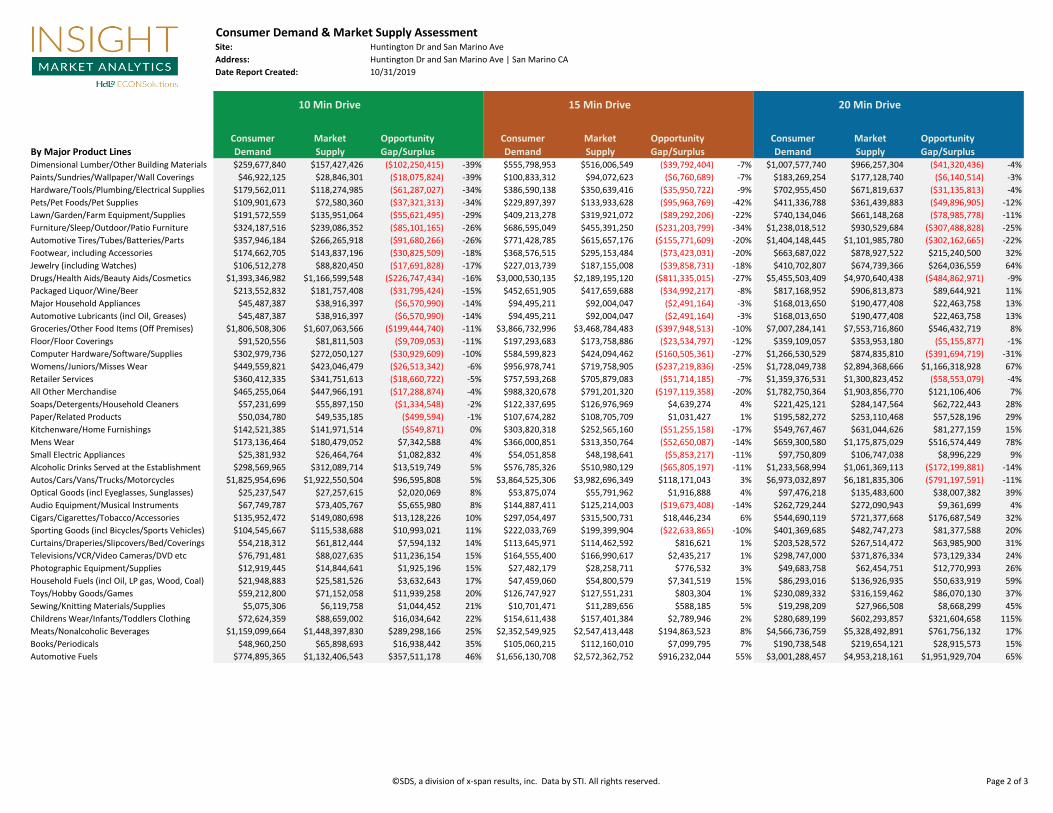
Consumer Demand & Market Supply AssessmentSite: Huntington Dr and San Marino Ave
Address: Huntington Dr and San Marino Ave | San Marino CA
Date Report Created: 10/31/2019
10 Min Drive 15 Min Drive 20 Min Drive
Consumer Market Opportunity Consumer Market Opportunity Consumer Market Opportunity
By Major Product Lines Demand Supply Gap/Surplus Demand Supply Gap/Surplus Demand Supply Gap/SurplusDimensional Lumber/Other Building Materials $259,677,840 $157,427,426 ($102,250,415) -39% $555,798,953 $516,006,549 ($39,792,404) -7% $1,007,577,740 $966,257,304 ($41,320,436) -4%
Paints/Sundries/Wallpaper/Wall Coverings $46,922,125 $28,846,301 ($18,075,824) -39% $100,833,312 $94,072,623 ($6,760,689) -7% $183,269,254 $177,128,740 ($6,140,514) -3%
Hardware/Tools/Plumbing/Electrical Supplies $179,562,011 $118,274,985 ($61,287,027) -34% $386,590,138 $350,639,416 ($35,950,722) -9% $702,955,450 $671,819,637 ($31,135,813) -4%
Pets/Pet Foods/Pet Supplies $109,901,673 $72,580,360 ($37,321,313) -34% $229,897,397 $133,933,628 ($95,963,769) -42% $411,336,788 $361,439,883 ($49,896,905) -12%
Lawn/Garden/Farm Equipment/Supplies $191,572,559 $135,951,064 ($55,621,495) -29% $409,213,278 $319,921,072 ($89,292,206) -22% $740,134,046 $661,148,268 ($78,985,778) -11%
Furniture/Sleep/Outdoor/Patio Furniture $324,187,516 $239,086,352 ($85,101,165) -26% $686,595,049 $455,391,250 ($231,203,799) -34% $1,238,018,512 $930,529,684 ($307,488,828) -25%
Automotive Tires/Tubes/Batteries/Parts $357,946,184 $266,265,918 ($91,680,266) -26% $771,428,785 $615,657,176 ($155,771,609) -20% $1,404,148,445 $1,101,985,780 ($302,162,665) -22%
Footwear, including Accessories $174,662,705 $143,837,196 ($30,825,509) -18% $368,576,515 $295,153,484 ($73,423,031) -20% $663,687,022 $878,927,522 $215,240,500 32%
Jewelry (including Watches) $106,512,278 $88,820,450 ($17,691,828) -17% $227,013,739 $187,155,008 ($39,858,731) -18% $410,702,807 $674,739,366 $264,036,559 64%
Drugs/Health Aids/Beauty Aids/Cosmetics $1,393,346,982 $1,166,599,548 ($226,747,434) -16% $3,000,530,135 $2,189,195,120 ($811,335,015) -27% $5,455,503,409 $4,970,640,438 ($484,862,971) -9%
Packaged Liquor/Wine/Beer $213,552,832 $181,757,408 ($31,795,424) -15% $452,651,905 $417,659,688 ($34,992,217) -8% $817,168,952 $906,813,873 $89,644,921 11%
Major Household Appliances $45,487,387 $38,916,397 ($6,570,990) -14% $94,495,211 $92,004,047 ($2,491,164) -3% $168,013,650 $190,477,408 $22,463,758 13%
Automotive Lubricants (incl Oil, Greases) $45,487,387 $38,916,397 ($6,570,990) -14% $94,495,211 $92,004,047 ($2,491,164) -3% $168,013,650 $190,477,408 $22,463,758 13%
Groceries/Other Food Items (Off Premises) $1,806,508,306 $1,607,063,566 ($199,444,740) -11% $3,866,732,996 $3,468,784,483 ($397,948,513) -10% $7,007,284,141 $7,553,716,860 $546,432,719 8%
Floor/Floor Coverings $91,520,556 $81,811,503 ($9,709,053) -11% $197,293,683 $173,758,886 ($23,534,797) -12% $359,109,057 $353,953,180 ($5,155,877) -1%
Computer Hardware/Software/Supplies $302,979,736 $272,050,127 ($30,929,609) -10% $584,599,823 $424,094,462 ($160,505,361) -27% $1,266,530,529 $874,835,810 ($391,694,719) -31%
Womens/Juniors/Misses Wear $449,559,821 $423,046,479 ($26,513,342) -6% $956,978,741 $719,758,905 ($237,219,836) -25% $1,728,049,738 $2,894,368,666 $1,166,318,928 67%
Retailer Services $360,412,335 $341,751,613 ($18,660,722) -5% $757,593,268 $705,879,083 ($51,714,185) -7% $1,359,376,531 $1,300,823,452 ($58,553,079) -4%
All Other Merchandise $465,255,064 $447,966,191 ($17,288,874) -4% $988,320,678 $791,201,320 ($197,119,358) -20% $1,782,750,364 $1,903,856,770 $121,106,406 7%
Soaps/Detergents/Household Cleaners $57,231,699 $55,897,150 ($1,334,548) -2% $122,337,695 $126,976,969 $4,639,274 4% $221,425,121 $284,147,564 $62,722,443 28%
Paper/Related Products $50,034,780 $49,535,185 ($499,594) -1% $107,674,282 $108,705,709 $1,031,427 1% $195,582,272 $253,110,468 $57,528,196 29%
Kitchenware/Home Furnishings $142,521,385 $141,971,514 ($549,871) 0% $303,820,318 $252,565,160 ($51,255,158) -17% $549,767,467 $631,044,626 $81,277,159 15%
Mens Wear $173,136,464 $180,479,052 $7,342,588 4% $366,000,851 $313,350,764 ($52,650,087) -14% $659,300,580 $1,175,875,029 $516,574,449 78%
Small Electric Appliances $25,381,932 $26,464,764 $1,082,832 4% $54,051,858 $48,198,641 ($5,853,217) -11% $97,750,809 $106,747,038 $8,996,229 9%
Alcoholic Drinks Served at the Establishment $298,569,965 $312,089,714 $13,519,749 5% $576,785,326 $510,980,129 ($65,805,197) -11% $1,233,568,994 $1,061,369,113 ($172,199,881) -14%
Autos/Cars/Vans/Trucks/Motorcycles $1,825,954,696 $1,922,550,504 $96,595,808 5% $3,864,525,306 $3,982,696,349 $118,171,043 3% $6,973,032,897 $6,181,835,306 ($791,197,591) -11%
Optical Goods (incl Eyeglasses, Sunglasses) $25,237,547 $27,257,615 $2,020,069 8% $53,875,074 $55,791,962 $1,916,888 4% $97,476,218 $135,483,600 $38,007,382 39%
Audio Equipment/Musical Instruments $67,749,787 $73,405,767 $5,655,980 8% $144,887,411 $125,214,003 ($19,673,408) -14% $262,729,244 $272,090,943 $9,361,699 4%
Cigars/Cigarettes/Tobacco/Accessories $135,952,472 $149,080,698 $13,128,226 10% $297,054,497 $315,500,731 $18,446,234 6% $544,690,119 $721,377,668 $176,687,549 32%
Sporting Goods (incl Bicycles/Sports Vehicles) $104,545,667 $115,538,688 $10,993,021 11% $222,033,769 $199,399,904 ($22,633,865) -10% $401,369,685 $482,747,273 $81,377,588 20%
Curtains/Draperies/Slipcovers/Bed/Coverings $54,218,312 $61,812,444 $7,594,132 14% $113,645,971 $114,462,592 $816,621 1% $203,528,572 $267,514,472 $63,985,900 31%
Televisions/VCR/Video Cameras/DVD etc $76,791,481 $88,027,635 $11,236,154 15% $164,555,400 $166,990,617 $2,435,217 1% $298,747,000 $371,876,334 $73,129,334 24%
Photographic Equipment/Supplies $12,919,445 $14,844,641 $1,925,196 15% $27,482,179 $28,258,711 $776,532 3% $49,683,758 $62,454,751 $12,770,993 26%
Household Fuels (incl Oil, LP gas, Wood, Coal) $21,948,883 $25,581,526 $3,632,643 17% $47,459,060 $54,800,579 $7,341,519 15% $86,293,016 $136,926,935 $50,633,919 59%
Toys/Hobby Goods/Games $59,212,800 $71,152,058 $11,939,258 20% $126,747,927 $127,551,231 $803,304 1% $230,089,332 $316,159,462 $86,070,130 37%
Sewing/Knitting Materials/Supplies $5,075,306 $6,119,758 $1,044,452 21% $10,701,471 $11,289,656 $588,185 5% $19,298,209 $27,966,508 $8,668,299 45%
Childrens Wear/Infants/Toddlers Clothing $72,624,359 $88,659,002 $16,034,642 22% $154,611,438 $157,401,384 $2,789,946 2% $280,689,199 $602,293,857 $321,604,658 115%
Meats/Nonalcoholic Beverages $1,159,099,664 $1,448,397,830 $289,298,166 25% $2,352,549,925 $2,547,413,448 $194,863,523 8% $4,566,736,759 $5,328,492,891 $761,756,132 17%
Books/Periodicals $48,960,250 $65,898,693 $16,938,442 35% $105,060,215 $112,160,010 $7,099,795 7% $190,738,548 $219,654,121 $28,915,573 15%
Automotive Fuels $774,895,365 $1,132,406,543 $357,511,178 46% $1,656,130,708 $2,572,362,752 $916,232,044 55% $3,001,288,457 $4,953,218,161 $1,951,929,704 65%
©SDS, a division of x-span results, inc. Data by STI. All rights reserved. Page 2 of 3
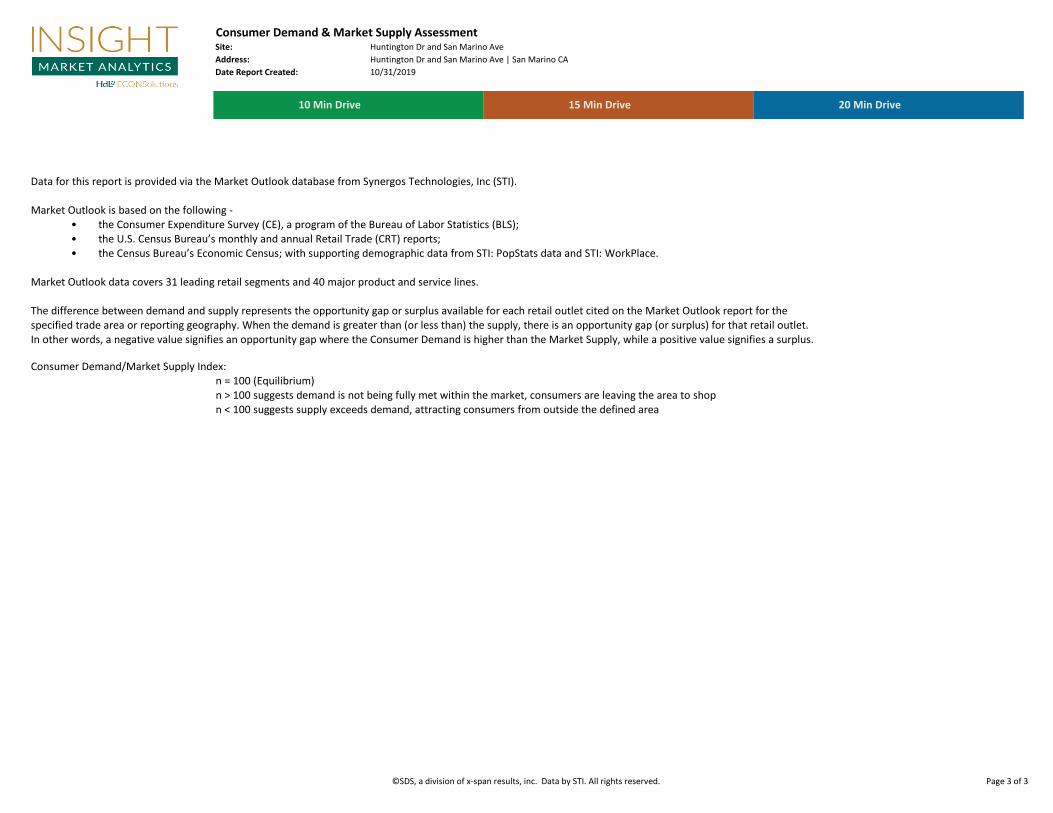
Consumer Demand & Market Supply AssessmentSite: Huntington Dr and San Marino Ave
Address: Huntington Dr and San Marino Ave | San Marino CA
Date Report Created: 10/31/2019
10 Min Drive 15 Min Drive 20 Min Drive
Data for this report is provided via the Market Outlook database from Synergos Technologies, Inc (STI).
Market Outlook is based on the following -• the Consumer Expenditure Survey (CE), a program of the Bureau of Labor Statistics (BLS); • the U.S. Census Bureau’s monthly and annual Retail Trade (CRT) reports; • the Census Bureau’s Economic Census; with supporting demographic data from STI: PopStats data and STI: WorkPlace.
Market Outlook data covers 31 leading retail segments and 40 major product and service lines.
The difference between demand and supply represents the opportunity gap or surplus available for each retail outlet cited on the Market Outlook report for the specified trade area or reporting geography. When the demand is greater than (or less than) the supply, there is an opportunity gap (or surplus) for that retail outlet. In other words, a negative value signifies an opportunity gap where the Consumer Demand is higher than the Market Supply, while a positive value signifies a surplus.
Consumer Demand/Market Supply Index: n = 100 (Equilibrium)n > 100 suggests demand is not being fully met within the market, consumers are leaving the area to shopn < 100 suggests supply exceeds demand, attracting consumers from outside the defined area
©SDS, a division of x-span results, inc. Data by STI. All rights reserved. Page 3 of 3
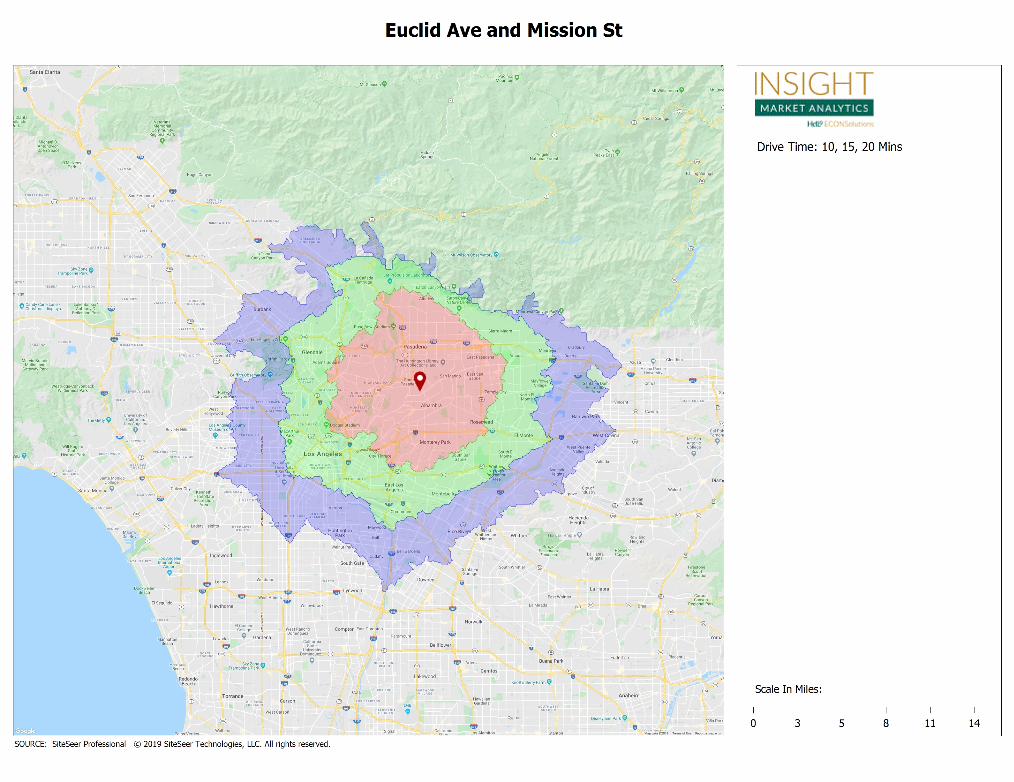
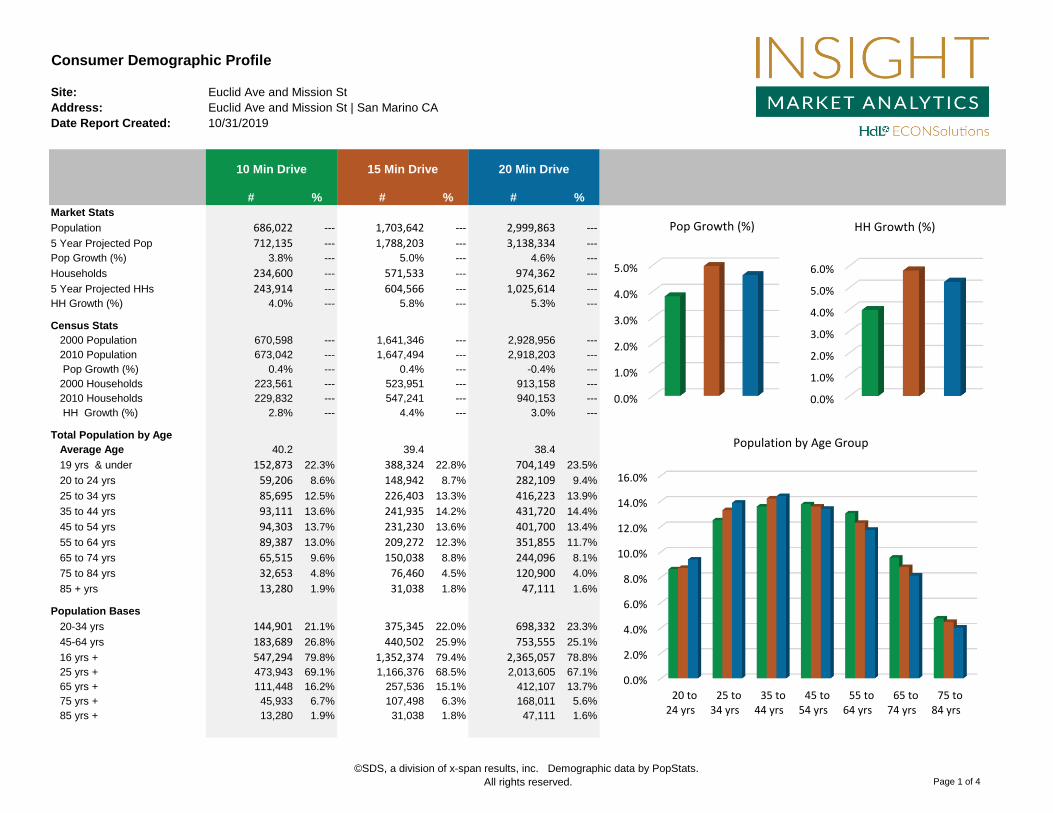
Consumer Demographic Profile
Site: Euclid Ave and Mission St
Address: Euclid Ave and Mission St | San Marino CA
Date Report Created: 10/31/2019
# % # % # %
Market Stats
Population 686,022 --- 1,703,642 --- 2,999,863 ---
5 Year Projected Pop 712,135 --- 1,788,203 --- 3,138,334 ---
Pop Growth (%) 3.8% --- 5.0% --- 4.6% ---
Households 234,600 --- 571,533 --- 974,362 ---
5 Year Projected HHs 243,914 --- 604,566 --- 1,025,614 ---
HH Growth (%) 4.0% --- 5.8% --- 5.3% ---
Census Stats
2000 Population 670,598 --- 1,641,346 --- 2,928,956 ---
2010 Population 673,042 --- 1,647,494 --- 2,918,203 ---
Pop Growth (%) 0.4% --- 0.4% --- -0.4% ---
2000 Households 223,561 --- 523,951 --- 913,158 ---
2010 Households 229,832 --- 547,241 --- 940,153 ---
HH Growth (%) 2.8% --- 4.4% --- 3.0% ---
Total Population by Age
Average Age 40.2 39.4 38.4
19 yrs & under 152,873 22.3% 388,324 22.8% 704,149 23.5%
20 to 24 yrs 59,206 8.6% 148,942 8.7% 282,109 9.4%
25 to 34 yrs 85,695 12.5% 226,403 13.3% 416,223 13.9%
35 to 44 yrs 93,111 13.6% 241,935 14.2% 431,720 14.4%
45 to 54 yrs 94,303 13.7% 231,230 13.6% 401,700 13.4%
55 to 64 yrs 89,387 13.0% 209,272 12.3% 351,855 11.7%
65 to 74 yrs 65,515 9.6% 150,038 8.8% 244,096 8.1%
75 to 84 yrs 32,653 4.8% 76,460 4.5% 120,900 4.0%
85 + yrs 13,280 1.9% 31,038 1.8% 47,111 1.6%
Population Bases
20-34 yrs 144,901 21.1% 375,345 22.0% 698,332 23.3%
45-64 yrs 183,689 26.8% 440,502 25.9% 753,555 25.1%
16 yrs + 547,294 79.8% 1,352,374 79.4% 2,365,057 78.8%
25 yrs + 473,943 69.1% 1,166,376 68.5% 2,013,605 67.1%
65 yrs + 111,448 16.2% 257,536 15.1% 412,107 13.7%
75 yrs + 45,933 6.7% 107,498 6.3% 168,011 5.6%
85 yrs + 13,280 1.9% 31,038 1.8% 47,111 1.6%
10 Min Drive 15 Min Drive 20 Min Drive
0.0%
1.0%
2.0%
3.0%
4.0%
5.0%
Pop Growth (%)
0.0%
1.0%
2.0%
3.0%
4.0%
5.0%
6.0%
HH Growth (%)
0.0%
2.0%
4.0%
6.0%
8.0%
10.0%
12.0%
14.0%
16.0%
20 to24 yrs
25 to34 yrs
35 to44 yrs
45 to54 yrs
55 to64 yrs
65 to74 yrs
75 to84 yrs
Population by Age Group
©SDS, a division of x-span results, inc. Demographic data by PopStats.
All rights reserved. Page 1 of 4

Consumer Demographic Profile
Site: Euclid Ave and Mission St
Address: Euclid Ave and Mission St | San Marino CA
Date Report Created: 10/31/2019
# % # % # %
10 Min Drive 15 Min Drive 20 Min Drive
Population by Race
White 136,327 19.9% 356,985 21.0% 572,326 19.1%
Hispanic 276,378 40.3% 827,920 48.6% 1,656,342 55.2%
Black 26,578 3.9% 58,788 3.5% 138,569 4.6%
Asian 230,775 33.6% 423,496 24.9% 572,939 19.1%
Ancestry
American Indian (ancestry) 1,134 0.2% 2,867 0.2% 4,880 0.2%
Hawaiin (ancestry) 417 0.1% 1,131 0.1% 1,967 0.1%
Household Income
Per Capita Income $32,670 --- $29,474 --- $26,249 ---
Average HH Income $95,535 --- $87,857 --- $80,816 ---
Median HH Income $66,887 --- $59,214 --- $54,281 ---
Less than $25K 46,041 19.6% 131,734 23.0% 235,747 24.2%
$25K to $34.9K 18,904 8.1% 50,430 8.8% 96,406 9.9%
$35K to $49.9K 25,824 11.0% 68,057 11.9% 126,976 13.0%
$50K to $74.9K 38,058 16.2% 90,586 15.8% 157,914 16.2%
$75K to $99.9K 28,121 12.0% 64,748 11.3% 108,993 11.2%
$100K to $149.9K 36,949 15.7% 80,057 14.0% 125,562 12.9%
$150K to $199.9K 20,267 8.6% 41,419 7.2% 61,096 6.3%
$200K + 20,434 8.7% 44,502 7.8% 61,668 6.3%
Education 473,943 1,166,376 2,013,605
Less than 9th Grade 58,784 12.4% 188,996 16.2% 361,024 17.9%
Some HS, No Diploma 36,450 7.7% 112,872 9.7% 219,917 10.9%
HS Grad (or Equivalent) 91,937 19.4% 232,625 19.9% 427,726 21.2%
Some College, No Degree 76,806 16.2% 181,791 15.6% 320,021 15.9%
Associate Degree 33,564 7.1% 77,760 6.7% 123,248 6.1%
Bachelor Degree 109,274 23.1% 240,162 20.6% 375,942 18.7%
Graduates Degree 43,516 9.2% 86,430 7.4% 123,391 6.1%
0.0%
10.0%
20.0%
30.0%
Lessthan$25K
$25Kto
$34.9K
$35Kto
$49.9K
$50Kto
$74.9K
$75Kto
$99.9K
$100Kto
$149.9K
$150Kto
$199.9K
Household Income Levels - %
0.0%10.0%20.0%30.0%
HS Grad(or
Equivalent)
SomeCollege, No
Degree
AssociateDegree
BachelorDegree Graduates
Degree
Education
0.0% 10.0% 20.0% 30.0% 40.0% 50.0% 60.0%
White
Hispanic
Black
Asian
Ethnic Breakdown
©SDS, a division of x-span results, inc. Demographic data by PopStats.
All rights reserved. Page 2 of 4
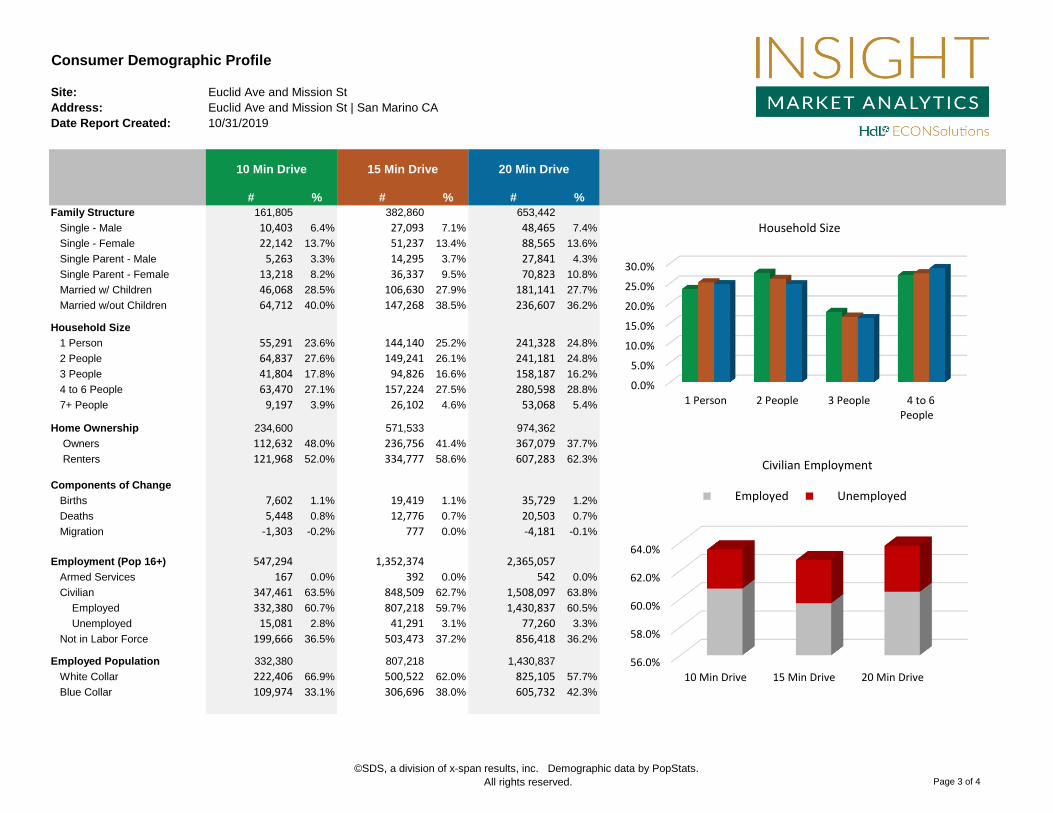
Consumer Demographic Profile
Site: Euclid Ave and Mission St
Address: Euclid Ave and Mission St | San Marino CA
Date Report Created: 10/31/2019
# % # % # %
10 Min Drive 15 Min Drive 20 Min Drive
Family Structure 161,805 382,860 653,442
Single - Male 10,403 6.4% 27,093 7.1% 48,465 7.4%
Single - Female 22,142 13.7% 51,237 13.4% 88,565 13.6%
Single Parent - Male 5,263 3.3% 14,295 3.7% 27,841 4.3%
Single Parent - Female 13,218 8.2% 36,337 9.5% 70,823 10.8%
Married w/ Children 46,068 28.5% 106,630 27.9% 181,141 27.7%
Married w/out Children 64,712 40.0% 147,268 38.5% 236,607 36.2%
Household Size
1 Person 55,291 23.6% 144,140 25.2% 241,328 24.8%
2 People 64,837 27.6% 149,241 26.1% 241,181 24.8%
3 People 41,804 17.8% 94,826 16.6% 158,187 16.2%
4 to 6 People 63,470 27.1% 157,224 27.5% 280,598 28.8%
7+ People 9,197 3.9% 26,102 4.6% 53,068 5.4%
Home Ownership 234,600 571,533 974,362
Owners 112,632 48.0% 236,756 41.4% 367,079 37.7%
Renters 121,968 52.0% 334,777 58.6% 607,283 62.3%
Components of Change
Births 7,602 1.1% 19,419 1.1% 35,729 1.2%
Deaths 5,448 0.8% 12,776 0.7% 20,503 0.7%
Migration -1,303 -0.2% 777 0.0% -4,181 -0.1%
Employment (Pop 16+) 547,294 1,352,374 2,365,057
Armed Services 167 0.0% 392 0.0% 542 0.0%
Civilian 347,461 63.5% 848,509 62.7% 1,508,097 63.8%
Employed 332,380 60.7% 807,218 59.7% 1,430,837 60.5% 10 Min Drive 15 Min Drive 20 Min Drive
Unemployed 15,081 2.8% 41,291 3.1% 77,260 3.3%
Not in Labor Force 199,666 36.5% 503,473 37.2% 856,418 36.2%
Employed Population 332,380 807,218 1,430,837
White Collar 222,406 66.9% 500,522 62.0% 825,105 57.7%
Blue Collar 109,974 33.1% 306,696 38.0% 605,732 42.3%
0.0%
5.0%
10.0%
15.0%
20.0%
25.0%
30.0%
1 Person 2 People 3 People 4 to 6People
Household Size
56.0%
58.0%
60.0%
62.0%
64.0%
10 Min Drive 15 Min Drive 20 Min Drive
Civilian Employment
Employed Unemployed
©SDS, a division of x-span results, inc. Demographic data by PopStats.
All rights reserved. Page 3 of 4

Consumer Demographic Profile
Site: Euclid Ave and Mission St
Address: Euclid Ave and Mission St | San Marino CA
Date Report Created: 10/31/2019
# % # % # %
10 Min Drive 15 Min Drive 20 Min Drive
Employment By Occupation 332,380 807,218 1,430,837
White Collar 222,406 66.9% 500,522 62.0% 825,105 57.7%
Managerial executive 52,771 15.9% 112,432 13.9% 174,880 12.2%
Prof specialty 84,288 25.4% 183,013 22.7% 286,543 20.0%
Healthcare support 6,851 2.1% 15,578 1.9% 28,561 2.0%
Sales 33,572 10.1% 84,841 10.5% 151,663 10.6%
Office Admin 44,924 13.5% 104,658 13.0% 183,458 12.8%
Blue Collar 109,974 33.1% 306,696 38.0% 605,732 42.3%
Protective 5,306 1.6% 13,193 1.6% 23,310 1.6%
Food Prep Serving 21,611 6.5% 50,909 6.3% 98,781 6.9%
Bldg Maint/Cleaning 12,183 3.7% 33,649 4.2% 74,329 5.2%
Personal Care 18,138 5.5% 43,142 5.3% 77,602 5.4%
Farming/Fishing/Forestry 681 0.2% 2,726 0.3% 5,549 0.4%
Construction 20,686 6.2% 56,934 7.1% 111,102 7.8%
Production Transp 31,370 9.4% 106,143 13.1% 215,059 15.0%
Employment By Industry 332,380 807,218 1,430,837
Agri Mining Const 18,107 5.4% 50,349 6.2% 94,923 6.6%
Manufacturing 25,392 7.6% 78,964 9.8% 149,431 10.4%
Transportation 15,800 4.8% 39,798 4.9% 75,723 5.3%
Information 12,917 3.9% 32,764 4.1% 58,288 4.1%
Wholesale Retail 43,451 13.1% 116,194 14.4% 211,231 14.8%
Fin Insur Real Estate 22,511 6.8% 47,353 5.9% 76,365 5.3%
Professional Services 29,537 8.9% 64,581 8.0% 98,558 6.9%
Management Services 251 0.1% 479 0.1% 709 0.0%
Admin Waste Services 13,546 4.1% 34,766 4.3% 70,654 4.9%
Educational services 79,318 23.9% 171,296 21.2% 279,075 19.5%
Entertain services 38,535 11.6% 93,288 11.6% 175,841 12.3%
Other Prof services 20,361 6.1% 50,294 6.2% 99,235 6.9%
Public admin 12,656 3.8% 27,092 3.4% 40,804 2.9%
0.0%
5.0%
10.0%
15.0%
Industry Breakdown
0.0%
10.0%
20.0%
30.0%
Industry Breakdown Cont.
©SDS, a division of x-span results, inc. Demographic data by PopStats.
All rights reserved. Page 4 of 4
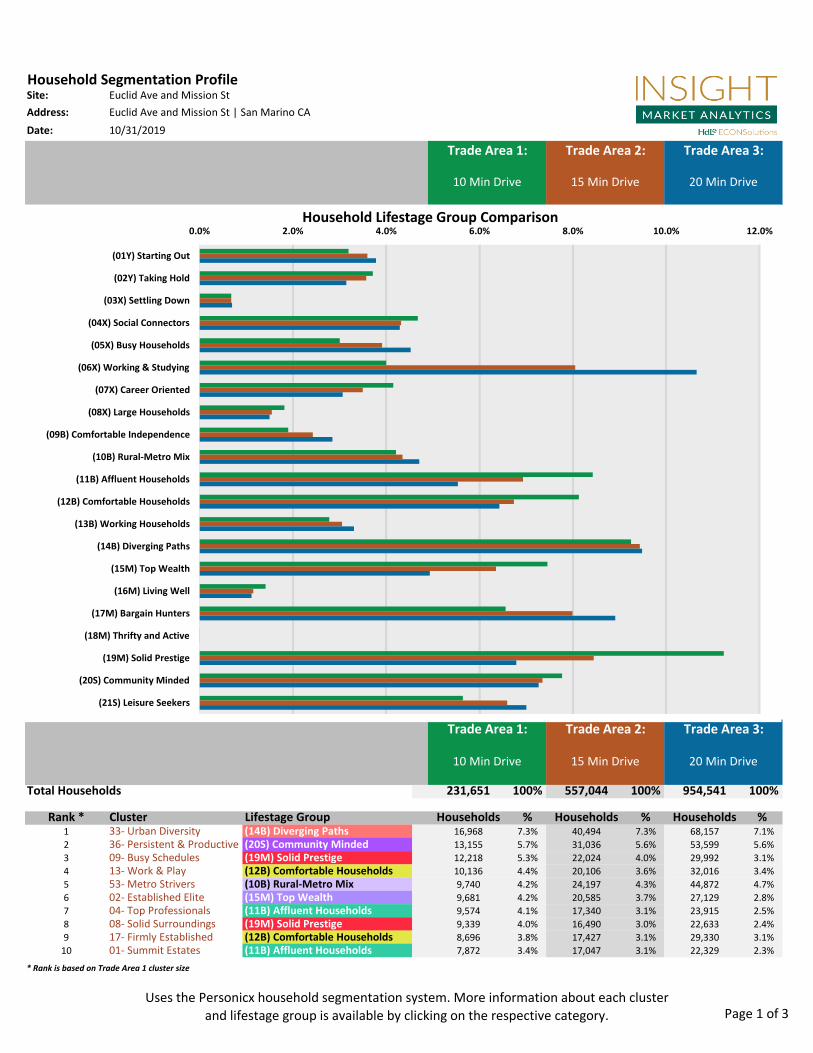
Site: Euclid Ave and Mission St
Address: Euclid Ave and Mission St | San Marino CA
Date: 10/31/2019
10 Min Drive 15 Min Drive 20 Min Drive
(01Y) Starting Out 3.2% 3.6% ##
(02Y) Taking Hold 3.7% 3.6% ##
(03X) Settling Down 0.7% 0.7% ##
(04X) Social Connectors 4.7% 4.3% ##
(05X) Busy Households 3.0% 3.9% ##
(06X) Working & Studying 4.0% 8.0% ##
(07X) Career Oriented 4.2% 3.5% ##
(08X) Large Households 1.8% 1.5% ##
(09B) Comfortable Independence 1.9% 2.4% ##
(10B) Rural-Metro Mix 4.2% 4.4% ##
(11B) Affluent Households 8.4% 6.9% ##
(12B) Comfortable Households 8.1% 6.7% ##
(13B) Working Households 2.8% 3.1% ##
(14B) Diverging Paths 9.2% 9.4% ##
(15M) Top Wealth 7.5% 6.4% ##
(16M) Living Well 1.4% 1.2% ##
(17M) Bargain Hunters 6.6% 8.0% ##
(18M) Thrifty and Active 0.0% 0.0% ##
(19M) Solid Prestige 11.2% 8.4% ##
(20S) Community Minded 7.8% 7.4% ##
(21S) Leisure Seekers 5.6% 6.6% ##
Total Households 231,651 100% 557,044 100% 954,541 100%
Rank * Cluster Lifestage Group Households % Households % Households % 1 33- Urban Diversity (14B) Diverging Paths 16,968 7.3% 40,494 7.3% 68,157 7.1%
2 36- Persistent & Productive (20S) Community Minded 13,155 5.7% 31,036 5.6% 53,599 5.6%
3 09- Busy Schedules (19M) Solid Prestige 12,218 5.3% 22,024 4.0% 29,992 3.1%
4 13- Work & Play (12B) Comfortable Households 10,136 4.4% 20,106 3.6% 32,016 3.4%
5 53- Metro Strivers (10B) Rural-Metro Mix 9,740 4.2% 24,197 4.3% 44,872 4.7%
6 02- Established Elite (15M) Top Wealth 9,681 4.2% 20,585 3.7% 27,129 2.8%
7 04- Top Professionals (11B) Affluent Households 9,574 4.1% 17,340 3.1% 23,915 2.5%
8 08- Solid Surroundings (19M) Solid Prestige 9,339 4.0% 16,490 3.0% 22,633 2.4%
9 17- Firmly Established (12B) Comfortable Households 8,696 3.8% 17,427 3.1% 29,330 3.1%
10 01- Summit Estates (11B) Affluent Households 7,872 3.4% 17,047 3.1% 22,329 2.3%
* Rank is based on Trade Area 1 cluster size
Household Segmentation Profile
Trade Area 1: Trade Area 2: Trade Area 3:
10 Min Drive 15 Min Drive 20 Min Drive
10 Min Drive 15 Min Drive 20 Min Drive
Trade Area 1: Trade Area 2: Trade Area 3:
0.0% 2.0% 4.0% 6.0% 8.0% 10.0% 12.0%
(01Y) Starting Out
(02Y) Taking Hold
(03X) Settling Down
(04X) Social Connectors
(05X) Busy Households
(06X) Working & Studying
(07X) Career Oriented
(08X) Large Households
(09B) Comfortable Independence
(10B) Rural-Metro Mix
(11B) Affluent Households
(12B) Comfortable Households
(13B) Working Households
(14B) Diverging Paths
(15M) Top Wealth
(16M) Living Well
(17M) Bargain Hunters
(18M) Thrifty and Active
(19M) Solid Prestige
(20S) Community Minded
(21S) Leisure Seekers
Household Lifestage Group Comparison
Uses the Personicx household segmentation system. More information about each cluster
and lifestage group is available by clicking on the respective category. Page 1 of 3
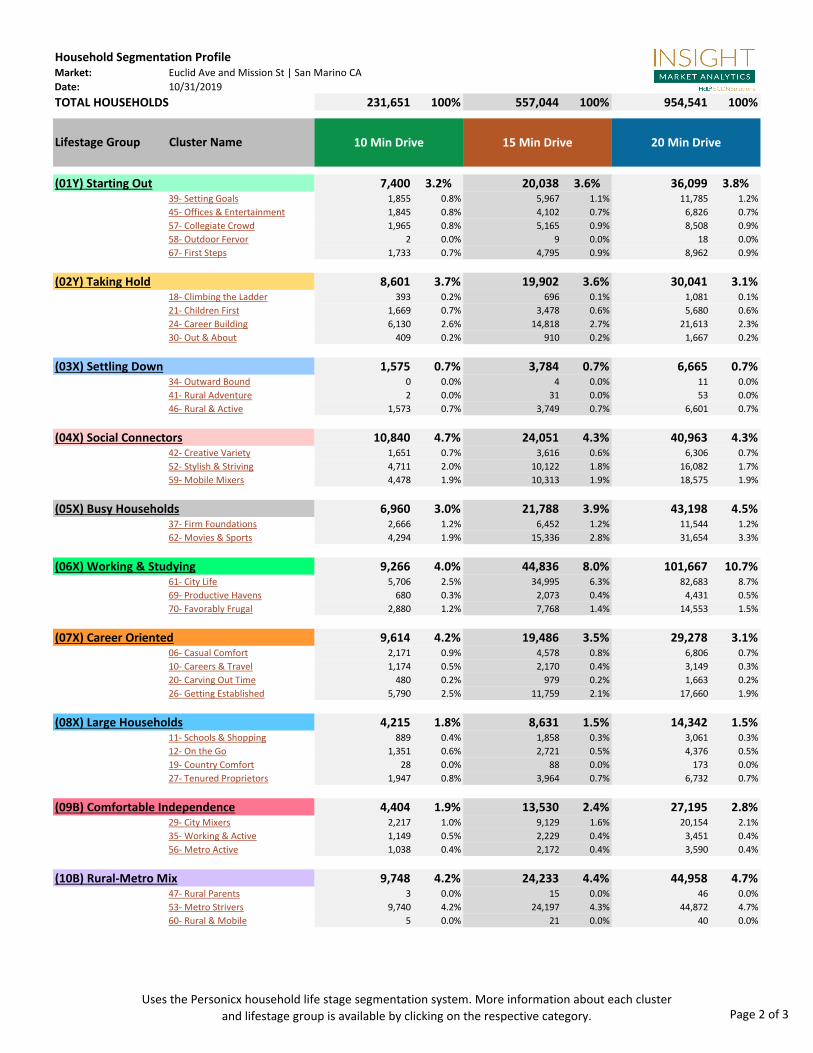
Household Segmentation ProfileMarket: Euclid Ave and Mission St | San Marino CA
Date: 10/31/2019
TOTAL HOUSEHOLDS 231,651 100% 557,044 100% 954,541 100%
Lifestage Group Cluster Name
7,400 3.2% 20,038 3.6% 36,099 3.8%39- Setting Goals 1,855 0.8% 5,967 1.1% 11,785 1.2%
45- Offices & Entertainment 1,845 0.8% 4,102 0.7% 6,826 0.7%
57- Collegiate Crowd 1,965 0.8% 5,165 0.9% 8,508 0.9%
58- Outdoor Fervor 2 0.0% 9 0.0% 18 0.0%
67- First Steps 1,733 0.7% 4,795 0.9% 8,962 0.9%
8,601 3.7% 19,902 3.6% 30,041 3.1%18- Climbing the Ladder 393 0.2% 696 0.1% 1,081 0.1%
21- Children First 1,669 0.7% 3,478 0.6% 5,680 0.6%
24- Career Building 6,130 2.6% 14,818 2.7% 21,613 2.3%
30- Out & About 409 0.2% 910 0.2% 1,667 0.2%
1,575 0.7% 3,784 0.7% 6,665 0.7%34- Outward Bound 0 0.0% 4 0.0% 11 0.0%
41- Rural Adventure 2 0.0% 31 0.0% 53 0.0%
46- Rural & Active 1,573 0.7% 3,749 0.7% 6,601 0.7%
10,840 4.7% 24,051 4.3% 40,963 4.3%42- Creative Variety 1,651 0.7% 3,616 0.6% 6,306 0.7%
52- Stylish & Striving 4,711 2.0% 10,122 1.8% 16,082 1.7%
59- Mobile Mixers 4,478 1.9% 10,313 1.9% 18,575 1.9%
6,960 3.0% 21,788 3.9% 43,198 4.5%37- Firm Foundations 2,666 1.2% 6,452 1.2% 11,544 1.2%
62- Movies & Sports 4,294 1.9% 15,336 2.8% 31,654 3.3%
9,266 4.0% 44,836 8.0% 101,667 10.7%61- City Life 5,706 2.5% 34,995 6.3% 82,683 8.7%
69- Productive Havens 680 0.3% 2,073 0.4% 4,431 0.5%
70- Favorably Frugal 2,880 1.2% 7,768 1.4% 14,553 1.5%
9,614 4.2% 19,486 3.5% 29,278 3.1%06- Casual Comfort 2,171 0.9% 4,578 0.8% 6,806 0.7%
10- Careers & Travel 1,174 0.5% 2,170 0.4% 3,149 0.3%
20- Carving Out Time 480 0.2% 979 0.2% 1,663 0.2%
26- Getting Established 5,790 2.5% 11,759 2.1% 17,660 1.9%
4,215 1.8% 8,631 1.5% 14,342 1.5%11- Schools & Shopping 889 0.4% 1,858 0.3% 3,061 0.3%
12- On the Go 1,351 0.6% 2,721 0.5% 4,376 0.5%
19- Country Comfort 28 0.0% 88 0.0% 173 0.0%
27- Tenured Proprietors 1,947 0.8% 3,964 0.7% 6,732 0.7%
4,404 1.9% 13,530 2.4% 27,195 2.8%29- City Mixers 2,217 1.0% 9,129 1.6% 20,154 2.1%
35- Working & Active 1,149 0.5% 2,229 0.4% 3,451 0.4%
56- Metro Active 1,038 0.4% 2,172 0.4% 3,590 0.4%
9,748 4.2% 24,233 4.4% 44,958 4.7%47- Rural Parents 3 0.0% 15 0.0% 46 0.0%
53- Metro Strivers 9,740 4.2% 24,197 4.3% 44,872 4.7%
60- Rural & Mobile 5 0.0% 21 0.0% 40 0.0%
10 Min Drive 15 Min Drive 20 Min Drive
(01Y) Starting Out
(02Y) Taking Hold
(03X) Settling Down
(04X) Social Connectors
(05X) Busy Households
(06X) Working & Studying
(07X) Career Oriented
(08X) Large Households
(09B) Comfortable Independence
(10B) Rural-Metro Mix
Uses the Personicx household life stage segmentation system. More information about each cluster
and lifestage group is available by clicking on the respective category. Page 2 of 3
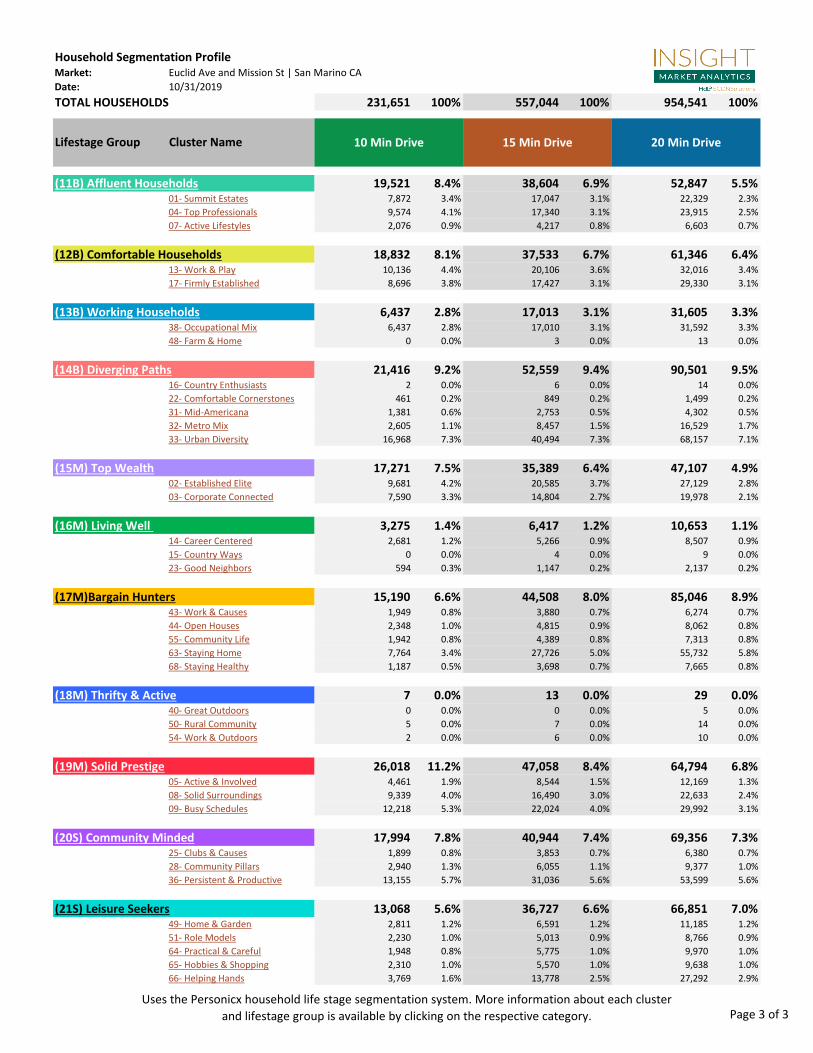
Household Segmentation ProfileMarket: Euclid Ave and Mission St | San Marino CA
Date: 10/31/2019
TOTAL HOUSEHOLDS 231,651 100% 557,044 100% 954,541 100%
Lifestage Group Cluster Name 10 Min Drive 15 Min Drive 20 Min Drive
19,521 8.4% 38,604 6.9% 52,847 5.5%01- Summit Estates 7,872 3.4% 17,047 3.1% 22,329 2.3%
04- Top Professionals 9,574 4.1% 17,340 3.1% 23,915 2.5%
07- Active Lifestyles 2,076 0.9% 4,217 0.8% 6,603 0.7%
18,832 8.1% 37,533 6.7% 61,346 6.4%13- Work & Play 10,136 4.4% 20,106 3.6% 32,016 3.4%
17- Firmly Established 8,696 3.8% 17,427 3.1% 29,330 3.1%
6,437 2.8% 17,013 3.1% 31,605 3.3%38- Occupational Mix 6,437 2.8% 17,010 3.1% 31,592 3.3%
48- Farm & Home 0 0.0% 3 0.0% 13 0.0%
21,416 9.2% 52,559 9.4% 90,501 9.5%16- Country Enthusiasts 2 0.0% 6 0.0% 14 0.0%
22- Comfortable Cornerstones 461 0.2% 849 0.2% 1,499 0.2%
31- Mid-Americana 1,381 0.6% 2,753 0.5% 4,302 0.5%
32- Metro Mix 2,605 1.1% 8,457 1.5% 16,529 1.7%
33- Urban Diversity 16,968 7.3% 40,494 7.3% 68,157 7.1%
17,271 7.5% 35,389 6.4% 47,107 4.9%02- Established Elite 9,681 4.2% 20,585 3.7% 27,129 2.8%
03- Corporate Connected 7,590 3.3% 14,804 2.7% 19,978 2.1%
3,275 1.4% 6,417 1.2% 10,653 1.1%14- Career Centered 2,681 1.2% 5,266 0.9% 8,507 0.9%
15- Country Ways 0 0.0% 4 0.0% 9 0.0%
23- Good Neighbors 594 0.3% 1,147 0.2% 2,137 0.2%
15,190 6.6% 44,508 8.0% 85,046 8.9%43- Work & Causes 1,949 0.8% 3,880 0.7% 6,274 0.7%
44- Open Houses 2,348 1.0% 4,815 0.9% 8,062 0.8%
55- Community Life 1,942 0.8% 4,389 0.8% 7,313 0.8%
63- Staying Home 7,764 3.4% 27,726 5.0% 55,732 5.8%
68- Staying Healthy 1,187 0.5% 3,698 0.7% 7,665 0.8%
7 0.0% 13 0.0% 29 0.0%40- Great Outdoors 0 0.0% 0 0.0% 5 0.0%
50- Rural Community 5 0.0% 7 0.0% 14 0.0%
54- Work & Outdoors 2 0.0% 6 0.0% 10 0.0%
26,018 11.2% 47,058 8.4% 64,794 6.8%05- Active & Involved 4,461 1.9% 8,544 1.5% 12,169 1.3%
08- Solid Surroundings 9,339 4.0% 16,490 3.0% 22,633 2.4%
09- Busy Schedules 12,218 5.3% 22,024 4.0% 29,992 3.1%
17,994 7.8% 40,944 7.4% 69,356 7.3%25- Clubs & Causes 1,899 0.8% 3,853 0.7% 6,380 0.7%
28- Community Pillars 2,940 1.3% 6,055 1.1% 9,377 1.0%
36- Persistent & Productive 13,155 5.7% 31,036 5.6% 53,599 5.6%
13,068 5.6% 36,727 6.6% 66,851 7.0%49- Home & Garden 2,811 1.2% 6,591 1.2% 11,185 1.2%
51- Role Models 2,230 1.0% 5,013 0.9% 8,766 0.9%
64- Practical & Careful 1,948 0.8% 5,775 1.0% 9,970 1.0%
65- Hobbies & Shopping 2,310 1.0% 5,570 1.0% 9,638 1.0%
66- Helping Hands 3,769 1.6% 13,778 2.5% 27,292 2.9%
(11B) Affluent Households
(12B) Comfortable Households
(13B) Working Households
(14B) Diverging Paths
(15M) Top Wealth
(20S) Community Minded
(21S) Leisure Seekers
(16M) Living Well
(17M)Bargain Hunters
(18M) Thrifty & Active
(19M) Solid Prestige
Uses the Personicx household life stage segmentation system. More information about each cluster
and lifestage group is available by clicking on the respective category. Page 3 of 3
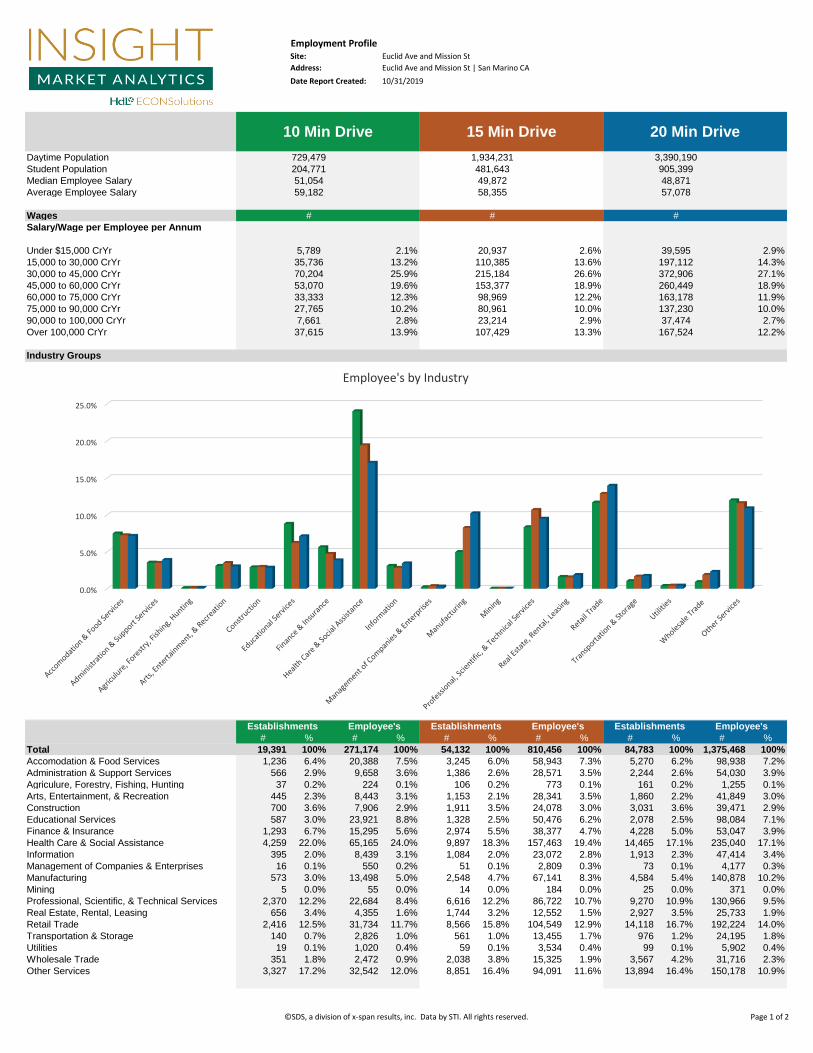
Employment ProfileSite: Euclid Ave and Mission St
Address: Euclid Ave and Mission St | San Marino CA
Date Report Created:
Daytime Population
Student Population
Median Employee Salary
Average Employee Salary
Wages
Salary/Wage per Employee per Annum
Under $15,000 CrYr 2.1% 2.6% 2.9%
15,000 to 30,000 CrYr 13.2% 13.6% 14.3%
30,000 to 45,000 CrYr 25.9% 26.6% 27.1%
45,000 to 60,000 CrYr 19.6% 18.9% 18.9%
60,000 to 75,000 CrYr 12.3% 12.2% 11.9%
75,000 to 90,000 CrYr 10.2% 10.0% 10.0%
90,000 to 100,000 CrYr 2.8% 2.9% 2.7%
Over 100,000 CrYr 13.9% 13.3% 12.2%
Industry Groups
# % # % # % # % # % # %
Total 19,391 100% 271,174 100% 54,132 100% 810,456 100% 84,783 100% 1,375,468 100%
Accomodation & Food Services 1,236 6.4% 20,388 7.5% 3,245 6.0% 58,943 7.3% 5,270 6.2% 98,938 7.2%
Administration & Support Services 566 2.9% 9,658 3.6% 1,386 2.6% 28,571 3.5% 2,244 2.6% 54,030 3.9%
Agriculure, Forestry, Fishing, Hunting 37 0.2% 224 0.1% 106 0.2% 773 0.1% 161 0.2% 1,255 0.1%
Arts, Entertainment, & Recreation 445 2.3% 8,443 3.1% 1,153 2.1% 28,341 3.5% 1,860 2.2% 41,849 3.0%
Construction 700 3.6% 7,906 2.9% 1,911 3.5% 24,078 3.0% 3,031 3.6% 39,471 2.9%
Educational Services 587 3.0% 23,921 8.8% 1,328 2.5% 50,476 6.2% 2,078 2.5% 98,084 7.1%
Finance & Insurance 1,293 6.7% 15,295 5.6% 2,974 5.5% 38,377 4.7% 4,228 5.0% 53,047 3.9%
Health Care & Social Assistance 4,259 22.0% 65,165 24.0% 9,897 18.3% 157,463 19.4% 14,465 17.1% 235,040 17.1%
Information 395 2.0% 8,439 3.1% 1,084 2.0% 23,072 2.8% 1,913 2.3% 47,414 3.4%
Management of Companies & Enterprises 16 0.1% 550 0.2% 51 0.1% 2,809 0.3% 73 0.1% 4,177 0.3%
Manufacturing 573 3.0% 13,498 5.0% 2,548 4.7% 67,141 8.3% 4,584 5.4% 140,878 10.2%
Mining 5 0.0% 55 0.0% 14 0.0% 184 0.0% 25 0.0% 371 0.0%
Professional, Scientific, & Technical Services 2,370 12.2% 22,684 8.4% 6,616 12.2% 86,722 10.7% 9,270 10.9% 130,966 9.5%
Real Estate, Rental, Leasing 656 3.4% 4,355 1.6% 1,744 3.2% 12,552 1.5% 2,927 3.5% 25,733 1.9%
Retail Trade 2,416 12.5% 31,734 11.7% 8,566 15.8% 104,549 12.9% 14,118 16.7% 192,224 14.0%
Transportation & Storage 140 0.7% 2,826 1.0% 561 1.0% 13,455 1.7% 976 1.2% 24,195 1.8%
Utilities 19 0.1% 1,020 0.4% 59 0.1% 3,534 0.4% 99 0.1% 5,902 0.4%
Wholesale Trade 351 1.8% 2,472 0.9% 2,038 3.8% 15,325 1.9% 3,567 4.2% 31,716 2.3%
Other Services 3,327 17.2% 32,542 12.0% 8,851 16.4% 94,091 11.6% 13,894 16.4% 150,178 10.9%
7,661 37,474
37,615 167,524
80,961
23,214
107,429
# # #
27,765 137,230
5,789 39,595
Establishments Employee'sEstablishments Employee's Establishments
372,906
53,070 260,449
33,333 163,178
215,184
153,377
98,969
35,736 197,112
20,937
110,385
70,204
51,054 48,871
58,355
Employee's
204,771 905,399
1,934,231
481,643
49,872
59,182 57,078
10 Min Drive 20 Min Drive15 Min Drive
10/31/2019
729,479 3,390,190
0.0%
5.0%
10.0%
15.0%
20.0%
25.0%
Employee's by Industry
©SDS, a division of x-span results, inc. Data by STI. All rights reserved. Page 1 of 2
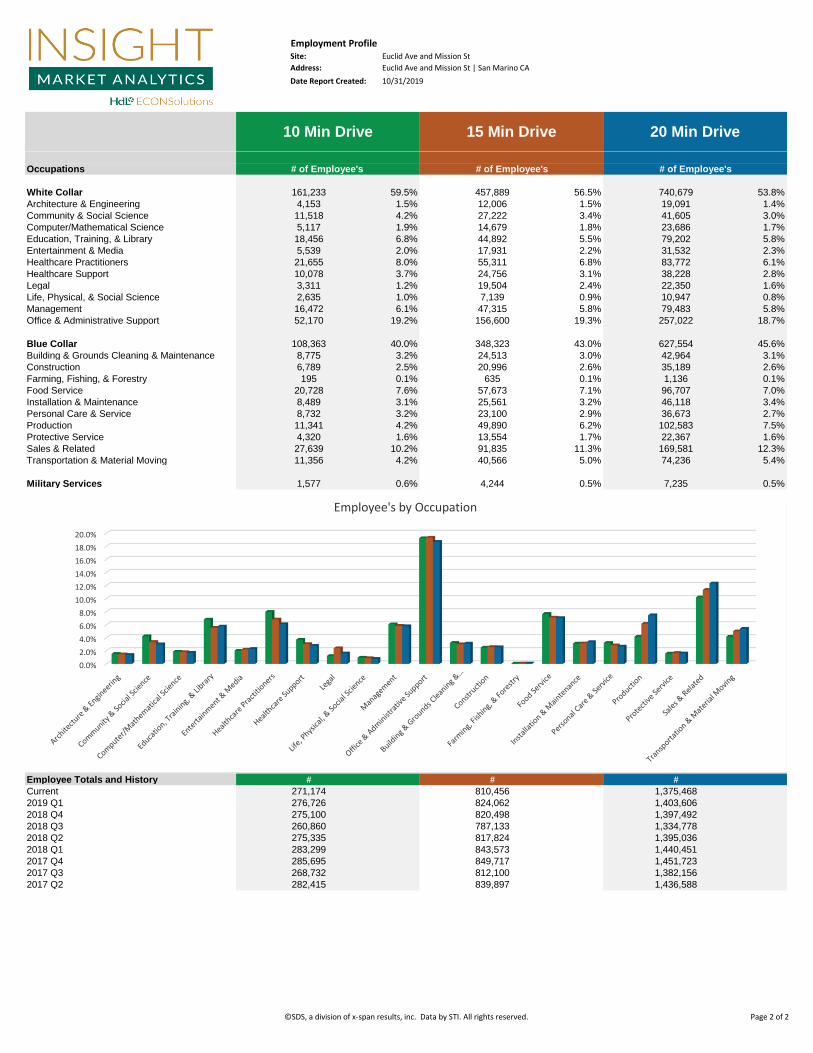
Employment ProfileSite: Euclid Ave and Mission St
Address: Euclid Ave and Mission St | San Marino CA
Date Report Created:
10 Min Drive 20 Min Drive15 Min Drive
10/31/2019
Occupations
White Collar 59.5% 56.5% 53.8%
Architecture & Engineering 1.5% 1.5% 1.4%
Community & Social Science 4.2% 3.4% 3.0%
Computer/Mathematical Science 1.9% 1.8% 1.7%
Education, Training, & Library 6.8% 5.5% 5.8%
Entertainment & Media 2.0% 2.2% 2.3%
Healthcare Practitioners 8.0% 6.8% 6.1%
Healthcare Support 3.7% 3.1% 2.8%
Legal 1.2% 2.4% 1.6%
Life, Physical, & Social Science 1.0% 0.9% 0.8%
Management 6.1% 5.8% 5.8%
Office & Administrative Support 19.2% 19.3% 18.7%
Blue Collar 40.0% 43.0% 45.6%
Building & Grounds Cleaning & Maintenance 3.2% 3.0% 3.1%
Construction 2.5% 2.6% 2.6%
Farming, Fishing, & Forestry 0.1% 0.1% 0.1%
Food Service 7.6% 7.1% 7.0%
Installation & Maintenance 3.1% 3.2% 3.4%
Personal Care & Service 3.2% 2.9% 2.7%
Production 4.2% 6.2% 7.5%
Protective Service 1.6% 1.7% 1.6%
Sales & Related 10.2% 11.3% 12.3%
Transportation & Material Moving 4.2% 5.0% 5.4%
Military Services 0.6% 0.5% 0.5%
Employee Totals and History
Current
2019 Q1
2018 Q4
2018 Q3
2018 Q2
2018 Q1
2017 Q4
2017 Q3
2017 Q2
# of Employee's
8,732 36,673
11,341
# # #
7,2354,244
49,890
457,889
156,600
23,100
20,728
8,489
52,170 257,022
1,577
102,583
4,320 22,367
27,639 169,581
11,356 74,236
20,996
635
57,673
25,561
91,835
40,566
96,707
46,118
13,554
8,775 42,964
6,789 35,189
195 1,136
24,513
2,635 10,947
16,472 79,483
108,363 627,554
7,139
47,315
348,323
21,655 83,772
10,078 38,228
3,311 22,350
55,311
24,756
19,504
18,456 79,202
5,539 31,532
14,679
44,892
17,931
19,091
11,518 41,605
12,006
27,222
5,117 23,686
817,824
268,732 1,382,156
282,415 1,436,588
843,573
849,717
812,100
839,897
275,335 1,395,036
283,299 1,440,451
285,695 1,451,723
740,679
276,726 1,403,606
275,100 1,397,492
260,860 1,334,778
824,062
820,498
4,153
810,456
# of Employee's # of Employee's
161,233
787,133
271,174 1,375,468
0.0%
2.0%
4.0%
6.0%
8.0%
10.0%
12.0%
14.0%
16.0%
18.0%
20.0%
Employee's by Occupation
©SDS, a division of x-span results, inc. Data by STI. All rights reserved. Page 2 of 2
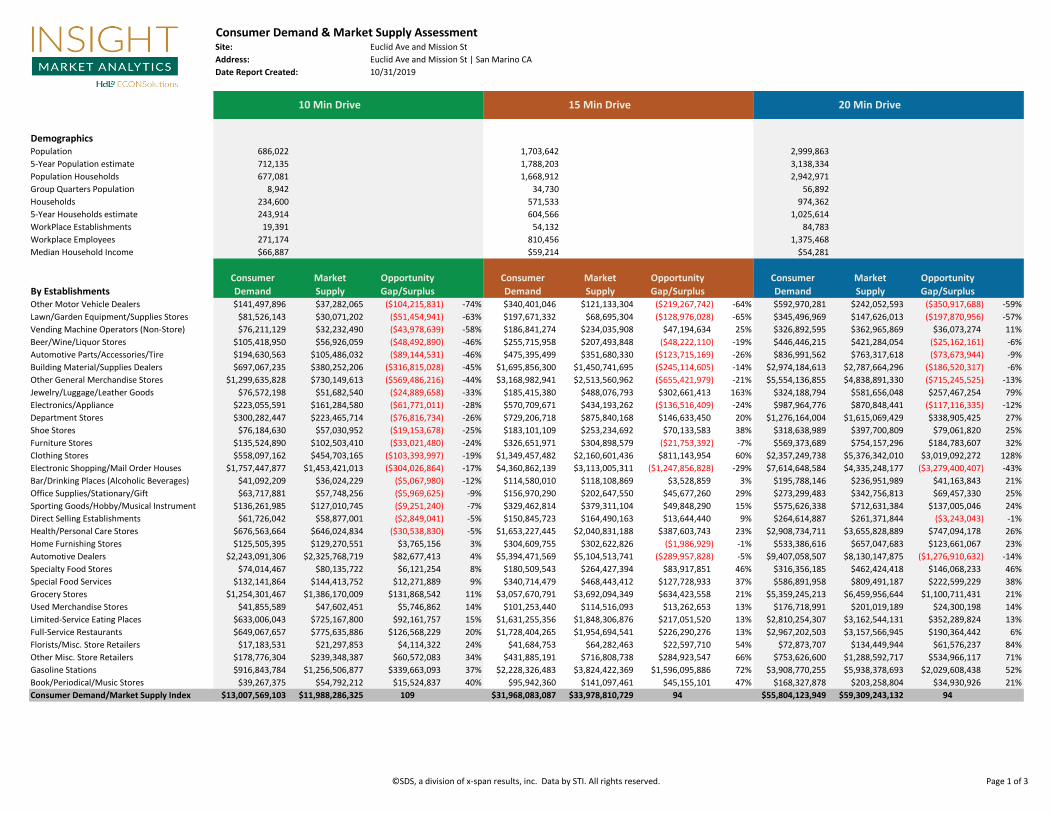
Consumer Demand & Market Supply AssessmentSite: Euclid Ave and Mission St
Address: Euclid Ave and Mission St | San Marino CA
Date Report Created: 10/31/2019
DemographicsPopulation 686,022 1,703,642 2,999,863
5-Year Population estimate 712,135 1,788,203 3,138,334
Population Households 677,081 1,668,912 2,942,971
Group Quarters Population 8,942 34,730 56,892
Households 234,600 571,533 974,362
5-Year Households estimate 243,914 604,566 1,025,614
WorkPlace Establishments 19,391 54,132 84,783
Workplace Employees 271,174 810,456 1,375,468
Median Household Income $66,887 $59,214 $54,281
Consumer Market Opportunity Consumer Market Opportunity Consumer Market Opportunity
By Establishments Demand Supply Gap/Surplus Demand Supply Gap/Surplus Demand Supply Gap/SurplusOther Motor Vehicle Dealers $141,497,896 $37,282,065 ($104,215,831) -74% $340,401,046 $121,133,304 ($219,267,742) -64% $592,970,281 $242,052,593 ($350,917,688) -59%
Lawn/Garden Equipment/Supplies Stores $81,526,143 $30,071,202 ($51,454,941) -63% $197,671,332 $68,695,304 ($128,976,028) -65% $345,496,969 $147,626,013 ($197,870,956) -57%
Vending Machine Operators (Non-Store) $76,211,129 $32,232,490 ($43,978,639) -58% $186,841,274 $234,035,908 $47,194,634 25% $326,892,595 $362,965,869 $36,073,274 11%
Beer/Wine/Liquor Stores $105,418,950 $56,926,059 ($48,492,890) -46% $255,715,958 $207,493,848 ($48,222,110) -19% $446,446,215 $421,284,054 ($25,162,161) -6%
Automotive Parts/Accessories/Tire $194,630,563 $105,486,032 ($89,144,531) -46% $475,395,499 $351,680,330 ($123,715,169) -26% $836,991,562 $763,317,618 ($73,673,944) -9%
Building Material/Supplies Dealers $697,067,235 $380,252,206 ($316,815,028) -45% $1,695,856,300 $1,450,741,695 ($245,114,605) -14% $2,974,184,613 $2,787,664,296 ($186,520,317) -6%
Other General Merchandise Stores $1,299,635,828 $730,149,613 ($569,486,216) -44% $3,168,982,941 $2,513,560,962 ($655,421,979) -21% $5,554,136,855 $4,838,891,330 ($715,245,525) -13%
Jewelry/Luggage/Leather Goods $76,572,198 $51,682,540 ($24,889,658) -33% $185,415,380 $488,076,793 $302,661,413 163% $324,188,794 $581,656,048 $257,467,254 79%
Electronics/Appliance $223,055,591 $161,284,580 ($61,771,011) -28% $570,709,671 $434,193,262 ($136,516,409) -24% $987,964,776 $870,848,441 ($117,116,335) -12%
Department Stores $300,282,447 $223,465,714 ($76,816,734) -26% $729,206,718 $875,840,168 $146,633,450 20% $1,276,164,004 $1,615,069,429 $338,905,425 27%
Shoe Stores $76,184,630 $57,030,952 ($19,153,678) -25% $183,101,109 $253,234,692 $70,133,583 38% $318,638,989 $397,700,809 $79,061,820 25%
Furniture Stores $135,524,890 $102,503,410 ($33,021,480) -24% $326,651,971 $304,898,579 ($21,753,392) -7% $569,373,689 $754,157,296 $184,783,607 32%
Clothing Stores $558,097,162 $454,703,165 ($103,393,997) -19% $1,349,457,482 $2,160,601,436 $811,143,954 60% $2,357,249,738 $5,376,342,010 $3,019,092,272 128%
Electronic Shopping/Mail Order Houses $1,757,447,877 $1,453,421,013 ($304,026,864) -17% $4,360,862,139 $3,113,005,311 ($1,247,856,828) -29% $7,614,648,584 $4,335,248,177 ($3,279,400,407) -43%
Bar/Drinking Places (Alcoholic Beverages) $41,092,209 $36,024,229 ($5,067,980) -12% $114,580,010 $118,108,869 $3,528,859 3% $195,788,146 $236,951,989 $41,163,843 21%
Office Supplies/Stationary/Gift $63,717,881 $57,748,256 ($5,969,625) -9% $156,970,290 $202,647,550 $45,677,260 29% $273,299,483 $342,756,813 $69,457,330 25%
Sporting Goods/Hobby/Musical Instrument $136,261,985 $127,010,745 ($9,251,240) -7% $329,462,814 $379,311,104 $49,848,290 15% $575,626,338 $712,631,384 $137,005,046 24%
Direct Selling Establishments $61,726,042 $58,877,001 ($2,849,041) -5% $150,845,723 $164,490,163 $13,644,440 9% $264,614,887 $261,371,844 ($3,243,043) -1%
Health/Personal Care Stores $676,563,664 $646,024,834 ($30,538,830) -5% $1,653,227,445 $2,040,831,188 $387,603,743 23% $2,908,734,711 $3,655,828,889 $747,094,178 26%
Home Furnishing Stores $125,505,395 $129,270,551 $3,765,156 3% $304,609,755 $302,622,826 ($1,986,929) -1% $533,386,616 $657,047,683 $123,661,067 23%
Automotive Dealers $2,243,091,306 $2,325,768,719 $82,677,413 4% $5,394,471,569 $5,104,513,741 ($289,957,828) -5% $9,407,058,507 $8,130,147,875 ($1,276,910,632) -14%
Specialty Food Stores $74,014,467 $80,135,722 $6,121,254 8% $180,509,543 $264,427,394 $83,917,851 46% $316,356,185 $462,424,418 $146,068,233 46%
Special Food Services $132,141,864 $144,413,752 $12,271,889 9% $340,714,479 $468,443,412 $127,728,933 37% $586,891,958 $809,491,187 $222,599,229 38%
Grocery Stores $1,254,301,467 $1,386,170,009 $131,868,542 11% $3,057,670,791 $3,692,094,349 $634,423,558 21% $5,359,245,213 $6,459,956,644 $1,100,711,431 21%
Used Merchandise Stores $41,855,589 $47,602,451 $5,746,862 14% $101,253,440 $114,516,093 $13,262,653 13% $176,718,991 $201,019,189 $24,300,198 14%
Limited-Service Eating Places $633,006,043 $725,167,800 $92,161,757 15% $1,631,255,356 $1,848,306,876 $217,051,520 13% $2,810,254,307 $3,162,544,131 $352,289,824 13%
Full-Service Restaurants $649,067,657 $775,635,886 $126,568,229 20% $1,728,404,265 $1,954,694,541 $226,290,276 13% $2,967,202,503 $3,157,566,945 $190,364,442 6%
Florists/Misc. Store Retailers $17,183,531 $21,297,853 $4,114,322 24% $41,684,753 $64,282,463 $22,597,710 54% $72,873,707 $134,449,944 $61,576,237 84%
Other Misc. Store Retailers $178,776,304 $239,348,387 $60,572,083 34% $431,885,191 $716,808,738 $284,923,547 66% $753,626,600 $1,288,592,717 $534,966,117 71%
Gasoline Stations $916,843,784 $1,256,506,877 $339,663,093 37% $2,228,326,483 $3,824,422,369 $1,596,095,886 72% $3,908,770,255 $5,938,378,693 $2,029,608,438 52%
Book/Periodical/Music Stores $39,267,375 $54,792,212 $15,524,837 40% $95,942,360 $141,097,461 $45,155,101 47% $168,327,878 $203,258,804 $34,930,926 21%
Consumer Demand/Market Supply Index $13,007,569,103 $11,988,286,325 109 $31,968,083,087 $33,978,810,729 94 $55,804,123,949 $59,309,243,132 94
10 Min Drive 15 Min Drive 20 Min Drive
©SDS, a division of x-span results, inc. Data by STI. All rights reserved. Page 1 of 3
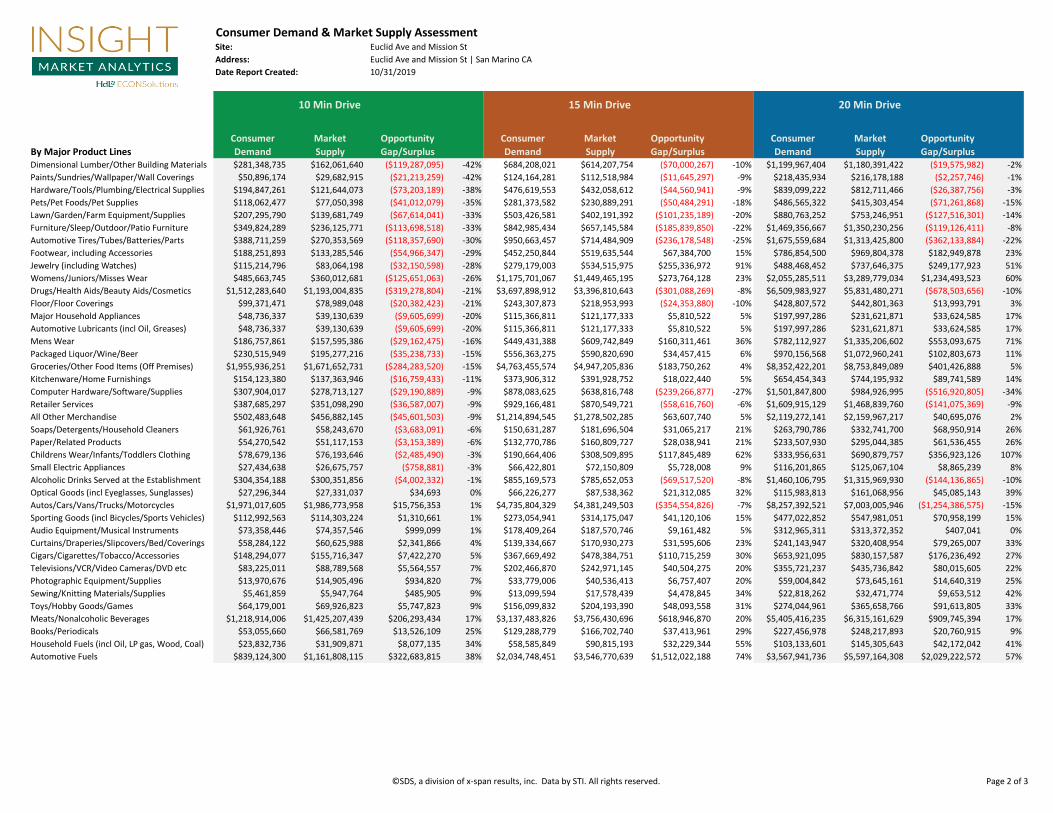
Consumer Demand & Market Supply AssessmentSite: Euclid Ave and Mission St
Address: Euclid Ave and Mission St | San Marino CA
Date Report Created: 10/31/2019
10 Min Drive 15 Min Drive 20 Min Drive
Consumer Market Opportunity Consumer Market Opportunity Consumer Market Opportunity
By Major Product Lines Demand Supply Gap/Surplus Demand Supply Gap/Surplus Demand Supply Gap/SurplusDimensional Lumber/Other Building Materials $281,348,735 $162,061,640 ($119,287,095) -42% $684,208,021 $614,207,754 ($70,000,267) -10% $1,199,967,404 $1,180,391,422 ($19,575,982) -2%
Paints/Sundries/Wallpaper/Wall Coverings $50,896,174 $29,682,915 ($21,213,259) -42% $124,164,281 $112,518,984 ($11,645,297) -9% $218,435,934 $216,178,188 ($2,257,746) -1%
Hardware/Tools/Plumbing/Electrical Supplies $194,847,261 $121,644,073 ($73,203,189) -38% $476,619,553 $432,058,612 ($44,560,941) -9% $839,099,222 $812,711,466 ($26,387,756) -3%
Pets/Pet Foods/Pet Supplies $118,062,477 $77,050,398 ($41,012,079) -35% $281,373,582 $230,889,291 ($50,484,291) -18% $486,565,322 $415,303,454 ($71,261,868) -15%
Lawn/Garden/Farm Equipment/Supplies $207,295,790 $139,681,749 ($67,614,041) -33% $503,426,581 $402,191,392 ($101,235,189) -20% $880,763,252 $753,246,951 ($127,516,301) -14%
Furniture/Sleep/Outdoor/Patio Furniture $349,824,289 $236,125,771 ($113,698,518) -33% $842,985,434 $657,145,584 ($185,839,850) -22% $1,469,356,667 $1,350,230,256 ($119,126,411) -8%
Automotive Tires/Tubes/Batteries/Parts $388,711,259 $270,353,569 ($118,357,690) -30% $950,663,457 $714,484,909 ($236,178,548) -25% $1,675,559,684 $1,313,425,800 ($362,133,884) -22%
Footwear, including Accessories $188,251,893 $133,285,546 ($54,966,347) -29% $452,250,844 $519,635,544 $67,384,700 15% $786,854,500 $969,804,378 $182,949,878 23%
Jewelry (including Watches) $115,214,796 $83,064,198 ($32,150,598) -28% $279,179,003 $534,515,975 $255,336,972 91% $488,468,452 $737,646,375 $249,177,923 51%
Womens/Juniors/Misses Wear $485,663,745 $360,012,681 ($125,651,063) -26% $1,175,701,067 $1,449,465,195 $273,764,128 23% $2,055,285,511 $3,289,779,034 $1,234,493,523 60%
Drugs/Health Aids/Beauty Aids/Cosmetics $1,512,283,640 $1,193,004,835 ($319,278,804) -21% $3,697,898,912 $3,396,810,643 ($301,088,269) -8% $6,509,983,927 $5,831,480,271 ($678,503,656) -10%
Floor/Floor Coverings $99,371,471 $78,989,048 ($20,382,423) -21% $243,307,873 $218,953,993 ($24,353,880) -10% $428,807,572 $442,801,363 $13,993,791 3%
Major Household Appliances $48,736,337 $39,130,639 ($9,605,699) -20% $115,366,811 $121,177,333 $5,810,522 5% $197,997,286 $231,621,871 $33,624,585 17%
Automotive Lubricants (incl Oil, Greases) $48,736,337 $39,130,639 ($9,605,699) -20% $115,366,811 $121,177,333 $5,810,522 5% $197,997,286 $231,621,871 $33,624,585 17%
Mens Wear $186,757,861 $157,595,386 ($29,162,475) -16% $449,431,388 $609,742,849 $160,311,461 36% $782,112,927 $1,335,206,602 $553,093,675 71%
Packaged Liquor/Wine/Beer $230,515,949 $195,277,216 ($35,238,733) -15% $556,363,275 $590,820,690 $34,457,415 6% $970,156,568 $1,072,960,241 $102,803,673 11%
Groceries/Other Food Items (Off Premises) $1,955,936,251 $1,671,652,731 ($284,283,520) -15% $4,763,455,574 $4,947,205,836 $183,750,262 4% $8,352,422,201 $8,753,849,089 $401,426,888 5%
Kitchenware/Home Furnishings $154,123,380 $137,363,946 ($16,759,433) -11% $373,906,312 $391,928,752 $18,022,440 5% $654,454,343 $744,195,932 $89,741,589 14%
Computer Hardware/Software/Supplies $307,904,017 $278,713,127 ($29,190,889) -9% $878,083,625 $638,816,748 ($239,266,877) -27% $1,501,847,800 $984,926,995 ($516,920,805) -34%
Retailer Services $387,685,297 $351,098,290 ($36,587,007) -9% $929,166,481 $870,549,721 ($58,616,760) -6% $1,609,915,129 $1,468,839,760 ($141,075,369) -9%
All Other Merchandise $502,483,648 $456,882,145 ($45,601,503) -9% $1,214,894,545 $1,278,502,285 $63,607,740 5% $2,119,272,141 $2,159,967,217 $40,695,076 2%
Soaps/Detergents/Household Cleaners $61,926,761 $58,243,670 ($3,683,091) -6% $150,631,287 $181,696,504 $31,065,217 21% $263,790,786 $332,741,700 $68,950,914 26%
Paper/Related Products $54,270,542 $51,117,153 ($3,153,389) -6% $132,770,786 $160,809,727 $28,038,941 21% $233,507,930 $295,044,385 $61,536,455 26%
Childrens Wear/Infants/Toddlers Clothing $78,679,136 $76,193,646 ($2,485,490) -3% $190,664,406 $308,509,895 $117,845,489 62% $333,956,631 $690,879,757 $356,923,126 107%
Small Electric Appliances $27,434,638 $26,675,757 ($758,881) -3% $66,422,801 $72,150,809 $5,728,008 9% $116,201,865 $125,067,104 $8,865,239 8%
Alcoholic Drinks Served at the Establishment $304,354,188 $300,351,856 ($4,002,332) -1% $855,169,573 $785,652,053 ($69,517,520) -8% $1,460,106,795 $1,315,969,930 ($144,136,865) -10%
Optical Goods (incl Eyeglasses, Sunglasses) $27,296,344 $27,331,037 $34,693 0% $66,226,277 $87,538,362 $21,312,085 32% $115,983,813 $161,068,956 $45,085,143 39%
Autos/Cars/Vans/Trucks/Motorcycles $1,971,017,605 $1,986,773,958 $15,756,353 1% $4,735,804,329 $4,381,249,503 ($354,554,826) -7% $8,257,392,521 $7,003,005,946 ($1,254,386,575) -15%
Sporting Goods (incl Bicycles/Sports Vehicles) $112,992,563 $114,303,224 $1,310,661 1% $273,054,941 $314,175,047 $41,120,106 15% $477,022,852 $547,981,051 $70,958,199 15%
Audio Equipment/Musical Instruments $73,358,446 $74,357,546 $999,099 1% $178,409,264 $187,570,746 $9,161,482 5% $312,965,311 $313,372,352 $407,041 0%
Curtains/Draperies/Slipcovers/Bed/Coverings $58,284,122 $60,625,988 $2,341,866 4% $139,334,667 $170,930,273 $31,595,606 23% $241,143,947 $320,408,954 $79,265,007 33%
Cigars/Cigarettes/Tobacco/Accessories $148,294,077 $155,716,347 $7,422,270 5% $367,669,492 $478,384,751 $110,715,259 30% $653,921,095 $830,157,587 $176,236,492 27%
Televisions/VCR/Video Cameras/DVD etc $83,225,011 $88,789,568 $5,564,557 7% $202,466,870 $242,971,145 $40,504,275 20% $355,721,237 $435,736,842 $80,015,605 22%
Photographic Equipment/Supplies $13,970,676 $14,905,496 $934,820 7% $33,779,006 $40,536,413 $6,757,407 20% $59,004,842 $73,645,161 $14,640,319 25%
Sewing/Knitting Materials/Supplies $5,461,859 $5,947,764 $485,905 9% $13,099,594 $17,578,439 $4,478,845 34% $22,818,262 $32,471,774 $9,653,512 42%
Toys/Hobby Goods/Games $64,179,001 $69,926,823 $5,747,823 9% $156,099,832 $204,193,390 $48,093,558 31% $274,044,961 $365,658,766 $91,613,805 33%
Meats/Nonalcoholic Beverages $1,218,914,006 $1,425,207,439 $206,293,434 17% $3,137,483,826 $3,756,430,696 $618,946,870 20% $5,405,416,235 $6,315,161,629 $909,745,394 17%
Books/Periodicals $53,055,660 $66,581,769 $13,526,109 25% $129,288,779 $166,702,740 $37,413,961 29% $227,456,978 $248,217,893 $20,760,915 9%
Household Fuels (incl Oil, LP gas, Wood, Coal) $23,832,736 $31,909,871 $8,077,135 34% $58,585,849 $90,815,193 $32,229,344 55% $103,133,601 $145,305,643 $42,172,042 41%
Automotive Fuels $839,124,300 $1,161,808,115 $322,683,815 38% $2,034,748,451 $3,546,770,639 $1,512,022,188 74% $3,567,941,736 $5,597,164,308 $2,029,222,572 57%
©SDS, a division of x-span results, inc. Data by STI. All rights reserved. Page 2 of 3
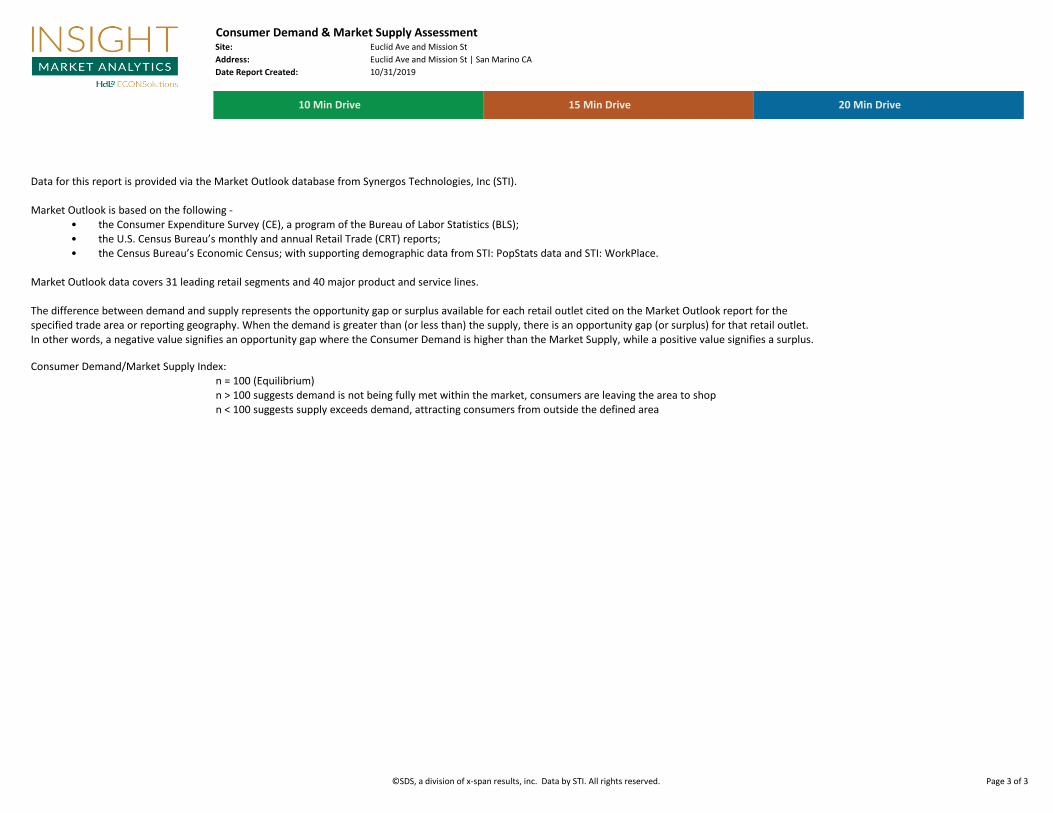
Consumer Demand & Market Supply AssessmentSite: Euclid Ave and Mission St
Address: Euclid Ave and Mission St | San Marino CA
Date Report Created: 10/31/2019
10 Min Drive 15 Min Drive 20 Min Drive
Data for this report is provided via the Market Outlook database from Synergos Technologies, Inc (STI).
Market Outlook is based on the following -• the Consumer Expenditure Survey (CE), a program of the Bureau of Labor Statistics (BLS); • the U.S. Census Bureau’s monthly and annual Retail Trade (CRT) reports; • the Census Bureau’s Economic Census; with supporting demographic data from STI: PopStats data and STI: WorkPlace.
Market Outlook data covers 31 leading retail segments and 40 major product and service lines.
The difference between demand and supply represents the opportunity gap or surplus available for each retail outlet cited on the Market Outlook report for the specified trade area or reporting geography. When the demand is greater than (or less than) the supply, there is an opportunity gap (or surplus) for that retail outlet. In other words, a negative value signifies an opportunity gap where the Consumer Demand is higher than the Market Supply, while a positive value signifies a surplus.
Consumer Demand/Market Supply Index: n = 100 (Equilibrium)n > 100 suggests demand is not being fully met within the market, consumers are leaving the area to shopn < 100 suggests supply exceeds demand, attracting consumers from outside the defined area
©SDS, a division of x-span results, inc. Data by STI. All rights reserved. Page 3 of 3
Related Documents