The Housing Delivery Test Workshop slides November 2017 www.local.gov.uk/pas

Welcome message from author
This document is posted to help you gain knowledge. Please leave a comment to let me know what you think about it! Share it to your friends and learn new things together.
Transcript

The Housing Delivery Test
Workshop slides
November 2017 www.local.gov.uk/pas

A note on these slides
• These slides were used as part of a series of
workshops we did in November and
December 2017
• They explored the housing delivery test as we
understood it then
• They will be out of date very soon!

Today
1. Introductions
2. Context
3. The Housing Delivery Test
4. Root Cause Analysis
5. Action Plans
6. Reflections
7. Volunteers ?

1. Introductions

2. Context
• Housing Delivery Test introduced in the
Housing White Paper
• “… where the number of homes being built is
below expectations, the new housing delivery
test will ensure that action is taken.”
2. Context (HWP contd)
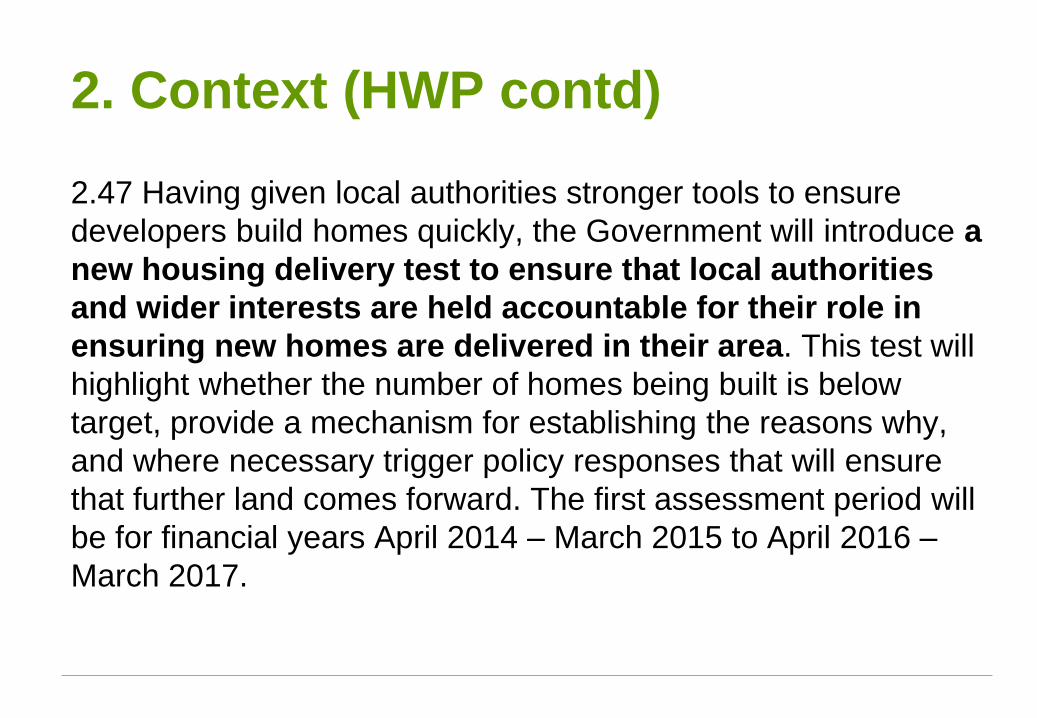
2.47 Having given local authorities stronger tools to ensure
developers build homes quickly, the Government will introduce a
new housing delivery test to ensure that local authorities
and wider interests are held accountable for their role in
ensuring new homes are delivered in their area. This test will
highlight whether the number of homes being built is below
target, provide a mechanism for establishing the reasons why,
and where necessary trigger policy responses that will ensure
that further land comes forward. The first assessment period will
be for financial years April 2014 – March 2015 to April 2016 –
March 2017.

2. Context (HWP contd)
2.48 To transition to a housing delivery test we propose to use
an area’s local plan (or, where relevant, the figure in the London
Plan or a statutory Spatial Development Strategy) where it is up-
to-date (less than 5 years old) to establish the appropriate
baseline for assessing delivery. If there is no up-to-date plan we
propose using published household projections for the years
leading up to, and including, April 2017 - March 2018 and from
the financial year April 2018 - March 2019, subject to
consultation, the new standard methodology for assessing
housing need.
2. Context (HWP contd)
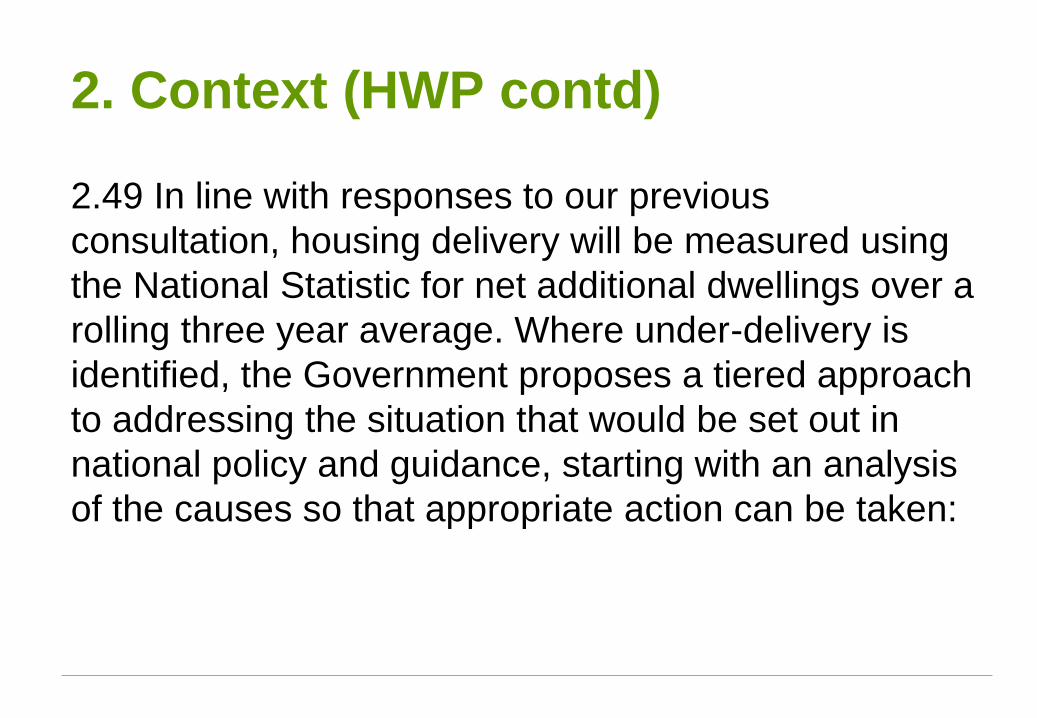
2.49 In line with responses to our previous
consultation, housing delivery will be measured using
the National Statistic for net additional dwellings over a
rolling three year average. Where under-delivery is
identified, the Government proposes a tiered approach
to addressing the situation that would be set out in
national policy and guidance, starting with an analysis
of the causes so that appropriate action can be taken:

2. Context (HWP contd)
• A tiered approach:
Consequence Nov-17 Nov-18 Nov-19 Nov-20
action plan 95% 95% 95% 95%
20% buffer 85% 85% 85% 85%
Presumption n/a 25% 45% 65%

2. Context (Budget)
• [The govt will consult on] “strengthening
the Housing Delivery Test with tougher
consequences where planned homes are not
being built, by setting the threshold at which
the presumption in favour of development
applies at 75% of housing delivery by 2020”
Consequence Nov-17 Nov-18 Nov-19 Nov-20
action plan 95% 95% 95% 95%
20% buffer 85% 85% 85% 85%
Presumption n/a 25% 45% 75%

3. The Housing Delivery Test
Delivery
------------
Target
numerator
denominator

3. The Housing Delivery Test?
Delivery
------------
Target

3. The Housing Delivery Test -
numerator• Numerator = LT122
• Net additions measure the absolute increase
in stock between one year and the next,
including other losses and gains (such as
conversions, changes of use and demolitions)
• Census (?).
3. The Housing Delivery Test -
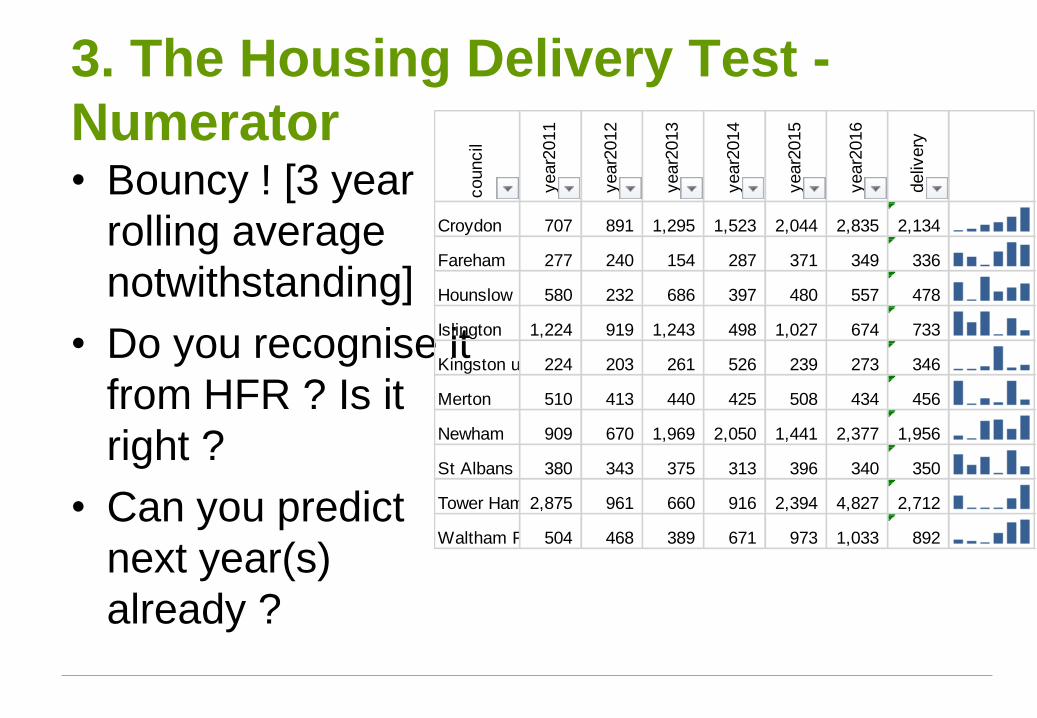
Numerator• Bouncy ! [3 year
rolling average
notwithstanding]
• Do you recognise it
from HFR ? Is it
right ?
• Can you predict
next year(s)
already ?
council
year2
011
year2
012
year2
013
year2
014
year2
015
year2
016
deliv
ery
Croydon 707 891 1,295 1,523 2,044 2,835 2,134
Fareham 277 240 154 287 371 349 336
Hounslow 580 232 686 397 480 557 478
Islington 1,224 919 1,243 498 1,027 674 733
Kingston upon Thames224 203 261 526 239 273 346
Merton 510 413 440 425 508 434 456
Newham 909 670 1,969 2,050 1,441 2,377 1,956
St Albans 380 343 375 313 396 340 350
Tower Hamlets2,875 961 660 916 2,394 4,827 2,712
Waltham Forest504 468 389 671 973 1,033 892

3. The Housing Delivery Test -
denominator
• Denominator = new OAN ?
• Or a plan target ?
• Or a stretch target above OAN?
• Remember this number can
bounce around
– Especially when you plan turns 5

3. The Housing Delivery Test -
denominator
• Note published numbers reflect transitionary
arrangements (see Croydon as an example)
Co
un
cil
aff
ord
ab
ilit
y
ad
justm
en
t
ON
S
ind
exed
ON
S
cap
ped
ON
S
pla
n d
ate
pla
n a
ge
pla
n t
arg
et
cap
ped
pla
n t
arg
et
cu
rren
t
pro
po
sed
Croydon 10.7 0.4 2502 3543 3503 22/04/2013 less 5 years 1010 1414 2440 1414
Fareham 9.2 0.3 401 531 531 01/08/2011 more 5 years 147 206 420 531
Hounslow 10.7 0.4 1936 2751 2711 15/09/2015 less 5 years 822 1151 1556 1151
Islington 15.0 0.7 1845 3114 2583 17/02/2011 more 5 years 1264 1770 1150 2583
Kingston Upon Thames 14.8 0.7 1091 1828 1527 17/04/2012 more 5 years 375 525 717 1527
Merton 16.2 0.8 1132 1997 1585 13/07/2011 more 5 years 320 448 279 1585
Newham 11.1 0.4 2743 3964 3840 26/01/2012 more 5 years 2500 3500 2355 3840
St Albans 16.8 0.8 652 1172 913 - no plan No adopted plan number0 639 913
Tower Hamlets 9.9 0.4 3565 4873 4873 15/09/2010 more 5 years 2885 4039 2428 4873
Waltham Forest 14.7 0.7 1726 2874 2416 01/03/2012 more 5 years 760 1064 2017 2416

3. The Housing Delivery Test -
results
• We know what number goes on the top
– Once we’ve sorted out C2
– And thought about census
• The number on the bottom ?
– LHN or plan target
– You need to know both outcomes …

3. The Housing Delivery Test -
results
Row Labels pass
acti
on
pla
n
bu
ffer +
AP
presu
mp
tio
n
#N
/A
Gran
d T
ota
l
pass r
ate
NE England 10 2 12 83%
York & Hum 15 6 21 71%
W. Midlands 21 3 6 30 70%
SW England 21 3 8 1 33 64%
E. Midlands 23 6 8 37 62%
NW England 24 14 1 39 62%
SE England 21 6 39 1 67 31%
E. England 14 4 29 47 30%
London 4 1 25 3 33 12%
Grand Total 153 23 137 4 5 322 48%

Co
un
cil
cap
ped
ON
S
cap
ped
pla
n t
arg
et
cu
rren
t
pro
po
sed
deli
very
as %
pro
po
sed
pro
po
sed
as %
ON
S
ind
ex O
NS
Croydon 3503 1414 2440 1414 2,134 151% pass 61% buffer + AP
Fareham 531 206 420 531 336 63% buffer + AP
Hounslow 2711 1151 1556 1151 478 42% buffer + AP 18% presumption
Islington 2583 1770 1150 2583 733 28% buffer + AP
Kingston Upon Thames 1527 525 717 1527 346 23% presumption
Merton 1585 448 279 1585 456 29% buffer + AP
Newham 3840 3500 2355 3840 1,956 51% buffer + AP
St Albans 913 0 639 913 350 38% buffer + AP
Tower Hamlets 4873 4039 2428 4873 2,712 56% buffer + AP
Waltham Forest 2416 1064 2017 2416 892 37% buffer + AP
3. The Housing Delivery Test -
results
Consequence Nov-17 Nov-18 Nov-19 Nov-20
action plan 95% 95% 95% 95%
20% buffer 85% 85% 85% 85%
Presumption n/a 25% 45% 75%

3. The Housing Delivery Test
• Thoughts ?
• Useful to think of it as two components rather
than one result ?
• How easy is to know what a “do nothing”
trajectory looks like ?
• What support might councils need ?

4. Root cause analysis

a systematic process for identifying “root causes”
of problems or events and an approach for responding to them
=
Root Cause AnalysisWhat is it
Root Cause Analysis
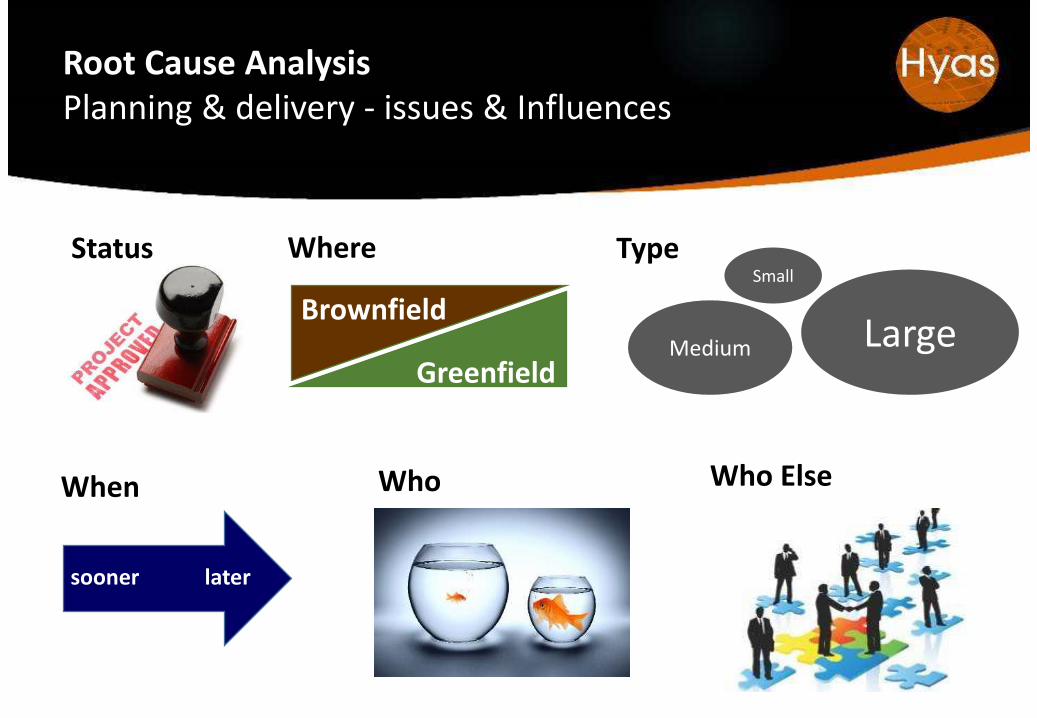
Root Cause AnalysisPlanning & delivery - issues & Influences
Small
Medium LargeGreenfield
Brownfield
Where Type
Who
Status
Who ElseWhen
sooner later

Diagnosis
Monitoring - identifying & spotting symptoms
Listening – to those involved in the problem
Evidencing – has/can a problem be evidenced
Understanding – recognising action is needed
Action
Scoping response – prioritised or general
Adjusting – changing own behaviour
Influencing – changing others behaviour
Intervening – taking more control
Root Cause AnalysisWhat might be involved
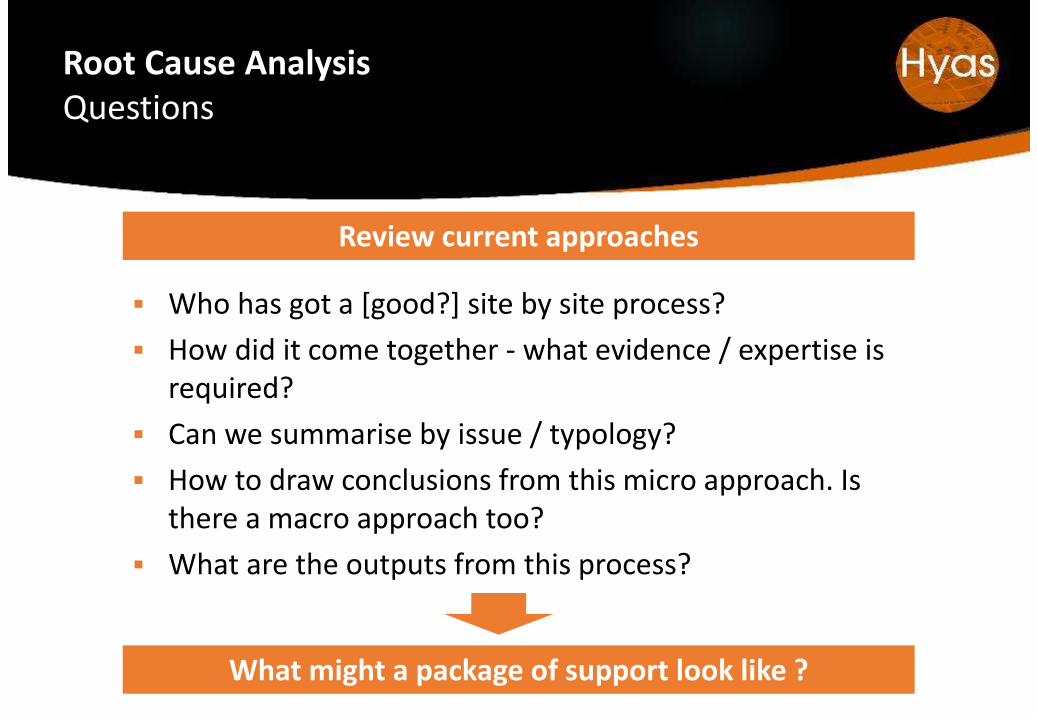
Who has got a [good?] site by site process?
How did it come together - what evidence / expertise is required?
Can we summarise by issue / typology?
How to draw conclusions from this micro approach. Is there a macro approach too?
What are the outputs from this process?
Root Cause AnalysisQuestions
What might a package of support look like ?
Review current approaches

5. Action Plans
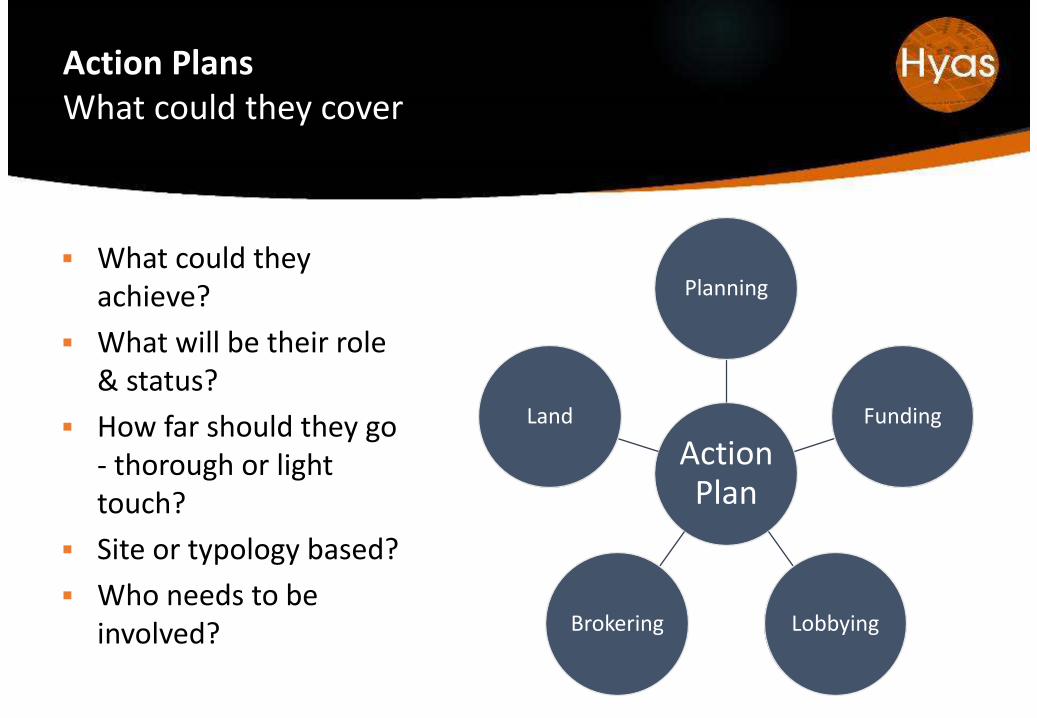
Action PlansWhat could they cover
Action Plan
Planning
Funding
LobbyingBrokering
Land
What could they achieve?
What will be their role & status?
How far should they go - thorough or light touch?
Site or typology based?
Who needs to be involved?

What is the action planning process?
Who does it involve?
Who prepares it – role of combined authorities?
What is a timetable / milestone / consultation process?
What are the existing tools? (strengths, weaknesses)
What new tools might help? (cost / benefit)
What will the output look like?
Action PlansPreparing Action Plans
What might a package of support look like ?
Review current approaches

6. Reflections
• For councils
• For partners / developers / communities ?

7. Volunteers ?
• We need a few “deeper dive” councils
• 3 days of help (or so)
• Rough draft / outlines
– Action plan
– Root cause analysis
– Datasets / types / standards
• If you are interested, stay back and have a
chat

We are at local.gov.uk/pas

Related Documents