H i C N Households in Conflict Network The Institute of Development Studies - at the University of Sussex - Falmer - Brighton - BN1 9RE www.hicn.org Households amidst urban riots: The economic consequences of civil violence in India 1 Jaideep Gupte 2 , Patricia Justino 3 , and Jean-Pierre Tranchant 4 HiCN Working Paper 126 October 2012 Abstract: The objective of this paper is to uncover the determinants of riot victimization in India. The analysis is based on a unique survey collected by the authors in March-May 2010 in Maharashtra. We adopt a multilevel framework that allows neighborhood and district effects to randomly influence household victimization. The main results are that households that (i) are economically vulnerable, (ii) live in the vicinity of a crime-prone area, and (iii) are not able to rely on community support are considerably more prone to suffer from riots than other households. All else equal, income per capita increases victimization, presumably through an opportunity cost mechanism. We find further that relatively affluent neighborhoods and those characterized by large caste fragmentation are more riot-prone than disfranchised and homogeneous ones. Victimization is more common in neighborhoods with weaker social interactions, but some evidence suggests that weak social interactions may also be a consequence of rioting. 1 Acknowledgments: The data collection was financed by the Integrated Project MICROCON (2007-2012) funded by the European Commission under the 6th Framework Program. Jean-Pierre Tranchant acknowledges funding from the European Community’s Seventh Framework Program under grant agreement nr237156. Jaideep Gupte and Patricia Justino received funding from MICROCON as well as the DFID-ESRC funded project ‘Agency and Governance in Contexts of Civil Conflict’. We wish to thank MaRS and our research team in Maharashtra for excellent fieldwork assistance and support, as well as Ivan Cardona for his excellent research assistance at IDS. Jean-Pierre Tranchant thanks Sandip Sarkar, Prem Chandra and Alakh Sharma from the Institute for Human Development in New Delhi for hosting him while the project was ongoing. 2 Research Fellow, Institute of Development Studies. 3 Senior Research Fellow, Head of Conflict, Violence and Development Cluster, IDS. Director, MICROCON. 4 Research Fellow, Institute of Development Studies. Corresponding author. Email:[email protected]

Welcome message from author
This document is posted to help you gain knowledge. Please leave a comment to let me know what you think about it! Share it to your friends and learn new things together.
Transcript
H i C N Households in Conflict Network The Institute of Development Studies - at the University of Sussex - Falmer - Brighton - BN1 9RE
www.hicn.org
Households amidst urban riots: The economic consequences
of civil violence in India1
Jaideep Gupte2, Patricia Justino3, and Jean-Pierre Tranchant4
HiCN Working Paper 126
October 2012
Abstract: The objective of this paper is to uncover the determinants of riot victimization in
India. The analysis is based on a unique survey collected by the authors in March-May
2010 in Maharashtra. We adopt a multilevel framework that allows neighborhood and
district effects to randomly influence household victimization. The main results are that
households that (i) are economically vulnerable, (ii) live in the vicinity of a crime-prone
area, and (iii) are not able to rely on community support are considerably more prone to
suffer from riots than other households. All else equal, income per capita increases
victimization, presumably through an opportunity cost mechanism. We find further that
relatively affluent neighborhoods and those characterized by large caste fragmentation are
more riot-prone than disfranchised and homogeneous ones. Victimization is more common
in neighborhoods with weaker social interactions, but some evidence suggests that weak
social interactions may also be a consequence of rioting.
1 Acknowledgments: The data collection was financed by the Integrated Project MICROCON (2007-2012)
funded by the European Commission under the 6th Framework Program. Jean-Pierre Tranchant
acknowledges funding from the European Community’s Seventh Framework Program under grant agreement
nr237156. Jaideep Gupte and Patricia Justino received funding from MICROCON as well as the DFID-ESRC
funded project ‘Agency and Governance in Contexts of Civil Conflict’. We wish to thank MaRS and our
research team in Maharashtra for excellent fieldwork assistance and support, as well as Ivan Cardona for his
excellent research assistance at IDS. Jean-Pierre Tranchant thanks Sandip Sarkar, Prem Chandra and Alakh
Sharma from the Institute for Human Development in New Delhi for hosting him while the project was
ongoing. 2 Research Fellow, Institute of Development Studies.
3 Senior Research Fellow, Head of Conflict, Violence and Development Cluster, IDS. Director,
MICROCON. 4 Research Fellow, Institute of Development Studies. Corresponding author. Email:[email protected]
1 Introduction
The World Bank (2011) has recently estimated that one in four people in the world (1.5 billion) live in
countries affected by conflict, fragility and high levels of criminal activity. Yet the literature on violent
conflict mostly focuses on civil wars, while other forms of violence remain largely under-researched.
Although civil wars have represented a serious constraint to development and political stability in
recent decades, many countries are affected by local conflicts and forms of social unrest that result in
considerable economic, social and political costs, sometimes more so than larger-scale armed conflicts
(Barron, Kaiser & Pradhan 2004, Collins & Margo 2004a, Collins & Margo 2004b, Deininger 2003,
Klinken 2007, Murshed & Tadjoeddin 2009, Wilkinson 2004, Wilkinson 2005). Persistent forms
of civil unrest have also often constituted the initial stages for more violent conflicts.1 Existing
literature offers, however, remarkable limited understanding on the dynamics of non-war forms of
violence.
This paper addresses this gap in the literature. The paper presents the results of a new study
on the micro-foundations of civil violence in India. The main objective of the paper is to identify
empirically the determinants of riot victimization at the household level within a multilevel frame-
work that takes into consideration how civil violence dynamics plays out at the neighborhood and
district levels. The analysis is based on a unique dataset collected by the authors in March-May
2010 in the state of Maharashtra, which has experienced some of the highest rates of civil violence
in India since the early 1980s. To the best of our knowledge this is the first study to empirically
analyze the foundations of civil violence in India from a bottom-up perspective. To that purpose,
the study identifies and analyzes important links between individual and household experiences of
violence and wider neighborhood and district dynamics through the use of multilevel models.
While much has been written about riots in India, there is very limited understanding of the
relationship between endemic rioting and individual forms of economic, social, political and physical
vulnerability. Episodes of rioting are commonplace in India and their causes are addressed in a large
and well established literature (Tambiah 1996, Brass 1997, Varshney 2002, Wilkinson 2004). Much of
this literature analyses different factors (at national, state and city levels) that may account for the
emergence of riots in India in particular locations and at particular points in time. The literature
fails, however, to explain how within the same communities different people experience riots in
different ways, and how these important variations in turn may affect the outbreak, organization
and persistence of civil violence across neighborhoods and cities in India. There is some literature on
the individual experiences of violence in India (for instance Chatterji & Mehta 2007). This literature
1
is, however, based on small sample case studies, that fail to account for the fact that individual
experiences of violence are very much linked to wider political, social and economic dynamics at the
neighborhood, city, district and even state and country levels. Using an original household survey
in the state of Maharashtra, we are able to document the extent of victimization, its profile and
some of its consequences. Importantly, we are able to do so by inserting the micro level into wider
neighborhood and district contexts thanks to the particular way in which the household sample is
clustered within neighborhoods and districts across Maharashtra.
The paper is organized as follows. Section 2 below provides background information on com-
munal violence in India in general and across the state of Maharashtra more specifically. Section 2
also introduces the Maharashtra Longitudinal Survey on Civil Violence and Welfare (MHLS), which
provides the basis for the empirical study.2 In section 3 we review the existing literature on rioting
in India in order to derive possible testable hypotheses on the determinants of riot exposure among
households, neighborhoods and districts. The econometric analysis of the determinants of riot vic-
timization are presented and discussed in section 4. We start by presenting the results of a set of
simple bivariate analyses, before introducing the results of more complex multilevel models where
the linkages between micro and neighborhood and district levels are explored. Section 5 summarizes
the main conclusions of the paper.
2 Maharashtra Longitudinal Study on Civil Violence and
Welfare
2.1 Dataset and sampling design
In March-May 2010, the authors implemented a unique household survey across Maharashtra with
the objective of obtaining fine-grained data on social, economic and political processes associated with
the persistence of civil violence, and its consequences on individuals, households and neighborhoods.
Given the high concentration of rioting in certain areas in Maharashtra and the fact that riots
are (despite constant and regular) a rare event in such a large state, we followed a clustered sample
approach. To assess the prevalence of rioting within the state, we used district-level data from the
Maharashtra Police on Jatiya Dangali which captures ’significant’ riots reported at the police station
level for which a First Information Report was filed with a magistrate. These data, spanning the
period 2003-2008, contains information on the number of communal riots for each district. The
2
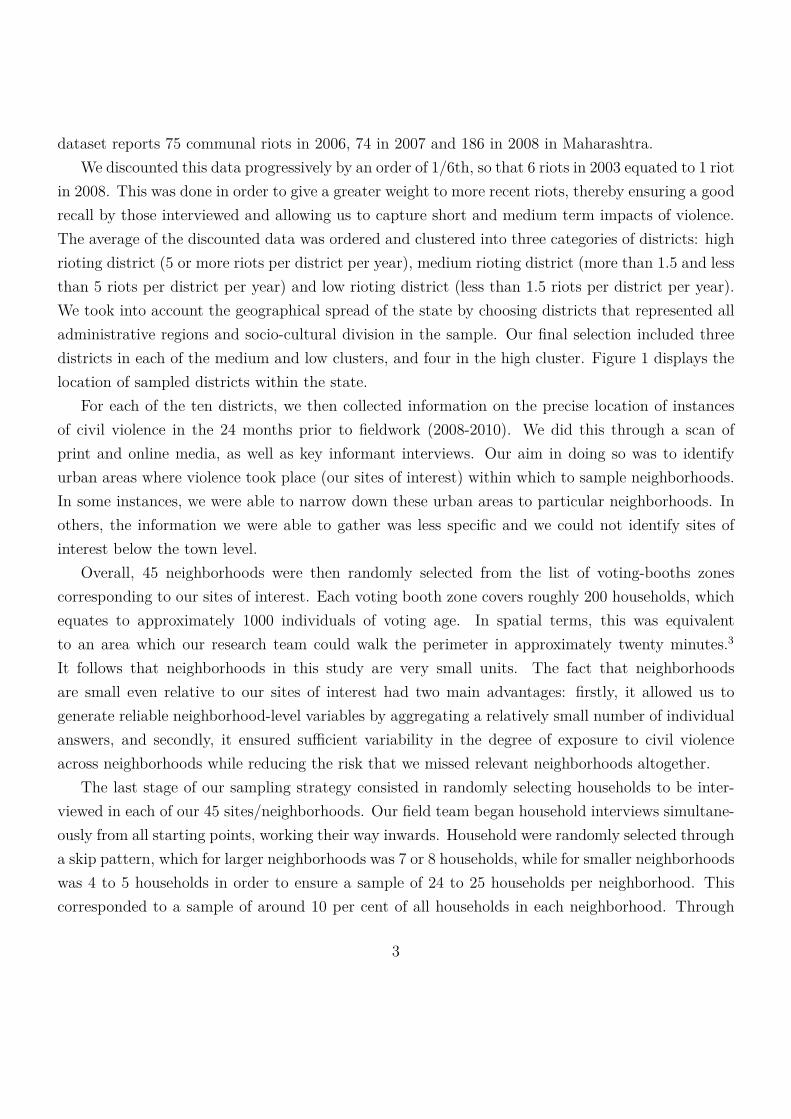
dataset reports 75 communal riots in 2006, 74 in 2007 and 186 in 2008 in Maharashtra.
We discounted this data progressively by an order of 1/6th, so that 6 riots in 2003 equated to 1 riot
in 2008. This was done in order to give a greater weight to more recent riots, thereby ensuring a good
recall by those interviewed and allowing us to capture short and medium term impacts of violence.
The average of the discounted data was ordered and clustered into three categories of districts: high
rioting district (5 or more riots per district per year), medium rioting district (more than 1.5 and less
than 5 riots per district per year) and low rioting district (less than 1.5 riots per district per year).
We took into account the geographical spread of the state by choosing districts that represented all
administrative regions and socio-cultural division in the sample. Our final selection included three
districts in each of the medium and low clusters, and four in the high cluster. Figure 1 displays the
location of sampled districts within the state.
For each of the ten districts, we then collected information on the precise location of instances
of civil violence in the 24 months prior to fieldwork (2008-2010). We did this through a scan of
print and online media, as well as key informant interviews. Our aim in doing so was to identify
urban areas where violence took place (our sites of interest) within which to sample neighborhoods.
In some instances, we were able to narrow down these urban areas to particular neighborhoods. In
others, the information we were able to gather was less specific and we could not identify sites of
interest below the town level.
Overall, 45 neighborhoods were then randomly selected from the list of voting-booths zones
corresponding to our sites of interest. Each voting booth zone covers roughly 200 households, which
equates to approximately 1000 individuals of voting age. In spatial terms, this was equivalent
to an area which our research team could walk the perimeter in approximately twenty minutes.3
It follows that neighborhoods in this study are very small units. The fact that neighborhoods
are small even relative to our sites of interest had two main advantages: firstly, it allowed us to
generate reliable neighborhood-level variables by aggregating a relatively small number of individual
answers, and secondly, it ensured sufficient variability in the degree of exposure to civil violence
across neighborhoods while reducing the risk that we missed relevant neighborhoods altogether.
The last stage of our sampling strategy consisted in randomly selecting households to be inter-
viewed in each of our 45 sites/neighborhoods. Our field team began household interviews simultane-
ously from all starting points, working their way inwards. Household were randomly selected through
a skip pattern, which for larger neighborhoods was 7 or 8 households, while for smaller neighborhoods
was 4 to 5 households in order to ensure a sample of 24 to 25 households per neighborhood. This
corresponded to a sample of around 10 per cent of all households in each neighborhood. Through
3
this multi-staged sampling framework, we obtained a final sample of 1089 households, spread across
forty-five neighborhoods, in ten districts in Maharashtra.
2.2 Descriptive statistics
The questionnaire administered to the respondents was in part meant to inform us on household
characteristics associated with exposure to violence. To this end, the questionnaire included modules
on income and consumption, access to services and amenities, the extent of civil violence in the
neighborhood, and the experience of household members with acts of violence amongst others. We
also gathered data on community relations and trust, with a special emphasis on relations with police
and officials. Summary statistics are provided in table 1.
As became apparent during the sampling stage of the project, most of the sites affected by civil
violence were slums/low income neighborhoods. An array of vulnerability indicators stemming from
the survey confirms this. The median monthly income of the sample is 5,000 rupees (around 95$)
while the median household hosts 5 members. Because our sample is made of predominantly low-
income urban areas in every district, the sub-state variations in terms of income are much lower than
representative district figures.
The two most common occupations are pupils/students (30 per cent) and housewives (25 per
cent), that is, people not in the labor force. Amongst the active population in the sample, the main
occupations are daily wage earners (22 per cent of the labor force), followed by service officers (10.2
per cent), manual laborers (9.6 per cent) and shop owners (7.6 per cent). Petty traders and busi-
nessmen constitute more than five per cent of the labor force. The predominance of casual laborers,
together with the extremely high level of unemployment we found among the active population (13
per cent), low access to water and low levels of asset ownership are obvious signs that households in
the sample are economically vulnerable in a very acute way.
2.3 Exposure to civil violence and victimization
Our questionnaire included several questions to capture the exposure of households to various forms
of civil violence. We will describe first the results of the module in which households self-report the
number of events of civil violence that happened in their neighborhood in the last year. The question
asked was: In the last 12 months, have any of the following events occurred in your neighborhood?
The different events include: riots (danga), stone-pelting, public fights, damages of buses or public
property, burning of tires, throwing of bottles, police harassment, agitation related to a bandh (strike)
4
and violence during curfew. Whilst some of these events may be considered as modalities of violence
within the context of a riot (as stone-pelting or damages to property for example), they may also
occur in the absence of it. As described in table 2, the most common forms of civil violence are riots:
one in every five households reported at least one riot in their neighborhood, then public fights and
stone-pelting. Curfew follows closely (14%) indicating that a majority of riots in the sample were
severe enough to induce the state to resort to this coercive means of restoring law and order.
As is evident from table 2, most forms of civil violence are heavily concentrated in some neigh-
borhoods. The median proportion of households reporting at least one public fight is 14% (8% for
riot or stone pelting), well below the average proportion of exposed households. Evidence of neigh-
borhood effects is further demonstrated by the analysis of variance of a fully unconditional random
effect model in which the exposition to violence of household h living in neighborhood n is explained
by a neighborhood specific effect and a disturbance term. The proportion of variance explained by
the neighborhood random effect is 55% for riots, around 40% for curfews and stone pelting and 28%
for public fights. These results suggest that household exposure to riots must be understood within
the wider neighborhood context. We return to this point in the empirical analysis below.
We have captured levels of victimization using the following question: In the past 24 months,
did you or any member of the household experience a riot? The question was asked after similar
questions probing whether the household experienced negative events such as illness, flood or lost
employment. In so doing, we are quite confident that our variable reflects actual impact on the
household as opposed to signaling the simple presence of violence in the neighborhood. The fact
that victimization rate is twice as low as the proportion of respondents declaring a riot occurred is
also reassuring.
Overall, 136 households were victim of riots, which corresponds to 12.5% of the sample. Out of
these 136 households, 26 suffered directly.4 This minority of households declared they needed extra
money to cope with the riot, either because of damages done to their house or shops or because of
medical treatment of injuries.
3 Riot victimization in India: conceptual framework and
determinants
Communal violence, as riots are usually labeled in South Asian studies, refers to riots in which
two communities (most often Hindus and Muslims in the case of India) clash and engage in killing,
5
maiming, looting, arson and destruction (Gupte 2012).5 The single most important episode of
communal violence in India took place during the partition of the erstwhile British Empire in which
millions of Hindus, Sikhs and Muslims were killed or forced to move across the newly created border.
Other notorious examples were the series of riots across Indian states after the destruction of the
Ayodhya mosque in 1992, and the wave of violence in Gujarat in 2002.
In this paper, we use the term civil violence rather than communal violence to account for the
fact that violence does not involve neatly defined communities (caste divisions play a great role
for instance), as well as to emphasize that we will pay close attention to routine, smaller bouts of
violence (Gupte 2012). The forms of civil violence of particular importance to our study are rioting
and its closely related modalities including looting, ransacking, stone pelting and arson, and also,
vigilantism, thuggery, gang violence and extortion.
Interestingly, there is very limited literature on the impact of civil violence in India on levels
and types of victimization. Most of the literature has concentrated on explaining the outbreak of
communal violence, with much less emphasis on the persistence of this violence across communities
and cities in India, affecting specific social, economic and political groups. However, this literature
provides some pointers regarding potential correlates of victimization. We are able to hypothesize
that at least three main factors may be associated with levels of violence victimization: the presence of
visible assets or resources that may attract opportunistic violence and increase physical vulnerability,
the levels of integration within local communities and group identity. In addition, our own sampling
exercise discussed in the previous section showed us that in Maharashtra areas of recurrent and
persistent violence are also areas of acute economic vulnerability. We discuss these factors in more
detail below and describe the indicators we will use for each one in our empirical analysis in section
5.
3.1 Physical insecurity
It is a well known fact that looting, arson and destruction of private and public property are among
the main modalities of riots (Tambiah 2005). Even though the crowd may have originally gathered
peacefully, it is easy for criminal elements to infiltrate it or merely exploit the confusion caused by
the gathering. Some of these activities may be for personal gain. We hypothesize that households
displaying visible assets are at greater risk either because of direct targeting or opportunistic looting.
Opportunistic looting has been reported in many instances of civil violence whereby individuals
exploit the riot to settle scores, enrich themselves or get rid of business rivals (Engineer 1991,
6
Wilkinson 2004).
In the context of impoverished urban areas, visible assets are relatively uncommon. We consider
as an indicator of visible wealth the share of following variables any given household owns: presence
of a dish TV, car/scooter/motorcycle, air conditioning device, and generator. All these assets are
readily visible from the outside, particularly in single storied shacks, tenements or houses, and signal
potential riches inside the dwelling. In addition to visible assets, the size of the house and the
material in which it is built (concrete/brick or in a building, as opposed to less permanent materials)
and whether the household owns a shop are other possible attributes that put households at risk. It
is worth noting that the material of the dwellings is a two-faceted indicator: on the one hand houses
made of permanent materials may signal wealth and attract looters, but on the other hand houses
made of non-permanent materials are easier to plunder. The presence of visible assets may increase
physical vulnerability depending on the relative safety of the area where the household lives. We
will consider as an indicator of physical vulnerability the existence of unsafe places in the proximity
of households, as reported by households themselves, and the distance to the police station.
3.2 Insertion within local community
In low income areas of India there are few means available to households to protect themselves.
Physical protection is likely to be more effective when household benefit from strong integration
within local social networks (Mitra & Ray 2010). Social networks convey information about upcoming
trouble and allow people to take steps to protect their family and assets (Tambiah 1996). Once the
riot starts, households with high level of social capital will be able to receive aid from the community
(e.g. food). In addition, households that know their local police and other important actors in the
community are likely to be protected as their houses and people will be watched by police, their
neighbors and so forth. Varshney (2002) has famously argued that the strength of civic life is the
main factor that dampens the outbreak of violence between Hindu and Muslim communities, whereas
Jha (2008) shows that the two groups will peacefully coexist if they complement each other in terms
of local productive activities, and competition and inequalities between the two groups are kept low.
The indicators we use to account for household insertion within local networks include: the
number of years a given household has lived in its current dwelling, whether respondents trust their
neighbors and the local police, whether they normally ask for community support in times of need,
and whether they are engaged in civil life through membership in various organizations.
7
3.3 Identity markers
Riots are known in India as jatiya dangali, i.e. ethnic riots, a term that conveys the idea that violence
occurs between identifiable groups.
The hierarchical structure of our data offers a unique possibility to model identity markers at the
household and neighborhood levels. We will thus be able to ascertain whether the potential victim-
ization effect of any marker operates at the macro level (neighborhoods with specific distributions
of caste, language and religion are more prone to rioting) or at the micro level (within neighbor-
hoods, households with specific identity markers are prone to be affected) or at both at the same
time. The Maharashtra questionnaire included questions on religious affiliations, caste (jati) and
language. We matched each jati with its corresponding status (ST, SC, OBC, others) in the state
of Maharashtra6, and we use the latter as our household caste variable. As for language, we will
distinguish between native Marathi speakers and native speakers of other tongues (predominantly
Hindi and Urdu) as a means to capture the migration issue (Maharashtrians v non-Maharashtrians)
that cuts across religious affiliations and has proven important in political violence dynamics in the
state (Hansen 1996, Hansen 2000). At the community level, we computed fractionalization and po-
larization indexes of jati, larger caste grouping and religious affiliations. The fractionalization index
is given by F jn = 1 −
j=J∑
j=1(p2
j) where j represents the identity line under study, J the total number of
categories within the identity line, n the neighborhood and pj the share of households with identity
j in neighborhood n. Per the definition of Montalvo & Reynal-Querol (2005) the polarization index
is given by P jn = 4
j=J∑
j=1p2
j(1 − pj).
3.4 Economic vulnerability
Economic vulnerability refers to the households’ capacity to withstand adverse shocks. As mentioned
earlier, riots are very disruptive for households that directly suffered from damages. However the
majority of victims in our sample does not suffer from injuries or damaged houses but instead from the
indirect consequences of riots. Curfews are of particular importance. Severe riots are associated with
curfews, sometimes for an extended period of time. Curfews make it difficult or impossible to buy
food, other first necessities, and medicines, or secure access to doctors as well as getting to work. Yet
the welfare impact of curfews have not been a subject of analysis.7 A notable exception is provided
by Paul Brass (2006a) who writes: “[in the slum areas of a city in India] in the summer months of
hellish heat and humidity, where often large families comprising three generations of persons live in
8
tiny flats without running water or toilets, with minimal stocks of food, curfew is invariably a dire
experience easily turned into a catastrophe. This is especially the case for daily wage-earners who
have to feed large families from their income, who have no monetary reserves whatsoever, and who
face hunger within two days and potential starvation when curfew is imposed for weeks, as it often
is, with minimal hours when movement outside one’s house is allowed for the purpose of obtaining
necessities.”.
Even when a curfew is not enforced, riots have the potential to temporarily disrupt the functioning
of markets and communities. It is our assumption that those most vulnerable to changes in their
economic conditions are more prone to acutely suffer from any disturbances, not matter how short-
lived, brought by rioting. Those with a secure stream of income, comfortable savings and who are
not reliant on informal arrangements to get by are conversely apt to navigate through the conflict
insofar as they are not directly affected.
We will use several indicators to capture economic vulnerability: monthly income per capita,
possession of non-visible assets, reliance on community’s assistance, capacity to use savings in case
of need and whether the household relies on daily wages. In addition, we will make use of a subjective
valuation of each household’s welfare with respect to others in the neighborhood. Income per capita
is also an indicator of the monetary opportunity cost incurred by households if the riot and ensuing
curfew keep them away from work for an extended period of time. Those with high income are not
likely to experience the same level of hardship as that experienced by the poor, but in contrast may
experience higher levels of foregone revenue.
4 Econometric analysis of determinants of victimization
We start by exploring the determinants of exposure to riots in Maharashtra through a set of naive
bivariate analyses. These reveal simple correlations between victimization and the above hypoth-
esized predictors, but lay down some ideas about the degree with which victims and non-victims
differ in these characteristics.
4.1 Bivariate analysis
Table 3 displays whether predictors of physical vulnerability, insertion within local networks and
economic vulnerability differ between victims and non-victims. This provides a first insight as to
whether and which categories of household-level factors and neighborhood characteristics are relevant
9
to explain household victimization. Covariates of identity lines will be dealt with later.
Several variables of physical insecurity are significantly correlated with household victimization:
the index of visible assets, the size of the dwelling and the reported presence of an unsafe place in
the area. All correlations exhibit the expected signs. Other predictors of physical vulnerability do
not appear to significantly relate with victimization.
Are victims of riots less inserted in local networks and less likely to trust their neighbors or
the police? According to the correlations displayed in table 3 the answer is a clear (and counter-
intuitive) no: households that reported to have been affected by a riot do trust their local police
significantly more and exhibit a higher rate of civic engagement than non-victims. There is no
significant correlation between victimization and trust toward neighbors.
The evidence on the role of economic vulnerability on victimization is equally contradictory to
our hypotheses: victims tend to resort less to community help in case of need, their income per
capita is 400 rupees higher than non-victims and they enjoy an extra 1.5 hours of running water per
day with respect to non-victims. The only contrast is the average access to electricity which is lower
by one hour per day for victims.
Correlations results for identity markers are shown in table 4. We can see that among victims,
the share of Hindus is significantly larger than within non-victims (by about 16 percentage points)
whilst the converse is true for Muslims. There is no correlation between Buddhist affiliation and
victimization. The same lack of relation appears for broad caste groupings. In contrast, Marathi
speakers constitute 67% of the victims but only 47% of non-victims, a sizable and statistically
significant difference. Does that mean that Hindu households are more prone to suffer from riots
than their Muslim neighbors? Are native Marathi-speakers more at risk than native Hindi or Urdu
speakers? Or do these results signal that predominantly Hindu (or Marathi) neighborhoods are more
frequently hit by civil violence than predominantly Muslim (or non-Marathi) ones? We cannot at this
stage answer these questions without falling prey to the atomistic fallacy which would consist in using
the household-level correlations to inform on correlations at the neighborhood level. The lower part
of table 4 provides a crude way to bring in neighborhood effects into consideration and overcome the
atomistic fallacy. The sample has been restricted to the 8 neighborhoods wherein at least 50% of the
respondents reported themselves as victims (84 out of the 136 victims live in these 8 neighborhoods).
One can see that now the correlation between religious affiliations and victimization vanishes while
that between Marathi and victimization, although reduced in magnitude, remains significant at the
5% level.
The upshot of this exercise is to show that household victimization relates to many household-
10
level predictors, thereby confirming that within riot-affected neighborhoods, patterns of victimization
exist. The sign of correlations is however the opposite to what we hypothesized. Yet the above
analysis is unable to disentangle household and community effects. Insofar as riots are localized
events, it might be for instance that income does not operate at the household level but at higher
level. In other words, more affluent households may be more likely to be affected not because they
are richer than their neighbors, but because riots are more common in affluent neighborhoods. We
now turn to a multivariate and multilevel analysis to properly account for such effects.
4.2 Multivariate analysis of victimization
4.2.1 Empirical specification
We model the probability to be affected by a riot using a three-level logit model with random
intercepts representing unobservable heterogeneity at both neighborhood and district levels. The
hierarchical structure of our data is such that households are nested within neighborhoods which
themselves are nested within districts. We will refer to level 1 as the household level, level 2 as
the neighborhood level and level 3 as the district level. The multilevel modeling we propose allows
us to correct the estimations for the dependence of residuals that arise between households within
neighborhoods, and between neighborhoods within districts. Furthermore, these source of depen-
dences of residuals are not a mere source of problem to the econometric exercise, but are in and of
themselves important elements of the analysis. The questions we ask are the following: what are
the respective contributions of neighborhood and district effects to household victimization? How
do they vary once household and neighborhood covariates are introduced? Do some variables exert
a different effect at the household and neighborhood levels? A multilevel model is a good way to
address these questions while correctly accounting for the hierarchical structure of the data in the es-
timations. For sake of clarification, we will refer from now on to our empirical model as a three-level
random-intercepts model. Alternative definitions include random-effect model, a mixed model or a
hierarchical non-linear model. The difference between these terms is just semantic as all describe
a model that features both fixed parameters to be estimated and random effects which can not be
directly estimated (but can be predicted).
Any model with random effects requires that the unobservable components are uncorrelated with
the covariates. In the context of a three-level model it means that the random effects associated with
both neighborhood and district levels are uncorrelated with the covariates. This assumption does not
hold if there exist omitted factors at level 2 or 3 which are correlated with level 1 covariates. Such a
11
situation is very likely in most applications so that researchers usually prefer to use a fixed effect (or
within) estimator whose consistency does not hinge on this assumption. However, the fixed effect
estimator comes at the cost of increased variance of the coefficients (since they fully parametrize
the unobserved heterogeneity), the impossibility to explore the effects of contexts - which are key
to our paper, and to produce out-of-sample predictions (Gelman & Hill 2012). Fortunately, the
Mundlak-Chamberlain approach allows us to avoid using fixed effects while ensuring that the random
effects model is valid (Mundlak 1978, Chamberlain 1980). The approach advocated by Mundlak and
Chamberlain consists in approximating the unobservable heterogeneity at level L by the means of
covariates at level L-1. The three-level logit model with random intercepts can then be written as
logitPr(yhnd = 1|xhnd, ζnd, ζd) = β1xhnd + β2Wnd + ζnd + ζd + ehnd (1)
with
ζnd = µnd + θxnd (2)
ζd = µd + γ1xd + γ2wd (3)
where yhnd takes the value 1 if household h in neighborhood n in district d reports it was affected
directly or indirectly by a riot. To simplify the notation, xhnd represents the vector of household-
level covariates and wnd denotes the set of neighborhood-level variables. The random intercepts
at the neighborhood level, ζnd, and district level, ζd, are assumed to be a function of the within-
neighborhood means of household covariates (xnd) and the within-district means of neighborhood
covariates (wd), respectively. Conditional on these means, the random intercept at each level (µnd
and µd) is assumed independent of the covariates (xhnd and wnd). The Mundlak-Chamberlain ap-
proach to random effect estimations is a potent yet underused one. By partitioning the unobserved
heterogeneity into within and between components, it considerably weakens the assumption that
random effects must be uncorrelated with the covariates. The correlation between a level L random
effect (e.g. ζnd) and a level L-1 covariate (e.g. xhnd) must operate through the covariance between
the group mean (xnd) and the random effect (Raudenbusch & Bryk 2002, p. 262). By controlling for
the group means one removes by construction the correlation between the level 1 covariates and the
level 2 random effect and hence restores the validity of the random effect estimation (Mundlak 1978).
The coefficients associated with the group means (θ, γ1 and γ2) are interpreted as contextual effects,
which are the difference between the within and between effects of a given variable.8 It is worth
12
noting that the Hausman test which is abundantly used in the literature to choose between fixed
and random effects is fundamentally a test that θ, γ1 and γ2 are equal to zero. In that case, con-
textual effects are absent and both estimators are equivalent. If contextual effects are statistically
non-null, one needs to include them as additional covariates to restore the equivalence between fixed
and random effects (see e.g. Mundlak 1978, Rabe-Hesketh & Skrondal 2012, Fielding 2004, Snyders
& Berkhof 2008).
The omission of higher levels variables is not the only concern in our empirical strategy. The
absence of correlation between xhnd and ehnd remains crucial for the consistency of the estimations
(and is independent of the choice between fixed and random effects). We will discuss the reliability
of this identification assumption later in the paper.
The estimations are run with the xtmelogit command in stata with seven integration points at
each level.
4.2.2 Results
We begin by estimating a model like in equation 1 without neighborhood-level predictors (wnd) and
without the within-neighborhood means (i.e. xhnd). The results are displayed in the first column of
table 5. With neighborhood and districts effects now accounted for, we can see that the household-
level variables behave very differently compared to the previous bivariate estimations. The coefficient
associated with the variable of distance from the police station is surprisingly negative and significant
at the 10% level. The point estimate is substantial: ceteris paribus an increase in distance from 5 to
20 minutes (which represents the inter-quartile of the distribution of distance to the police station)
translates into a reduction of 40 % of the odds of victimization (exp 0.036 ∗ 15 = 0.62). The presence
of a crime hotspot is the second variable of physical vulnerability that is significant in the estimation
(at the 1% level), this one with the hypothesized positive sign. Its associated odds ratio of 5 is
very large. The index of visible assets, the size of the house and the other predictors of physical
vulnerability do not appear significantly related to household victimization.
Trust toward neighbors reduces the odds of victimization by 44% (exp −0.583), an impact signifi-
cant at the 10% level while trust toward the police is very imprecisely estimated. Further, households
which can rely on the assistance of the community in case of need are 75% less likely to report a
victimization status (with p-value<0.05). The numbers of years households spent in their current
house do not play a role in explaining odds of victimization. The last variable of ’social capital’,
i.e. whether a household member is engaged in a CSO/political party/trade union or other group,
13
is positively, and statistically significantly, related to victimization. The odds of victimization of a
household engaged in civic life are three and a half times higher than households not involved. This
is a very large and counter-intuitive effect. Our interpretation is that this variable reflects more
economic vulnerability than social capital, a discussion we will elaborate on below.
Neither caste nor religion variables display a significant relationship with victimization, but
Marathi households are almost three times more likely than non-Marathi to report being affected
by a riot. These results are consistent with the preliminary finding of table 4. In terms of eco-
nomic vulnerability, we find that the odds of victimization for households that can use savings in
times of needs are 60% lower than for households without this kind of financial security. Relying on
daily wages or having few non-visible assets do not affect the likelihood of victimization. Finally,
income per capita, as hypothesized earlier, increases the odds of victimization presumably because
of a higher opportunity cost. The odds ratio of a change in income equal to the inter-quartile of the
income distribution (around 1000 rupees) is 1.22.
In column (2) we introduce a change in the indicators of economic vulnerability: daily earner and
the index of non-visible assets are dropped and replaced by the variable of subjective welfare ranking.
The latter displays the expected negative sign but fails to reach statistical significance. Following the
surprising result on involvement in civic life, in column (3) we distinguished between membership in
women self-help groups and membership in other groups. Out of the 148 households in the sample
for which at least one member is involved in civic life, 86 belong to women self-help groups (58%).
The second largest type of group is political party, with 27 households only. Based on the weight
of self-help groups in the sample and on the idea that a membership in these organizations may be
more related to economic vulnerability than to social interactions, we replace our former variable
of engagement in civic life by a variable of membership in women self-help groups (membership in
other groups is coded as zero). We can see that the coefficient associated with the women self-help
group variable is larger (1.682) than the coefficient associated with any sort of membership (e.g.
1.26 in column 2). It means than the positive effect of the civic life variable was entirely driven by
the membership in self-help groups, whereas membership in other type of structures is unrelated to
victimization.9 Households which take part in self-help groups are considerably poorer than average
(970 rupees per month against 1445 for the others). This, together with the explicit economic
function of these groups (such as saving and investing) explains why we interpret this variable as
reflecting economic vulnerability rather than how well households are inserted in the local networks.
For all these three specifications, the estimated variances of the random effects remained stable:
around 0.7 for the neighborhood effects and 3.7 for the district effects. The validity of the multilevel
14
approach with respect to a simple logit is vindicated by the results of the LR test which signals that
the variances of the random effects are non-null with a p-value inferior to 0.001. The importance of
the random effect can be easily grasped through the median odds ratios (Rabe-Hesketh & Skrondal
2012, p. 533). The median odds ratio, which is easily derived from the estimated variance of the
random effect, can be interpreted as follows: imagine we randomly choose two households with
identical values of covariates, and that we then compute the odds ratio formed by comparing the
household with the larger odds of victimization with the household with the lower odds. The
difference between the two stem from the random effects as the households are otherwise similar.
Given the estimated variances of random effects, we calculate that half of the time, such an odds
ratio will exceed 6 when district random effects are considered and 2 when neighborhood effects are
considered.
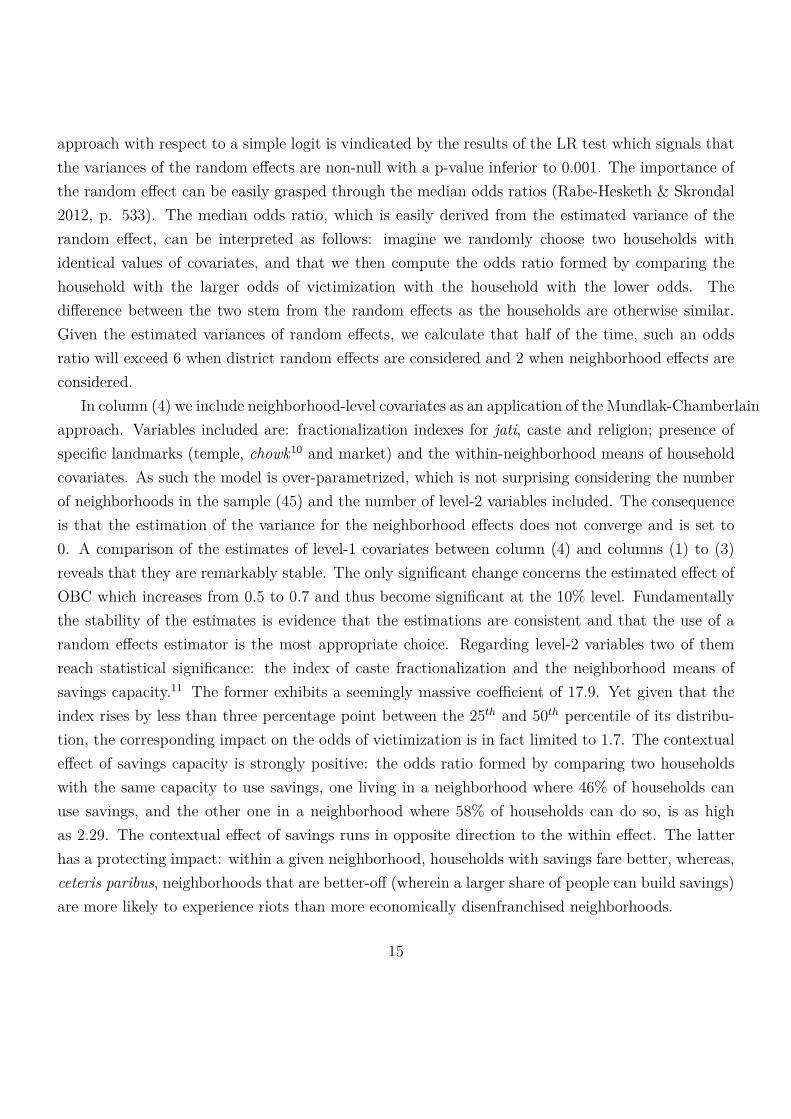
In column (4) we include neighborhood-level covariates as an application of the Mundlak-Chamberlain
approach. Variables included are: fractionalization indexes for jati, caste and religion; presence of
specific landmarks (temple, chowk10 and market) and the within-neighborhood means of household
covariates. As such the model is over-parametrized, which is not surprising considering the number
of neighborhoods in the sample (45) and the number of level-2 variables included. The consequence
is that the estimation of the variance for the neighborhood effects does not converge and is set to
0. A comparison of the estimates of level-1 covariates between column (4) and columns (1) to (3)
reveals that they are remarkably stable. The only significant change concerns the estimated effect of
OBC which increases from 0.5 to 0.7 and thus become significant at the 10% level. Fundamentally
the stability of the estimates is evidence that the estimations are consistent and that the use of a
random effects estimator is the most appropriate choice. Regarding level-2 variables two of them
reach statistical significance: the index of caste fractionalization and the neighborhood means of
savings capacity.11 The former exhibits a seemingly massive coefficient of 17.9. Yet given that the
index rises by less than three percentage point between the 25th and 50th percentile of its distribu-
tion, the corresponding impact on the odds of victimization is in fact limited to 1.7. The contextual
effect of savings capacity is strongly positive: the odds ratio formed by comparing two households
with the same capacity to use savings, one living in a neighborhood where 46% of households can
use savings, and the other one in a neighborhood where 58% of households can do so, is as high
as 2.29. The contextual effect of savings runs in opposite direction to the within effect. The latter
has a protecting impact: within a given neighborhood, households with savings fare better, whereas,
ceteris paribus, neighborhoods that are better-off (wherein a larger share of people can build savings)
are more likely to experience riots than more economically disenfranchised neighborhoods.
15
In order to investigate further potential contextual effects, we need to reduce the dimensionality
of the vector of level-2 covariates. The results of the Mundlak-Chamberlain approach in column
(4) reassure us on the consistency of random effects estimations so that we can safely drop level-2
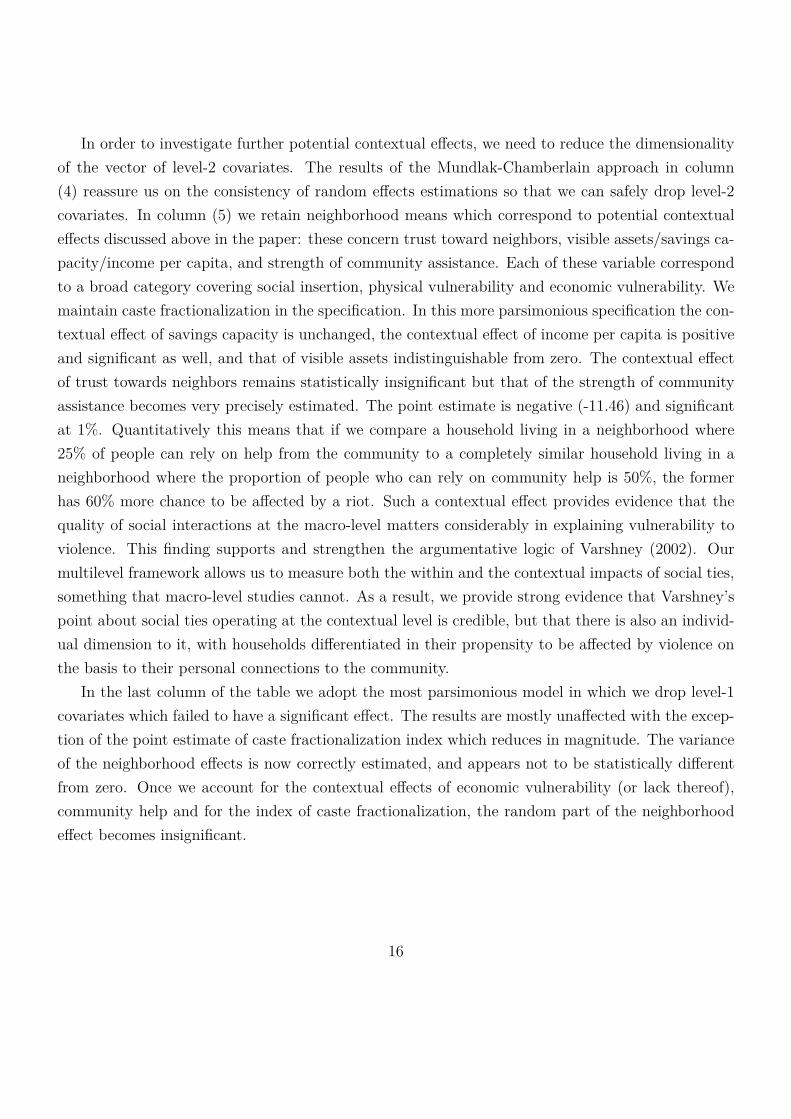
covariates. In column (5) we retain neighborhood means which correspond to potential contextual
effects discussed above in the paper: these concern trust toward neighbors, visible assets/savings ca-
pacity/income per capita, and strength of community assistance. Each of these variable correspond
to a broad category covering social insertion, physical vulnerability and economic vulnerability. We
maintain caste fractionalization in the specification. In this more parsimonious specification the con-
textual effect of savings capacity is unchanged, the contextual effect of income per capita is positive
and significant as well, and that of visible assets indistinguishable from zero. The contextual effect
of trust towards neighbors remains statistically insignificant but that of the strength of community
assistance becomes very precisely estimated. The point estimate is negative (-11.46) and significant
at 1%. Quantitatively this means that if we compare a household living in a neighborhood where
25% of people can rely on help from the community to a completely similar household living in a
neighborhood where the proportion of people who can rely on community help is 50%, the former
has 60% more chance to be affected by a riot. Such a contextual effect provides evidence that the
quality of social interactions at the macro-level matters considerably in explaining vulnerability to
violence. This finding supports and strengthen the argumentative logic of Varshney (2002). Our
multilevel framework allows us to measure both the within and the contextual impacts of social ties,
something that macro-level studies cannot. As a result, we provide strong evidence that Varshney’s
point about social ties operating at the contextual level is credible, but that there is also an individ-
ual dimension to it, with households differentiated in their propensity to be affected by violence on
the basis to their personal connections to the community.
In the last column of the table we adopt the most parsimonious model in which we drop level-1
covariates which failed to have a significant effect. The results are mostly unaffected with the excep-
tion of the point estimate of caste fractionalization index which reduces in magnitude. The variance
of the neighborhood effects is now correctly estimated, and appears not to be statistically different
from zero. Once we account for the contextual effects of economic vulnerability (or lack thereof),
community help and for the index of caste fractionalization, the random part of the neighborhood
effect becomes insignificant.
16
4.2.3 Robustness tests
The results presented above are remarkably robust to a series of alternative specifications, which are
shown in table 6. To save space we do not report the variance of the random effects and the p-value
associated with the LR test. Neither are changed with respect to the previous specifications.
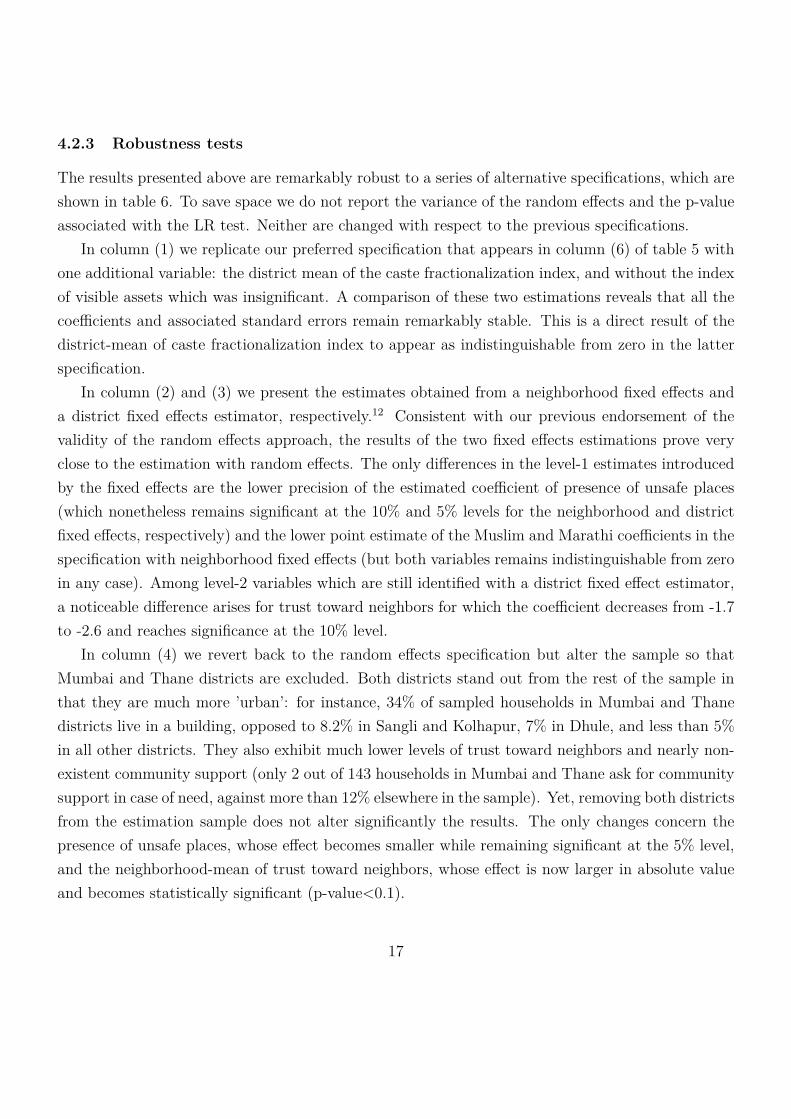
In column (1) we replicate our preferred specification that appears in column (6) of table 5 with
one additional variable: the district mean of the caste fractionalization index, and without the index
of visible assets which was insignificant. A comparison of these two estimations reveals that all the
coefficients and associated standard errors remain remarkably stable. This is a direct result of the
district-mean of caste fractionalization index to appear as indistinguishable from zero in the latter
specification.
In column (2) and (3) we present the estimates obtained from a neighborhood fixed effects and
a district fixed effects estimator, respectively.12 Consistent with our previous endorsement of the
validity of the random effects approach, the results of the two fixed effects estimations prove very
close to the estimation with random effects. The only differences in the level-1 estimates introduced
by the fixed effects are the lower precision of the estimated coefficient of presence of unsafe places
(which nonetheless remains significant at the 10% and 5% levels for the neighborhood and district
fixed effects, respectively) and the lower point estimate of the Muslim and Marathi coefficients in the
specification with neighborhood fixed effects (but both variables remains indistinguishable from zero
in any case). Among level-2 variables which are still identified with a district fixed effect estimator,
a noticeable difference arises for trust toward neighbors for which the coefficient decreases from -1.7
to -2.6 and reaches significance at the 10% level.
In column (4) we revert back to the random effects specification but alter the sample so that
Mumbai and Thane districts are excluded. Both districts stand out from the rest of the sample in
that they are much more ’urban’: for instance, 34% of sampled households in Mumbai and Thane
districts live in a building, opposed to 8.2% in Sangli and Kolhapur, 7% in Dhule, and less than 5%
in all other districts. They also exhibit much lower levels of trust toward neighbors and nearly non-
existent community support (only 2 out of 143 households in Mumbai and Thane ask for community
support in case of need, against more than 12% elsewhere in the sample). Yet, removing both districts
from the estimation sample does not alter significantly the results. The only changes concern the
presence of unsafe places, whose effect becomes smaller while remaining significant at the 5% level,
and the neighborhood-mean of trust toward neighbors, whose effect is now larger in absolute value
and becomes statistically significant (p-value<0.1).
17
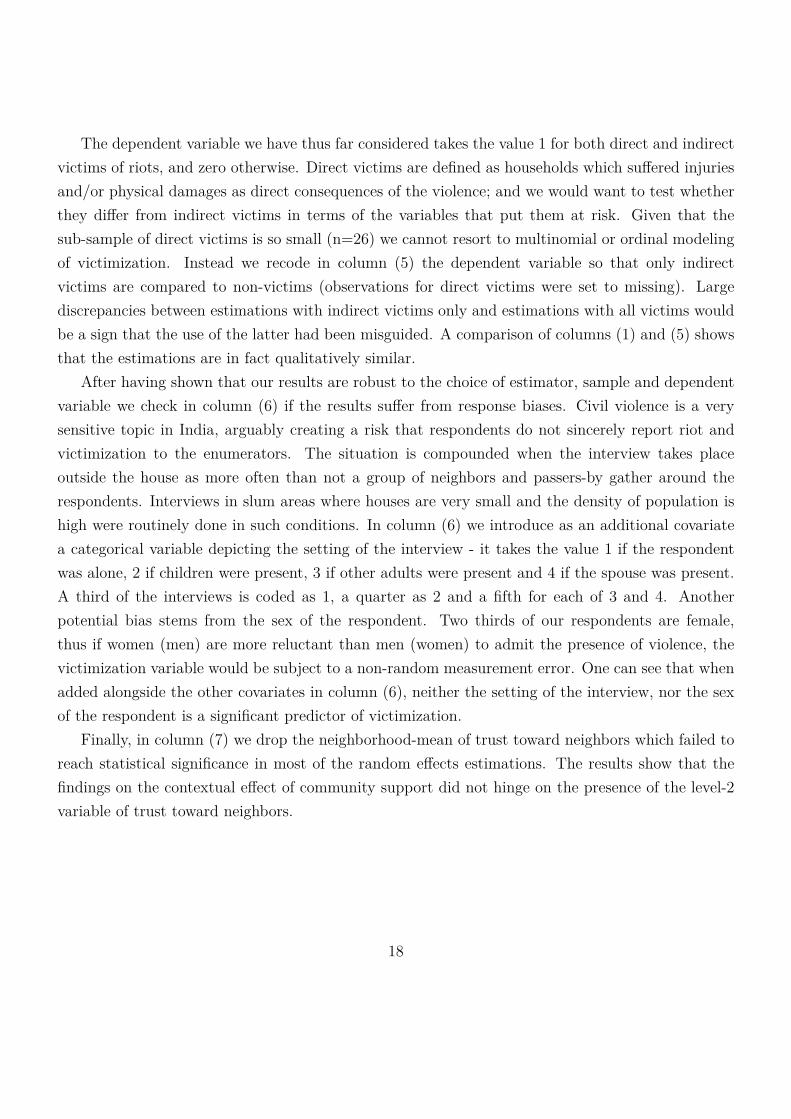
The dependent variable we have thus far considered takes the value 1 for both direct and indirect
victims of riots, and zero otherwise. Direct victims are defined as households which suffered injuries
and/or physical damages as direct consequences of the violence; and we would want to test whether
they differ from indirect victims in terms of the variables that put them at risk. Given that the
sub-sample of direct victims is so small (n=26) we cannot resort to multinomial or ordinal modeling
of victimization. Instead we recode in column (5) the dependent variable so that only indirect
victims are compared to non-victims (observations for direct victims were set to missing). Large
discrepancies between estimations with indirect victims only and estimations with all victims would
be a sign that the use of the latter had been misguided. A comparison of columns (1) and (5) shows
that the estimations are in fact qualitatively similar.
After having shown that our results are robust to the choice of estimator, sample and dependent
variable we check in column (6) if the results suffer from response biases. Civil violence is a very
sensitive topic in India, arguably creating a risk that respondents do not sincerely report riot and
victimization to the enumerators. The situation is compounded when the interview takes place
outside the house as more often than not a group of neighbors and passers-by gather around the
respondents. Interviews in slum areas where houses are very small and the density of population is
high were routinely done in such conditions. In column (6) we introduce as an additional covariate
a categorical variable depicting the setting of the interview - it takes the value 1 if the respondent
was alone, 2 if children were present, 3 if other adults were present and 4 if the spouse was present.
A third of the interviews is coded as 1, a quarter as 2 and a fifth for each of 3 and 4. Another
potential bias stems from the sex of the respondent. Two thirds of our respondents are female,
thus if women (men) are more reluctant than men (women) to admit the presence of violence, the
victimization variable would be subject to a non-random measurement error. One can see that when
added alongside the other covariates in column (6), neither the setting of the interview, nor the sex
of the respondent is a significant predictor of victimization.
Finally, in column (7) we drop the neighborhood-mean of trust toward neighbors which failed to
reach statistical significance in most of the random effects estimations. The results show that the
findings on the contextual effect of community support did not hinge on the presence of the level-2
variable of trust toward neighbors.
18
4.2.4 Endogeneity
We have seen that a correlation between the covariates and the random effects was unlikely to bias
the results. However, endogeneity is still a problem if the covariates are correlated with the error
term (ehnd), an issue unrelated to the choice of random effects over fixed effects. The main cause of
concern that such endogeneity is present is the plausibility of reverse causation in the estimations
of tables 5 and 6. There are at least two channels through which reverse causation can operate: (i)
riots and/or victimization increase the feeling of vulnerability among people affected, and (ii) riot
and/or victimization increase actual vulnerabilities. The former hypothesizes that the experience of
a traumatic event makes people more aware of potential risks (such as the presence of unsafe places)
and their actual vulnerabilities. The latter points out that riots exert actual impacts on the very
dimensions of vulnerability that are emphasized in the paper.
We do not have pre-riot data that could be used as controls, nor is there a credible and strong
enough set of instruments available for each covariate we looked at. Yet, we can provide some
indirect evidence that the results we presented so far have a causal value. To start with, most
of the independent variables we used reflect behaviors as opposed to subjective valuations, which
weaken the risk identified in point (i). For instance, for assessing economic vulnerability, we use
membership in self-help groups and whether households normally use savings in case of need in
our preferred specification. These are variables describing behaviors which are not subject to be
affected by a change in perceptions due to a riot. The same applies to our most important variable
for social capital: whether households normally ask for community support in case of need.13 We
believe that the risk of reverse causality due to a perception bias is acute for one important covariate:
whether respondents report the presence of an unsafe place nearby. Experience of rioting is indeed
likely to make respondents especially aware of all forms of physical insecurities they might not
have fully internalized prior to it. To check whether this concern is justified, we run our preferred
specification with an additional variable: whether the respondents report concerns about crime in
their neighborhood. This variable is clearly excludable from the structural equation as concerns
about crime should not impact victimization, as opposed to actual crime, which is approximated
by and controlled for by variable on the presence of unsafe place in the area. The inclusion of the
variable of concerns about crime does not change the results, and the coefficient associated with the
additional variable is not statistically different from zero as can be seen from table 7 (column 1).
The lack of influence of feeling about crime on victimization is comforting us that the results were
not driven by point (i).
19
The second cause for concern about endogeneity is that riot and/or victimization may actually
change vulnerabilities rather than the other way around. The focus on indirect victims greatly
mitigates this concern regarding economic vulnerability. The overwhelming majority of victims in
our sample did not report direct financial losses that would come from injuries or physical damages,
and it is thus highly unlikely that the association between lack of savings and victimization is due
to reverse causality.14 In addition, the estimated effect of income per capita is positive which would
suggest a very counter-intuitive impact of rioting if reverse causality was behind the result.
The issue of reverse causality is particularly acute for the variable of community support. We
held the view that socially isolated households find it difficult to withstand the effect of riots, while
neighborhoods in which the extent of community support is weak either experience more riots (a
la Varshney) and/or constitute unfavorable environments that make households vulnerable to the
effects of riots. If we replicate our preferred estimation (column (6) of table 5) on the sub-sample of
neighborhoods in which at least 50% of households reported a riot, the effect of community support
at both the household level and the neighborhood level remain qualitatively similar (column (2),
table 7). The fact that even within neighborhoods in which a major riot occurred, the contextual
effect of community support remains significant, contradicts Varshney’s results. Indeed it would
predict an absence of effect as all these neighborhoods experienced a riot.15 The existence of reverse
causality would imply that victimized households become less likely to ask for community support
and that the experience of riot in a neighborhood undermines the extent of solidarity networks. We
believe that the first part of the argument is not very compelling: why would victimized households
refrain from asking help to the community unless they feel their victimization is directly driven
by the community letting them down? In that case, we are back to our initial argument that
likelihood of victimization increases with social isolation. At the neighborhood level, it is very
credible that riots may undermine the strength of social fabric, even more so in heterogeneous
environments. In column (3) of table 7, we interact the neighborhood-mean of community support
with caste fractionalization. We find that the effect of community support is maximal in homogeneous
neighborhoods and become increasingly small with the index of caste fractionalization. The sign
of the interactive term is consistent with a reverse causality where heterogeneous neighborhoods
witness a drop in social networks after episodes of rioting. However, we do find that in homogeneous
neighborhoods the contextual effect of community support remains negative and significant, while
under the pure reverse causality hypothesis the coefficient should be zero. In other words, while we
are confident that the level-1 causal effect of community support goes from lack of integration within
local networks to victimization, there is strong evidence that the large contextual effect of community
20
support is partly (but not fully) the result of reverse causality. Such potential consequences of rioting
are of interest in their own right. To explore them would be beyond the scope of this paper but
these consequences will be the object of future research by the authors...
5 Conclusion
Despite a large literature on civil violence in India, quantitative evidence on the effects of violence
on populations and neighborhoods exposed to persistent forms of rioting is very limited. This paper
analyzed empirically the determinants of riot victimization at the household level across the state of
Maharashtra, where household effects were modeled in a multilevel framework, inserted within neigh-
borhood and district dynamics. The analysis tested empirically four broad potential determinants of
riot victimization identified in previous literature: the role of physical insecurity, identity markers,
social capital and economic vulnerability. The empirical analysis adopted a multilevel framework
allowing the integration of household effects within neighborhood and district effects, dependence of
residuals between households and contextual effects.
The main results show that households that (i) are economically vulnerable, (ii) live in the
vicinity of a crime-prone area, and (iii) are not able to rely on community support are considerably
more prone to suffer from riots than other households. All else equal, income per capita increases
victimization, presumably through an opportunity cost mechanism. We found further that relatively
affluent neighborhoods and those characterized by large caste fragmentation are more riot-prone
than disfranchised and homogeneous ones. We also found that victimization is more common in
neighborhoods with weaker social interactions, but some evidence suggests that social interactions
may be a consequence of rioting rather than its cause.
The paper aimed to contribute to a better understanding of the consequences of civil violence in
India for those living in areas where violence is endemic and persistent. The results provide ample
evidence for the destructive effects of riots and persistent forms of violence across many households
in Maharashtra, emphasizing the need for the Government of India to focus more attention on the
rise and persistence of communal violence in India. India’s economic, social and political landscape
has been changing dramatically since the early 1990s, when a large program of economic liberaliza-
tion and de-regularization resulted in impressive increases in economic growth across the country.
However, India’s track record in terms of economic growth and economic internationalization has
been accompanied by the persistence of pockets of poverty, rising inequalities in terms of political
representation, income opportunities and social mobility and increased social and political tensions.
21
In particular, increased civil conflict, the rise of identity-based politics and inter-communal tensions
poses a considerable challenge to India’s future economic development processes and the survival
of its long-held values of pluralism and social justice. This paper represented a first attempt at
identifying and analyzing important micro-foundations of processes of violence victimization that
continue to rise and persist across many communities, cities and states in India.
22
Notes
1El Salvador, Guatemala and Nicaragua, amongst others, constitute recent examples of countries where civil wars
were preceded by civil protests and widespread rioting (see Brockett 1990, Seligson & McElhinny 1996, Wood 2003).2The Maharashtra Longitudinal Survey on Civil Violence and Welfare (MHLS) is a unique panel dataset of house-
holds collected by the authors. The first wave - which we use in this paper - was collected in March-May 2010. The
second wave was collected in March-May 2012 and is currently being processed, cleaned and analyzed.3The delimitation information on the precise boundaries of these voting booths was obtained from the Maharashtra
Election Commission.4Direct victims are defined as households which suffered from injuries and/or physical damages from the violence.5Not all riots involve Hindus and Muslims. For instance, there have been large-scale rioting between Hindus and
Christians in Khandamal, in the state of Orissa in August 2008. Above 4000 houses were burnt and 38 people killed
in the process. The term riot is also problematic as violence is usually organized and can in some instances be better
described as pogroms (see Brass 1996, Brass 2006b).6The government of India classifies people based on their caste status: ST refers to Scheduled Tribes, SC to
Scheduled Castes, and OBC to Other Backward Castes.7In his novel Curfew in the City high ranking police officer V.N.Rai (2005) vividly depicts the dramatic consequences
of the curfew in a poor household hosting a pregnant woman.8The within effect is given by the coefficient associated with the demeaned covariate (xhnd − xnd) and the between
effect with the cluster-mean covariate xnd. Had we chosen to cluster-mean the covariates, equation (1) would have
yielded directly the within and between coefficients. Since we are not interested in between effects but rather in within
and contextual effects we instead chose the specification shown in equation 1 (Rabe-Hesketh & Skrondal 2012, p. 158).9Results not shown but available upon request.
10A chowk is a major crossroads.11Polarization indexes have been tried as an alternative to fractionalization, but they never reached significance.12The estimated standard errors are robust to a neighborhood cluster effect in column (2) and to a district cluster
effect in column (3).13The variable of trust toward neighbors is in contrast prone to perception bias, but it does play a much weaker
role in the results than the variable of community support.14Results with indirect victims as the dependent variable showed that this association was not driven by the small
number of direct victims.15Incidentally, all the other level-2 covariates lose statistical significance, as expected.
23
References
Barron, Patrick, Kai Kaiser & Menno Pradhan. 2004. “Local Conflict in Indonesia: Measuring
Incidence and Identifying Patterns.” World Bank Policy Research Working Paper No. 3384.
Brass, Paul R. 1996. Riots and Pogroms. London and New York: Macmillan and NYU Press.
Brass, Paul R. 1997. Theft of an Idol:Text and Context in the Representation of Collective Violence.
Princeton, NJ: Princeton University Press.
Brass, Paul R. 2006a. “Collective Violence, Human Rights, and the Politics of Curfew.” Journal of
Human Rights 5:323–340.
Brass, Paul R. 2006b. Forms of Collective Violence: Riots, Pogroms, and Genocide in Modern India.
Gurgaon: Three Essays Collective.
Brockett, C D. 1990. Land, Power, and Poverty: Agrarian Transformation and Political Conflict in
Central America. Boston, MA: Unwin Hyman.
Chamberlain, G. 1980. “Analysis of Covariance With Qualitative Data.” Review of Economic Studies
47:225–238.
Chatterji, Roma & Deepak Mehta. 2007. Living with Violence: An Anthropology of Events and
Everyday Life. Routlege India, New Delhi.
Collins, W.J. & R.A. Margo. 2004a. “The Economic Aftermath of the 1960s Riots: Evidence from
Property Values.” NBER Working Paper 10493.
Collins, W.J. & R.A. Margo. 2004b. The Labor Market Effects of the 1960s Riots. In Brookings-
Wharton Papers on Urban Affairs 2004, ed. W. Gale & J. Pack. Washington, DC: Brookings
Institution pp. 1–34.
Deininger, K. 2003. “Causes and Consequences of Civil Strife: Micro-Level Evidence from Uganda.”
Oxford Economic Papers 55:579–606.
Engineer, Asghar Ali. 1991. The Causes of Communal Riots in the Post-Partition Period in India.
In Communal Riots in Post-Independence India, ed. Asghar Ali Engineer. Hyderabad: Sangam
Books Limited.
24
Fielding, Antony. 2004. “The Role of the Hausman Test and Whether Higher Level Effects Should
be Treated as Random or Fixed.” Multilevel Modelling Newsletter 16(2):3–9.
Gelman, Andrew & Jennifer Hill. 2012. Data Analysis Using Regression and Multilevel/Hierarchical
Models. Cambridge University Press.
Gupte, Jaideep. 2012. “WhatŠs civil about intergroup violence? Five inadequacies of communal and
ethnic constructs of urban riots.” Brighton: MICROCON. Research Working Paper 62.
Hansen, Thomas Blom. 1996. “The Vernacularisation of Hindutva: The BJP and Shiv Sena in Rural
Maharashtra.” Contributions to Indian Sociology 30(2).
Hansen, Thomas Blom. 2000. “Predicaments of Secularism: Muslim Identities and Politics in Mum-
bai.” The Journal of the Royal Anthropological Institute 6(2):255–272.
Jha, S. 2008. “Trade, Institutions and Religious Tolerance: Evidence from India.” Unpublished
Manuscript.
Klinken, Gerry von. 2007. Communal Violence and Democratization in Indonesia; Small Town Wars.
London: Routledge.
Mitra, Anirban & Debraj Ray. 2010. “Implications of an Economic Theory of Conflict: Hindu-Muslim
Violence in India.” Unpublished Manuscript.
Montalvo, J.G. & M. Reynal-Querol. 2005. “Ethnic polarization, potential conflict and civil war.”
American Economic Review 95:796–816.
Mundlak, Yair. 1978. “On the Pooling of Time Series and Cross Section Data.” Econometrica
46(1):69–85.
Murshed, S.M. & M.Z. Tadjoeddin. 2009. “Revisiting the Greed and Grievance Explanations for
Violent Internal Conflict.” Journal of International Development 21:87–111.
Rabe-Hesketh, Sophia & Anders Skrondal. 2012. Multilevel and Longitudinal Modeling Using Stata.
Stata Press.
Rai, Vibhuti Narain. 2005. Curfew in the City. Roli Books Pvt Ltd.
25
Raudenbusch, Stephen W & Anthony S Bryk. 2002. Hierarchical Linear Models: Applications and
Data Analysis Methods. Sage Publications.
Seligson, Mitchell A & Vincent McElhinny. 1996. “Low Intensity Warfare, High Intensity Death:
The Demographic Impact of the Wars in El Salvador and Nicaragua.” Canadian Journal of
Latin American and Caribbean Studies 21(42):211–241.
Snyders, Tom. A. B & Johannes Berkhof. 2008. Diagnostics Checks for Multilevel Models. In Hand-
book of Multilevel Analysis, ed. J. de Leeuw & F. Meijer. New York: Springer pp. 141–175.
Tambiah, Stanley J. 1996. Leveling Crowds: Ethnonationalist Conflicts and Collective Violence in
South Asia. Berkeley, CA: Universoty of California Press.
Tambiah, Stanley J. 2005. “Urban Riots and Cricket in South Asia: A Postscript to ’Leveling
Crowds’.” Modern Asian Studies 39(4):897–927.
Varshney, Ashutosh. 2002. Ethnic Conflict and Civic Life: Hindus and Muslims in India. New
Haven, CT: Yale University Press.
Wilkinson, Steven I. 2004. Votes and Violence: Electoral Competition and Ethnic Riots in India.
Cambridge University Press.
Wilkinson, Steven I. 2005. Religious Politics and Communal Violence. New Delhi: Oxford University
Press.
Wood, Elisabeth Jean. 2003. Insurgent Collective Action and Civil War in El Salvador. New York,
NY: Cambridge University Press.
World Bank. 2011. World Development Report 2010/2011: Conflict, Security, and Development.
Technical report The World Bank, Washington, DC.
26

Figure 1: Sampled Districts in the Maharashtra Longitudinal Survey of Civil Violence and Welfare
Sampled districts
Non sampled districts
27
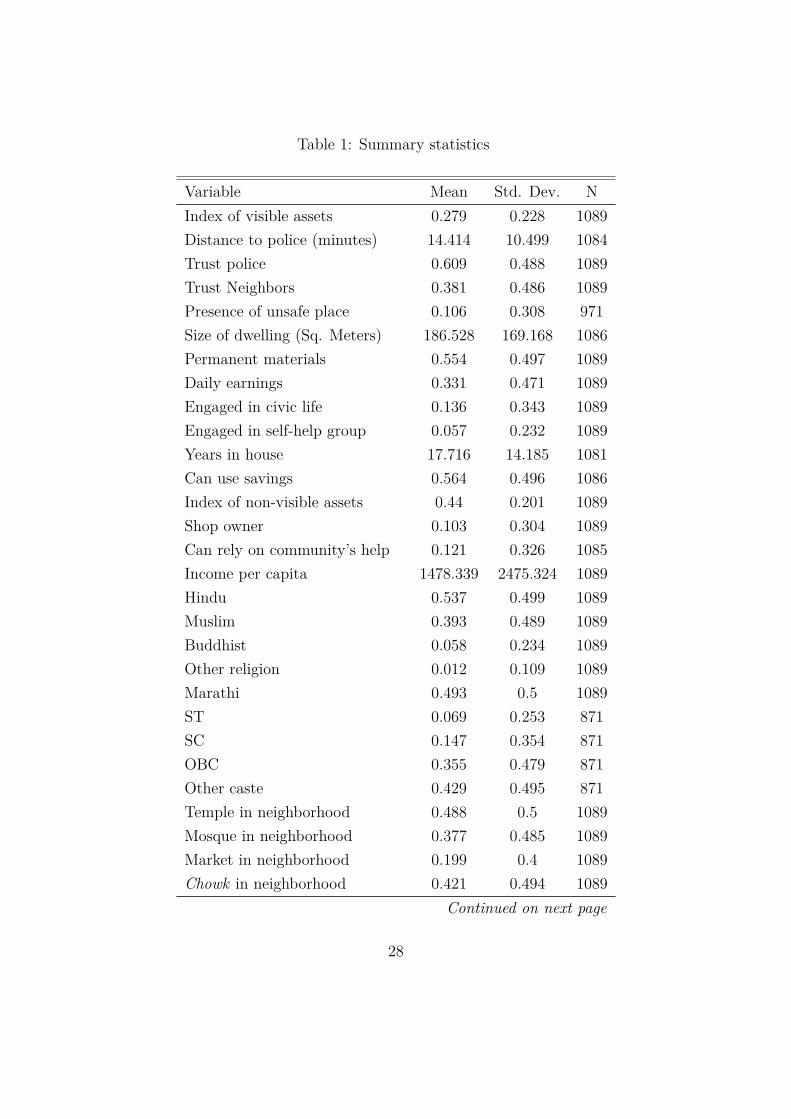
Table 1: Summary statistics
Variable Mean Std. Dev. N
Index of visible assets 0.279 0.228 1089
Distance to police (minutes) 14.414 10.499 1084
Trust police 0.609 0.488 1089
Trust Neighbors 0.381 0.486 1089
Presence of unsafe place 0.106 0.308 971
Size of dwelling (Sq. Meters) 186.528 169.168 1086
Permanent materials 0.554 0.497 1089
Daily earnings 0.331 0.471 1089
Engaged in civic life 0.136 0.343 1089
Engaged in self-help group 0.057 0.232 1089
Years in house 17.716 14.185 1081
Can use savings 0.564 0.496 1086
Index of non-visible assets 0.44 0.201 1089
Shop owner 0.103 0.304 1089
Can rely on community’s help 0.121 0.326 1085
Income per capita 1478.339 2475.324 1089
Hindu 0.537 0.499 1089
Muslim 0.393 0.489 1089
Buddhist 0.058 0.234 1089
Other religion 0.012 0.109 1089
Marathi 0.493 0.5 1089
ST 0.069 0.253 871
SC 0.147 0.354 871
OBC 0.355 0.479 871
Other caste 0.429 0.495 871
Temple in neighborhood 0.488 0.5 1089
Mosque in neighborhood 0.377 0.485 1089
Market in neighborhood 0.199 0.4 1089
Chowk in neighborhood 0.421 0.494 1089
Continued on next page
28
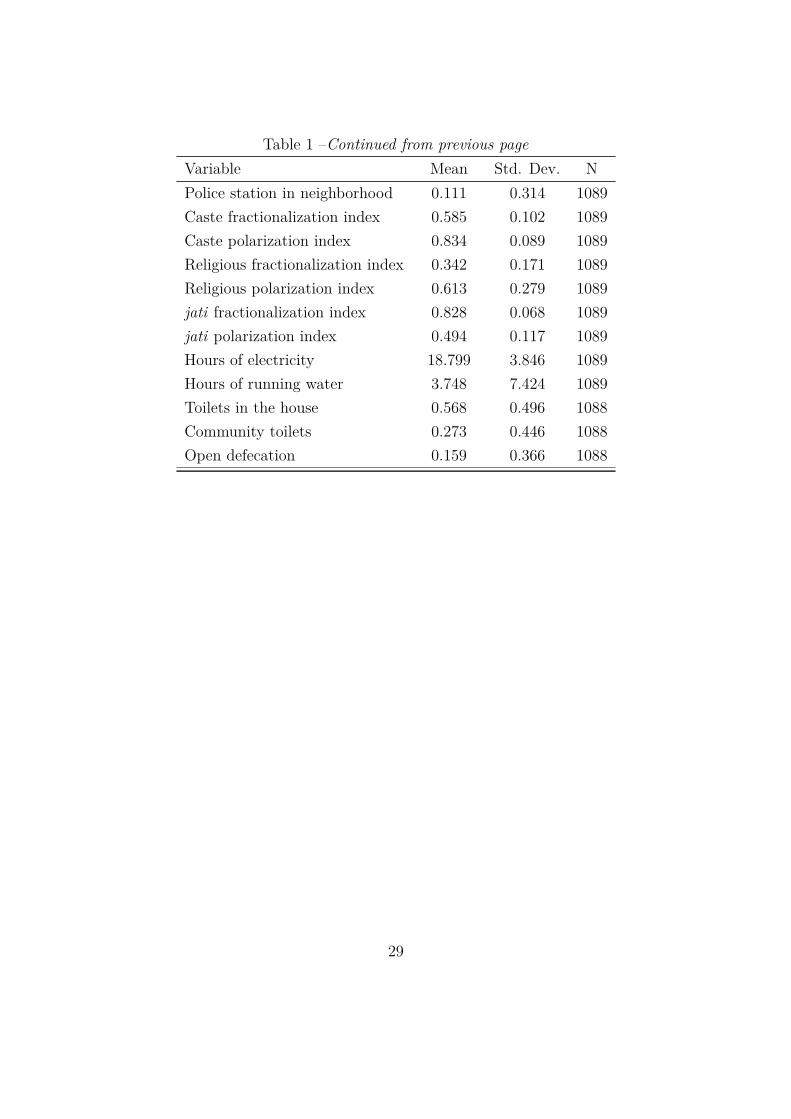
Table 1 –Continued from previous page
Variable Mean Std. Dev. N
Police station in neighborhood 0.111 0.314 1089
Caste fractionalization index 0.585 0.102 1089
Caste polarization index 0.834 0.089 1089
Religious fractionalization index 0.342 0.171 1089
Religious polarization index 0.613 0.279 1089
jati fractionalization index 0.828 0.068 1089
jati polarization index 0.494 0.117 1089
Hours of electricity 18.799 3.846 1089
Hours of running water 3.748 7.424 1089
Toilets in the house 0.568 0.496 1088
Community toilets 0.273 0.446 1088
Open defecation 0.159 0.366 1088
29
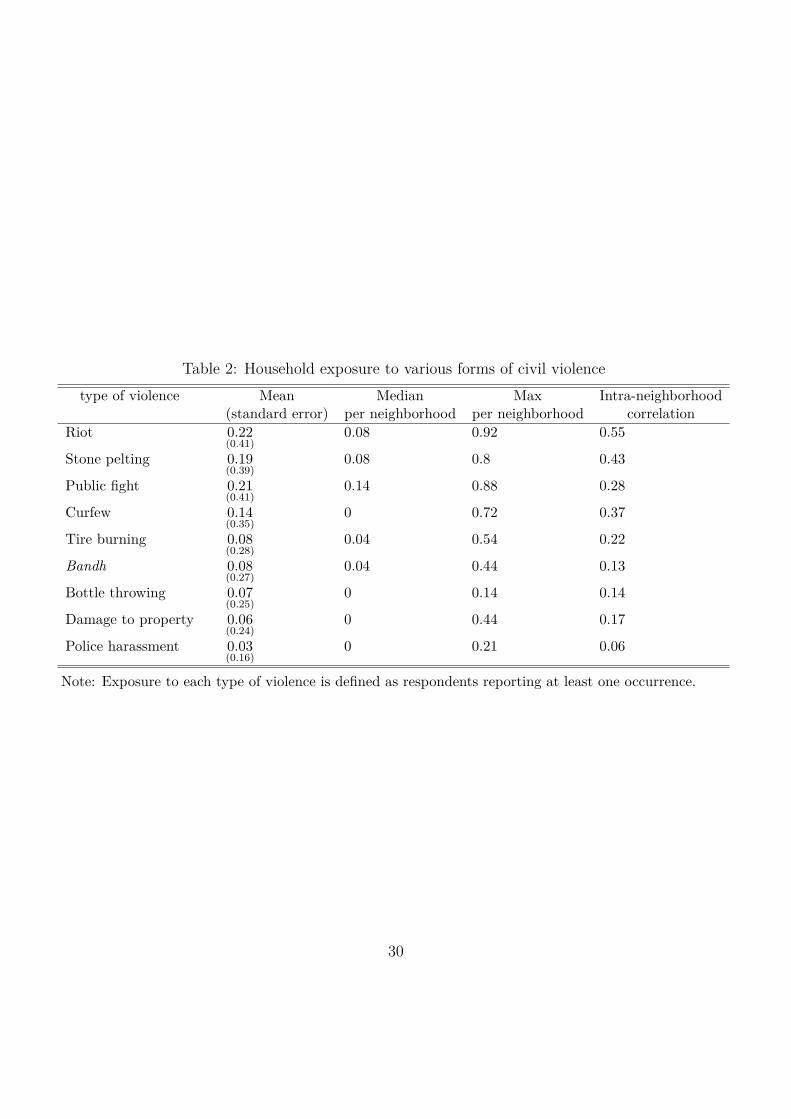
Table 2: Household exposure to various forms of civil violence
type of violence Mean Median Max Intra-neighborhood(standard error) per neighborhood per neighborhood correlation
Riot 0.22(0.41)
0.08 0.92 0.55
Stone pelting 0.19(0.39)
0.08 0.8 0.43
Public fight 0.21(0.41)
0.14 0.88 0.28
Curfew 0.14(0.35)
0 0.72 0.37
Tire burning 0.08(0.28)
0.04 0.54 0.22
Bandh 0.08(0.27)
0.04 0.44 0.13
Bottle throwing 0.07(0.25)
0 0.14 0.14
Damage to property 0.06(0.24)
0 0.44 0.17
Police harassment 0.03(0.16)
0 0.21 0.06
Note: Exposure to each type of violence is defined as respondents reporting at least one occurrence.
30
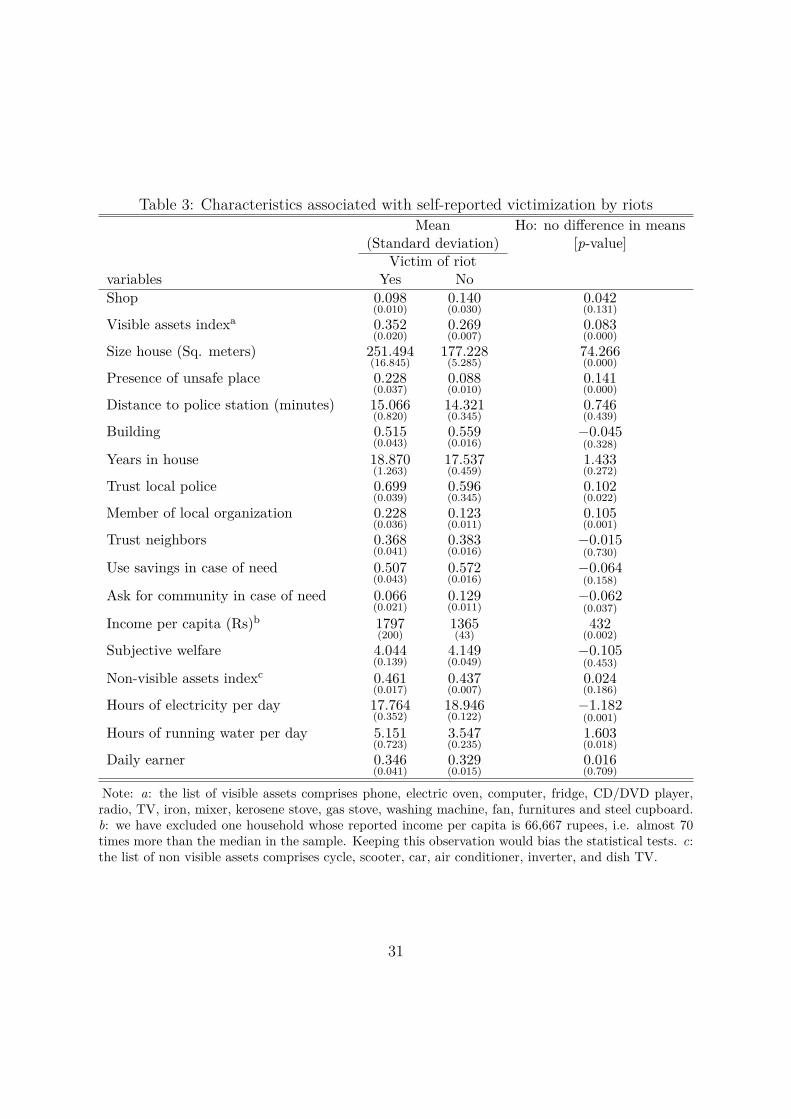
Table 3: Characteristics associated with self-reported victimization by riotsMean Ho: no difference in means
(Standard deviation) [p-value]Victim of riot
variables Yes No
Shop 0.098(0.010)
0.140(0.030)
0.042(0.131)
Visible assets indexa 0.352(0.020)
0.269(0.007)
0.083(0.000)
Size house (Sq. meters) 251.494(16.845)
177.228(5.285)
74.266(0.000)
Presence of unsafe place 0.228(0.037)
0.088(0.010)
0.141(0.000)
Distance to police station (minutes) 15.066(0.820)
14.321(0.345)
0.746(0.439)
Building 0.515(0.043)
0.559(0.016)
−0.045(0.328)
Years in house 18.870(1.263)
17.537(0.459)
1.433(0.272)
Trust local police 0.699(0.039)
0.596(0.345)
0.102(0.022)
Member of local organization 0.228(0.036)
0.123(0.011)
0.105(0.001)
Trust neighbors 0.368(0.041)
0.383(0.016)
−0.015(0.730)
Use savings in case of need 0.507(0.043)
0.572(0.016)
−0.064(0.158)
Ask for community in case of need 0.066(0.021)
0.129(0.011)
−0.062(0.037)
Income per capita (Rs)b 1797(200)
1365(43)
432(0.002)
Subjective welfare 4.044(0.139)
4.149(0.049)
−0.105(0.453)
Non-visible assets indexc 0.461(0.017)
0.437(0.007)
0.024(0.186)
Hours of electricity per day 17.764(0.352)
18.946(0.122)
−1.182(0.001)
Hours of running water per day 5.151(0.723)
3.547(0.235)
1.603(0.018)
Daily earner 0.346(0.041)
0.329(0.015)
0.016(0.709)
Note: a: the list of visible assets comprises phone, electric oven, computer, fridge, CD/DVD player,radio, TV, iron, mixer, kerosene stove, gas stove, washing machine, fan, furnitures and steel cupboard.b: we have excluded one household whose reported income per capita is 66,667 rupees, i.e. almost 70times more than the median in the sample. Keeping this observation would bias the statistical tests. c:the list of non visible assets comprises cycle, scooter, car, air conditioner, inverter, and dish TV.
31
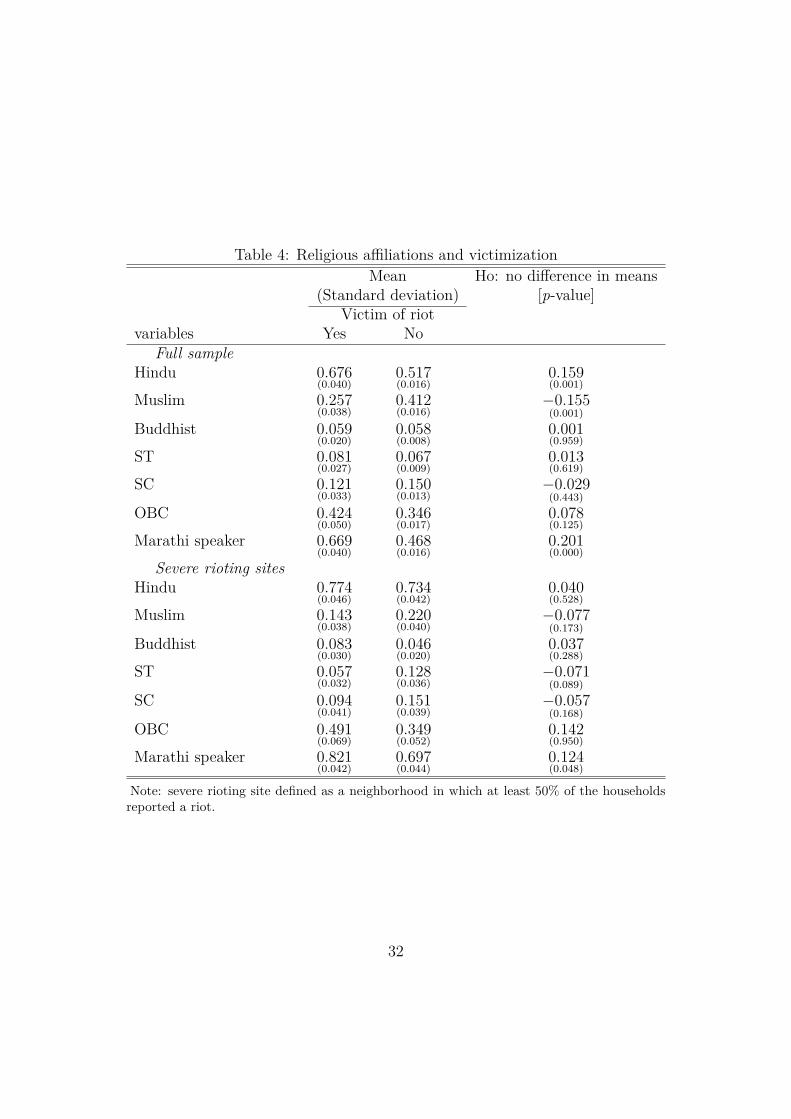
Table 4: Religious affiliations and victimizationMean Ho: no difference in means
(Standard deviation) [p-value]Victim of riot
variables Yes NoFull sample
Hindu 0.676(0.040)
0.517(0.016)
0.159(0.001)
Muslim 0.257(0.038)
0.412(0.016)
−0.155(0.001)
Buddhist 0.059(0.020)
0.058(0.008)
0.001(0.959)
ST 0.081(0.027)
0.067(0.009)
0.013(0.619)
SC 0.121(0.033)
0.150(0.013)
−0.029(0.443)
OBC 0.424(0.050)
0.346(0.017)
0.078(0.125)
Marathi speaker 0.669(0.040)
0.468(0.016)
0.201(0.000)
Severe rioting sitesHindu 0.774
(0.046)0.734(0.042)
0.040(0.528)
Muslim 0.143(0.038)
0.220(0.040)
−0.077(0.173)
Buddhist 0.083(0.030)
0.046(0.020)
0.037(0.288)
ST 0.057(0.032)
0.128(0.036)
−0.071(0.089)
SC 0.094(0.041)
0.151(0.039)
−0.057(0.168)
OBC 0.491(0.069)
0.349(0.052)
0.142(0.950)
Marathi speaker 0.821(0.042)
0.697(0.044)
0.124(0.048)
Note: severe rioting site defined as a neighborhood in which at least 50% of the householdsreported a riot.
32
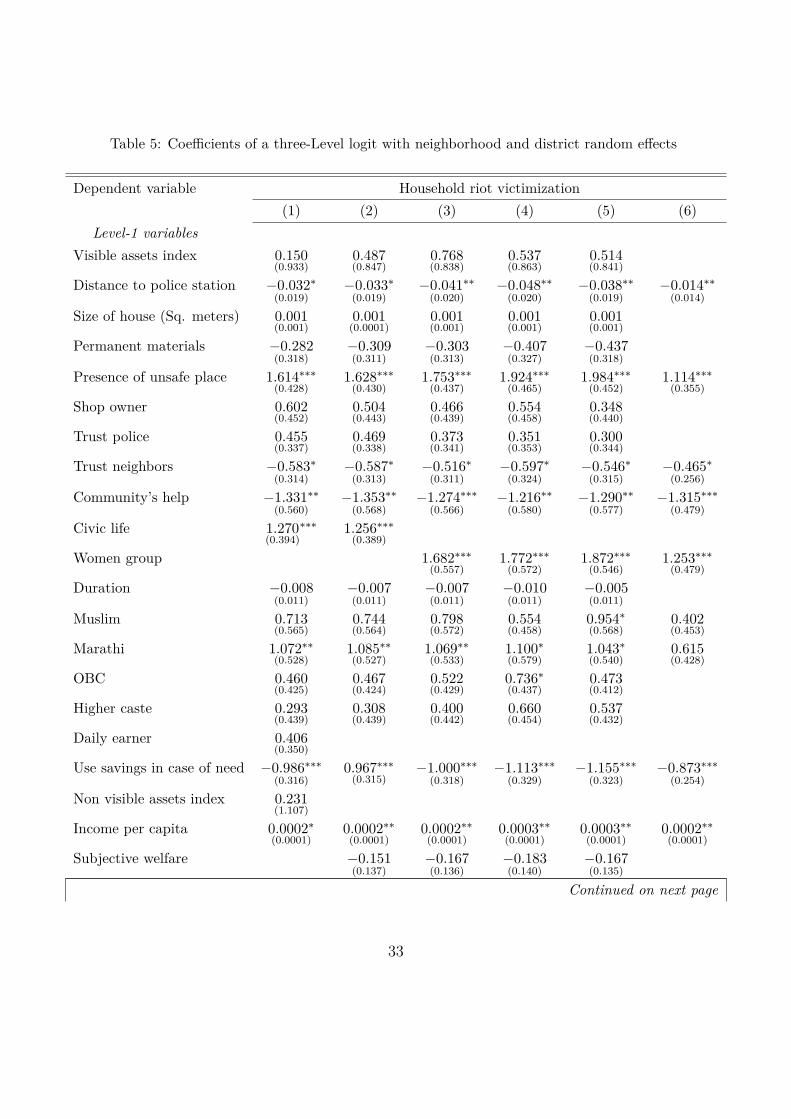
Table 5: Coefficients of a three-Level logit with neighborhood and district random effects
Dependent variable Household riot victimization
(1) (2) (3) (4) (5) (6)
Level-1 variables
Visible assets index 0.150(0.933)
0.487(0.847)
0.768(0.838)
0.537(0.863)
0.514(0.841)
Distance to police station −0.032∗
(0.019)−0.033∗
(0.019)−0.041∗∗
(0.020)−0.048∗∗
(0.020)−0.038∗∗
(0.019)−0.014∗∗
(0.014)
Size of house (Sq. meters) 0.001(0.001)
0.001(0.0001)
0.001(0.001)
0.001(0.001)
0.001(0.001)
Permanent materials −0.282(0.318)
−0.309(0.311)
−0.303(0.313)
−0.407(0.327)
−0.437(0.318)
Presence of unsafe place 1.614∗∗∗
(0.428)1.628∗∗∗
(0.430)1.753∗∗∗
(0.437)1.924∗∗∗
(0.465)1.984∗∗∗
(0.452)1.114∗∗∗
(0.355)
Shop owner 0.602(0.452)
0.504(0.443)
0.466(0.439)
0.554(0.458)
0.348(0.440)
Trust police 0.455(0.337)
0.469(0.338)
0.373(0.341)
0.351(0.353)
0.300(0.344)
Trust neighbors −0.583∗
(0.314)−0.587∗
(0.313)−0.516∗
(0.311)−0.597∗
(0.324)−0.546∗
(0.315)−0.465∗
(0.256)
Community’s help −1.331∗∗
(0.560)−1.353∗∗
(0.568)−1.274∗∗∗
(0.566)−1.216∗∗
(0.580)−1.290∗∗
(0.577)−1.315∗∗∗
(0.479)
Civic life 1.270(0.394)
∗∗∗ 1.256∗∗∗
(0.389)
Women group 1.682∗∗∗
(0.557)1.772∗∗∗
(0.572)1.872∗∗∗
(0.546)1.253∗∗∗
(0.479)
Duration −0.008(0.011)
−0.007(0.011)
−0.007(0.011)
−0.010(0.011)
−0.005(0.011)
Muslim 0.713(0.565)
0.744(0.564)
0.798(0.572)
0.554(0.458)
0.954∗
(0.568)0.402(0.453)
Marathi 1.072∗∗
(0.528)1.085∗∗
(0.527)1.069∗∗
(0.533)1.100∗
(0.579)1.043∗
(0.540)0.615(0.428)
OBC 0.460(0.425)
0.467(0.424)
0.522(0.429)
0.736∗
(0.437)0.473(0.412)
Higher caste 0.293(0.439)
0.308(0.439)
0.400(0.442)
0.660(0.454)
0.537(0.432)
Daily earner 0.406(0.350)
Use savings in case of need −0.986∗∗∗
(0.316)0.967∗∗∗
(0.315)−1.000∗∗∗
(0.318)−1.113∗∗∗
(0.329)−1.155∗∗∗
(0.323)−0.873∗∗∗
(0.254)
Non visible assets index 0.231(1.107)
Income per capita 0.0002∗
(0.0001)0.0002∗∗
(0.0001)0.0002∗∗
(0.0001)0.0003∗∗
(0.0001)0.0003∗∗
(0.0001)0.0002∗∗
(0.0001)
Subjective welfare −0.151(0.137)
−0.167(0.136)
−0.183(0.140)
−0.167(0.135)
Continued on next page
33
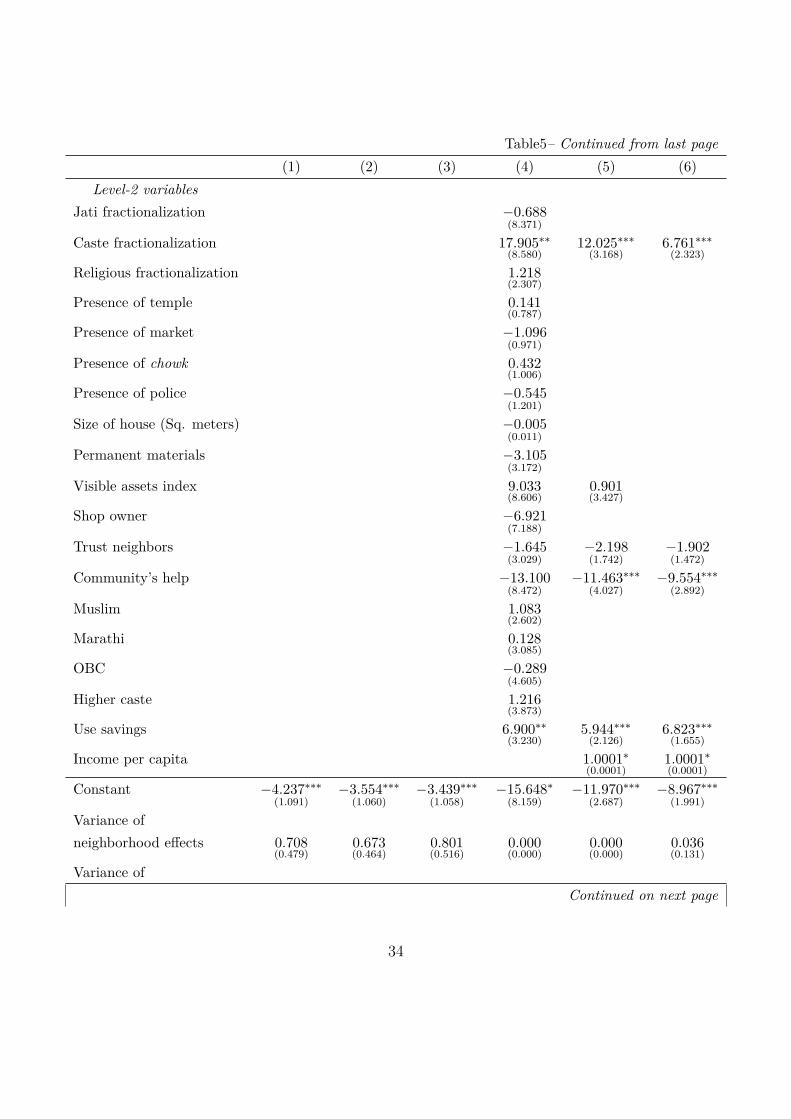
Table5– Continued from last page
(1) (2) (3) (4) (5) (6)
Level-2 variables
Jati fractionalization −0.688(8.371)
Caste fractionalization 17.905∗∗
(8.580)12.025∗∗∗
(3.168)6.761∗∗∗
(2.323)
Religious fractionalization 1.218(2.307)
Presence of temple 0.141(0.787)
Presence of market −1.096(0.971)
Presence of chowk 0.432(1.006)
Presence of police −0.545(1.201)
Size of house (Sq. meters) −0.005(0.011)
Permanent materials −3.105(3.172)
Visible assets index 9.033(8.606)
0.901(3.427)
Shop owner −6.921(7.188)
Trust neighbors −1.645(3.029)
−2.198(1.742)
−1.902(1.472)
Community’s help −13.100(8.472)
−11.463∗∗∗
(4.027)−9.554∗∗∗
(2.892)
Muslim 1.083(2.602)
Marathi 0.128(3.085)
OBC −0.289(4.605)
Higher caste 1.216(3.873)
Use savings 6.900∗∗
(3.230)5.944∗∗∗
(2.126)6.823∗∗∗
(1.655)
Income per capita 1.0001∗
(0.0001)1.0001∗
(0.0001)
Constant −4.237∗∗∗
(1.091)−3.554∗∗∗
(1.060)−3.439∗∗∗
(1.058)−15.648∗
(8.159)−11.970∗∗∗
(2.687)−8.967∗∗∗
(1.991)
Variance of
neighborhood effects 0.708(0.479)
0.673(0.464)
0.801(0.516)
0.000(0.000)
0.000(0.000)
0.036(0.131)
Variance of
Continued on next page
34
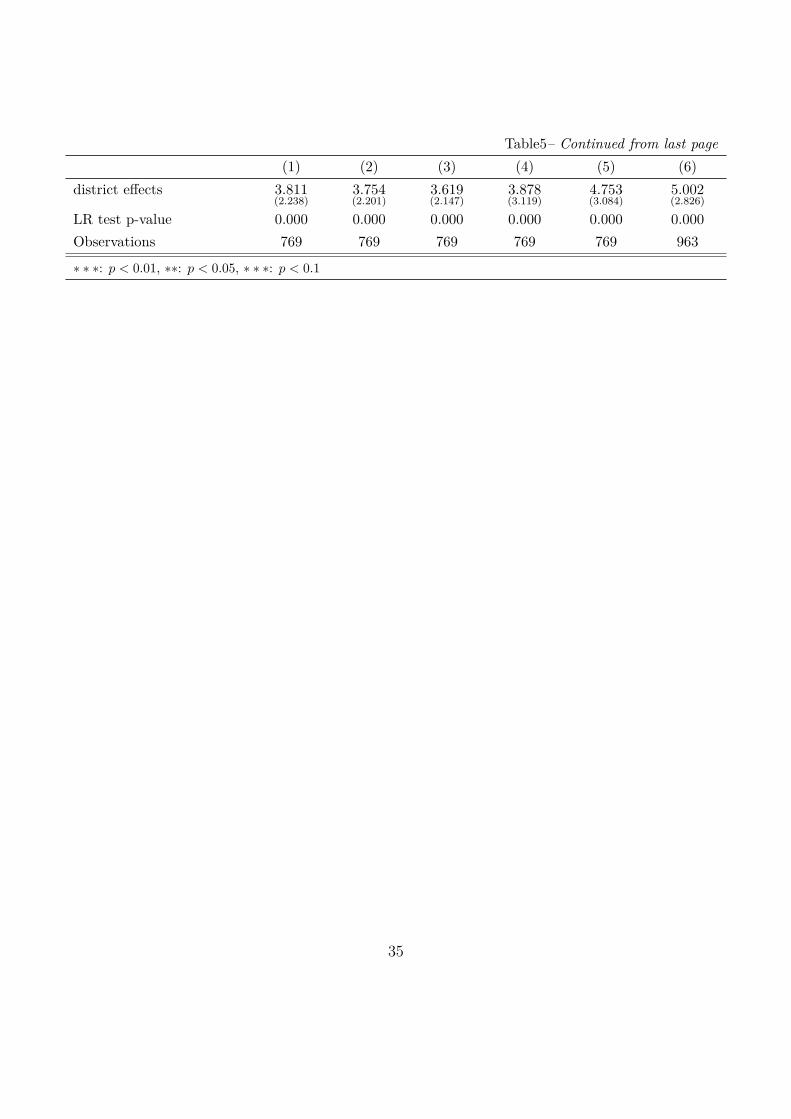
Table5– Continued from last page
(1) (2) (3) (4) (5) (6)
district effects 3.811(2.238)
3.754(2.201)
3.619(2.147)
3.878(3.119)
4.753(3.084)
5.002(2.826)
LR test p-value 0.000 0.000 0.000 0.000 0.000 0.000
Observations 769 769 769 769 769 963
∗ ∗ ∗: p < 0.01, ∗∗: p < 0.05, ∗ ∗ ∗: p < 0.1
35
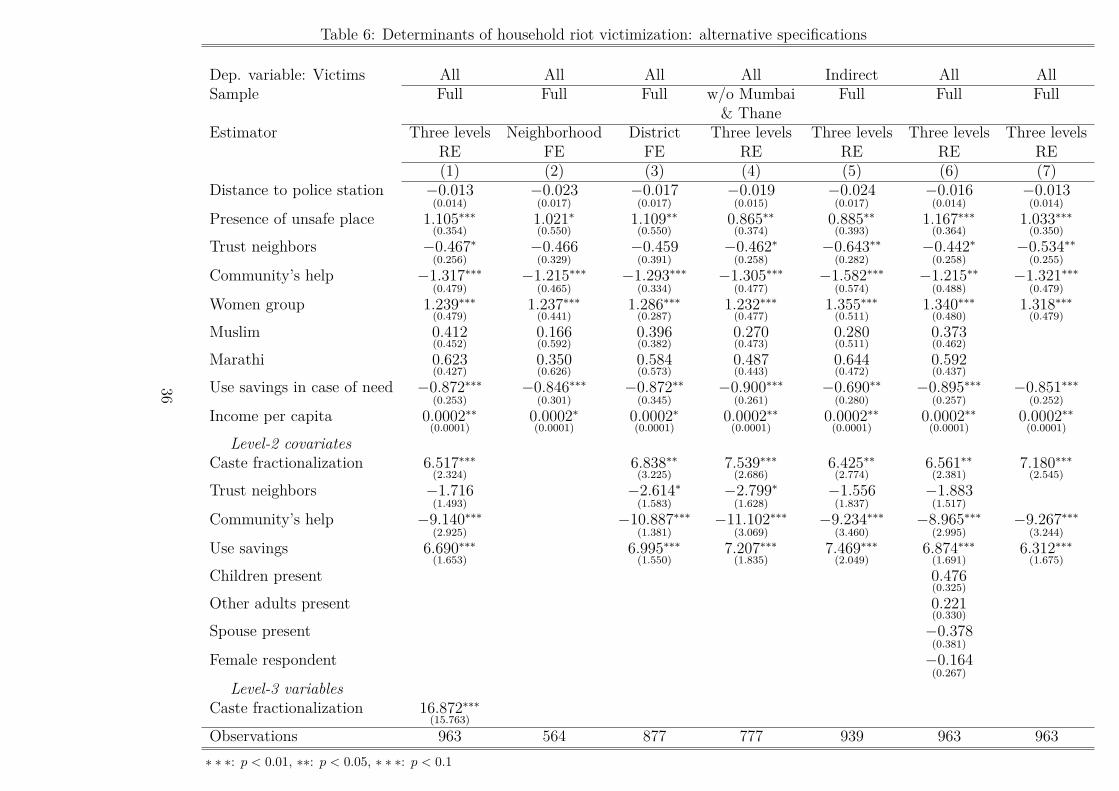
Table 6: Determinants of household riot victimization: alternative specifications
Dep. variable: Victims All All All All Indirect All AllSample Full Full Full w/o Mumbai Full Full Full
& ThaneEstimator Three levels Neighborhood District Three levels Three levels Three levels Three levels
RE FE FE RE RE RE RE(1) (2) (3) (4) (5) (6) (7)
Distance to police station −0.013(0.014)
−0.023(0.017)
−0.017(0.017)
−0.019(0.015)
−0.024(0.017)
−0.016(0.014)
−0.013(0.014)
Presence of unsafe place 1.105∗∗∗
(0.354)1.021∗
(0.550)1.109∗∗
(0.550)0.865∗∗
(0.374)0.885∗∗
(0.393)1.167∗∗∗
(0.364)1.033∗∗∗
(0.350)
Trust neighbors −0.467∗
(0.256)−0.466
(0.329)−0.459
(0.391)−0.462∗
(0.258)−0.643∗∗
(0.282)−0.442∗
(0.258)−0.534∗∗
(0.255)
Community’s help −1.317∗∗∗
(0.479)−1.215∗∗∗
(0.465)−1.293∗∗∗
(0.334)−1.305∗∗∗
(0.477)−1.582∗∗∗
(0.574)−1.215∗∗
(0.488)−1.321∗∗∗
(0.479)
Women group 1.239∗∗∗
(0.479)1.237∗∗∗
(0.441)1.286∗∗∗
(0.287)1.232∗∗∗
(0.477)1.355∗∗∗
(0.511)1.340∗∗∗
(0.480)1.318∗∗∗
(0.479)
Muslim 0.412(0.452)
0.166(0.592)
0.396(0.382)
0.270(0.473)
0.280(0.511)
0.373(0.462)
Marathi 0.623(0.427)
0.350(0.626)
0.584(0.573)
0.487(0.443)
0.644(0.472)
0.592(0.437)
Use savings in case of need −0.872∗∗∗
(0.253)−0.846∗∗∗
(0.301)−0.872∗∗
(0.345)−0.900∗∗∗
(0.261)−0.690∗∗
(0.280)−0.895∗∗∗
(0.257)−0.851∗∗∗
(0.252)
Income per capita 0.0002∗∗
(0.0001)0.0002∗
(0.0001)0.0002∗
(0.0001)0.0002∗∗
(0.0001)0.0002∗∗
(0.0001)0.0002∗∗
(0.0001)0.0002∗∗
(0.0001)
Level-2 covariatesCaste fractionalization 6.517∗∗∗
(2.324)6.838∗∗
(3.225)7.539∗∗∗
(2.686)6.425∗∗
(2.774)6.561∗∗
(2.381)7.180∗∗∗
(2.545)
Trust neighbors −1.716(1.493)
−2.614∗
(1.583)−2.799∗
(1.628)−1.556
(1.837)−1.883
(1.517)
Community’s help −9.140∗∗∗
(2.925)−10.887∗∗∗
(1.381)−11.102∗∗∗
(3.069)−9.234∗∗∗
(3.460)−8.965∗∗∗
(2.995)−9.267∗∗∗
(3.244)
Use savings 6.690∗∗∗
(1.653)6.995∗∗∗
(1.550)7.207∗∗∗
(1.835)7.469∗∗∗
(2.049)6.874∗∗∗
(1.691)6.312∗∗∗
(1.675)
Children present 0.476(0.325)
Other adults present 0.221(0.330)
Spouse present −0.378(0.381)
Female respondent −0.164(0.267)
Level-3 variablesCaste fractionalization 16.872∗∗∗
(15.763)
Observations 963 564 877 777 939 963 963
∗ ∗ ∗: p < 0.01, ∗∗: p < 0.05, ∗ ∗ ∗: p < 0.1
36
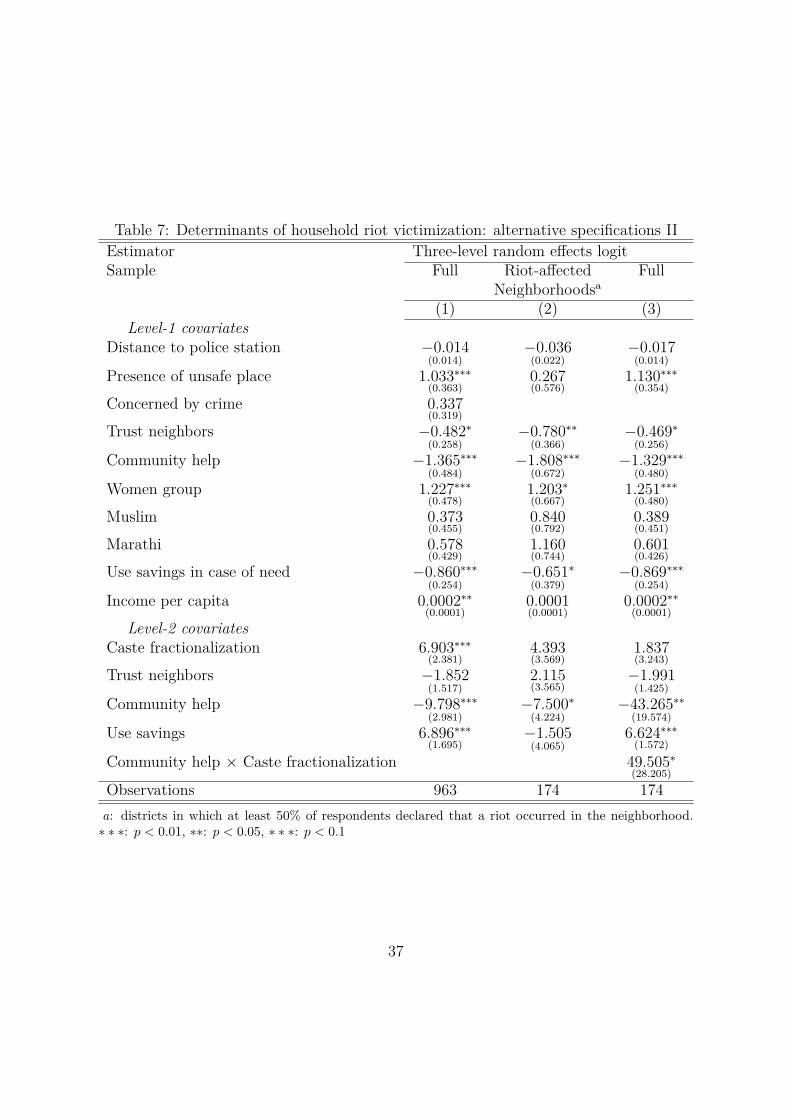
Table 7: Determinants of household riot victimization: alternative specifications IIEstimator Three-level random effects logitSample Full Riot-affected Full
Neighborhoodsa
(1) (2) (3)Level-1 covariates
Distance to police station −0.014(0.014)
−0.036(0.022)
−0.017(0.014)
Presence of unsafe place 1.033∗∗∗
(0.363)0.267(0.576)
1.130∗∗∗
(0.354)
Concerned by crime 0.337(0.319)
Trust neighbors −0.482∗
(0.258)−0.780∗∗
(0.366)−0.469∗
(0.256)
Community help −1.365∗∗∗
(0.484)−1.808∗∗∗
(0.672)−1.329∗∗∗
(0.480)
Women group 1.227∗∗∗
(0.478)1.203∗
(0.667)1.251∗∗∗
(0.480)
Muslim 0.373(0.455)
0.840(0.792)
0.389(0.451)
Marathi 0.578(0.429)
1.160(0.744)
0.601(0.426)
Use savings in case of need −0.860∗∗∗
(0.254)−0.651∗
(0.379)−0.869∗∗∗
(0.254)
Income per capita 0.0002∗∗
(0.0001)0.0001(0.0001)
0.0002∗∗
(0.0001)
Level-2 covariatesCaste fractionalization 6.903∗∗∗
(2.381)4.393(3.569)
1.837(3.243)
Trust neighbors −1.852(1.517)
2.115(3.565)
−1.991(1.425)
Community help −9.798∗∗∗
(2.981)−7.500∗
(4.224)−43.265∗∗
(19.574)
Use savings 6.896∗∗∗
(1.695)−1.505
(4.065)6.624∗∗∗
(1.572)
Community help × Caste fractionalization 49.505∗
(28.205)
Observations 963 174 174
a: districts in which at least 50% of respondents declared that a riot occurred in the neighborhood.∗ ∗ ∗: p < 0.01, ∗∗: p < 0.05, ∗ ∗ ∗: p < 0.1
37
Related Documents