Liberia Institute of Statistics & Geo- Information Services (LISGIS) Household Income and Expenditure Survey 2014 Statistical Abstract March 2016

Welcome message from author
This document is posted to help you gain knowledge. Please leave a comment to let me know what you think about it! Share it to your friends and learn new things together.
Transcript
Liberia Institute of Statistics & Geo-Information Services (LISGIS)
Household Income and Expenditure Survey 2014
Statistical Abstract
March 2016

i
PREFACE AND ACKNOWLEDGEMENTS The 2014 Household Income and Expenditure Survey (HIES) is a nationally representative survey, designed to provide estimates at the National level for both urban and rural areas. The main objective of the survey is to provide household consumption data that will be used to update the market basket and weights for the Consumer Price Index (CPI), develop a national accounts benchmark, and update poverty numbers as well as provide baseline socioeconomic indicators for the Government’s five-year plan, the Agenda for Transformation (AfT), as well as building statistical capacity for the National Statistical System (NSS). The survey has several modules: household identification, survey staff details, household membership roster, education, health, labour, food consumption outside the household and subjective welfare. Others include non-farm enterprises, food security, housing, water and sanitation, consumption of food over past seven days and non-food expenditures (past seven & thirty days). Also, included were non-food expenditures (past twelve months), household assets, assistance (group and other sources of income), credit, cash transfer and gift; shocks, crop production and sales; livestock and aquatic sales and purchases; and household re-contact information. High quality and frequent data is required to facilitate the Government of Liberia’s pursuit to rigorously track indicators for the targets set forth in the AfT. After a period of recovery and reconstruction, the AfT was created, an ambitious agenda whose agenda is to drive forward medium term sustained development aimed at transforming sectors within the economy. The AfT acts as a stepping-stone towards achieving the National Vision: Liberia Rising 2030. The government has not been able to implement a nationally representative HIES since 1964 due to financial and capacity constraints. Delayed implementation of the HIES has widened statistical gaps related to national accounts, prices, and poverty. GDP estimates using the expenditure approach are not available due to a lack of information on the informal sector. The consumer price index (CPI) suffers from outdated goods and services in the consumption basket based on a 1964 survey which was conducted only in Monrovia. A new basket of goods and services needs to be reconstructed and their weights revised. Reliable poverty data is available only for 2007. These statistics are without further delay required for evidence-based policy making and monitoring of results for the AfT and the newly launched Sustainable Development Goals (SDGs) Agenda 2030. The data collection for the HIES 2014 came to a halt after six of the twelve planned months due to the outbreak of the Ebola Virus Disease (EVD) and the resultant state of emergency called by the president of Liberia. In total,

ii
slightly less than 50% of the target sample was enumerated. Thanks to the survey design, the six months of data collected are nationally representative on a quarterly basis. The successful implementation of such a large-scale national survey required substantial human, material and financial resources. The effort of LISGIS was complemented by the substantial support and cooperation received from various stakeholders, and LISGIS would, therefore, like to acknowledge the various stakeholder contributions that led to the successful completion of the survey. First, we would like to thank the sampled households for their patience and cooperation and for devoting time to the field personnel during the numerous visits and questioning. Our appreciation also goes to the field staff and data entry officers for the painstaking manner in which they discharged their duties. Many thanks go to the county authorities as well as the traditional and community leaders for the different ways in which they provided assistance to the field teams to ensure the success of the fieldwork. We are particularly grateful for the financial support received from the Government of Liberia, the World Bank, United States Aid for International Development (USAID), the European Union (EU), Swedish International Development Corporation (SIDA) and the African Development Bank (AfDB) for this effort. We also acknowledge with gratitude special assistance received, both technical and otherwise, from the World Bank throughout the duration of the project. In conclusion, the devoted services of the HIES project secretariat, LISGIS personnel, the report writers and all others who have contributed in varied ways towards the accomplishment of the survey and subsequent production of this report are accordingly acknowledged.

iii
PREFACE AND ACKNOWLEDGEMENTS .................................................................... i LIST OF TABLES .................................................................................................. v LIST OF ACRONYMS AND ABBREVIATIONS ............................................................ vii EXECUTIVE SUMMARY ......................................................................................... ix 1. BACKGROUND INFORMATION ......................................................................... 1
Liberia Country Context ................................................................................ 1 Development of Statistics in Liberia ............................................................. 1
HIES and National Accounts ..................................................................... 2 HIES and the CPI ...................................................................................... 3 HIES & Poverty Measurement .................................................................. 5 HIES and the AfT ...................................................................................... 6
Data Collection & Fieldwork ......................................................................... 6 Ebola Virus Disease outbreak and impacts on the HIES Sample and Representativeness ...................................................................................... 6 Questionnaire ............................................................................................... 8
2. DEMOGRAPHIC CHARACTERISTICS ............................................................... 11 1. Population ............................................................................................ 11 2. Household Size .................................................................................... 12 3. Age Groups .......................................................................................... 13
3. POVERTY .................................................................................................. 15 1. Poverty Headcount .............................................................................. 15 2. Food Poverty ........................................................................................ 16 3. Extreme Poverty .................................................................................. 17 4. Number of Poor .................................................................................... 18 5. Poverty by Household Head Characteristics ....................................... 19 6. Inequality .............................................................................................. 20 7. Consumption ........................................................................................ 21
Food vs. Non-food .................................................................................. 21 Food Consumption .................................................................................. 22 Non-Food Consumption .......................................................................... 23
4. FOOD SECURITY ........................................................................................ 25 5. HOUSING CHARACTERISTICS ....................................................................... 27
1. Ownership status ................................................................................. 27 2. Rental costs ......................................................................................... 28 3. Electricity source .................................................................................. 28 4. Dwelling structure ................................................................................ 29 5. Source of drinking water ...................................................................... 30 6. Garbage disposal ................................................................................. 31
6. EDUCATION ............................................................................................... 32 1. Literacy Rate ........................................................................................ 32 2. Formal education ................................................................................. 33 3. Highest education achieved ................................................................. 35 4. Education provider ............................................................................... 36 5. Time to school ...................................................................................... 36 6. Source of books ................................................................................... 37 7. Expenditure per pupil ........................................................................... 37
7. HEALTH ..................................................................................................... 39 1. Primary health care visits and hospitalisations .................................... 39

iv
2. Primary health care provider ................................................................ 40 3. Overnight hospitalisations .................................................................... 44 4. Births .................................................................................................... 45
8. EMPLOYMENT ............................................................................................ 47 1. Informal employment, vulnerable employment, and unemployment .... 47 2. Primary employer ................................................................................. 50 3. Salary structure .................................................................................... 51
9. HOUSEHOLD NON-FARM ENTERPRISES ....................................................... 52 1. Household non-farm managers characteristics ................................... 52 2. Household non-farm business characteristics ..................................... 53 3. Profitability of household non-farm businesses ................................... 54
10. AGRICULTURE / CROP PRODUCTION & LIVESTOCK ...................................... 56 1. Crop production ................................................................................... 56 2. Livestock .............................................................................................. 59
11. TRANSFERS ............................................................................................. 60 12. SHOCKS .................................................................................................. 61
1. Number of shocks endured .................................................................. 61 2. Distribution of the most severe shocks ................................................ 61
13. SUBJECTIVE WELFARE ............................................................................. 63 14. METHODOLOGICAL APPENDIX ................................................................... 65
1. Measure of Well-Being ......................................................................... 65 Food Consumption .................................................................................. 65 Non-Standard Units ................................................................................ 67 Non-Food Consumption .......................................................................... 67 Price Adjustment ..................................................................................... 71
2. Poverty Line ......................................................................................... 72 Food Poverty Line ................................................................................... 72 Non-Food Component ............................................................................ 73 Adult Equivalence Measures .................................................................. 73
3. Poverty Measures ................................................................................ 74 4. Comparability with 2007 CWIQ ............................................................ 75 5. References ........................................................................................... 76

v
LIST OF TABLES Table 1-1 Region definitions by County ........................................................... 7 Table 1-2 Household Questionnaire Structure ................................................. 8 Table 2-1 Distribution of the Population of Liberia ......................................... 12 Table 2-2 Distribution of Household Sizes in Liberia ..................................... 12 Table 2-3 Distribution of population by age groups ........................................ 14 Table 3-1 Poverty levels by geographic characteristics ................................. 17 Table 3-2 Total numbers of poor by geographic characteristics .................... 19 Table 3-3 Poverty levels by characteristics of household head ..................... 20 Table 3-4 Inequality by regions and in regional comparison .......................... 21 Table 3-5 Food and non-food consumption ................................................... 21 Table 3-6 Food consumption ......................................................................... 22 Table 3-7 Non-food consumption ................................................................... 24 Table 4-1 Distribution of food shortages over the past 7 days ....................... 25 Table 4-2 Distribution of food safe households (7 days) by strata ................. 26 Table 4-3 Distribution of food safe households (12 months) .......................... 26 Table 5-1 Distribution of ownership status ..................................................... 27 Table 5-2 Distribution of rents paid ................................................................ 28 Table 5-3 Distribution of main source of electricity for the household ............ 29 Table 5-4 Distribution of main material for walls ............................................ 29 Table 5-5 Distribution of main material for roof .............................................. 30 Table 5-6 Distribution of main source of drinking water in the different seasons
by stratum ............................................................................................... 30 Table 5-7 Distribution of main method of garbage disposal ........................... 31 Table 6-1 Distribution of the literacy rate by regions and consumption quintiles
................................................................................................................ 33 Table 6-2 Distribution of the population with formal education by region and
consumption quintile ............................................................................... 34 Table 6-3 Distribution of the population with formal education by age groups35 Table 6-4 Distribution of the population with formal education by highest
educational achievement ........................................................................ 35 Table 6-5 Distribution of educational providers .............................................. 36 Table 6-6 Distribution of the time to school .................................................... 36 Table 6-7 Distribution of the source of school books ..................................... 37 Table 6-8 Distribution of the expenditure per pupil ........................................ 38 Table 7-1 Distribution of people who visited a phcp and of people hospitalised
by age groups ......................................................................................... 39 Table 7-2 Distribution of primary health care provider by stratum and
consumption quintile ............................................................................... 40 Table 7-3 Distribution of primary health care provider by region ................... 41 Table 7-4 Distribution of time to primary health care provider ....................... 42 Table 7-5 Distribution of the method of transportation to primary health care
provider ................................................................................................... 42 Table 7-6 Distribution of the cost of most recent visit to primary health care
provider ................................................................................................... 43 Table 7-7 Age distribution of patients with overnight hospitalisations ............ 44

vi
Table 7-8 Distribution of cost of overnight hospitalisations in the last 12 months .................................................................................................... 45
Table 7-9 Distribution of women with at least one birth in the last 24 months 45 Table 7-10 Distribution of place of delivery of last child birth ......................... 46 Table 8-1 Distribution of informal and vulnerable employment, and
unemployment rates ............................................................................... 48 Table 8-2 Distribution of the primary employer .............................................. 50 Table 8-3 Distribution of the salary structure ................................................. 51 Table 9-1 Distribution of the number of non-farm enterprises by household . 52 Table 9-2 Distribution of HH non-farm enterprise managers by gender and
age .......................................................................................................... 52 Table 9-3 Distribution of HH non-farm enterprise managers by gender and
stratum .................................................................................................... 53 Table 9-4 Distribution of the type of non-farm HH enterprise ......................... 53 Table 9-5 Distribution of the duration of the HH non-farm businesses .......... 54 Table 9-6 Distribution of the revenues of non-farm HH enterprises ............... 54 Table 9-7 Distribution of costs of HH non-farm enterprises ........................... 55 Table 10-1 Percentage of HHs that have either grown or sold specific crops 56 Table 10-2 Percentage of HHs that have either grown or sold Cassava or Rice
by region ................................................................................................. 57 Table 10-3 Percentage of HHs stating to be raising specific livestock ........... 59 Table 11-1 Distribution of HHs receiving specific types of transfers .............. 60 Table 12-1 Distribution of number of shocks endured by the household ....... 61 Table 12-2 Distribution of types of shock endured by the household ............ 62 Table 13-1 Distribution of satisfaction of respondents on specific life
circumstances ......................................................................................... 63
vii
LIST OF ACRONYMS AND ABBREVIATIONS ACPA ACS AfDB AfT
Accra Comprehensive Peace Accords Agriculture Crop Survey African Development Bank Agenda for Transformation
BID Basic Information Document COICOP CPI
Classification of Individual Consumption by Purpose Consumer Price Index
CWIQ DHS
Core Welfare Indicator Questionnaire Demographic and Health Survey
EA ECOWAS
Enumeration Area Economic Community of West African States
EU European Union EVD Ebola Virus Disease FAO FISIM
Food and Agriculture Organisation Financial Intermediation Services Indirectly Measured
GDP GIS
Gross Domestic Product Geo-Information Services
GoL GST
Government of Liberia Goods and Services Tax
HBS HCPI HIES
Household Budget Survey Harmonised Consumer Price Index Household Income and Expenditure Survey
HH ICP ILO
Household International Comparison Prices International Labour Organisation
ISCO ISIC
International Standard Classification of Occupations International Standard Classification of All Economic Activities
LD Liberian Dollar LEC Liberian Electricity Corporation LFS Labour Force Survey LISGIS Liberian Institute of Statistics and Geo-Information Services MAE MCPI MIS NCPI NGO NPISH NTGL
Mean Adult Equivalent Monrovia Consumer Price Index Malaria Indicator Survey National Consumer Price Index Non-Governmental Organisation Non Profit Institutions serving Households National Transitional Government of Liberia
phcp primary health care provider PRS PTA
Poverty Reduction Strategy Parent Teacher Association
Sida Swedish International Development Agency TTM Trained Traditional Midwife TV Total Value UNMIL USAID
United Nations Mission in Liberia United States Agency for International Development

viii
USD United States Dollar UV Use Value WB World Bank

ix
EXECUTIVE SUMMARY The Liberia 2014/2015 Household Income and Expenditure Survey (HIES) is a multi-year program, encompassing, among other features: the design and implementation of a household survey focusing on household income and expenditure. The project was implemented by Liberia Institute of Statistics and Geo-Information Services (LISGIS), with support from Government of Liberia (GoL), World Bank (WB), European Union (EU), United States Agency for International Development (USAID), Swedish International Development Corporation Agency (Sida) and African Development Bank (AfDB). The main objectives of the HIES are to provide high quality nationally representative household data on incomes and expenditure in order to update the Consumer Price Index, measure poverty and update the household expenditures section within Liberia’s National Accounts. The survey also provides baseline information for the Government of Liberia’s five-year poverty reduction strategy, “Agenda for Transformation” (AfT). The HIES 2014 is a nationally representative survey of 4,088 households visited over a six month period. The data is also nationally representative on a quarterly basis, and representative at the urban/rural level and regional level. This report presents findings from the HIES 2014. Demographics Characteristics: There are an estimated 938,383 households in Liberia, with an average household size of 4.26 persons per household; households are larger in urban areas (4.37) than rural areas (4.16). Out of a population of approximately 4 million persons, 48.5% are male and 51.5% female. Liberia has a young population with almost one in three Liberians being less than ten years of age. 52.7% of the population are of working age (between 15-65), and only 2.6% are 65 years or older. Poverty: 54.1% of the population is classified as poor, meaning that 54.1% cannot meet their overall food and non-food minimum needs. Poverty is higher in rural areas (70.0%) than urban areas (43.4%). Food poverty is lower than absolute poverty; 45.0% of the population do not have enough to meet their minimum food requirements. While food poverty is still higher in rural (52.8%) than urban areas (39.7%), the gap is smaller than with absolute poverty, showing the impact of subsistence farmers contribution to food needs. Extreme poverty is 18.5% at the national level, meaning that 18.5% of Liberians total consumption (food and non-food) falls below the minimum food requirements. In rural areas, extreme poverty is comparably higher at 27.4%, while in urban areas it is as low as 12.5%. Montserrado has the lowest rate of extreme poverty (6.6%), while the South Eastern B region has the highest (38.7%). These poverty measures are not comparable with previous estimates based on the CWIQ 2007 and 2010 due to differences in methodology and

x
implementation.1 Furthermore, the survey was halted in August 2014 due to the Ebola Virus Disease outbreak, and so data collection occurred in the pre-harvest lean season and excluded major festive periods at the end of year; thus seasonal impacts on consumption and expenditures are not reflected in the data, introducing a potential source of bias. A repeat HIES is being conducted in 2016 with data collection occurring over a full twelve month period. Two sets of poverty estimates will be produced following the repeat survey. One set would be based on six-months of data, providing comparison numbers against those presented in this report, and the other would be based on the full 12-months of data, reflecting true impacts of seasonality on consumption. Inequality: The level of inequality nationally stands at 0.320, as measured by the Gini coefficient, inequality is higher in urban areas (0.320) than rural areas (0.271). Inequality is lower in Liberia than neighbouring countries including Sierra Leone (0.340), Cote D’Ivoire (0.432) and Guinea (0.337). Food Security: 49.0% of households reported suffering from food shortages in the 12 months prior to being interviewed. Food insecurity was higher in rural areas with 60.3% of households reporting such shortages, than in urban areas where 41.6% of households reporting the same. Household Characteristics: Most households own the home they live in (45.9%), the second most common type of occupancy is renting (28.1%), and the third receive housing for free (23.6%). In urban areas more people rent households than own (41.8% vs. 35.4%), while in rural areas very few rent (6.9%) and the majority own their homes (62.0%). 81.3% of households do not have access to electricity; in rural areas this proportion is much higher at 94.2%. The Liberian Electricity Corporation provides electricity to 7.5% of urban households, but does not reach any rural households. In urban areas, the majority of electrified households receive obtain electricity from generators. The majority of household housing have walls made of mud and sticks (40.5%) and roofing made of zinc, iron or tin sheets (81.7%). Rivers, lakes or creeks are the largest sources of drinking water in rural areas, while urban dwellers mostly use outdoor pipes or pumps. Education: An estimated 66.7% of Liberians are able to read and write2. Urban residents are more likely to be literate (76.0%) than rural residents (50.1%). A larger gap exists between gender literacy rates, with 80.6% of males reported as literate and just 54.8% of females. Majority of students are enrolled in government institutions (47.7%), private non-religious schools are the second most common provider (29.3%), followed by religious entities 1 A more detailed explanation on why poverty estimates based on the HIES and CWIQ are not directly comparable can be found in the annex. 2 Literacy rates are based on self-reported ability to read and write, for respondents aged 15-49 years old. Methodology differs to literacy rates based on the LDHS 2013.

xi
(22.2%). Most students (47.8%) take between 10 and 30 minutes to reach school. Nearly all students reach school within 60 minutes, however 4.9% take longer. Textbooks used by students are predominantly borrowed from school or owned by the household (41.6% and 44.4% respectively). However in urban areas, the proportion that owns a textbook is much higher (49.9%), while in rural areas, those who borrow from schools is much higher (60.8%). Health: Two types of formal medical attention are recorded. A visit to a primary health care provider (phcp) when the patient returned home on the same day and an overnight stay when the patient spend at least one night at the medical facility. About one quarter of Liberians visited a phcp in the thirty days prior to interview, while less than 6% were hospitalised in the 12 months prior to interview. Government institutions (whether clinics or hospitals) were the most visited health care facilities (61.3%), followed by private non-religious providers (28.1%). The most common modes of transport used to reach a health care provider are by foot (53.8%), public motorcycle (24.6%) and public taxi (14.1%) respectively. In rural Liberia up to 62.7% of all trips to health care providers are made by foot. Almost one in five persons (18.4%) took 60 minutes or more to reach their health care provider. Employment: Overall unemployment in Liberia is seemingly low at 2.8% nationally, however a better depiction of the fragility of the labour market is reflected in the vulnerable and informal employment rates, which stand at 74.2% and 67.9% nationally. Both vulnerable and informal employment rates are higher in rural areas than in urban. 54.1% of the working population is employed in the private sector, which includes household entrepreneurial and farming activities. The Government employs 20.9% of the labour force. Household Non-Farm Enterprises: 41% of households are estimated to participate in non-farm enterprises; the prevalence is much higher in urban areas (49.5%) than rural areas (27.9%). Of the household non-farm businesses, 73.0% are situated in urban areas and 27.0% are situated in rural areas. The primary managers of 61.1% of these businesses are female. Most of these businesses are classified as traders or shopkeepers (65.1%), 24.9% are classified as service providers, and 10% as producers. Agriculture: Households were asked whether they had grown any crops in the past twelve months. Grown by 38.9% of households, Cassava is reported as the most grown crop, and is also sold by 19.4% of households. The primary staple food of Liberia, rice, is grown by 32.0% of the interviewed households, but only sold by 5.6% of households. Pepper, bitterballs, corn and plantain are the four next most grown crops. Households were also asked about livestock, one third of households reported raising chicken in the twelve months prior to the interview. In rural areas 54.6% of households raise chicken. Transfers: Nationally, an estimated 36% of households receive some kind of transfer from another household; predominantly this is in the form of cash.

xii
Rural households receive fewer transfers than urban households (27.9% vs. 41.3%), yet more rural households receive non-cash based transfers than urban households. Shocks: Any major event that impacted a single household or community is counted as a shock. Since the survey was aborted during the peak of the EVD outbreak, impacts of EVD are not captured as shocks. 23.2% of households were affected by a shock in the 12 months prior to the interview. The death of a person close to the household was rated as the most severe shock by majority of households, followed by chronic illness or accident involving family member. Beyond death and sickness, crops disease and criminality were rated as third and fourth most severe shocks. Subjective Welfare: Individuals’ opinions on a variety of issues including their financial situation, access to health and education, protection against crime, and the state of the judicial system, amongst others. The highest level of satisfaction was shown in relation to the country’s peace and stability, with 96.2% of Liberians satisfied. 68.3% are satisfied with education available for the household, and 61.0% with health care available, however a significantly lower proportion are satisfied with their financial situation (33.5%) and housing (56.2%).

1
1. BACKGROUND INFORMATION
Liberia Country Context Fourteen years of brutal civil war in Liberia destroyed lives, key institutions and infrastructure, and brought the country’s economy to a halt. The conflict left a disastrous toll on the nation: it led to the deaths of an estimated 270,000 Liberians, made the delivery of education and health services nearly impossible, and severely destroyed the country’s public and private infrastructure (roads, railroads, electricity generation and transmission, potable water and sewage facilities). The 2003 Accra Comprehensive Peace Accords (ACPA) marked the beginning of a new era for Liberia. Following the signing of the accords in August 2003, a two-year National Transitional Government of Liberia (NTGL) was established to ensure the implementation of the ACPA and carry out normal government functions including economic management, delivery of public services in education, health, infrastructure, etc. The United Nations Mission in Liberia (UNMIL) was established with a stabilization force deployed to assist in the maintenance of law and order throughout the country as well as a civilian component to support the implementation of the ceasefire agreement and peace process. The gradual return of security eventually led to the free and fair legislative and presidential elections of October 2005 and the subsequent run-off in November 2005, which resulted in the inauguration of Africa’s first democratically elected female president. The newly elected government articulated a broad vision of a peaceful, secure, and prosperous Liberia as described in Lift Liberia—the country’s first poverty reduction strategy (PRS-1, 2008-2011). During this period, Liberia made good progress as the economy recovered and growth was sustained. A second democratic election took place in October 2011 with a run-off in November that led to victory for the incumbent party. Ellen Johnson-Sirleaf won another term as President and a new government team was appointed and endorsed by legislature. The new government created a National Vision: Liberia Rising 2030 that calls for transforming the economy to middle-income status by 2030. To achieve the vision, a second Poverty Reduction Strategy for 2013-17, Agenda for Transformation (AfT) was designed.
Development of Statistics in Liberia Despite good progress in the development of statistics, significant data gaps remain. The government has not been able to implement a nationally representative HIES since 1964 due to financial and capacity constraints (and

2
more recently, the civil war). Delayed implementation of the HIES has widened statistical gaps related to national accounts, prices, and poverty. GDP estimates using the expenditure approach are not available due to a lack of information on the informal sector, while sectorial GDP using the production approach is grossly under-estimated. The consumer price index (CPI) suffers from outdated goods and services in the consumption basket (based on 1964’s limited survey of only Monrovia and which was hurriedly carried out). A new basket of goods and services needs to be reconstructed and their weights revised. Poverty data is available for 2007, when 63.8% of Liberians where estimated poor and for 2010, when the number was 56.3%.3 In both cases a methodology different from the one in the HIES was used, resulting in possibility to compare the latest results. These statistics are urgently required for evidence-based policy making and monitoring of implementation results supported by the new PRS— the AfT. A household income and expenditure survey would enable the filling of these critical data gaps, by providing detailed information on consumption expenditure, income and household characteristics of a sample of residents in Liberia at a particular time at the national and regional levels, both in urban and rural areas. Thus, the key objectives of the HIES 2014 are to:
• Improve Liberia’s National Accounts series by updating the household component of National Accounts by using household income and expenditure data;
• Update the consumption basket and associated weights of the CPI; • Measuring poverty and the characteristics of the poor; • Providing baseline indicators for the measurement of the AfT.
HIES and National Accounts In Liberia, like most countries in Africa, the production approach is used to prepare GDP estimates. In the production approach of the national accounts, output and value added for all activities in the economy are estimated. After adjustments for taxes (import duties and Goods and Services Taxes) and FISIM (Financial Intermediation Services Indirectly Measured), the national GDP is computed. Several major sources of information are available for estimating different components of GDP. These can be classified by grouping activities by institutional sector, that is, the financial and non-financial corporations, the government, non-profit institutions serving households (NPISH) and the household sector. For the first three, books of accounts are available and reasonable statistical information can be obtained from these sources. NPISH
3 See “Liberia – Tracking the dimensions of poverty: poverty note”, available on the World Bank website.
3
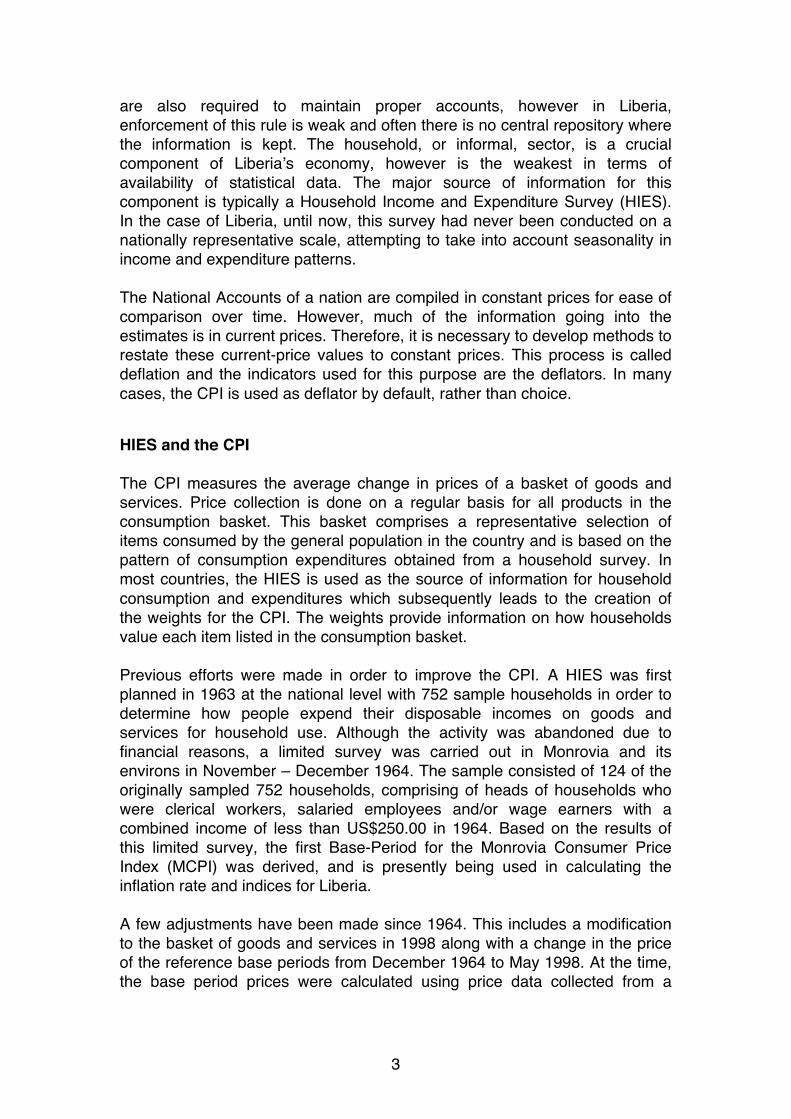
are also required to maintain proper accounts, however in Liberia, enforcement of this rule is weak and often there is no central repository where the information is kept. The household, or informal, sector, is a crucial component of Liberia’s economy, however is the weakest in terms of availability of statistical data. The major source of information for this component is typically a Household Income and Expenditure Survey (HIES). In the case of Liberia, until now, this survey had never been conducted on a nationally representative scale, attempting to take into account seasonality in income and expenditure patterns. The National Accounts of a nation are compiled in constant prices for ease of comparison over time. However, much of the information going into the estimates is in current prices. Therefore, it is necessary to develop methods to restate these current-price values to constant prices. This process is called deflation and the indicators used for this purpose are the deflators. In many cases, the CPI is used as deflator by default, rather than choice.
HIES and the CPI The CPI measures the average change in prices of a basket of goods and services. Price collection is done on a regular basis for all products in the consumption basket. This basket comprises a representative selection of items consumed by the general population in the country and is based on the pattern of consumption expenditures obtained from a household survey. In most countries, the HIES is used as the source of information for household consumption and expenditures which subsequently leads to the creation of the weights for the CPI. The weights provide information on how households value each item listed in the consumption basket. Previous efforts were made in order to improve the CPI. A HIES was first planned in 1963 at the national level with 752 sample households in order to determine how people expend their disposable incomes on goods and services for household use. Although the activity was abandoned due to financial reasons, a limited survey was carried out in Monrovia and its environs in November – December 1964. The sample consisted of 124 of the originally sampled 752 households, comprising of heads of households who were clerical workers, salaried employees and/or wage earners with a combined income of less than US$250.00 in 1964. Based on the results of this limited survey, the first Base-Period for the Monrovia Consumer Price Index (MCPI) was derived, and is presently being used in calculating the inflation rate and indices for Liberia. A few adjustments have been made since 1964. This includes a modification to the basket of goods and services in 1998 along with a change in the price of the reference base periods from December 1964 to May 1998. At the time, the base period prices were calculated using price data collected from a

4
special survey conducted during March – April, 1998. However, the base period weights data from 1964 HIES remained unchanged. More serious efforts were exerted to adjust the MCPI in order to provide an opportunity for government to source funding for the construction of a new national consumer basket. In January 2005, a consumer price specialist from the Economic Community of West Africa States (ECOWAS) visited Liberia to assist with the development of a harmonized consumer price index (HCPI) for the country. The index was intended to be based on the Classification of Individual Consumption by Purpose for Household Budget Survey (COICOP-HBS) and a new list of 515 items had been selected for the ECOWAS harmonized market basket. In May 2006, the IMF contracted a consumer price consultant to work with the International Comparison Prices (ICP) team in re-adjusting market basket weights at the COICOP major group level using market basket data of four neighboring ECOWAS countries: Sierra Leone, Ivory Coast, Ghana and Guinea because of the similarity of consumption patterns of the people of Liberia. These new weights at the COICOP major group were then distributed across all of the 234 items selected for the new Harmonised Consumer Price Index (HCPI) market basket. This was done on the basis of the work done by ECOWAS mission prior to the fund’s CPI expert. The harmonized consumer price index that evolved from this activity is an amalgamation of the COICOP twelve (12) functions. Despite the modifications to the weights derived from the HIES conducted in 1964, some major concerns still remain: • Liberia has undergone many socio-economic changes, particularly in the
past decade, which is not reflected in the current system since the weights associated with the basket of goods have been modified based on information from neighboring countries with significantly different economic characteristics. There has been no internal data collection effort to improve this gap.
• The limited sample size of the survey conducted in 1964, the one-month
duration of the survey and its focus on Monrovia are problematic from the analytical perspective. The sample size of the survey from 1964 is too small to reflect on the ground reality of today. Additionally, the duration does not account for seasonal adjustment in consumption and expenditure patterns. Finally, when the MCPI was constructed, the operating assumption was that Monrovia was the major trading center in the country and therefore, changes in prices in Monrovia would have serious effects in other parts of the country. This clearly is not the case anymore and necessitates a nationally representative sample.
It is evident from the discussion above that a new HIES is indispensable to update the existing CPI weights.

5
HIES & Poverty Measurement As part of its efforts to track poverty and monitor household living standards, LISGIS has conducted a number of large-scale household surveys. These surveys include the Census of Population and Housing, the Demographic and Health Survey (DHS), Malaria Indicator Survey (MIS), Agriculture Crop Survey (ACS), the Core Welfare Indicator Questionnaire (CWIQ), and the Labour Force Survey (LFS). Although the current set of surveys encompasses a wide range of topics relevant for monitoring welfare, five important conclusions can be drawn on the state of statistics obtained from these surveys • While all the surveys are nationally representative, they have not been
conducted over a 12-month period to account for seasonality. This is problematic for analyzing household consumption patterns because households will consume more items right after a harvesting period in comparison to the rest of the year. Also, households spend more during the commencement of academic periods, Independence Day celebrations, Christmas season and the New Year. Given that previous surveys have been conducted over a shorter duration, the effects of seasonality cannot be properly accounted for.
• Some of these surveys are topic specific (for example, the ACS focuses
only on staple and cash crops, such as cassava, rice, coffee, cocoa, rubber and palm oil, the DHS focuses on health, LFS on labour activities) and others do not have detailed enough modules to allow for a comprehensive view of household incomes and expenditures.
• The only survey conducted in the past to capture household expenditure
since the 1964 HIES is the 2007 CWIQ Survey. This survey is not representative at the county level, which makes it difficult to provide specialized policy recommendations at that geographic level. The GoL and donor organizations are particularly interested in obtaining data on and understanding poverty dynamics at the county level.
• Aside from the CWIQ, there is no other survey collecting information on
consumption and expenditures, and the CWIQ itself had its own limitations such as a small sample size, amongst others.
• Statistics in Liberia suffer from a number of problems common to other
countries in the region. These include duplications and contradictory information, inconsistencies in sampling methodology, insufficient coverage, poor documentation and dissemination, and uneven quality both across sources and over time. This results in the existing data suffering from low credibility and limited use.

6
The Government of Liberia (GoL) recognizes that improving income, expenditure and poverty statistics is the backbone of sound sectorial policies. For this purpose, LISGIS, with technical assistance from the WB implemented a multi-purpose HIES that addresses some of the key concerns and data gaps.
HIES and the AfT Agenda for Transformation (AfT) is the medium term economic growth and development strategy (2012 – 2017), and serves as a guide to development activities in Liberia. This medium term plan is linked to the long-term national vision, Liberia RISING 2030, whose overarching goal is for Liberia to achieve middle-income status by 2030. The AfT focuses on key investments in infrastructure (roads, energy), youth skills development & employment, health improvement, education and manpower development, social safety net provision, security, and private and public sector development. The HIES, along with other data sourced from LISGIS’ surveys including the 2008 Census and the 2013 DHS, serves as baseline for a subset of indicators intended to monitor the progress of the AfT in order to assess the impact of development activities in Liberia.
Data Collection & Fieldwork Data collection for the HIES began on 26th January, 2014, by twelve teams, including one supervisor, four enumerators, one GIS specialist who doubled up as an enumerator, one data entry clerk, and one driver. The twelve teams collected data across the country, covering a nationally representative sample of enumeration areas (EAs) each quarter. Each quarter a team from LISGIS visited the field teams to monitor fieldwork, assess data quality, and provide feedback and further training if necessary. Data was entered in the field to enable a first set of errors to be picked up while teams were still in areas of enumeration. Soft copies of data were sent back to the head office on a weekly basis to allow for further consistency checks and quality assurance to be conducted on an on-going basis, with feedback provided to field teams. Simultaneously, hard copies of questionnaires were sent back to the head office, and data was entered a second time in order to reduce the number of errors.
Ebola Virus Disease outbreak and impacts on the HIES Sample and Representativeness In the first two quarters of data collection, fieldwork went according to plan and in agreement with the sample design. However in the latter part of July, Liberia faced a shock, with the escalation and intensifying of the outbreak of
7
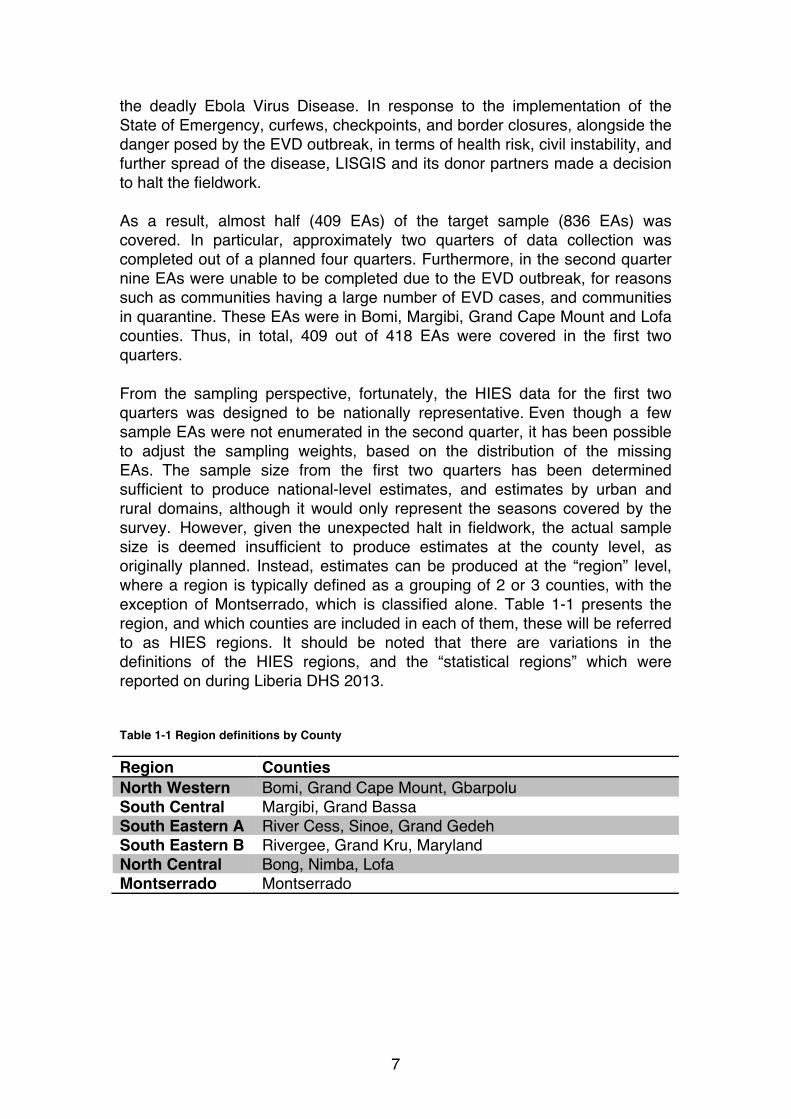
the deadly Ebola Virus Disease. In response to the implementation of the State of Emergency, curfews, checkpoints, and border closures, alongside the danger posed by the EVD outbreak, in terms of health risk, civil instability, and further spread of the disease, LISGIS and its donor partners made a decision to halt the fieldwork. As a result, almost half (409 EAs) of the target sample (836 EAs) was covered. In particular, approximately two quarters of data collection was completed out of a planned four quarters. Furthermore, in the second quarter nine EAs were unable to be completed due to the EVD outbreak, for reasons such as communities having a large number of EVD cases, and communities in quarantine. These EAs were in Bomi, Margibi, Grand Cape Mount and Lofa counties. Thus, in total, 409 out of 418 EAs were covered in the first two quarters. From the sampling perspective, fortunately, the HIES data for the first two quarters was designed to be nationally representative. Even though a few sample EAs were not enumerated in the second quarter, it has been possible to adjust the sampling weights, based on the distribution of the missing EAs. The sample size from the first two quarters has been determined sufficient to produce national-level estimates, and estimates by urban and rural domains, although it would only represent the seasons covered by the survey. However, given the unexpected halt in fieldwork, the actual sample size is deemed insufficient to produce estimates at the county level, as originally planned. Instead, estimates can be produced at the “region” level, where a region is typically defined as a grouping of 2 or 3 counties, with the exception of Montserrado, which is classified alone. Table 1-1 presents the region, and which counties are included in each of them, these will be referred to as HIES regions. It should be noted that there are variations in the definitions of the HIES regions, and the “statistical regions” which were reported on during Liberia DHS 2013. Table 1-1 Region definitions by County
Region Counties North Western Bomi, Grand Cape Mount, Gbarpolu South Central Margibi, Grand Bassa South Eastern A River Cess, Sinoe, Grand Gedeh South Eastern B Rivergee, Grand Kru, Maryland North Central Bong, Nimba, Lofa Montserrado Montserrado

8
Questionnaire The field work for the HIES was designed to be implemented throughout a twelve month period in order to reflect seasonality in expenditures and income throughout a full calendar year. The household questionnaire has twenty-one thematic sections, described in Table 1-2. Table 1-2 Household Questionnaire Structure
Section Name Level of Observation
Description
A-1 Household Identification
Household Cover page, identification information on location of the household
A-2 Survey Staff Details
Household Details on survey staff including who implemented the questionnaire and supervised the work, and completed data entry, date and time of interview, and observation notes by enumerator regarding the interview
B Household Individual Socio-demographic characteristics

9
Member Roster
of household members (gender, age, relationship with household head, etc.)
C Education Individual Highest education level achieved for those no longer attending school, and the enrolment status and education level of those still attending school, and education expenditures
D Health Individual Recent use of health services, use of mosquito nets, reproductive health for women 12 to 49 years of age, incidence of diarrhoea for children under 5 years of age, and health expenditures
E Labour Individual Employment status, economic activity, occupation, and earnings
F Food Outside the Household
Individual Expenditures on meals, snacks and drinks consumed outside of the household
G Subjective Welfare
Individual Respondents’ opinions of their welfare situation, for those respondents 15 years and above
H Non-Farm Enterprises
Household Non-agricultural income generating enterprises which produce goods or services operated by the household
I Food Security Household Assesses the household’s ability to provide sufficient food for its members during the past seven days, and what was done to alleviate any problems
J Housing, Water & Sanitation
Household Information about the dwelling and its access to water, electricity, fuel and expenditures on services
K Food Consumption
Household Household’s consumption of food within the household during the last seven days and the amount spent on the food that was consumed
L1 Non-Food Expenditures (past 7 days, past 30 days)
Household Non-food items that are purchased on a regular basis and the expenditures on those items
L2 Non-Food Expenditures (past 12 months)
Household Non-food items that are purchased infrequently and the expenditures on those items
M Household Household Assets owned by the household

10
Assets and their values N Assistance,
Groups and Other Sources of Income
Household Assistance in the form of cash or in-kind that has been received in the past 12 months
O Credit Household Funds borrowed from someone outside of the household or from an institution in the form of cash goods or services
P Cash and Gift Transfers
Household Cash or goods received from other households and cash or goods sent to other households (nationally and internationally)
Q Shocks Household Shocks that may have been felt by the household and how that shock affected income and/or assets
R Crop Production and Sales
Household Production and sales of agricultural crops during the last twelve months
S Livestock and Aquatic Sales and Purchases
Household Production and sales of livestock and aquatic animals over the past 12 months
T Household Re-contact Information
Household GPS location of the dwelling and how to re-contact the household in the future if needed

11
2. DEMOGRAPHIC CHARACTERISTICS
1. Population The population of Liberia is estimated to be just above 4 million people by the 2014 HIES (4,001,855). Of these, 48.5% are males and 51.5% are females, which results in a sex ratio of males to females of 94.3. 1,623,583 of residents are estimated to live in rural areas, while the majority, 2,378,272, are considered to live in urban areas. It should be noted that a locality has been defined as urban if it had a population of 2,000 or more based on data from the 2008 Population and Housing Census, and localities with a population less than 2,000 are classified as rural. Furthermore, regardless of population size, localities are classified as urban if they are county capitals or other important towns.
Approximately a third of Liberians live in Montserrado county (32%). A breakdown of population by county, and by urban and rural, can be seen in Table 2-1. The largest region after Montserrado county is the North Central region with 1,234,383 inhabitants. The next largest region by population size is the South Central region, which has approximately five hundred thousand residents. The other three regions are smaller and are estimated to have somewhat above 300,000 people residing in them.

12
Table 2-1 Distribution of the Population of Liberia
Male Female Sex ratio (males to females) N N % N %
Liberia 4,001,855 1,942,238 48.5 2,059,617 51.5 94.3
Area of residence
Rural 1,623,583 798,569 49.2 825,014 50.8 96.8
Urban 2,378,272 1,143,669 48.1 1,234,603 51.9 92.6
Region
Montserrado 1,287,184 620,057 48.2 667,127 51.8 92.9
North Central 1,234,383 591,613 47.9 642,770 52.1 92.0
North Western 339,091 163,089 48.1 176,002 51.9 92.7
South Central 496,825 244,060 49.1 252,765 50.9 96.6
South Eastern A 344,355 170,983 49.7 173,372 50.3 98.6
South Eastern B 300,017 152,437 50.8 147,581 49.2 103.3
2. Household Size Based on the 2014 HIES data there are an estimated 938,383 households in Liberia, with a mean household size of 4.26 persons per household (see Table 2-2). Mean household size in rural areas is greater than in urban areas (4.37 versus 4.19). Table 2-2 Distribution of Household Sizes in Liberia
N Mean Household
Size Mean Adult Equivalent
Liberia 938,383 4.26 3.28
Area of residence
Rural 371,313 4.37 3.30
Urban 567,070 4.19 3.26
Region
Montserrado 321,256 4.00 3.14
North Central 288,105 4.28 3.22
North Western 77,022 4.40 3.32
South Central 108,280 4.59 3.57
South Eastern A 78,820 4.37 3.33
South Eastern B 64,902 4.62 3.57

13
The South Eastern B region is the region with the largest mean household size, followed closely by the South Central region (4.62 and 4.59 respectively), while Montserrado and the North Central region report the smallest mean household sizes (4.00 and 4.28 respectively). The last column of Table 2-2 shows the household size based on Mean Adult Equivalents (MEA). This calculation takes into account the gender and age of the household members. In terms of their consumption, a 30-year-old man and a five-month old baby cannot be compared one to one.4
3. Age Groups Liberia has a very young population, about half of the population is less than 18 years old and 44.6% of Liberians are 14 years or younger. Only 2.6% are older than 64 years. Table 2-3 presents Liberia’s population data by broad age groups in each region. The percentage of population of working age (aged between 15 and 64) is higher in urban than in rural areas, while the percentage of younger Liberians (0-14 years) and senior citizens (65+ years) is larger in rural areas than urban areas.
4 For a discussion of equivalence scales see the FAO’s EASYPol repository.

14
Table 2-3 Distribution of population by age groups
All Ages 0-14 years 15-64 years 65+ years 18+years
N (%) (%) (%) (%)
Liberia 4,001,855 44.6 52.7 2.6 49.9
Area of residence
Rural 1,623,583 47.8 48.4 3.8 47.6
Urban 2,378,272 42.5 55.7 1.8 51.4
Region
Montserrado 1,287,184 39.9 58.3 1.7 53.9
North Central 1,234,383 47.7 49.4 2.9 47.8
North Western 339,091 48.0 47.9 4.1 46.5
South Central 496,825 44.4 52.7 2.9 49.5
South Eastern A 344,355 47.2 49.9 2.9 48.2
South Eastern B 300,017 46.4 51.1 2.5 48.3 Graphically, the age distribution is represented in the population pyramid below. The pyramid has a broad base (more than 32% of the population is under 10 years of age) and a narrow top. By gender, there are a smaller proportion of males in the age groups between 20-34 years old than females5. Figure 1 Population pyramid by gender
5 It should be noted that the HIES 2014 is representative of the population living in households, and would exclude any institutional populations (for example, those residing in hospitals, prisons, military barracks etc.).

15
3. POVERTY To compare different economic situations, three poverty lines are defined: the food poverty line, defined as the line below which individuals cannot meet their basic food needs; the overall poverty line, defined as the line below which individuals cannot meet their food and non-food minimum needs, and the extreme poverty line, defined as the line below which individuals’ total food and non-food consumption falls below the minimum food requirements. It should be noted that the poverty estimates based on data from the 2014 HIES is not directly comparable to the estimates based on the 2007 and 2010 CWIQ surveys. The lack of ability to compare stems from key differences in the design and implementation of the HIES and the CWIQ. Amongst others these include the use of different recall periods when asking about household consumption, the inclusion of food consumed outside of the household in the HIES and differing set of consumables in the two surveys. More details on the comparability between poverty estimates based on the HIES and CWIQ can be found in the methodological annex. Comparisons between these poverty estimates cannot give a reliable description of the evolution of poverty in Liberia over time. Since data collection for the HIES 2014 was halted before completion due to the EVD outbreak, approximately half of the target sample was actually enumerated. As a result there are not enough observations available to produce poverty estimates at the county level. Furthermore, data was collected in the six-months prior to Liberia’s harvest season for rice, and did not cover the major end of year festive period, and so, impacts of seasonality on consumption are not reflected in the presented poverty estimates. LISGIS will repeat the HIES in 2016, with the goal of completing a full 12-months of data collection as per the sample design. This will allow for estimation of poverty which accounts for Liberia’s seasonal consumption patterns and will also allow for enough data for estimates to be disaggregated by county, enabling more acutely informed policy decisions by geography, Using data from the HIES 2016, it is intended for two poverty indices to be constructed. One based on the full 12-months of data, aiming to achieve the objectives mentioned above. The other, based on the first six months of data collected in the HIES 2016, enabling a comparable estimate between the HIES 2014 and 2016 surveys.
1. Poverty Headcount According to the 2014 HIES, the headcount poverty figure for the country is 54.1%. Rural poverty is 70.0% and urban poverty is 43.3%. Regional poverty was lowest in Montserrado, 31.6%, followed by 47.5% in South Central, 51.1% in South Eastern A, 66.0% in North Western, and 71.7% in the North Central region. The region with the highest poverty level was South Eastern B

16
at 78.9%. Because the survey was not completed due to the outbreak of Ebola, there are not enough observations to calculate poverty at the county level, with the exception of Montserrado, which contains the capital Monrovia and was therefore over-sampled.
2. Food Poverty The food poverty level was 45.0% for Liberia. Similarly to overall poverty, food poverty was higher in rural areas, 52.8%, compared to urban areas, 39.7%. The level of food poverty in rural areas, however, was significantly lower than the poverty headcount (70.0% vs. 52.8%), while the levels were nearly the same in urban areas (43.3% vs. 39.7%). This indicates that in rural areas some households are able to meet their food poverty needs even though they had relatively little non-food consumption. This is likely the result of subsistence farmers in rural areas raising sufficient food to eat regularly, but having little access to income generating activities. In urban areas, households must purchase both food and non-food items, and therefore there are fewer differences between overall and food poverty levels. In Montserrado, the food poverty level was marginally higher than the overall poverty level, 32.5% compared to 31.6%. This indicates that even though some households have sufficient expenditures that they are above the poverty line, non-food spending consumes a greater share of total resources, crowding out food spending.

17
Table 3-1 Poverty levels by geographic characteristics
Absolute Poverty Food Poverty Extreme Poverty Liberia 54.1 45.0 18.5 Area of residence Rural 70.0 52.8 27.4 Urban 43.3 39.7 12.4 Region Montserrado 31.6 32.5 6.6 North Central 71.7 57.7 29.8 North Western 66.0 52.4 24.3 South Central 47.5 36.3 9.0 South Eastern A 51.1 34.5 12.8 South Eastern B 78.9 65.0 38.7
3. Extreme Poverty Of the total Liberian population, 18.5% were classified as extremely poor. This percentage was 27.4% in rural areas and 12.4% in urban areas. Across the regions, the level was the lowest in Montserrado at 6.6%, compared to 9.0% in South Central, 12.8% in South Eastern A, 24.3% in North Western, 29.8% in North Central, and 38.7% in South Eastern B.

18
It should be noted that these poverty figures are likely to be slightly higher than the true percentages in 2014. The data was collected from January until August before it was necessary to stop fieldwork activities. For much of the country, including the “breadbasket” of Liberia in Lofa and Nimba counties, this was during the pre-harvest lean season.
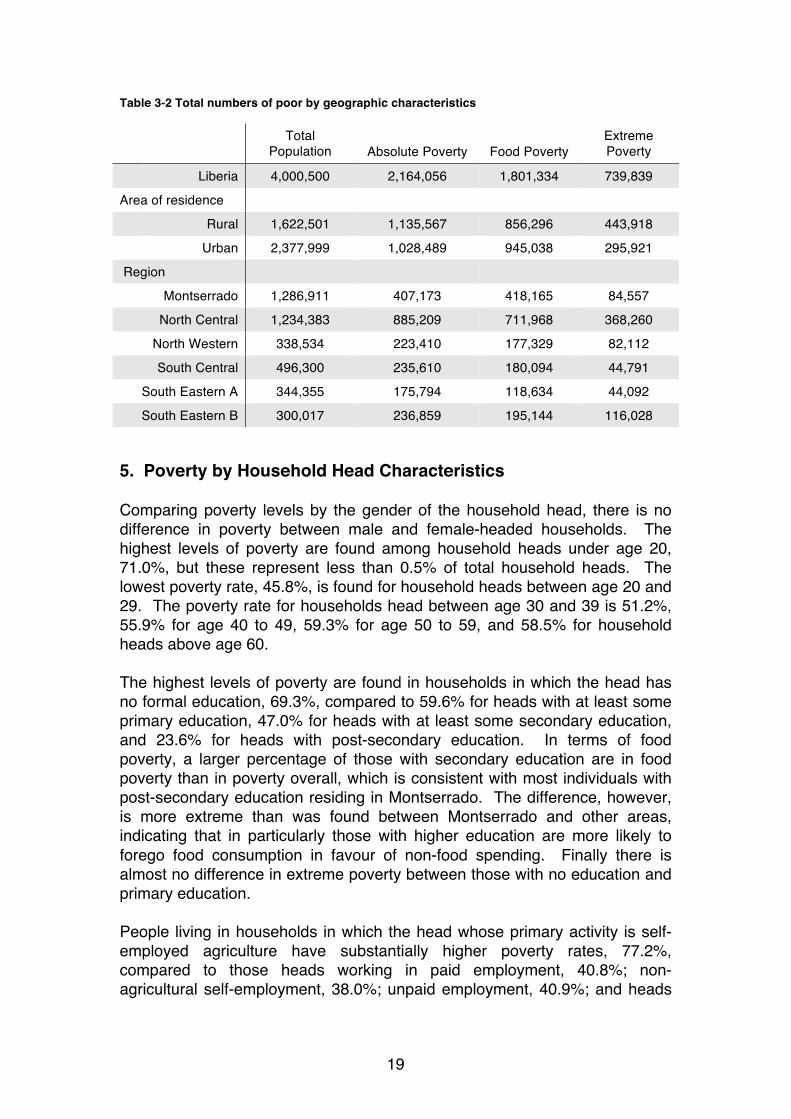
4. Number of Poor From an expected population of about 4 million, a poverty headcount 54.1% means that more than 2.1 million Liberians are living in poverty (Table 3-2). These are split almost evenly between urban and rural areas because even though the poverty headcount in rural areas is higher, the overall population share in urban areas is greater. The largest number of poor are living in the North Central region, 885,209, more than 40% of the total poor in Liberia. The next highest total was in Montserrado, with 407,173 poor persons. Of the other main poverty measures, there were about 1.8 million Liberians living in food poverty and 740,000 living in extreme poverty.
19
Table 3-2 Total numbers of poor by geographic characteristics
Total
Population Absolute Poverty Food Poverty Extreme Poverty
Liberia 4,000,500 2,164,056 1,801,334 739,839
Area of residence
Rural 1,622,501 1,135,567 856,296 443,918
Urban 2,377,999 1,028,489 945,038 295,921
Region
Montserrado 1,286,911 407,173 418,165 84,557
North Central 1,234,383 885,209 711,968 368,260
North Western 338,534 223,410 177,329 82,112
South Central 496,300 235,610 180,094 44,791
South Eastern A 344,355 175,794 118,634 44,092
South Eastern B 300,017 236,859 195,144 116,028
5. Poverty by Household Head Characteristics Comparing poverty levels by the gender of the household head, there is no difference in poverty between male and female-headed households. The highest levels of poverty are found among household heads under age 20, 71.0%, but these represent less than 0.5% of total household heads. The lowest poverty rate, 45.8%, is found for household heads between age 20 and 29. The poverty rate for households head between age 30 and 39 is 51.2%, 55.9% for age 40 to 49, 59.3% for age 50 to 59, and 58.5% for household heads above age 60. The highest levels of poverty are found in households in which the head has no formal education, 69.3%, compared to 59.6% for heads with at least some primary education, 47.0% for heads with at least some secondary education, and 23.6% for heads with post-secondary education. In terms of food poverty, a larger percentage of those with secondary education are in food poverty than in poverty overall, which is consistent with most individuals with post-secondary education residing in Montserrado. The difference, however, is more extreme than was found between Montserrado and other areas, indicating that in particularly those with higher education are more likely to forego food consumption in favour of non-food spending. Finally there is almost no difference in extreme poverty between those with no education and primary education. People living in households in which the head whose primary activity is self-employed agriculture have substantially higher poverty rates, 77.2%, compared to those heads working in paid employment, 40.8%; non-agricultural self-employment, 38.0%; unpaid employment, 40.9%; and heads

20
not currently working, 43.3%. Nearly 60% of those in agriculture are also in food poverty and more than one-third are in extreme poverty. Table 3-3 Poverty levels by characteristics of household head
Sex of household head
Share of Total
Population Absolute Poverty
Food Poverty
Extreme Poverty
Male 74.3 54.6 47.0 19.6 Female 25.7 52.7 39.4 15.2 Age of household head
15 – 19* 0.4 71.0 31.0 11.6 20 - 29 14.5 45.8 30.9 11.8 30 - 39 29.0 51.2 41.5 18.9 40 - 49 27.4 55.9 49.5 20.7 50 - 59 17.5 59.3 54.5 20.8 60+ 11.2 58.5 45.6 17.3 Highest education level attained of household head None 35.8 69.3 53.2 25.9 Primary 12.7 59.6 47.7 25.1 Secondary 40.8 47.0 40.9 14.0 Post-secondary 10.7 23.6 30.2 3.1 Employment sector of household head Paid employee 31.1 40.8 39.3 9.9
Self-employed (non-
agriculture) 22.1 38.0 30.2 7.3
Self-employed
(agriculture) 37.7 77.2 59.3 33.7
Not working / Unpaid
employment 9.1 43.0 41.7 12.7 * category contains only 36 observations
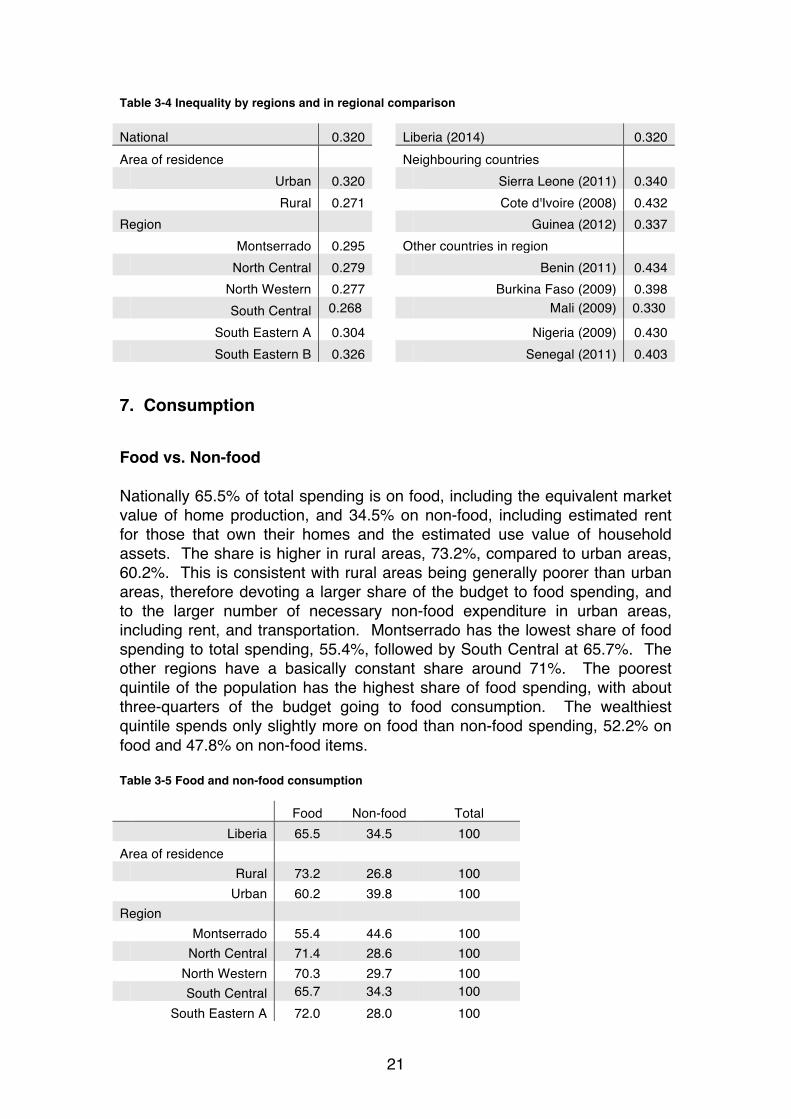
6. Inequality The national Gini coefficient6 is 0.32. This is slightly lower compared to the most recent measurements for neighbouring Guinea and Sierra Leone, and substantially lower than Cote d’Ivoire. In Liberia, inequality was higher in urban areas (0.32) compared to rural areas (0.27). Across regions, the highest inequality was found in South Eastern B (0.33), compared with Montserrado (0.30), South Eastern A (0.30), North Central (0.28), North Western (0.28). The lowest inequality was in South Central region (0.27).
6 For technical details about the Gini coefficient, please see the methodological appendix.
21
Table 3-4 Inequality by regions and in regional comparison
National 0.320
Liberia (2014) 0.320 Area of residence
Neighbouring countries
Urban 0.320
Sierra Leone (2011) 0.340 Rural 0.271
Cote d'Ivoire (2008) 0.432
Region
Guinea (2012) 0.337 Montserrado 0.295
Other countries in region
North Central 0.279
Benin (2011) 0.434 North Western 0.277
Burkina Faso (2009) 0.398
South Central 0.268
Mali (2009) 0.330
South Eastern A 0.304
Nigeria (2009) 0.430 South Eastern B 0.326
Senegal (2011) 0.403
7. Consumption
Food vs. Non-food Nationally 65.5% of total spending is on food, including the equivalent market value of home production, and 34.5% on non-food, including estimated rent for those that own their homes and the estimated use value of household assets. The share is higher in rural areas, 73.2%, compared to urban areas, 60.2%. This is consistent with rural areas being generally poorer than urban areas, therefore devoting a larger share of the budget to food spending, and to the larger number of necessary non-food expenditure in urban areas, including rent, and transportation. Montserrado has the lowest share of food spending to total spending, 55.4%, followed by South Central at 65.7%. The other regions have a basically constant share around 71%. The poorest quintile of the population has the highest share of food spending, with about three-quarters of the budget going to food consumption. The wealthiest quintile spends only slightly more on food than non-food spending, 52.2% on food and 47.8% on non-food items. Table 3-5 Food and non-food consumption
Food Non-food Total Liberia 65.5 34.5 100
Area of residence Rural 73.2 26.8 100
Urban 60.2 39.8 100 Region
Montserrado 55.4 44.6 100 North Central 71.4 28.6 100 North Western 70.3 29.7 100 South Central 65.7 34.3 100 South Eastern A 72.0 28.0 100
22
South Eastern B 71.2 28.8 100 Quintile (1 = poorest)
1 74.9 25.1 100 2 71.9 28.1 100 3 66.3 33.7 100 4 62.1 37.9 100 5 52.2 47.8 100
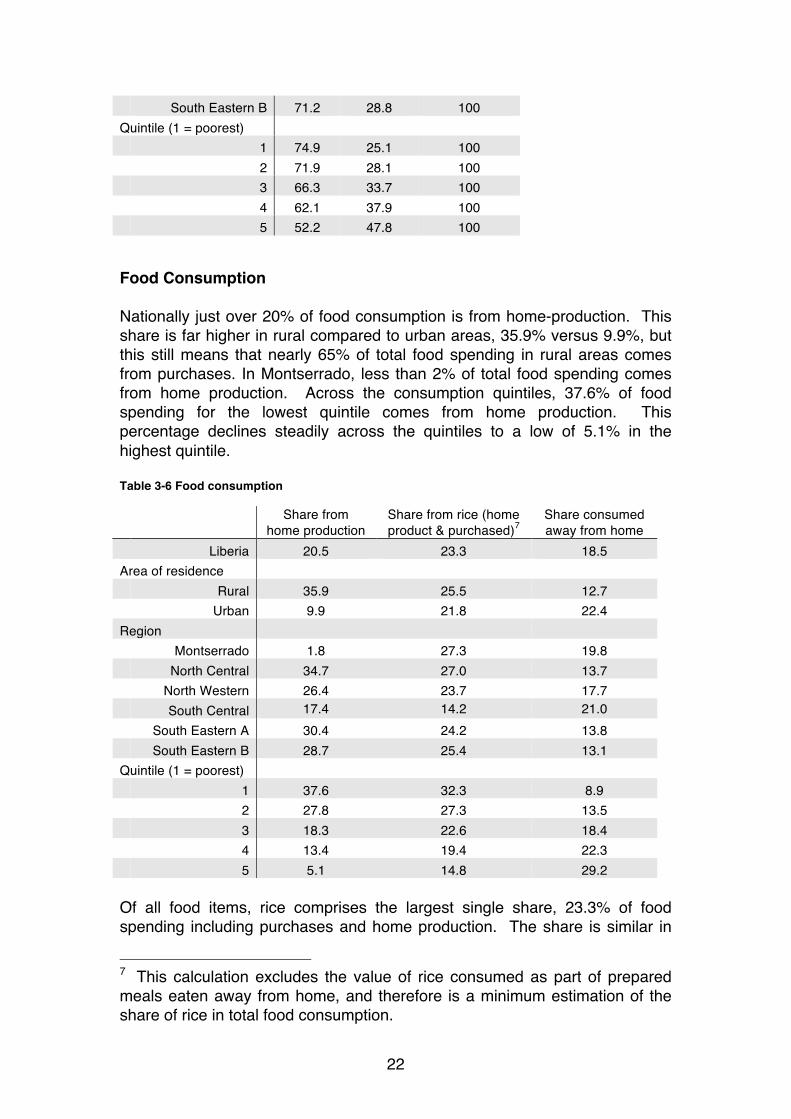
Food Consumption Nationally just over 20% of food consumption is from home-production. This share is far higher in rural compared to urban areas, 35.9% versus 9.9%, but this still means that nearly 65% of total food spending in rural areas comes from purchases. In Montserrado, less than 2% of total food spending comes from home production. Across the consumption quintiles, 37.6% of food spending for the lowest quintile comes from home production. This percentage declines steadily across the quintiles to a low of 5.1% in the highest quintile. Table 3-6 Food consumption
Share from
home production Share from rice (home product & purchased)7
Share consumed away from home
Liberia 20.5 23.3 18.5 Area of residence
Rural 35.9 25.5 12.7 Urban 9.9 21.8 22.4 Region
Montserrado 1.8 27.3 19.8 North Central 34.7 27.0 13.7 North Western 26.4 23.7 17.7 South Central 17.4 14.2 21.0 South Eastern A 30.4 24.2 13.8 South Eastern B 28.7 25.4 13.1 Quintile (1 = poorest)
1 37.6 32.3 8.9 2 27.8 27.3 13.5 3 18.3 22.6 18.4 4 13.4 19.4 22.3 5 5.1 14.8 29.2 Of all food items, rice comprises the largest single share, 23.3% of food spending including purchases and home production. The share is similar in
7 This calculation excludes the value of rice consumed as part of prepared meals eaten away from home, and therefore is a minimum estimation of the share of rice in total food consumption.

23
urban and rural areas, 21.8% and 25.5%, respectively, and across the regions, ranging from 14.2% in South Central to 27.3% in Montserrado. The poorest quintile had the highest share of food expenditure coming from rice, 32.3%. This share declined across the quintiles and was 14.8% in the least-poor quintile. Nationally, 18.5% of food consumption was on food or drinks consumed outside the home. This category included full meals, snacks and barbequed meat, non-alcoholic drinks, alcoholic drinks, and ice cream and other sweets. These categories cover either spending in restaurant or street vendors, or the estimated value of the food item if it was eaten in another household. The share was nearly double in urban areas compared to rural, 22.4% and 12.7%, respectively. Montserrado had the highest percentage across the regions, 27.3%, compared to the others, which ranged from 13.1% in Southeast B to 17.7% in North Western.
Non-Food Consumption Of non-food spending, nationally 12.2% was spent on education, though the share was almost double in urban areas, 15.0%, compared to rural areas, 8.2%. Of the regions, education spending was highest in Montserrado at 16.3% of non-food spending, and lowest in North Western, at 8.2%. Across the quintiles the lowest share was spent by the least poor quintile, 10.4%. This quintile also had the highest absolute spending on education but it was the lowest share because of higher spending generally. The least well-off quintile had the second lowest share of spending on education, despite having limited non-food spending overall. This reflects the lowest enrolment rates for children and young adults in this quintile. Health spending comprised a limited share of total non-food spending, 2.5% nationally, and 2.9% and 2.2% in rural and urban areas, respectively. The share was also between 2% and 3% across the six regions. The share was the highest for the poorest quintile, 3.9%, and lowest for the least poor quintile, 1.4%, though similar to education, the overall amount spent was the highest for the top quintile. It should be noted that this includes regular health spending only, such as preventative care and treatment for illnesses, but not extraordinary expenses such as hospitalization. (See the methodological appendix for further details of included and excluded expenditures.) Spending on housing is problematic to measure because only a small percentage of households, 38% in urban areas and 5% in rural areas, rented their dwellings. The rent paid by these households is used to estimate the rent that would be paid by households that own their home or live there for free. (See methodological appendix for further details.) The estimated share nationally for housing is 3.3% of non-food spending. It is higher in urban areas, 3.7%, compared to rural areas, 3.1%. The highest value of any region is found in North Western, at 8.1% of non-food spending. Similar to education
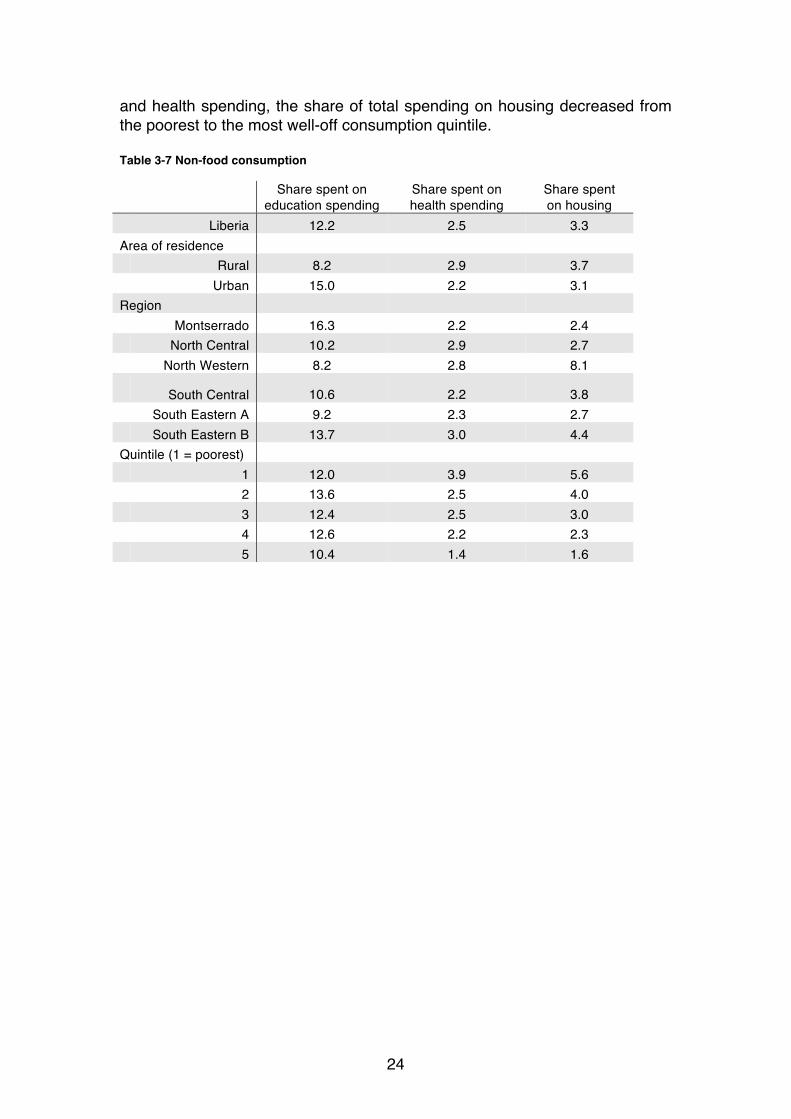
24
and health spending, the share of total spending on housing decreased from the poorest to the most well-off consumption quintile. Table 3-7 Non-food consumption
Share spent on
education spending Share spent on health spending
Share spent on housing
Liberia 12.2 2.5 3.3 Area of residence
Rural 8.2 2.9 3.7 Urban 15.0 2.2 3.1 Region
Montserrado 16.3 2.2 2.4 North Central 10.2 2.9 2.7 North Western 8.2 2.8 8.1
South Central 10.6 2.2 3.8 South Eastern A 9.2 2.3 2.7 South Eastern B 13.7 3.0 4.4 Quintile (1 = poorest)
1 12.0 3.9 5.6 2 13.6 2.5 4.0 3 12.4 2.5 3.0 4 12.6 2.2 2.3 5 10.4 1.4 1.6

25
4. FOOD SECURITY Food security is determined in the 2014 HIES at household level using two definitions. The first definition is based on varying degrees of food shortages recorded over the last seven days, as listed in Table 4-1. The second definition is based on the question that asks respondents whether they faced a situation in which they did not have enough food to feed the household over the last 12 months. The estimated proportions for the seven-day definition are tabulated in Table 4-1 and Table 4-2. The first table denotes whether a shortage (as defined in the first column) happened at all, once, twice or more than twice in the last 7 days. As the severity of food insecurity increases, the number of respondents suffering decreases. While about half of all households record having had to rely less on preferred foods in the 7 days prior to the interview, only just below 5% actually experienced a situation where at least one person in the household went a whole day and night without eating.
Table 4-1 Distribution of food shortages over the past 7 days
In the past 7 days, how many days have you or someone in your household had to
0 days 1 day 2 days 3 or more days
Rely on less preferred foods? 51.9% 13.6% 18.5% 16.0%
Limit variety of foods? 50.3% 13.5% 15.6% 20.6%
Limit portion of meal sizes? 55.1% 12.3% 15.0% 17.6%
Reduce number of meals a day? 56.7% 13.1% 13.0% 17.1%
Reduce food of adults for children? 76.1% 7.3% 7.7% 8.9%
Borrow food from friends or relatives? 88.3% 4.1% 4.1% 3.6%
Have no food at all in the HH? 90.3% 4.0% 2.9% 2.8%
Go a whole day and night without eating anything? 95.1% 2.6% 1.8% 0.5%
Table 4-2 reports the proportion of households reporting no concerns at national, urban, and rural level. Overall, there seem to be little differences in terms of food security thus defined between the strata. In most cases the number of respondents reporting no worries is slightly higher in urban areas, but the differences are small. Table 4-3 records the percentage of households that report not having enough food to feed the household at some point in the 12 months prior to the interview. Here, the difference between urban and rural areas is stronger.
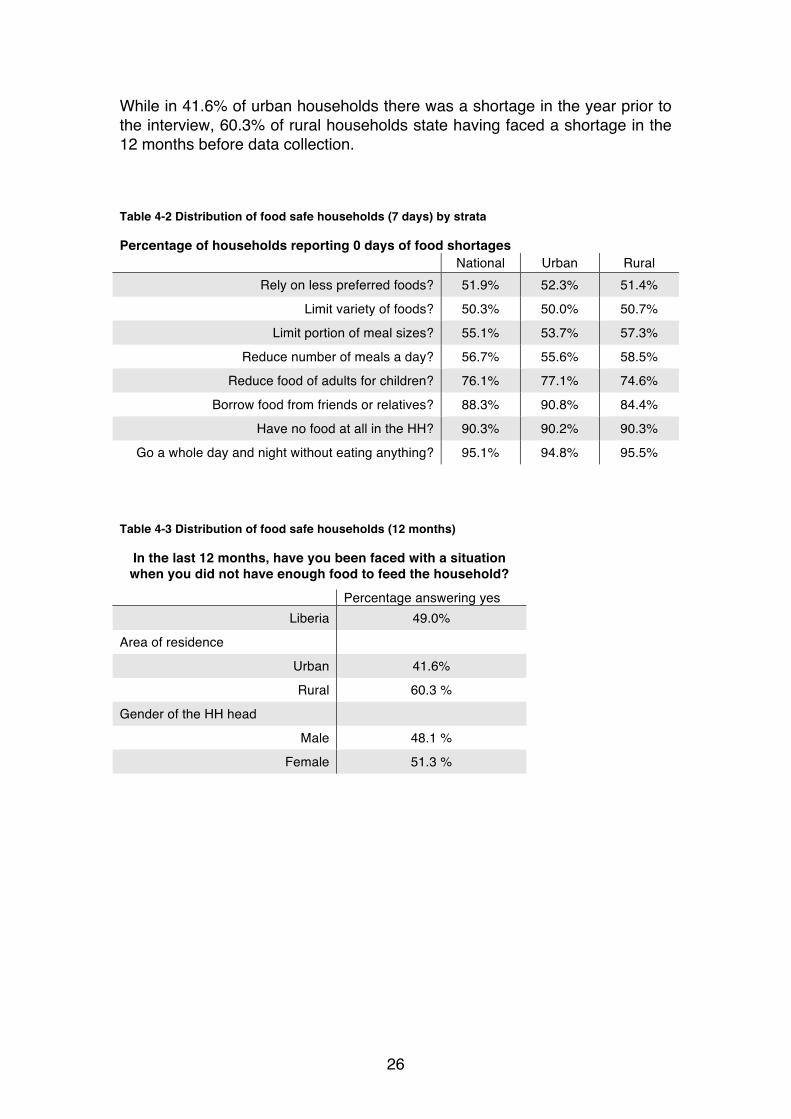
26
While in 41.6% of urban households there was a shortage in the year prior to the interview, 60.3% of rural households state having faced a shortage in the 12 months before data collection. Table 4-2 Distribution of food safe households (7 days) by strata
Percentage of households reporting 0 days of food shortages National Urban Rural
Rely on less preferred foods? 51.9% 52.3% 51.4%
Limit variety of foods? 50.3% 50.0% 50.7%
Limit portion of meal sizes? 55.1% 53.7% 57.3%
Reduce number of meals a day? 56.7% 55.6% 58.5%
Reduce food of adults for children? 76.1% 77.1% 74.6%
Borrow food from friends or relatives? 88.3% 90.8% 84.4%
Have no food at all in the HH? 90.3% 90.2% 90.3%
Go a whole day and night without eating anything? 95.1% 94.8% 95.5% Table 4-3 Distribution of food safe households (12 months)
In the last 12 months, have you been faced with a situation when you did not have enough food to feed the household?
Percentage answering yes Liberia 49.0%
Area of residence
Urban 41.6%
Rural 60.3 %
Gender of the HH head
Male 48.1 %
Female 51.3 %

27
5. HOUSING CHARACTERISTICS
1. Ownership status The first characteristic of Liberian housing considered is that of ownership status. Table 5-1 shows the distribution of housing ownership status in Liberia, differentiating between owner occupied dwellings, employer provided homes (subsidised or given for free), rented housing, and free housing. At national level, most respondents live in a home they own8 (45.9%). The second largest group rents their residence (28.1%). The third largest group (23.6%) receives housing for free though they do not have ownership of their housing, this would include examples where a household receives housing for free from relatives or friends. The prevalence of different types of ownership status differs according to location. In urban areas more people rent than own (41.8% versus 35.4%), while in rural areas the vast majority live in owner occupied housing (62%) and a very small proportion rent (6.9%). The small renting population in rural areas is likely predominantly made up of migrant labour, such as those who may travel for seasonal labour, and those who may have temporary project-based contracts, such as concession workers, and those working in non-governmental organisations and schools. Employer provided housing is a marginal phenomenon, mostly confined to large concessions. Among these cases, a full provision of housing is more common than a subsidised residence. Table 5-1 Distribution of ownership status
Location Gender of HH head Liberia Urban Rural Male Female
Owner occupied 45.9% 35.4% 62.0% 46.9% 43.5%
Employer provided (subsidy) 0.7% 1.0% 0.4% 1.0% 0.1%
Employer provided (free) 1.6% 1.5% 1.9% 2.2% 0.4%
Rented 28.1% 41.8% 6.9% 26.7% 31.4%
Free 23.6% 20.3% 28.8% 23.2% 24.6% 8 In the context of Liberia, land and property ownership status is not well defined, and so, this survey recognises ownership beyond the scope of only those possessing documentation evidencing ownership. A household is considered to own their housing if they do not pay rent for it, and are not given free lodging in a structure recognisably owned by another household or individual; they must have full authority to live in it freely and the right to sell it, whether they have purchased it, built it, or received the property for free (inherited or otherwise).

28
Differences between male and female-headed households exist, but are small. More male-led households own their house, while more female-headed homes are rented.
2. Rental costs Table 5-2 contains the estimated rental cost for the 28.1% that live in rented housing. Rental costs based on this population are representative of the rental market, but not representative of the general real estate as renters are not representative of the population as a whole. For example, renters are a much more urban subpopulation than the Liberian average. 58.4% of the renters pay between 350 and 999 LD per month for their dwelling. The rents are lower in rural areas than in urban areas. Only 7.9% of renters pay less than 350 LD in urban areas, while 37.9% of rural rents are below that threshold. Table 5-2 Distribution of rents paid
Stratum Gender of HH head Liberia Urban Rural Male Female
LD 1-199 1.6% 0.6% 10.2% 1.3% 2.2%
LD 200-349 9.4% 7.3% 27.7% 9.5% 9.1%
LD 350-599 30.6% 29.7% 38.3% 30.0% 31.8%
LD 600-999 27.8% 28.9% 18.0% 29.1% 25.2%
LD 1,000-1,499 11.1% 12.2% 1.1% 10.4% 12.6%
LD 1,500-1,999 6.3% 6.8% 1.4% 5.6% 7.6%
LD 2,000-2,999 3.5% 3.6% 2.6% 3.3% 4.0%
LD 3,000-5,999 4.7% 5.2% 0.2% 5.5% 3.2%
LD 6,000+ 5.1% 5.6% 0.4% 5.5% 4.3%
3. Electricity source Access to electricity is determined by asking households what their main source of electricity is. 81.3% of all households state that they have no access to electricity in their homes (Table 5-3); in rural areas the proportion of households without access to electricity is even higher at 94.2%. The Liberian Electricity Corporation electrifies 7.5% of urban households but no rural households. In urban areas approximately 14% of households obtain electricity from generators, while only some 3% have recourse to this option in rural areas.

29
Table 5-3 Distribution of main source of electricity for the household
Stratum Gender of HH head Liberia Urban Rural Male Female
None 81.3% 72.9% 94.2% 80.5% 83.3%
Community Generator 4.9% 7.3% 1.4% 5.4% 3.9%
Own Generator 4.4% 6.3% 1.7% 5.2% 2.6%
Electricity from Power Supplier (LEC) 4.5% 7.5% 0.0% 4.4% 4.8%
Solar Panels 0.2% 0.1% 0.5% 0.2% 0.3%
Car / Motorcycle Battery 3.9% 5.2% 2.0% 3.6% 4.7%
Other Source 0.6% 0.8% 0.4% 0.8% 0.3%
4. Dwelling structure Another important aspect of the housing characteristics is the materials the dwellings are made from. In the case that a household resides spread out over several dwellings, the estimation is based only on answers relating to the main dwelling. Table 5-4 list the distribution of the main material for the walls, while Table 5-5 shows the distribution of the main material for the roof. The majority of dwellings’ walls in Liberia are made of mud and sticks (40.5%). Concrete and cement blocks (25.2%) and mud bricks (22.2%) are the next most common materials for the walls. There are significant differences between rural and urban dwellings. In rural Liberia the use of mud and sticks and mud bricks are ubiquitous (94.4%). In the urban parts of the country concrete and cement blocks, as well as zinc, iron, and tin, make up nearly 50% of the material used for walls. Table 5-4 Distribution of main material for walls
Stratum Gender of HH head Liberia Urban Rural Male Female
Mud and Sticks 40.5% 17.6% 75.6% 42.3% 36.4%
Mud Bricks 22.2% 24.4% 18.8% 21.4% 24.1%
Zinc / Iron / Tin 6.1% 10.1% 0.1% 5.9% 6.6%
Stone / Clay Bricks 5.2% 8.1% 0.9% 5.2% 5.3%
Concrete / Cement Blocks 25.2% 38.9% 4.2% 24.6% 26.4%
Other Material 0.8% 1.0% 0.4% 0.6% 1.2% Far less diversity exists in materials used for dwellings’ roof (Table 5-5). Sheets of zinc, iron or tin are used to roof the vast majority of dwellings in the country (81.7%) and nearly all roofs in urban areas (92.5%). The percentage in rural areas is lower (65.1%), where there is a higher prevalence of thatched roofs (33.4%).

30
Table 5-5 Distribution of main material for roof
Stratum Gender of HH head Liberia Urban Rural Male Female
Concrete / Cement 0.8% 1.0% 0.3% 0.9% 0.4%
Roofing Tiles 0.3% 0.4% 0.1% 0.3% 0.2%
Asbestos 1.1% 1.5% 0.7% 1.2% 1.1%
Iron Sheets / Zinc / Tin 81.7% 92.5% 65.1% 80.3% 84.9%
Tarpaulin / Plastic Sheet 0.4% 0.5% 0.4% 0.4% 0.6%
Straw / Grass / Bamboo / Thatch 15.7% 4.1% 33.4% 16.9% 12.9%
5. Source of drinking water Access to drinking water has important implications for both urban planning and public health, among other areas. Table 5-6 lists the sources of drinking water households mainly accessed in both the dry and the rainy season. Table 5-6 Distribution of main source of drinking water in the different seasons by stratum
Rainy Season Dry Season
Urban Rural Urban Rural
Pipe or Pump Indoors 6.0% 0.1% 6.0% 0.1%
Pipe or Pump Outdoors 29.1% 27.0% 28.3% 26.0%
Public Standpipe / Tap 18.7% 17.7% 18.3% 16.2%
Boreholes / Tubewell / Mechanical Well 23.0% 16.4% 22.3% 15.2%
Neighbouring Household 0.7% 0.1% 0.9% 0.7%
Water Vendor (Clean Water) 1.2% 0.0% 1.4% 0.1%
Push Push-Push Water Vendor 0.9% 0.0% 0.9% 0.0%
Closed Well 8.1% 2.8% 9.1% 2.9%
Open Well 2.0% 4.7% 2.3% 5.2%
River, Lake, or Creek 1.4% 29.3% 2.1% 33.4%
Rainwater 0.5% 1.8% 0% 0%
Bottled Water / Drum / Plastic Bag 8.0% 0.1% 8.0% 0.2%
Other Source 0.4% 0.0% 0.4% 0.0% Indoor pumps or pipes are still a rare and nearly exclusively urban phenomenon in Liberia, only 6% of households use them for drinking water in urban areas and 0.1% in rural areas. Rivers, lakes, or creeks are the single largest source of drinking water in rural areas (29.3% in the rainy season, 33.4% in the dry season), while playing a minor role in urban Liberia (1.4% and 2.1% respectively).

31
Outdoor pipes or pumps are the most significant source of drinking water for urban dwellers (29.1% in the rainy season, 28.3% in the dry season). In rural areas they are also the second largest source of drinking water in both urban and rural areas (27% and 26% respectively).
6. Garbage disposal Based on the 2014 HIES, only a small proportion of Liberians had their garbage collected or disposed of it in a government bin (10.8% of the cases). Furthermore, these planned forms of disposal are largely urban phenomenon, representing 17.6% of all cases in urban areas, and nearly none in the rural parts of the country. In rural areas majority of households abandon garbage in sites that are not purpose built for disposal (94% of cases), including methods such as burying, burning and abandoning garbage in unauthorised sites. Table 5-7 Distribution of main method of garbage disposal
Stratum Gender of HH head Liberia Urban Rural Male Female
Collected by Government 4.2% 6.9% 0.0% 4.0% 4.6%
Collected by Private Firm 4.7% 7.5% 0.4% 4.9% 4.2%
Government Bin 1.9% 3.2% 0.0% 1.5% 2.9%
Bury 3.7% 4.9% 1.8% 3.9% 3.2%
Burn 5.5% 8.5% 0.9% 5.7% 4.8%
Disposal within compound 4.7% 6.3% 2.1% 4.9% 4.2%
Abandon/ Unauthorised Site 72.6% 58.6% 94.0% 72.4% 73.0%
Other Method 2.7% 4.1% 0.8% 2.6% 3.0%

32
6. EDUCATION
1. Literacy Rate Literacy can be seen as the stepping-stone to all further learning and thus is a crucial measure of a country’s development. The HIES 2014 captured literacy ability based on respondent’s self-evaluation of their ability to read and write either in English or any other language. The literacy rate is measured based on responses for those aged between 15 and 49. It should be noted that the methodology used is different to that used to construct the LDHS literacy estimates, and thus is not comparable. Based on the HIES 2014, the national literacy rate is estimated to be 66.7% (Table 6-1). That is, just over two thirds of Liberians are able to read and write. Residents of urban areas are more likely to be able to read and write than those of rural areas (76.0% versus 50.1%). The gap between men and women is even larger. While 80.4% of males are reported as literate, only 54.8% of females are.
There are also strong regional differences, with a lower literacy rate of 50.9% in the North Western region and a relatively high rate of 80.4% in Montserrado. From the data based on consumption quintiles it can be seen that literacy is highly correlated with poverty. Poorer residents are less likely to be literate. Only 45.8% of the respondents in the first, lowest, consumption quintile, are able to read and write, while a full 84.4% are capable in the fifth,
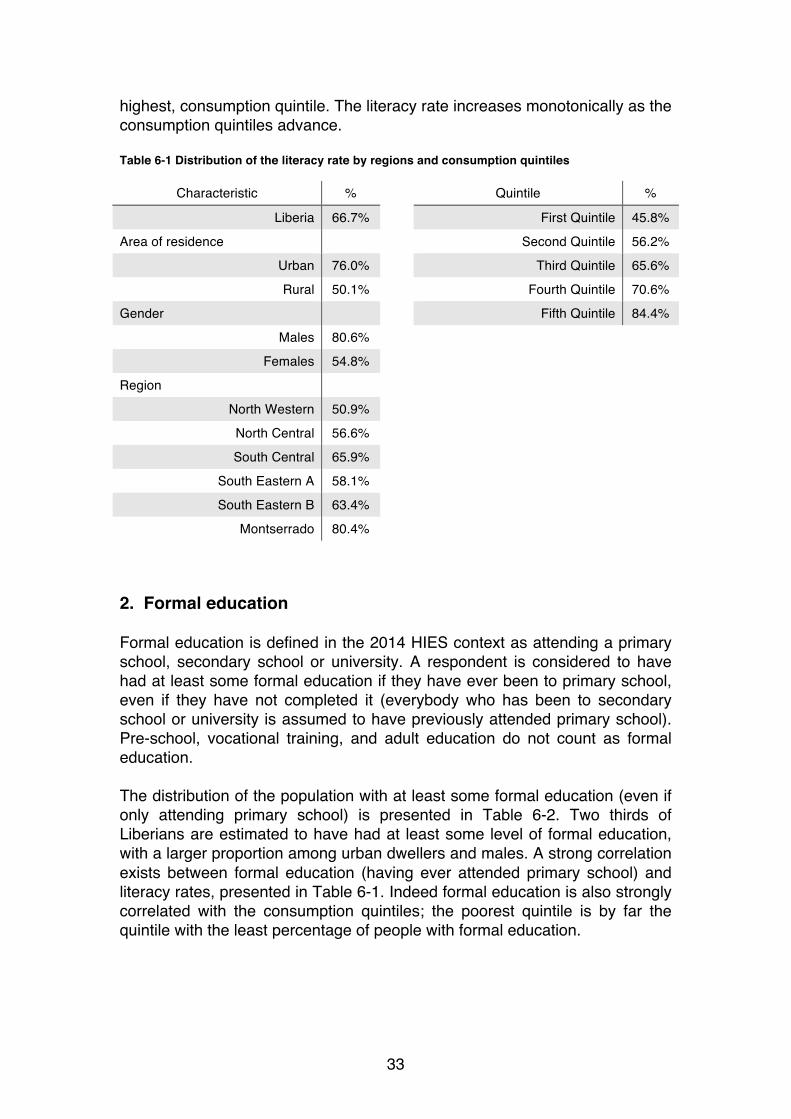
33
highest, consumption quintile. The literacy rate increases monotonically as the consumption quintiles advance. Table 6-1 Distribution of the literacy rate by regions and consumption quintiles
Characteristic % Quintile %
Liberia 66.7% First Quintile 45.8%
Area of residence Second Quintile 56.2%
Urban 76.0% Third Quintile 65.6%
Rural 50.1% Fourth Quintile 70.6%
Gender Fifth Quintile 84.4%
Males 80.6%
Females 54.8%
Region
North Western 50.9%
North Central 56.6%
South Central 65.9%
South Eastern A 58.1%
South Eastern B 63.4%
Montserrado 80.4%
2. Formal education Formal education is defined in the 2014 HIES context as attending a primary school, secondary school or university. A respondent is considered to have had at least some formal education if they have ever been to primary school, even if they have not completed it (everybody who has been to secondary school or university is assumed to have previously attended primary school). Pre-school, vocational training, and adult education do not count as formal education. The distribution of the population with at least some formal education (even if only attending primary school) is presented in Table 6-2. Two thirds of Liberians are estimated to have had at least some level of formal education, with a larger proportion among urban dwellers and males. A strong correlation exists between formal education (having ever attended primary school) and literacy rates, presented in Table 6-1. Indeed formal education is also strongly correlated with the consumption quintiles; the poorest quintile is by far the quintile with the least percentage of people with formal education.

34
Table 6-2 Distribution of the population with formal education by region and consumption quintile
Characteristic % Quintile %
Liberia 62.3% First Quintile 43.5%
Area of residence Second Quintile 51.4%
Urban 71.9% Third Quintile 61.3%
Rural 46.8% Fourth Quintile 66.3%
Gender Fifth Quintile 80.6%
Males 77.0%
Females 49.3%
Region
North Western 46.1%
North Central 52.6%
South Central 61.5%
South Eastern A 55.8%
South Eastern B 62.3%
Montserrado 75.9% Attaining any level of formal education is not simply a poverty-determined phenomenon. The age structure of the population in regards to formal education reveals two interrelated results, which paint a more positive picture. The first is that the lack of formal education is mostly a problem of inadequate schooling in the past, it is much more common among the oldest generations, a far lower proportion of those 60 years and above have ever attended primary school; the improved rates of formal education attainment can be mostly seen in those under the age of 30. The second result is that the wealth effect is strongest among the older generation. Looking at both ends of Table 6-3 it can be seen that only 18.7% of Liberians over the age of 64 are estimated to have a formal education. The rate is as low as 3.6% in the poorest quintile and ten times larger (albeit still low at 36.9%) in the fifth quintile. Liberians of 15-19 years of age are much more likely to have any level of formal education (87.4%), and the impact of poverty is certainly present, but not as strong. In the poorest quintile 81% of 15-19 year olds have are estimated to have ever attended primary school, while in the richest quintile the estimate is 95.3%.

35
Table 6-3 Distribution of the population with formal education by age groups
Age groups Liberia 1st Quintile 5th Quintile
15-19 87.4% 81.0% 95.3%
20-24 78.4% 58.6% 89.4%
25-29 68.9% 41.1% 84.5%
30-34 56.6% 35.1% 78.0%
35-39 56.3% 39.9% 76.2%
40-44 54.4% 36.8% 75.2%
45-49 56.0% 34.9% 82.6%
50-54 48.6% 41.0% 71.4%
55-59 50.3% 40.7% 62.3%
60-64 29.8% 17.9% 35.6%
65+ 18.7% 3.6% 36.9%
3. Highest education achieved The distribution of the highest educational level achieved (Table 6-4) is derived from data on respondents aged 15 years and above, both those who are out of education and those currently in formal education. For the vast majority of Liberians with formal education, primary school is their highest educational attainment (43.2%), followed by senior high school (27.9%), and junior high school (20.8%). Less than 10% of those with formal education have a university degree, whether a Bachelor’s degree or a more advanced degree. A gender bias is also present with regards to the highest educational achievement. Women are less likely to go to university than men, and more likely to only have gone to primary school if they have formal education. Table 6-4 Distribution of the population with formal education by highest educational achievement
Liberia Male Female
Primary School 43.2% 37.6% 50.3%
Junior High School 20.8% 20.6% 21.2%
Senior High School 27.9% 31.1% 23.8%
University (Bachelor’s) 7.8% 10.4% 4.5%
Master’s or PhD 0.3% 0.4% 0.1%

36
4. Education provider The 2014 HIES also inquired about the type of institution providing the education for those currently in education. Table 6-5 presents the results. Government is the main provider of education in Liberia. At national level 47.7% of those in education are in a government institution. Private non-religious schools are the second most common provider (29.3%), followed by religious entities (22.2%). The state plays a much larger role in the provision of education in rural areas (76.6%) and among the poor (79.7%) than in urban areas (36.8%) and in the richer quintile (28.6%). Private providers, religious or not, play a stronger role in urban areas and in educating the better off in the country. Table 6-5 Distribution of educational providers
Liberia Urban Rural 1st Quintile 5th Quintile
Government 47.7% 36.8% 76.6% 79.7% 28.6%
Church/missionary school 19.5% 23.9% 7.8% 8.0% 27.6%
Islamic school 1.7% 2.2% 0.1% 0.2% 3.0%
Private non-religious 29.3% 35.6% 12.6% 10.2% 40.0%
Community 1.3% 1.3% 1.2% 1.3% 0.5%
Other provider 0.6% 0.2% 1.8% 0.6% 0.3%
5. Time to school The time spent to get to school is recorded and shown in Table 6-6. It should be noted that this measure does not take account for different methods of transport. In the majority of cases, pupils require between 10 minutes and half an hour to get to school. The distribution is more condensed in the mid range, 10-29 minutes, for urban pupils and more spread out for rural pupils: in rural areas it is more common to both be closer to school or very far away from school. Table 6-6 Distribution of the time to school
Liberia Urban Rural 1st Quintile 5th Quintile
0-4 minutes 6.6% 5.0% 11.0% 5.2% 5.4%
5-9 minutes 16.2% 13.3% 23.7% 27.0% 14.4%
10-29 minutes 47.8% 50.3% 41.3% 40.0% 50.4%
30-59 minutes 24.5% 27.4% 16.8% 21.8% 25.5%
60+ minutes 4.9% 4.1% 7.2% 6.0% 4.2%

37
6. Source of books Schoolbooks are a central medium of instruction. Table 6-7 shows the distribution of the ownership status of books used by students for their schooling. In around 85% of the cases students either own the books or borrow them from school. This overall figure is fairly stable among urban/rural and richer/poorer students – the distribution between owning and borrowing, is not. Urban and richer students are much more likely to own their books, while poorer and rural students will primarily borrow the books from the school. Table 6-7 Distribution of the source of school books
Liberia Urban Rural 1st Quintile 5th Quintile
Borrowed from school 41.6% 35.5% 60.8% 65.3% 29.2%
Owned by household 44.4% 49.9% 27.2% 17.5% 55.0%
Borrowed from friend / relative 6.4% 7.5% 3.2% 10.9% 7.7%
Borrowed from school & owned by
household 5.2% 5.5% 4.5% 2.2% 5.7%
Borrowed from school & other 1.3% 1.5% 0.7% 0.5% 2.4%
Other source 0.9% 0.1% 3.5% 3.5% 0.0%
7. Expenditure per pupil Table 6-8 reports educational expenditure per household member in the last 12 months. This includes all formal education related expenditure (not only tuition fees and textbooks, but also notebooks, stationary, uniforms, school provided transport) as well as expenditure for non-formal education (vocational training, pre-school, etc.). At national level, only in few cases have pupils spent less than 1,000 LD (4.8%) or more than 15,000 LD (16.7%). As could be expected, the distribution of the expenditure in between depends on the urban/rural stratum and the poverty level (as measured by consumption) of the household. In rural Liberia and among the poorest quintile 59% and 62% of expenditure per pupil falls between 1,000 and 3,500 LD respectively. In urban areas most households spend between 6,000 and 10,000 LD (19.1%) per pupil while nearly 50% of the richer pupils spend between 6,000 and 20,000 LD.

38
Table 6-8 Distribution of the expenditure per pupil
Liberia Urban Rural 1st Quintile 5th Quintile
LD 1-499 0.8% 0.2% 2.4% 3.9% 0.0%
LD 500-999 4.0% 1.7% 9.9% 12.9% 1.4%
LD 1,000-1,999 17.7% 11.1% 35.1% 37.3% 4.9%
LD 2,000-3,499 18.0% 15.8% 23.9% 24.7% 9.5%
LD 3,500-5,999 15.2% 16.2% 12.5% 10.3% 12.1%
LD 6,000-9,999 16.4% 19.1% 9.4% 9.0% 15.1%
LD 10,000-14,999 11.3% 14.3% 3.1% 1.0% 17.9%
LD 15,000-19,999 7.3% 9.4% 2.0% 0.5% 15.2%
LD 20,000-29,999 6.0% 7.6% 1.5% 0.4% 13.9%
LD 30,000-49,999 2.2% 3.0% 0.1% 0.0% 6.0%
LD 50,000+ 1.2% 1.6% 0.2% 0.0% 4.0%
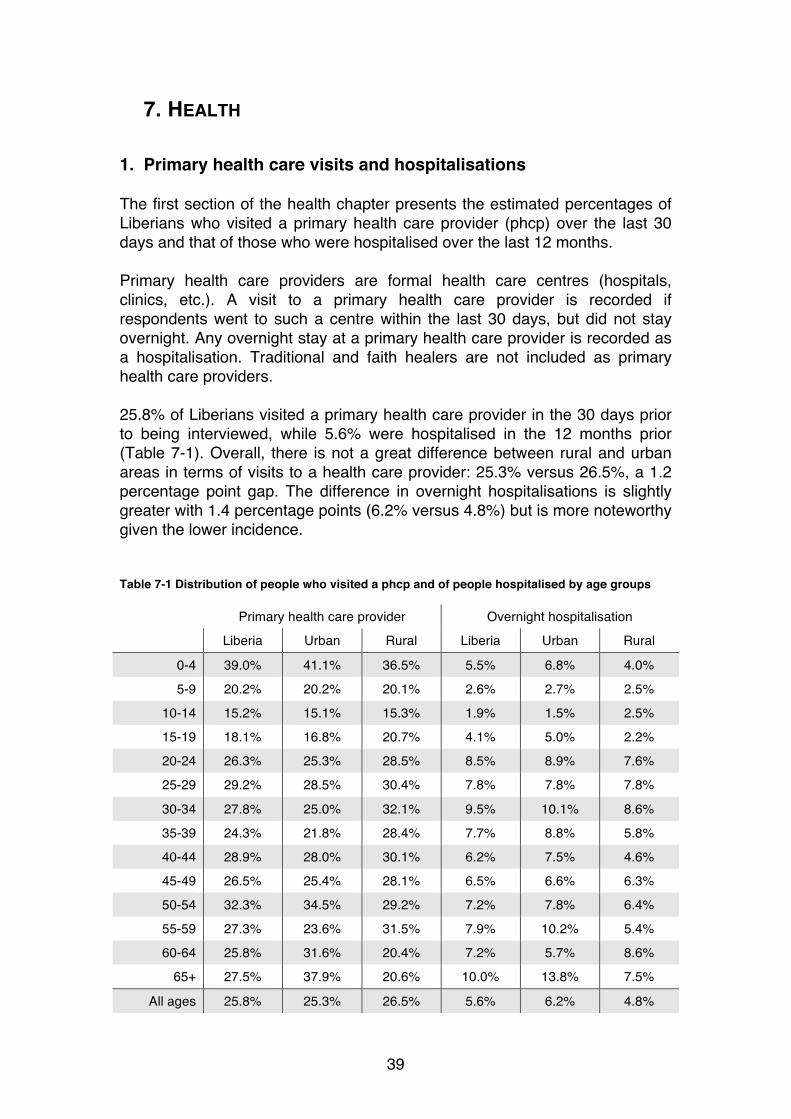
39
7. HEALTH
1. Primary health care visits and hospitalisations The first section of the health chapter presents the estimated percentages of Liberians who visited a primary health care provider (phcp) over the last 30 days and that of those who were hospitalised over the last 12 months. Primary health care providers are formal health care centres (hospitals, clinics, etc.). A visit to a primary health care provider is recorded if respondents went to such a centre within the last 30 days, but did not stay overnight. Any overnight stay at a primary health care provider is recorded as a hospitalisation. Traditional and faith healers are not included as primary health care providers. 25.8% of Liberians visited a primary health care provider in the 30 days prior to being interviewed, while 5.6% were hospitalised in the 12 months prior (Table 7-1). Overall, there is not a great difference between rural and urban areas in terms of visits to a health care provider: 25.3% versus 26.5%, a 1.2 percentage point gap. The difference in overnight hospitalisations is slightly greater with 1.4 percentage points (6.2% versus 4.8%) but is more noteworthy given the lower incidence. Table 7-1 Distribution of people who visited a phcp and of people hospitalised by age groups
Primary health care provider Overnight hospitalisation
Liberia Urban Rural Liberia Urban Rural
0-4 39.0% 41.1% 36.5% 5.5% 6.8% 4.0%
5-9 20.2% 20.2% 20.1% 2.6% 2.7% 2.5%
10-14 15.2% 15.1% 15.3% 1.9% 1.5% 2.5%
15-19 18.1% 16.8% 20.7% 4.1% 5.0% 2.2%
20-24 26.3% 25.3% 28.5% 8.5% 8.9% 7.6%
25-29 29.2% 28.5% 30.4% 7.8% 7.8% 7.8%
30-34 27.8% 25.0% 32.1% 9.5% 10.1% 8.6%
35-39 24.3% 21.8% 28.4% 7.7% 8.8% 5.8%
40-44 28.9% 28.0% 30.1% 6.2% 7.5% 4.6%
45-49 26.5% 25.4% 28.1% 6.5% 6.6% 6.3%
50-54 32.3% 34.5% 29.2% 7.2% 7.8% 6.4%
55-59 27.3% 23.6% 31.5% 7.9% 10.2% 5.4%
60-64 25.8% 31.6% 20.4% 7.2% 5.7% 8.6%
65+ 27.5% 37.9% 20.6% 10.0% 13.8% 7.5%
All ages 25.8% 25.3% 26.5% 5.6% 6.2% 4.8%

40
Usually, a U-shaped distribution over age is expected, with a small increase in the middle. This represents the fact that most medical attention is concentrated in infancy and old age, with an increase for women during childbearing age.
2. Primary health care provider Table 7-2 shows the frequency of primary health care providers based on respondents’ most recent visit in the 30 days prior to the interview. It is estimated at national level that about 60% of all those in need of a health care go to a government facility (be it hospital or clinic), while 28.1% go to private non-religious providers (clinic or hospital). Table 7-2 Distribution of primary health care provider by stratum and consumption quintile
Liberia Urban Rural
1st Quintile
3rd Quintile
5th Quintile
Government hospital 25.5% 28.5% 21.2% 33.1% 21.4% 23.8%
Private hospital 11.1% 15.2% 5.4% 2.5% 8.0% 23.5%
Religious hospital 2.0% 3.2% 0.4% 0.5% 1.2% 5.6%
Government clinic 35.8% 21.8% 55.4% 50.1% 40.1% 12.8%
Private clinic 17.0% 21.9% 10.1% 8.2% 20.8% 26.2%
Religious clinic 2.4% 3.4% 1.0% 2.4% 2.0% 2.2%
Drug dispensary 4.5% 4.6% 4.3% 1.8% 4.3% 4.7%
TTM/NGO 0.6% 0.5% 0.6% 0.4% 0.5% 0.4%
Private doctor/dentist 0.7% 0.4% 1.0% 0.9% 1.1% 0.4%
Other 0.4% 0.2% 0.7% 0.1% 0.7% 0.5% In urban areas government providers play a smaller role in provision (50.3%), and within government providers, hospitals take up a larger percentage of the cases as compared to government clinics (28.5% vs. 21.8%). The opposite is true for rural Liberia, where government providers treat the majority of patients (76.6%), with government clinics alone taking in 55.4% of rural patients. The breakdown over consumption quintiles shows that, as poverty decreases, people move away from government providers and rely more and more on non-religious private health care providers. 49.7% of cases in the fifth and least poor quintile are seen by private non-religious providers while only 10.7% in the first and poorest quintile are.

41
All regions except for South Central show a pattern roughly similar to the national average (Table 7-3). South Central consists of Margibi and Grand Bassa, both of which have private health care providers of considerable quality, including the Firestone hospital in Margibi and the Arcelor Mittal Clinic in Grand Bassa. It is noteworthy to point out the relative importance of drug dispensaries (e.g. pharmacies) in the South Eastern regions.
Table 7-3 Distribution of primary health care provider by region
North
Western North
Central South
Central South
Eastern A South
Eastern B Montse-
rrado
Government hospital 29.1% 23.5% 24.7% 31.6% 26.3% 24.6%
Private hospital 3.5% 3.5% 23.5% 3.9% 3.7% 24.7%
Religious hospital 0.9% 2.6% 1.7% 0.6% 0.3% 3.0%
Government clinic 52.5% 51.7% 17.9% 40.8% 50.0% 8.3%
Private clinic 7.9% 9.8% 28.1% 8.0% 8.9% 31.9%
Religious clinic 0.0% 3.0% 0.6% 1.9% 0.8% 3.9%
Drug dispensary 2.4% 3.9% 1.4% 11.3% 9.5% 2.9%
TTM/NGO 0.3% 1.1% 0.6% 0.5% 0.2% 0.2%

42
Private doctor/dentist 0.4% 1.0% 1.2% 1.0% 0.1% 0.2%
Other 2.9% 23.5% 0.4% 0.4% 0.2% 0.3% Table 7-4 present the breakdown of the time taken to reach the primary health care provider. This table does not differentiate by method of transport. It can be seen that about 80% of people are able to get to the health care provider in less than 60 minutes. In urban areas it is in fact about 90% of people who are able to arrive within one hour. Rural areas are more challenged in terms of their infrastructure and thus only some 70% of visitors to primary health care providers arrive within 60 minutes. Table 7-4 Distribution of time to primary health care provider
Stratum Liberia Urban Rural
< 10 minutes 18.6% 23.1% 12.3%
10-19 minutes 25.0% 29.9% 18.0%
20-39 minutes 26.1% 27.0% 24.9%
40-59 minutes 11.9% 10.3% 14.0%
60-119 minutes 11.2% 7.1% 17.0%
120+ minutes 7.2% 2.5% 13.7% It is not only relevant to look at the time it takes to get to the health care provider, but also the method of transportation (Table 7-5). Here there are not only differences between urban and rural parts of the country but among the different poverty quintiles. At national level, nearly all of those in need of primary medical attention reach the provider by either foot (53.8%) or by public motorcycle (24.6%) or by public taxi (14.1%). In urban areas the majority of people still go by foot, but less than at national level, motorcycles and taxis are used more often. In rural Liberia, motorcycles are still the second most important method (21.2%), but it is walking that makes up nearly two-thirds of all trips (62.7%). Among the first quintile the percentage of walkers goes up to 70.4, while only 37.2% of people in the fifth quintile reach their primary health care provider by foot. Motorcycles and taxis represent nearly 50% of all trips and private cars start appearing as a significant method of transportation. Table 7-5 Distribution of the method of transportation to primary health care provider
Liberia Urban Rural 1st Quintile 5th Quintile

43
On foot 53.8% 47.5% 62.7% 70.4% 37.2%
Private: Bicycle 0.4% 0.4% 0.4% 0.1% 0.8%
Private: Car 2.2% 2.9% 1.3% 0.6% 6.7%
Private: Motorcycle 2.5% 1.8% 3.5% 3.6% 3.1%
Private: Other 0.1% 0.0% 0.2% 0.0% 0.2%
Public: Taxi 14.1% 18.2% 8.4% 6.6% 20.8%
Public: Bus 1.5% 1.8% 1.0% 1.5% 1.6%
Public: Motorcycle 24.6% 27.1% 21.2% 17.0% 29.6%
Public: Other 0.7% 0.3% 1.4% 0.3% 0.2% In many cases, the treatment provided, especially by government health providers is free of charge for the patient. In those cases when it is not, the cost of the last visit to the primary health care provider was used to estimate the costs for treatment on average (Table 7-6). For Liberia as a whole, nearly 80% of all treatments will cost less than 2,000 Liberian Dollars, and more than 90% will cost less than 3,500 LD. Costs are higher in urban than in rural areas. In urban areas 76.8% of treatments will cost less than 2,000 LD. In rural areas 88.9% of all cases are below that benchmark and not even 5% do cost more than 3,500 LD. This need not mean that attention is cheaper in rural areas. It just may mean that certain, more expensive treatments are simply not available in the rural parts of the country or not attainable by those in need. Table 7-6 Distribution of the cost of most recent visit to primary health care provider
Liberia Urban Rural
LD 1-49 1.6% 0.6% 4.3%
LD 50-99 3.0% 2.0% 6.0%
LD 100-199 6.0% 4.7% 9.6%
LD 200-499 18.1% 15.6% 25.1%
LD 500-999 29.0% 28.7% 29.9%
LD 1,000-1,999 22.3% 25.2% 14.1%
LD 2,000-3,499 12.4% 14.6% 6.0%
LD 3,500-5,999 4.7% 5.2% 3.2%
LD 6,000-9,999 1.2% 1.5% 0.5%
LD 10,000+ 1.8% 1.9% 1.4%

44
3. Overnight hospitalisations The data collected on overnight hospitalisations follows largely expected patterns. Of those that have spent at least one night in hospital in the past 12 months, around 80% were only hospitalised once and 95% were hospitalised at most two times over the year previous year. Table 7-7 presents the age distribution of those hospitalised in the last 12 months. The estimations for Liberia show a stronger incidence of hospitalisation during early childhood and for females, during the most fertile years (20-40), driven by women’s need for hospitalisation during pregnancies. There is also an uptick in incidence of hospitalisation in older age. The absolute percentages recorded here may seem low, but the relative presence of the age groups has to be recalled. Only around 2.6% of the population is over 65 years of age, but 4.3% of hospital patients are. The poverty effect also seems to play a role. Children in the fifth and least poor quintile are relatively less likely to be hospitalised than those in the first and most poor quintile, perhaps due to better preventive measures among richer Liberians. Women of childbearing age are, on the other hand, much more likely to spend at least one night in a hospital. This correlates with the information on births recorded in section 3 of this chapter. The incidence of hospitalisation for those aged 65 and above is higher for the poorer residents than for the richer. However, in the middle-aged group, richer Liberians experience a higher incidence of hospitalisation than poorer Liberians. Table 7-7 Age distribution of patients with overnight hospitalisations
Liberia Male Female 1st Quintile 5th Quintile
0-4 15.7% 19.5% 13.4% 17.2% 12.3%
5-9 7.7% 8.8% 7.1% 11.2% 2.7%
10-14 4.1% 5.8% 3.1% 4.8% 3.2%
15-19 6.5% 8.4% 5.3% 4.8% 5.0%
20-24 12.5% 8.3% 15.2% 11.3% 15.9%
25-29 10.5% 5.9% 13.4% 10.8% 17.1%
30-34 12.0% 8.6% 14.2% 11.7% 12.4%
35-39 7.9% 5.5% 9.3% 10.0% 6.1%
40-44 5.3% 4.8% 5.7% 5.8% 8.2%
45-49 4.9% 5.7% 4.4% 3.8% 1.7%
50-54 3.9% 6.3% 2.4% 0.7% 7.7%
55-59 2.5% 3.7% 1.8% 1.0% 5.0%
60-64 2.1% 3.9% 0.9% 4.1% 1.2%
65+ 4.3% 5.0% 3.8% 2.9% 1.6%

45
Table 7-8 lists the costs incurred in overnight hospitalisation over the last 12 months in broad expenditure categories. While one fifth of those in need of hospitalisation did receive treatment at no cost, around 50% of those hospitalised spend between 500 and 3500 Liberian Dollars. The distribution in rural areas is more strongly skewed towards the lower end of the scale, meaning that a larger percentage of the population in rural Liberia faces smaller hospital bills or receive free treatment. Table 7-8 Distribution of cost of overnight hospitalisations in the last 12 months
Liberia Urban Rural
No expenditure 20.8% 18.4% 25.3%
LD 1-499 3.2% 2.8% 3.8%
LD 500-999 10.5% 10.2% 11.1%
LD 1,000-1,999 17.3% 16.2% 19.4%
LD 2,000-3,499 24.7% 26.7% 20.9%
LD 3,500-5,999 8.0% 7.8% 8.5%
LD 6,000-9,999 6.9% 7.6% 5.6%
LD 10,000-14,999 4.2% 5.3% 2.1%
LD 15,000-19,999 1.5% 1.8% 0.9%
LD 20,000-49,999 2.1% 2.5% 1.5%
LD 50,000+ 0.8% 0.8% 0.8%
4. Births Women of fertile age (defined for the 2014 HIES as between ages of 12 and 49 years) where asked whether they had given birth in the previous 24 months. Based on the responses it is estimated that 26.6% of women had a live birth within the last two years. It should be noted that a live birth is recorded regardless of the baby’s lifespan. The number is higher in rural areas (33.3%) than in urban areas (22.8%) (see Table 7-9). The established pattern that richer individuals seem to choose smaller families holds for Liberia as well. While the percentage of women with a birth in the last 24 months is 36.2% in the lowest consumption quintile, the proportion decreases steadily as consumption increases. That is, the figure is 30.1% in the second quintile, 29.1% in the third quintile, 23.1% in the fourth quintile, and 17.7% in the fifth (and richest) quintile. Table 7-9 Distribution of women with at least one birth in the last 24 months
Stratum Liberia Urban Rural

46
Poorest Quintile 36.2% 30.0% 40.5%
Second Quintile 30.1% 26.4% 34.4%
Third Quintile 29.1% 26.9% 32.3%
Fourth Quintile 23.1% 22.2% 25.3%
Highest Quintile 17.7% 16.9% 24.0%
Total (All Quintiles) 26.6% 22.8% 33.3% Table 7-10 shows the distribution of the place of birth for the most recent birth over the previous two years. Two thirds of births take place in government facilities, while about one in ten births take place in the mother’s home. Table 7-10 Distribution of place of delivery of last child birth
Liberia Urban Rural 1st Quintile 5th Quintile
Government hospital 30.5% 36.0% 23.7% 26.9% 33.4%
Private hospital 8.6% 12.2% 4.1% 1.5% 25.5%
Religious hospital 1.6% 2.8% 0.1% 1.2% 8.6%
Government clinic 34.8% 24.5% 47.5% 48.9% 13.5%
Private clinic 9.6% 13.4% 5.0% 4.2% 12.8%
Religious clinic 0.7% 1.0% 0.5% 0.5% 0.0%
Traditional healer’s dwelling 2.1% 1.1% 3.2% 3.1% 0.5%
Home 10.9% 7.7% 14.8% 13.4% 3.3%
Other 1.1% 1.2% 1.1% 0.3% 2.3% In line with what has been show in this chapter, government hospitals play a bigger role in urban areas (36%), while government clinics are the main provider of health services in rural areas (47.5%). Furthermore, the percentage of home births is larger in rural areas than in urban areas (14.8% versus 7.7%). Looking at poverty quintiles, the percentage of births at any kind of hospital is much larger (67.5%) in the fifth quintile than in the first quintile (29.6). Nearly one in six births in the poorest quintile take place either the mother’s home or in a traditional healer’s dwelling, as compared to less than 4% in the richest quintile.

47
8. EMPLOYMENT
1. Informal employment, vulnerable employment, and unemployment
The percentages recorded in Table 8-1 are based on the concepts of informal employment, vulnerable employment, and unemployment, which are clarified below. The definition of an unemployed person, according to international standards, is one who shows three characteristics. Firstly, the person should not be working. Secondly, the person must be available to work, meaning would accept employment if they were offered any. Thirdly, the person must be actively looking for work (by being registered at unemployment office, for example) to be actually counted as unemployed. This last characteristic is sometimes not included in environments where the labour market is strongly underdeveloped, which is considered the case for Liberia. As such, the third condition of actively seeking work was not considered in the methodology used here. The informal employment rate requires a more specific definition, based on certain profession (using their ISCO code) and whether the employer is registered with the Ministry of Commerce, among other characteristics. The exact definition used for this Statistical Abstract can be found in the 2010 Liberia Labour Force Survey9 (LFS), since the LFS guidelines were used to produce these estimates. In line with ILO standards, the base population for the calculation of the informal employment rate excludes those employed in own account farming, but includes wage labourers working in the agriculture sector. Thus a person working on his or her own farm is not included, while a labourer on a rubber concession is. Finally, those in vulnerable employment are seen as those either employed on their own account or working as a contributing family worker to either the family farm or the household’s non-agricultural business. Focusing first on unemployment it is clear to see that the rate is low in Liberia. Nationally it stands at 2.8%, reaching 4.5% in urban areas and 0.8% in rural areas. The highest regional rate of unemployment is the 5.4% recorded for Montserrado, the lowest percentage is the 0.7% reported in the North Central region. The disaggregation by consumption quintile reveals that unemployment is lowest among poorer Liberians. This is in line with the overall low unemployment rate in the country: unemployment is not an option. People
9 The Labour Force Survey can be downloaded from the ILO’s website.

48
need to find a means of income through some type of employment, however informal or vulnerable, in order to sustain themselves, even in rural areas. Unemployment increases as people become less poor, only to fall again in the richest quintile. This probably is because, as poverty decreases, people have the chance to wait out for a better employment opportunity. Table 8-1 Distribution of informal and vulnerable employment, and unemployment rates
Informal employment rate
Vulnerable employment rate
Unemployment rate
Liberia 67.9% 74.1% 2.8%
Area of residence
Urban 69.4% 65.1% 4.5%
Rural 63.2% 85.0% 0.6%
Gender
Male 33.8% 63.5% 3.0%
Female 86.4% 84.8% 2.6%
Region
North Western 73.6% 82.1% 1.2%
North Central 72.7% 86.3% 0.7%
South Central 56.1% 71.3% 3.1%
South Eastern A 60.8% 78.1% 2.9%
South Eastern B 61.1% 76.5% 3.1%
Montserrado 70.4% 55.7% 5.4%
Consumption Quintiles
First Quintile 73.8% 87.4% 1.1%
Second Quintile 68.5% 81.9% 1.7%
Third Quintile 72.1% 74.6% 3.6%
Fourth Quintile 68.8% 70.1% 4.2%
Fifth Quintile 63.3% 58.6% 3.0% In developing contexts such as Liberia, unemployment is not the best indicator of the labour market since majority of the population must find a means of income, thus vulnerable and informal employment rates provide a more insightful picture. While outright unemployment is small, informal and vulnerable employment rates are very high, at 81.2% and 74.2% respectively. The first indicator captures the fact that employment happens either in the informal sector altogether or in a formal business yet under informal circumstances. Informal employment usually will mean not contributing to social welfare through taxes and a more difficult labour relationship, without recourse to proper arbitration in case of labour conflicts. The picture is similar

49
to that of unemployment. Informality is stronger in urban areas than rural areas (69.4% vs 63.2%) due to the fact that many people in rural areas are subsistence farmers and thus are excluded. Those working outside of subsistence agriculture are more likely to be formal in rural areas as opposed to urban areas, where the informal sector is broader. The difference between men and women is large (33.8% vs. 86.4) showing that women are disproportionately at risk of informality. By regions, the South Central region has the lowest share (56.1%) and the North Western region the highest (73.6%). Informality falls (although not monotonically) as the consumption quintiles increase.
Vulnerable employment is related but not equal to informal employment. It captures the risk an employee faces of running into (financial) trouble despite the fact the he or she is employed. The trends, as can be seen in Table 7-1, are the same as for informal employment.

50
2. Primary employer Each employed person was asked who their primary employer was, (the employer of their main job), as defined by the respondent. It is estimated that 54.1% of those employed are so in the private sector, which includes all types of household entrepreneurial endeavours as well as farming activities. The second largest employer is the government, employing nearly 21% of working Liberians. Together they represent three in four of all primary employers. In rural Liberia (see Table 8-2), the government plays a stronger role, proportionally, as employer in comparison to urban regions of the country. Table 8-2 Distribution of the primary employer
Liberia Urban Rural
1st Quintile
3rd Quintile
5th Quintile
Government 20.9% 19.2% 24.9% 16.0% 24.6% 20.4%
Political party 1.1% 1.6% 0.0% 1.8% 0.0% 2.0%
Cooperative 4.4% 4.8% 3.3% 3.8% 3.2% 5.0%
NGO 5.4% 6.3% 3.1% 6.2% 3.7% 5.3%
Int’l organisation 2.2% 2.0% 2.5% 0.3% 1.7% 3.4%
Religious organisation 3.1% 3.8% 1.6% 0.8% 3.6% 4.8%
Private sector 54.1% 55.3% 51.2% 58.8% 54.8% 51.4%
Other 8.8% 6.9% 13.5% 12.3% 8.4% 7.7%

51
3. Salary structure The salary information contained in Table 8-3 was calculated using information from respondents who reported weekly and monthly wages. This covers the vast majority of responses. Those who reported their income in daily instalments could not be consistently updated to a monthly rate, as there is no information on how many days a month they usually work. With this information it is estimated that around 45% of Liberian wage employees receive a monthly salary between 6,000 and 15,000 Liberian Dollars. In urban areas, where wage employment is more common, the distribution of wages is more spread out than in rural areas. Female workers’ salary structure is more strongly concentrated on lower salaries, hinting at lower pay than males. 25% of females earn under 6,000LD as compared with 13.9% of males workers. It should be noted that the table compares overall salaries and does not distinguish job types. It may be true that women are paid less for the same job, but this cannot be concluded from table 8-3. Table 8-3 Distribution of the salary structure
Liberia Urban Rural Male Female
LD 1-1999 2.7% 2.7% 3.1% 2.7% 2.8%
LD 2,000-3,499 6.4% 6.9% 3.5% 4.0% 14.9%
LD 3,500-5,999 7.2% 6.5% 10.8% 7.2% 7.3%
LD 6,000-9,999 21.1% 21.8% 17.0% 21.3% 20.1%
LD 10,000-14,999 23.3% 22.0% 30.4% 22.6% 25.7%
LD 15,000-19,999 7.5% 5.9% 16.0% 7.0% 9.0%
LD 20,000-29,999 15.1% 15.8% 11.5% 16.4% 10.6%
LD 30,000+ 16.8% 18.4% 7.8% 18.8% 9.5%

52
9. HOUSEHOLD NON-FARM ENTERPRISES
1. Household non-farm managers characteristics Table 9-1 shows the distribution of the number of non-farm businesses operated by households, both at national level and by urban/rural area. It can be seen that businesses are a more common occurrence in urban areas: 49.5% of households in urban areas run or own a non-farm business, while just 27.9% do so in rural areas. Among those households that do run businesses, the ratios are fairly stable over the strata: 5 in 6 households that do run a non-farm enterprise only run a single enterprise. Table 9-1 Distribution of the number of non-farm enterprises by household
Stratum Liberia Urban Rural
No enterprise 59.0% 50.5% 72.1%
1 enterprise 34.1% 41.2% 23.3%
2 enterprises 6.0% 7.4% 3.9%
3 or more enterprises 0.8% 0.9% 0.7% The HIES 2014 questionnaire asks about both the owners and the managers of the non-farm business. Here we look at demographic characteristics of managers, who are assumed to be the key decision makers in the business. Table 9-2 Distribution of HH non-farm enterprise managers by gender and age
Male Female Age Totals
19 or younger 0.7% 1.5% 2.2%
20-24 3.6% 6.8% 10.4%
25-29 7.1% 10.0% 17.1%
30-34 6.5% 12.2% 18.7%
35-39 5.9% 9.1% 15.0%
40-44 5.1% 8.1% 13.2%
45-49 3.3% 6.5% 9.9%
50-54 2.6% 2.8% 5.4%
55-59 1.7% 1.8% 3.5%
60-64 1.1% 1.3% 2.3%
65+ 1.4% 1.0% 2.4%
Gender Totals 38.9% 61.1% 100%

53
Table 9-2 shows both the gender and the age distribution of the managers. The majority of managers are female (61.1% versus 38.9%) and are mostly (50.8%) between the ages of 25 and 39. Further, Table 9-3 shows the gender and stratum division of managers. Most business managers (and hence businesses) are found in urban areas (73% versus 27%). The gender imbalance (i.e., the surplus of women managers) is significantly stronger in urban areas than in rural areas.
Table 9-3 Distribution of HH non-farm enterprise managers by gender and stratum
Male Female Stratum Totals
Urban 27.2% 45.8% 73.0%
Rural 11.7% 15.3% 27.0%
Gender Totals 38.9% 61.1% 100%
2. Household non-farm business characteristics Table 9-4 shows that most businesses can be classified as shopkeepers or traders (65.1%), followed by services (24.9%), and producers (10%). It should be noted that while a business can be classified in more than one way, for example, a producer and a shopkeeper, the questionnaire only allowed for one main classification. Services are a largely urban phenomenon (they represent 30.8% of businesses in urban areas, while only 8.9% in rural areas). Producers, on the other hand, are relatively more common in rural areas (21.4%) than urban areas (5.8%). Female managers are more prevalent in trading businesses, while male managers are more evenly spread between the three different business types as defined in the 2014 HIES. Table 9-4 Distribution of the type of non-farm HH enterprise
Stratum Gender of Manager Liberia Urban Rural Male Female
Shopkeeper / Trader 65.1% 63.4% 69.7% 45.0% 77.8%
Producer 10.0% 5.8% 21.4% 16.0% 6.2%
Services 24.9% 30.8% 8.9% 39.0% 15.9% Table 9-5 presents how long a business has been open for. More than 20% of businesses having been in operation for less than 12 months, and about 38%

54
having been in operation for 2 years or less Nearly two thirds of businesses at national level have been in operation for three or more years. Table 9-5 Distribution of the duration of the HH non-farm businesses
Stratum Gender of Manager Liberia Urban Rural Male Female
6 months or less 15.1% 13.8% 18.5% 11.8% 17.2%
7-11 months 6.1% 5.7% 7.1% 6.4% 5.9%
2 years 17.0% 17.2% 16.3% 14.7% 18.5%
3 years 16.3% 16.2% 16.8% 13.8% 18.0%
4-5 years 18.6% 17.6% 21.1% 22.1% 16.3%
6-10 years 16.4% 18.2% 11.8% 19.0% 14.8%
More than 10 years 10.5% 11.3% 8.3% 12.3% 9.3%
3. Profitability of household non-farm businesses The last section on household non-farm businesses looks at the revenues, costs, and profits per month in Liberian Dollars. Table 9-6 focuses on revenues. Around 50% of enterprises report revenues between 6,000 and 30,000 Liberian Dollars per month. This core is fairly stable when looking at the urban/rural and male/female distinctions. The differences lie at the edges, where small revenue generating firms are more present in rural areas or run by females, while the opposite is true in urban areas and firms managed by men. Table 9-6 Distribution of the revenues of non-farm HH enterprises
Stratum Gender of Manager Liberia Urban Rural Male Female
LD 0-999 1.2% 1.1% 1.3% 0.6% 1.5%
LD 1,000-1,999 2.4% 1.8% 4.0% 1.6% 2.8%
LD 2,000-3,499 6.4% 5.2% 9.7% 4.1% 7.9%
LD 3,500-5,999 11.2% 10.4% 13.4% 9.4% 12.4%
LD 6,000-9,999 13.0% 11.9% 16.1% 8.9% 15.6%
LD 10,000-14,999 12.9% 12.5% 13.9% 13.0% 12.8%
LD 15,000-19,999 10.7% 10.2% 12.3% 10.3% 11.0%
LD 20,000-29,999 14.1% 16.3% 8.1% 15.6% 13.1%
LD 30,000-49,999 13.5% 14.5% 10.6% 14.7% 12.7%
LD 50,000-99,999 7.4% 8.3% 5.1% 9.8% 5.9%
LD 100,000-199999 4.3% 4.5% 3.9% 7.1% 2.5%
LD 200,000+ 2.9% 3.4% 1.7% 4.8% 1.7%

55
A similar pattern emerges when looking at costs (Table 9-7) at least in terms of the urban rural divide. Inputs are cheaper (or less of them are used, resulting in a lower bill) in rural areas versus urban areas. On average, urban non-farm enterprises report higher costs. Table 9-7 Distribution of costs of HH non-farm enterprises
Stratum Gender of Manager Liberia Urban Rural Male Female
LD 0-999 8.6% 7.2% 12.3% 10.4% 7.4%
LD 1,000-1,999 8.5% 7.6% 11.1% 4.4% 11.1%
LD 2,000-3,499 13.1% 12.3% 15.3% 12.0% 13.9%
LD 3,500-5,999 12.8% 12.5% 13.6% 12.5% 13.0%
LD 6,000-9,999 14.1% 13.6% 15.6% 12.1% 15.4%
LD 10,000-14,999 13.4% 14.5% 10.3% 15.3% 12.1%
LD 15,000-19,999 8.0% 8.7% 6.0% 6.6% 8.9%
LD 20,000-29,999 8.3% 9.4% 5.4% 8.9% 7.9%
LD 30,000-49,999 5.3% 5.6% 4.7% 6.2% 4.8%
LD 50,000-99,999 4.4% 5.1% 2.4% 7.2% 2.6%
LD 100,000-199999 2.1% 1.8% 2.8% 2.7% 1.7%
LD 200,000+ 1.4% 1.7% 0.5% 1.9% 1.1%

56
10. AGRICULTURE / CROP PRODUCTION & LIVESTOCK
1. Crop production The information on the crop production focuses on the six most grown crops as reported by households (cassava, rice, pepper, bitterballs, corn, and plantain) as well as three cash crops (palm oil, cocoa, and rubber). Table 10-1 shows the estimated percentage of households that have grown or sold each of the crops. Cassava is the most often grown and sold crop, with 38.9% of households growing cassava nationally, and 19.4% selling. Table 10-1 Percentage of HHs that have either grown or sold specific crops
Percentage of HH that have… grown sold
Cassava 38.9% 19.4%
Rice 32.0% 5.6%
Pepper 32.1% 18.5%
Bitterballs 26.3% 14.6%
Corn 27.0% 14.3%
Plantain 26.5% 16.5%
Palm Oil 21.2% 15.7%
Cocoa 7.4% 5.1%
Rubber 10.3% 4.7% Out of the main grown crops, only rice shows a distinct pattern: it is primarily grown for own consumption, it seems, as 32% of households record growing rice, but less than 6% record selling any rice. In the case of the cash crops, it could be expected that nearly all of the households that grew the crop also sold them. However, the percentage of households selling cash crops is often lower than expected. This could be due to further processing of a raw crop, for example palm nuts into palm butter, own consumption, or new producers entering the market that have grown the cash crop, but have not yet been able to harvest and sell. Furthermore, the time taken for these palm, cocoa, or rubber trees to mature and render themselves ready for harvest is significantly long. Households growing such cash crops are captured in the percentage despite the cash crops not being ready for production. In particular, the new variety of Cocoa introduced more recently in Liberia can take a minimum of three years before

57
being ready for harvest, whilst palm oil and rubber can take significantly longer (a minimum of seven years for both crops). In the case of rubber, there is a noticeable discrepancy between those growing rubber trees (10.3%) and those selling tapped rubber (4.7%). It should be noted that households are asked whether they sold tapped rubber in the 12 months prior to interview, but not whether they harvested rubber. Low and continuously declining rubber prices have reduced the profitability of harvesting rubber, whose primary cost is that of hiring labour to tap the rubber. Thus households who are growing rubber trees, but are not tapping currently, would not be recorded as selling. Table 10-2 looks specifically at the main staples, cassava and rice, by region. The North Western and North Central regions report a much higher percentage of crop growers and sellers than other regions. Table 10-2 Percentage of HHs that have either grown or sold Cassava or Rice by region
Percentage of HH that have… Cassava Rice grown sold grown sold
North Western 69.0% 39.8% 42.0% 8.8%
North Central 62.9% 27.6% 64.7% 11.0%
South Central 40.3% 19.3% 16.0% 3.0%
South Eastern A 56.7% 33.6% 51.9% 10.2%
South Eastern B 54.4% 34.8% 36.2% 5.3%
Montserrado 2.2% 0.7% 0.0% 0.0%
Liberia 38.9% 19.4% 32.0% 5.6% For the 2014 HIES, no observations were recorded of rice growers in Montserrado county. The actual number is most likely not 0%. It seems fair to assume, though, that truly only very few households in Montserrado grow rice.

58

59
2. Livestock The livestock information (Table 10-3) centres on the six main livestock animals raised in Liberia at national and at urban or rural level. As could be expected, livestock production is centred in rural areas. The most common animal is chicken. About a third of Liberian households report raising chicken over the 12 months prior to the interview. In rural areas more than half the households raise chicken. Goats are the second most popular animal, followed by ducks, sheep, and pigs. Cattle are only raised by a very small minority of households. Table 10-3 Percentage of HHs stating to be raising specific livestock
Liberia Urban Rural
Sheep 4.7% 2.2% 8.6%
Goat 10.2% 5.9% 16.9%
Chicken 33.0% 18.8% 54.6%
Cow/Cattle 0.3% 0.2% 0.5%
Pigs 2.5% 1.4% 4.1%
Ducks 5.5% 4.6% 6.9%
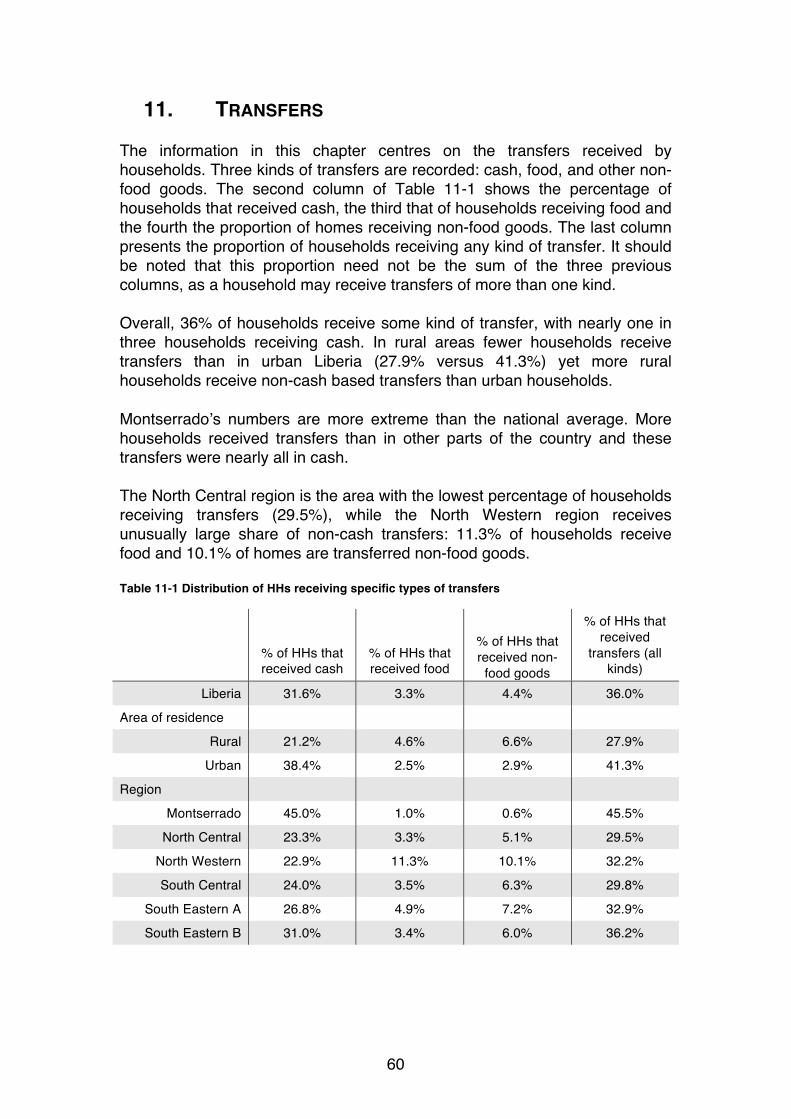
60
11. TRANSFERS The information in this chapter centres on the transfers received by households. Three kinds of transfers are recorded: cash, food, and other non-food goods. The second column of Table 11-1 shows the percentage of households that received cash, the third that of households receiving food and the fourth the proportion of homes receiving non-food goods. The last column presents the proportion of households receiving any kind of transfer. It should be noted that this proportion need not be the sum of the three previous columns, as a household may receive transfers of more than one kind. Overall, 36% of households receive some kind of transfer, with nearly one in three households receiving cash. In rural areas fewer households receive transfers than in urban Liberia (27.9% versus 41.3%) yet more rural households receive non-cash based transfers than urban households. Montserrado’s numbers are more extreme than the national average. More households received transfers than in other parts of the country and these transfers were nearly all in cash. The North Central region is the area with the lowest percentage of households receiving transfers (29.5%), while the North Western region receives unusually large share of non-cash transfers: 11.3% of households receive food and 10.1% of homes are transferred non-food goods. Table 11-1 Distribution of HHs receiving specific types of transfers
% of HHs that received cash
% of HHs that received food
% of HHs that received non-
food goods
% of HHs that received
transfers (all kinds)
Liberia 31.6% 3.3% 4.4% 36.0%
Area of residence
Rural 21.2% 4.6% 6.6% 27.9%
Urban 38.4% 2.5% 2.9% 41.3%
Region
Montserrado 45.0% 1.0% 0.6% 45.5%
North Central 23.3% 3.3% 5.1% 29.5%
North Western 22.9% 11.3% 10.1% 32.2%
South Central 24.0% 3.5% 6.3% 29.8%
South Eastern A 26.8% 4.9% 7.2% 32.9%
South Eastern B 31.0% 3.4% 6.0% 36.2%

61
12. SHOCKS
1. Number of shocks endured Over a reference period of the previous 12 months, three-quarters of Liberian households reported suffering at least one major shock (Table 12-1). The majority of households report a single shock (31.3%), and a significant proportion report two shocks (23.7%) or even more than two (21.8%). It is important to note that the survey was conducted in the period before the main outbreak of the Ebola Virus Disease (EVD), and data collection was halted in July 2014 in response to the outbreak. Thus, EVD and its consequences are not reflected in this data. From the data it seems that rural areas are more prone to shocks than urban Liberia. The North Western region reports both the lowest percentage of households without any shocks (10.9%) and the highest proportion of homes enduring three or more shocks (41.2%). Table 12-1 Distribution of number of shocks endured by the household
No shocks 1 shock 2 shocks 3+ shocks
Liberia 23.2% 31.3% 23.7% 21.8%
Area of residence
Rural 16.1% 29.2% 27.8% 26.8%
Urban 27.8% 32.7% 21.0% 18.5%
Region
North Western 10.9% 21.8% 26.1% 41.2%
North Central 14.0% 28.2% 34.5% 23.3%
South Central 26.4% 39.1% 19.9% 14.7%
South Eastern A 13.5% 25.7% 28.1% 32.6%
South Eastern B 23.6% 33.2% 21.3% 21.9%
Montserrado 35.6% 34.8% 14.2% 15.5%
2. Distribution of the most severe shocks
Respondents were asked to rate the three biggest shocks out of those they suffered in the last 12 months. Table 12-2 shows the distribution of the biggest shock households had to cope with. The death of a person close to the household, whether a member of the household or another family member is most frequently reported as the most severe shock (53.4%). Chronic illness or an accident involving a family member also appears among the major shocks (8.8%). It should be noted that

62
this data was captured prior to the peak of the EVD outbreak, and does not capture the impact of the EVD on deaths in a household. Beyond death and illness, the most significant risks are those to crops (9.7%), on which often food security depends, and criminal endeavours like robbery and hijacking (6.0%). These last two have clearly different weights depending on whether people live in rural or urban areas. Crop failure plays an important role in rural Liberia (15.8%), while the risk of burglary and assault is lower (2.8%). On the contrary, in densely populated areas, criminal activities are more frequently reported (8.5%) but crop failures are less often endured (5.0%), most likely due to the lower proportion of farmers in urban areas. Table 12-2 Distribution of types of shock endured by the household
Shock Type Reported as Most Severe Liberia Urban Rural
Drought or Floods 2.7% 2.2% 3.4%
Crop disease or crop pests such as ground-hog attacks 9.7% 5.0% 15.8%
Livestock died or were stolen 1.4% 1.2% 1.7%
Household business failure, non-agricultural 1.2% 1.4% 1.0%
Loss of salaried employment or non-payment of salary 1.0% 1.1% 0.9%
Large fall in sale prices for crops 1.0% 1.0% 1.1%
Large rise in price of food 3.3% 3.4% 3.1%
Large rise in agricultural input prices 0.1% 0.1% 0.1%
Severe water shortage 3.6% 5.0% 1.9%
Restricted access to markets 0.8% 0.2% 1.6%
Chronic/severe illness or accident of household member 8.8% 9.3% 8.1%
Death of a member of household 9.7% 10.9% 8.0%
Death of other family member 43.7% 43.6% 43.7%
Break-up of the household 1.5% 0.9% 2.3%
Conflict/Violence 1.9% 2.5% 1.1%
Bushfire/Fire 0.3% 0.4% 0.3%
Hijacking/Robbery/burglary/assault/Theft 6.0% 8.5% 2.8%
Dwelling damaged, destroyed 2.4% 2.3% 2.6%
Other shock 0.8% 1.0% 0.5%
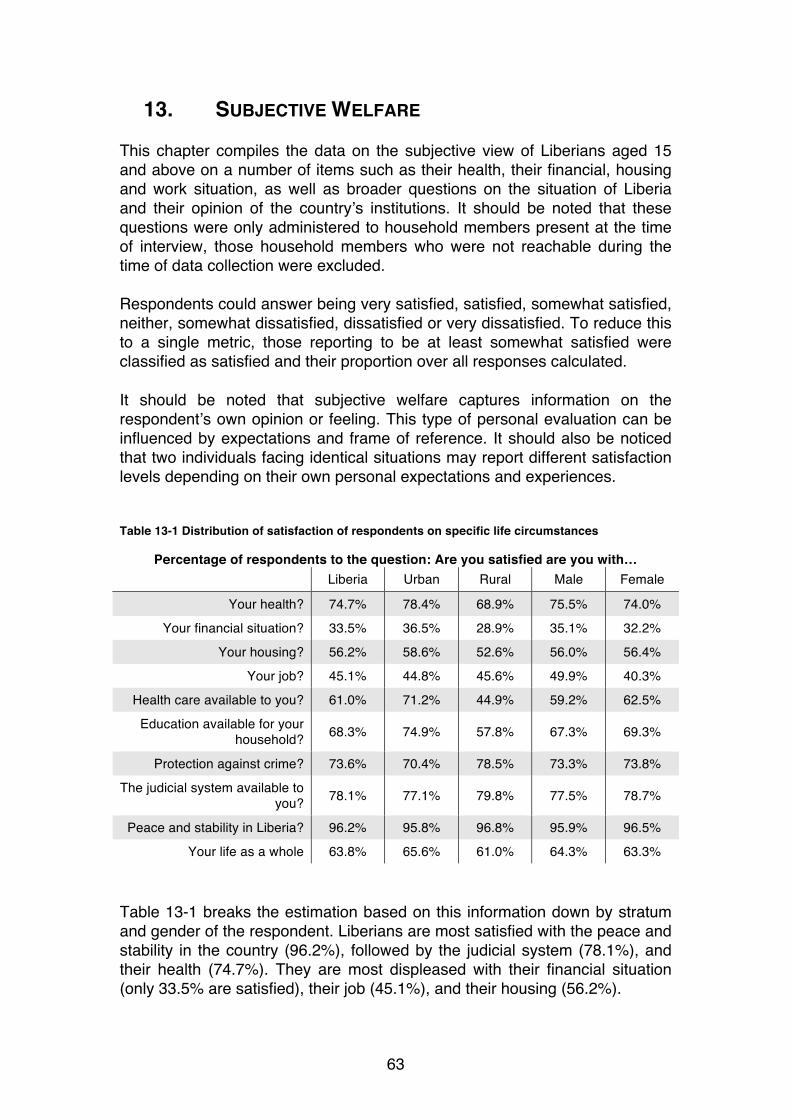
63
13. SUBJECTIVE WELFARE This chapter compiles the data on the subjective view of Liberians aged 15 and above on a number of items such as their health, their financial, housing and work situation, as well as broader questions on the situation of Liberia and their opinion of the country’s institutions. It should be noted that these questions were only administered to household members present at the time of interview, those household members who were not reachable during the time of data collection were excluded. Respondents could answer being very satisfied, satisfied, somewhat satisfied, neither, somewhat dissatisfied, dissatisfied or very dissatisfied. To reduce this to a single metric, those reporting to be at least somewhat satisfied were classified as satisfied and their proportion over all responses calculated. It should be noted that subjective welfare captures information on the respondent’s own opinion or feeling. This type of personal evaluation can be influenced by expectations and frame of reference. It should also be noticed that two individuals facing identical situations may report different satisfaction levels depending on their own personal expectations and experiences. Table 13-1 Distribution of satisfaction of respondents on specific life circumstances
Percentage of respondents to the question: Are you satisfied are you with… Liberia Urban Rural Male Female
Your health? 74.7% 78.4% 68.9% 75.5% 74.0%
Your financial situation? 33.5% 36.5% 28.9% 35.1% 32.2%
Your housing? 56.2% 58.6% 52.6% 56.0% 56.4%
Your job? 45.1% 44.8% 45.6% 49.9% 40.3%
Health care available to you? 61.0% 71.2% 44.9% 59.2% 62.5%
Education available for your household? 68.3% 74.9% 57.8% 67.3% 69.3%
Protection against crime? 73.6% 70.4% 78.5% 73.3% 73.8%
The judicial system available to you? 78.1% 77.1% 79.8% 77.5% 78.7%
Peace and stability in Liberia? 96.2% 95.8% 96.8% 95.9% 96.5%
Your life as a whole 63.8% 65.6% 61.0% 64.3% 63.3% Table 13-1 breaks the estimation based on this information down by stratum and gender of the respondent. Liberians are most satisfied with the peace and stability in the country (96.2%), followed by the judicial system (78.1%), and their health (74.7%). They are most displeased with their financial situation (only 33.5% are satisfied), their job (45.1%), and their housing (56.2%).
64
Men and women report roughly similar scores, with the exception of their job situation, where women are estimated to have significantly lower levels of satisfaction. The specific challenges they face, as seen in previous chapters, are probably an explanation for this lower score. In rural areas, people are less satisfied with the health care (44.9% vs. 71.2%) and education provision (57.8% vs. 74.9%) they receive, as well as with their financial situation (28.9% vs. 36.5%) than in urban areas. Satisfaction with protection against crime is lower in urban Liberia at 70.4% compared with 78.5% in rural Liberia. The satisfaction with peace and stability in the country is roughly shared equally across strata and genders.

65
14. METHODOLOGICAL APPENDIX There are three elements required to perform poverty analysis:
a. A single dimensional, measureable welfare indicator that can be used to rank the population according to well-being.
b. An appropriate poverty line on the same scale as the above welfare measure that can be used to classify individuals as poor or non-poor.
c. A set of measures that aggregate and describe the combination of the welfare indicator and poverty line.
1. Measure of Well-Being The concept of poverty can refer to many different aspects of deprivation - food poverty, social exclusion, lack of access to basic public services, inability to access markets, etc. While each of these is an important component of a multidimensional problem, it is necessary for the purposes of comparability and analysis to simplify the concept of poverty to a single measureable dimension. In the context of sub-Saharan Africa, there is consensus among experts that, due to a number of factors, consumption-based measures are more representative than income measures in capturing utility and well-being. First there is a substantial contribution of home production to household consumption, particularly in rural areas. Also, households are better able to smooth consumption as opposed to income, which is important in places with seasonal shifts in the availability of employment. The volatility of the income indicator can therefore lead to large over- (or under-) estimations of welfare. Finally, despite well-known difficulties in some aspects of the collection of consumption data, it is generally considered more straightforward than income data. To estimate income those outside of the formal wage sector must often aggregate many small transactions or recall variable payments over long periods. In addition, there are difficulties in valuing in-kind payments or labor-sharing arrangements, separating entwined household and business expenses, and overcoming respondent reluctance to discuss income.
Food Consumption The 2014 HIES collected information on 106 food items in 11 categories: cereals and cereal products; starches (roots, tubers, bananas, plantains); sugar and sweets; pulses (dry); nuts, seeds, and oils; vegetables; fruits; meat, meat products, and fish; milk and dairy products; spices and other foods; and beverages. (See the questionnaire for a complete list of food items.) The questions asked, for each of these items, how much was consumed in the past seven days. Of this the consumption was divided into purchases, home production, and gifts, with the value also collected for purchases. This

66
method of collection differs from that which is used in the expenditure questionnaire of the 2007 CWIQ survey, which asks, “During how many months in the last 12 months did the household consume purchased […]?” and then the quantity and value for these purchases. There is a separate section for food items that were received as gifts, food aid, or home produced. The list of purchased food products contains 101 items and the gifts list contains 66 food items. The 2014 HIES questionnaire also allows for prices to be given in either Liberian or US dollars as US dollars are commonly used in many areas of the country. For the purposes of analysis all purchases are converted into Liberia dollars using an exchange rate of 86.75 Liberian dollars per US dollar, an approximation of the unofficial exchange rate during the data collection period. Food Consumed Outside the Household In addition to the food purchases, the survey also includes an individual level module for purchases of prepared foods outside of the household. This information collects total purchases for five categories: full meals (breakfast, lunch or dinner); barbecued meat, chips, roast plantain, cassava, corn, bread, cake, tea, haitai, coffee, or other snacks; palm wine, club beer or other local or commercial alcoholic brews; soft drinks, juices and other non-alcoholic drinks including water; and sweets and ice cream. Consumption Basket The consumption basket includes all items that compose at least one percent of total spending on food for the 2nd through 7th deciles of the consumption distribution. As poverty was last estimated in 2007 at 64 percent, this basket is selected as the most representative of poor households, with the most extreme lowest decile excluded. The basket includes 25 items that together comprise 83 percent of total food consumption. This slightly less than the 28 items that comprised 87 percent of consumption in the 2007 CWIQ.
Item
Share of food
consumption
Share of consumption
basket
Calories per
100g / 100ml
Imported Rice 16.8 20.2 363
Food away - breakfast/lunch/dinner 11.7 14.0 345**
Fresh Fish 6.9 8.2 99
Palm oil 6.0 7.2 875
Local Rice 5.5 6.6 344
Chicken Feet 3.6 4.3 287
Food away - BBQ meat/chips/snacks 2.9 3.4 384**
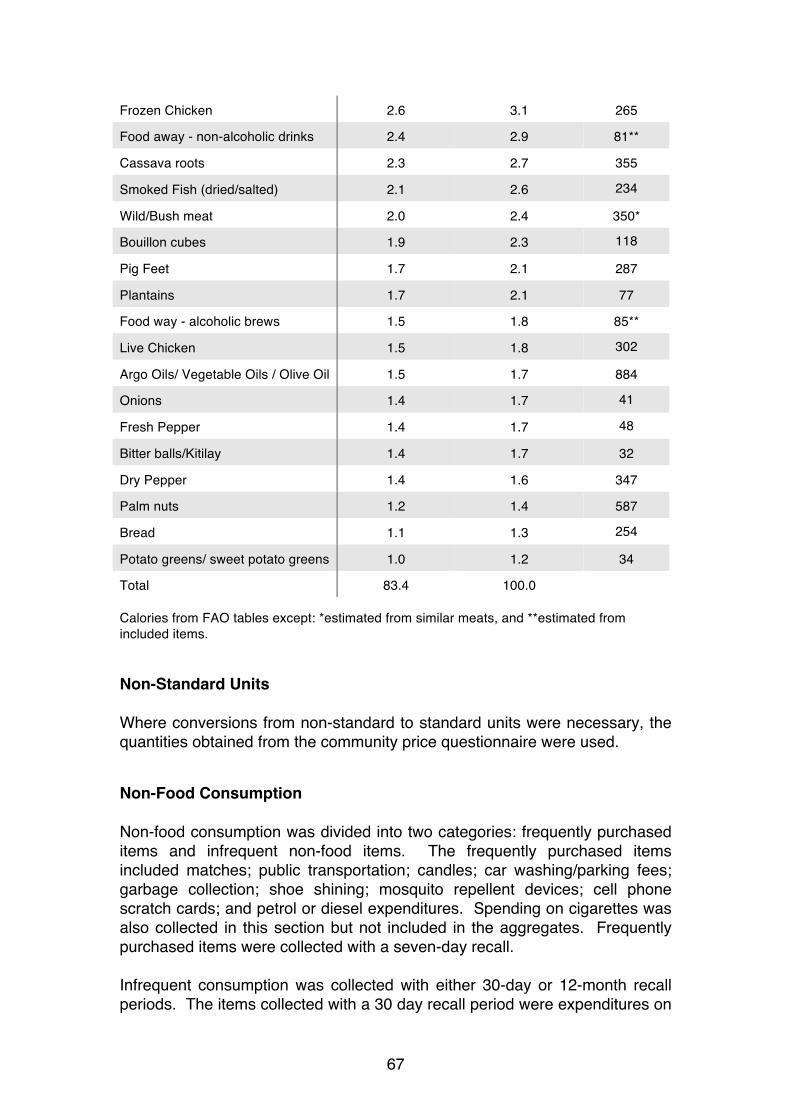
67
Frozen Chicken 2.6 3.1 265
Food away - non-alcoholic drinks 2.4 2.9 81**
Cassava roots 2.3 2.7 355
Smoked Fish (dried/salted) 2.1 2.6 234
Wild/Bush meat 2.0 2.4 350*
Bouillon cubes 1.9 2.3 118
Pig Feet 1.7 2.1 287
Plantains 1.7 2.1 77
Food way - alcoholic brews 1.5 1.8 85**
Live Chicken 1.5 1.8 302
Argo Oils/ Vegetable Oils / Olive Oil 1.5 1.7 884
Onions 1.4 1.7 41
Fresh Pepper 1.4 1.7 48
Bitter balls/Kitilay 1.4 1.7 32
Dry Pepper 1.4 1.6 347
Palm nuts 1.2 1.4 587
Bread 1.1 1.3 254
Potato greens/ sweet potato greens 1.0 1.2 34
Total 83.4 100.0
Calories from FAO tables except: *estimated from similar meats, and **estimated from included items.
Non-Standard Units Where conversions from non-standard to standard units were necessary, the quantities obtained from the community price questionnaire were used.
Non-Food Consumption Non-food consumption was divided into two categories: frequently purchased items and infrequent non-food items. The frequently purchased items included matches; public transportation; candles; car washing/parking fees; garbage collection; shoe shining; mosquito repellent devices; cell phone scratch cards; and petrol or diesel expenditures. Spending on cigarettes was also collected in this section but not included in the aggregates. Frequently purchased items were collected with a seven-day recall. Infrequent consumption was collected with either 30-day or 12-month recall periods. The items collected with a 30 day recall period were expenditures on

68
kerosene/paraffin; electricity; bottled gas/propane; shoe polish; wood and other solid fuels; batteries and other energy sources; pets and pet services; admission charges; newspapers and magazines; charcoal; milling fees; bar soap; laundry soap / powder soap; toothpaste / toothbrush; vehicle rental; personal services; toilet paper; personal oils and lotions; other beauty products; household cleaning products; disposable diapers; light bulbs; scratch cards for internet; motor vehicle service / repairs; oil change; tire repair; bicycle service; wages to domestic help; bleach; laundry services; photocopying and other printing services; and wheel barrow / push-push rental. The items collected with a 12 month recall period were carpets and rugs; curtains and drapes; linens; mattresses; sports and hobby equipment; film and cameras; building items; cement; paint; bucket; travel expenses; insurance; fines or administrative fees; garments for men; garments for women; garments for children and babies; tailoring costs; footwear for men; footwear for women; footwear for children and babies; accessories; other clothing articles; repairs to household durables; moving and shipping expenses; taxes; games and toys; financial and wire transfer fees; farm implements; and other costs not stated elsewhere. There were a number of additional items that were collected in the infrequent no-food consumption sections, but excluded from the consumption aggregates as not being regular expenditures, including donations to charities, religious organizations, or beggars; games of chance; losses to theft; bride price / marriage costs; funeral costs; and jewelry purchases. Farm implements were excluded since they are counted as productive assets rather than consumption, and notebooks and drawing materials are excluded to avoid double counting with the education expenditure section. The method for calculating the value of the non-food expenditure listed above was straightforward. All items were included and normalized to a common reference period (one year). The quantities of these items were not collected since many categories are heterogeneous, so only the total value was used in the calculati Housing Costs In addition to the items above, a few additional categories of non-food consumption warrant special mention. First, housing costs were included in the aggregate, even though the value is frequently missing from the survey as the household owns their home or receives free housing. In the 2014 HIES, 38 percent of urban households and 5 percent of rural households rented their dwellings. To obtain measures for all households, a linear model which imputed the log rent from the log number of main rooms, log number of other rooms, region, urban/rural status, whether the dwelling had electricity, whether the household

69
had an indoor water source, the material from which the walls were constructed, the material of the floor, the type of toilet facilities, and the whether the dwelling was owner occupied, employer subsidized, or free. Two different model specifications were considered to impute rental values: a log-transformed linear model using all available variables, and a parsimonious linear model in which the eligible variables were selected using a stepwise selection method. The values predicted by the linear model were the most highly correlated with the actual values (approximately 80 percent correlation), so this model was selected and used to substitute for the missing values. Education The inclusion of household spending on education can be a controversial measure when constructing the consumption aggregate. It is possible interpret education as an investment, since the benefits are distributed throughout the life of the student even though spending is concentrated. Therefore current students may appear to be better off due to education spending, but this would actually be a life-cycle effect rather than a true difference in welfare. One method to address this would be to smooth the spending on education across the life cycle, but this is not feasible in a cross sectional survey. It is also necessary to consider the supply of public education. If the entire population can access affordable public education, the decision to spend additional resources on private school would be based on quality considerations, strengthening the case for inclusion. Exclusion would also not allow the distinction between households that have one school age child enrolled in school and households that have multiple school age children, only one of which is enrolled. As the primary goal of a consumption aggregate is to order households based on well being, this analysis follows standard practice and includes education spending in the aggregate. Included education expenses are school fees, books and notebooks, uniforms, transport provided by the school, extra tuition, other materials, extra-curricular activities (sports, fees, school trips, etc.), and other contributions (including PTA expenses). Health Care Spending on health care can also be seen as an investment, particularly in the case of preventative care. In addition, there are other factors that may distort comparisons, such as uneven access to free or heavily subsidized health care services, or health insurance, though insurance coverage rates are generally low in Liberia. Similar to education expenditures, it was decided to include most health care expenses as their exclusion would make it impossible to distinguish between

70
a household that sought care and one that did not when a member fell ill. An exception to this, however, is in the case of hospitalization. Since hospitalization is a rare event, the cost of which is rarely borne completely by the household with donations frequently coming from family members and the larger community, this expense is excluded from the aggregate. Expenses included with related to health are prescription medicines; tests; consultations; in-patient fees; pre-natal visits; vaccinations; treatments such as bandages, injections, etc.; non-prescription medicines; and traditional or faith healers. Use Value of Durable Goods The ownership of durable good is also an important component of the welfare of households. These goods are purchased at a singular point in time, but the household receives benefits from them over the course of their ownership. The utility from these items cannot be measured, but is represented in the aggregate by the use value, a measure proportional to the current value of the good. The use value is calculated as the purchase price average multiplied by the interest rate minus average inflation rate plus the rate of the item’s depreciation.10 The interest rate minus the inflation rate is the change in the real value of money. (The interest rate is the rate at which money is increasing in value while inflation is the rate at which money is losing value.) Use value can be written as:
𝑈𝑉! = 𝑝!!(𝑟! − 𝑖! + 𝑣!) where 𝑝!! is the price of durable item 𝑑 at the time of purchase (𝑡 = 0); 𝑟! is the average interest rate; 𝑖! is the inflation rate; and 𝑣! the depreciation rate of item 𝑑. Depreciation is the changing value of the asset based on the passage of time, and can be either positive or negative. (For example, a new car will lose its value as time passes while an antique car will increase in value.) Depreciation for item 𝑑 is the median value of the following expression:
𝑣! = 1−𝑝!"𝑝!!
!!! + 𝑖!
where 𝑝!" is the current value of the item and 𝑦! is the age of the item in years. The total use value derived by household h for all items owned 𝐷!" can therefore written as:
10 The interest rate is estimated to have been 2% on average between January and August 2014, and inflation during this period was estimated to be 9.6%.

71
𝑇𝑉! = 𝐷!"! 𝑝!!(𝑟! − 𝑖! + 𝑣!)!
!!!
The following goods were included in the asset index: radio, radio cassette, CD player; mobile telephone; refrigerator or freezer; sewing machine; video / DVD / television; chairs (local or imported); sofa / armchairs (local or imported); tables (local or imported); beds; kerosene lamp; personal computer / printer / scanner / photocopier; pressing iron; stove or cooker; water-heater; calculator; motorcars, vans; motorcycle; bicycle; electric fan; air conditioner; and satellite dish / antenna / DSTV / Satcom; generator. Trucks and minibuses were also included in this section but excluded as they are productive assets. All listed assets are owned by at least one household in the sample. Transfers Transfers outside the household are also excluded from the consumption aggregate to avoid double counting, as it is assumed these goods would be counted as consumption in the recipient household. Shares of Food and Non-Food Consumption Food expenditure represented about 65 percent of total expenditure but varied by region and urban/rural status. The lowest share of food expenditure was in Monrovia, with 54 percent of total spending, and the highest was in Southeastern A rural, with 76 percent.
Price Adjustment In order to compare welfare across different areas of the country, the total consumption aggregate must be adjusted for differences in the cost-of-living. Spatial deflators were calculated by constructing a Fisher price index for a bundle of goods in 14 counties. Gbarpolu has been combined with Lofa because of the small number of observations. A Fisher price index is the geometric average of the Laspeyres and Paasche indices. The component Laspeyres and Paasche indices were developed for given national bundle of goods defined as the average food consumption bundle for the second through seventh deciles of the population, excluding those items with less than a one percent share. The formulas for the price indices are below: Fisher price index Laspeyres price index Paasche price index
𝐹! = 𝐿!𝑃! 𝐿! = 𝑤!!𝑝!"𝑝!!
!
!!!
𝑃! =1
1𝑤!!
𝑝!!𝑝!"

72
where 𝑤!! is the national budget share of item k, 𝑝!" is the mean price of item k in region i, and 𝑝!! is the national mean price of item k. The national price was constructed by using a population-weighted share of the food item price for each of the 14 counties. Non-food items were treated as a single item and received the same monthly deflators calculated for food consumption in each county.
2. Poverty Line The poverty line is defined as the monetary cost to a given person, at a given place or time, corresponding to a reference level of welfare (Ravallion, 1998). The actual process of defining this poverty line can be complicated, however, by determining the minimum level of welfare as well as costing that bundle of goods and services. For the purposes of this analysis, three poverty lines are defined: the food poverty line, defined as the line below which individuals cannot meet their basic food needs; the total poverty line, defined as the line below which individuals cannot meet their food and non-food minimum needs, and the extreme poverty line, defined as the line below which individuals’ total food and non-food consumption falls below the minimum food requirements. This analysis is mainly concerned with overall poverty, and therefore focuses on the total poverty measurement.
Food Poverty Line Basic Needs In order to define the food poverty line, it is necessary to determine the nutritional requirements to be a healthy and active participant in society. The minimum calorie requirements range commonly from 2100 to 3000 calories per day, depending on the climate and general level of activity. The minimum calorie requirements are determined to be 2400 per day in Liberia, which is consistent with the regional average and was the values used in the 2007 CWIQ analysis. As specific data for Liberia were not available in terms of the caloric conversion factors for the various food items, conversions are done using general factors from the Food & Agricultural Organization. These caloric equivalents indicate the caloric value for 100 grams or 100 millilitres of products, which are in part comestible. Sensitivity analysis of the food poverty line to higher and lower minimum calorie requirements was performed. See the table below for results. Calories per adult equivalent per day 2100 2400 2700 3000
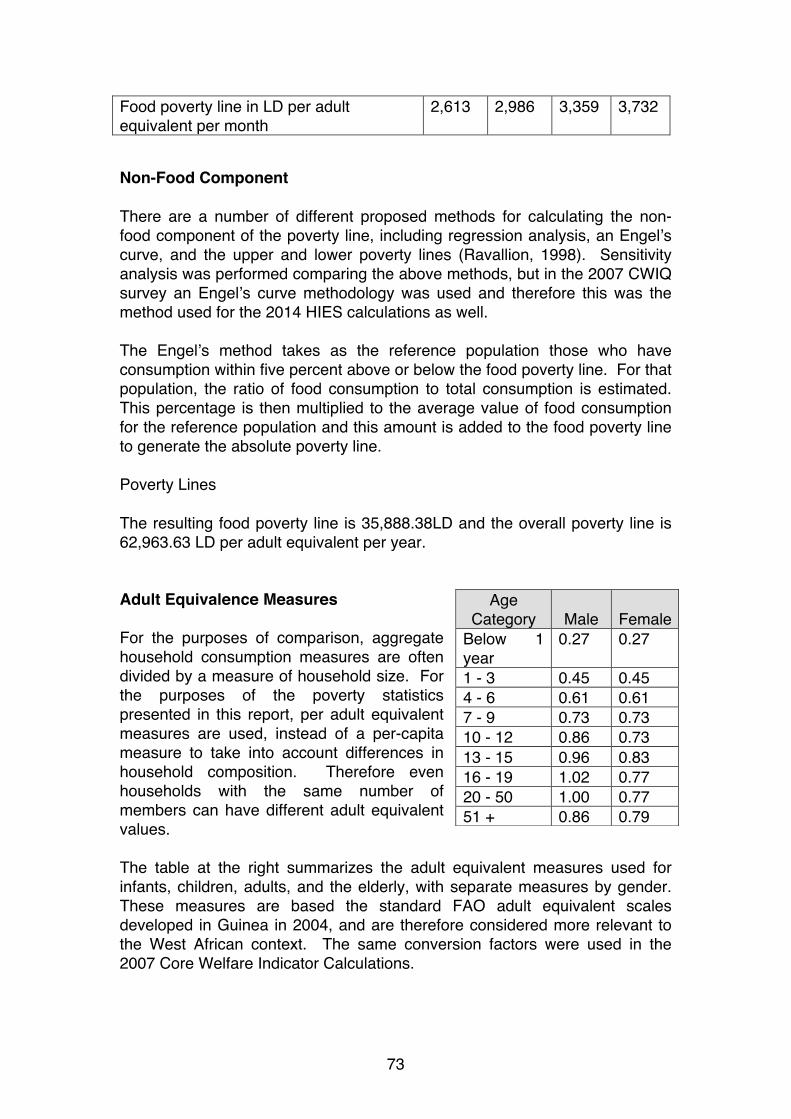
73
Food poverty line in LD per adult equivalent per month
2,613 2,986 3,359 3,732
Non-Food Component There are a number of different proposed methods for calculating the non-food component of the poverty line, including regression analysis, an Engel’s curve, and the upper and lower poverty lines (Ravallion, 1998). Sensitivity analysis was performed comparing the above methods, but in the 2007 CWIQ survey an Engel’s curve methodology was used and therefore this was the method used for the 2014 HIES calculations as well. The Engel’s method takes as the reference population those who have consumption within five percent above or below the food poverty line. For that population, the ratio of food consumption to total consumption is estimated. This percentage is then multiplied to the average value of food consumption for the reference population and this amount is added to the food poverty line to generate the absolute poverty line. Poverty Lines The resulting food poverty line is 35,888.38LD and the overall poverty line is 62,963.63 LD per adult equivalent per year.
Adult Equivalence Measures For the purposes of comparison, aggregate household consumption measures are often divided by a measure of household size. For the purposes of the poverty statistics presented in this report, per adult equivalent measures are used, instead of a per-capita measure to take into account differences in household composition. Therefore even households with the same number of members can have different adult equivalent values. The table at the right summarizes the adult equivalent measures used for infants, children, adults, and the elderly, with separate measures by gender. These measures are based the standard FAO adult equivalent scales developed in Guinea in 2004, and are therefore considered more relevant to the West African context. The same conversion factors were used in the 2007 Core Welfare Indicator Calculations.
Age Category Male Female
Below 1 year
0.27 0.27
1 - 3 0.45 0.45 4 - 6 0.61 0.61 7 - 9 0.73 0.73 10 - 12 0.86 0.73 13 - 15 0.96 0.83 16 - 19 1.02 0.77 20 - 50 1.00 0.77 51 + 0.86 0.79

74
3. Poverty Measures Following the calculation of the consumption aggregate and the poverty line, it is necessary to have a system of analysis to examine the relationship of these variables. Though a number of different options exist in the literature, this analysis will focus on those proposed the Foster, Greer, and Thorbecke (1984). This family of measure can be represented by the following equation:
𝑃! =1𝑁
𝑧 − 𝑦!𝑧
!!
!!!
Where α is some non-negative parameter, most commonly 0, 1, or 2, z is the poverty line, 𝑦! is the consumption for individual i, n is the total population below the poverty line, and N is the total population. The headcount index (α=0) gives the share of the poor in the total population and is probably the most familiar of the three measures. It does have some limitations in that it does not account from the degree to which an individual is below the poverty line. In addition to the poverty measure discussed above, inequality measures are used to study changes in the composition of the consumption distribution. The Gini coefficient (Gini, 1921) measures the inequality across the frequency distribution of household consumption. A Gini coefficient of zero indicates perfect equality, while a Gini coefficient of one indicates that all consumption within the distribution is by a single household. Therefore higher Gini coefficients indicate more unequal distributions. One limitation of the Gini coefficient is that it cannot be decomposed to study the components of inequality. Therefore, in addition to the Gini, the general entropy Theil L measure is used following Mookherjee and Shorrocks (1982). The general formula for the GE(1) model is :
𝐼! =1𝑛
𝑦!𝜇
!
log𝑦!𝜇
Where n is the total number of households, μ is the mean household consumption, and 𝑦! is the consumption of household i. This can be decomposed into :
𝐼! = 𝜈!!
𝜆!𝐼!! + 𝜇! log 𝜆!!
Where 𝜐! =
!!!
is the proportion of the population in subgroup k and 𝜆! =!!!
is the mean consumption of group k relative to the population. The first term of

75
the equation represents the within-group inequality and the second term the between group.
4. Comparability with 2007 CWIQ The previous poverty numbers for Liberia were generated by the 2007 Core Welfare Indicator Questionnaire. While this analysis to the extent possible tries to replicate that methodology, there are a number of important differences and therefore the poverty levels cannot be directly compared. See Wodon (2012) for a full description of the 2007 methodology. Differences between 2007 and 2014 include:
1. Regular consumption vs. Recall. In the 2007 CWIQ survey the questions asked about the average number of months per year and average consumption, while the 2014 HIES survey asked specifically about recall periods (either 7 days, 30 days, or 12 months).
2. The 2014 HIES includes Food Consumed Away from Home, which was not included in the 2007 CWIQ.
3. The 2007 CWIQ had separate poverty lines for urban and rural areas but did
not include spatial price deflators. The 2014 HIES uses Fisher Price Deflators for county differences and produces only one poverty line.
4. The 2007 CWIQ used the 2nd through the 9th deciles of the consumption
distribution used for the poverty line calculations while the 2014 HIES uses the 2nd through the 7th.
5. The consumption basket in the 2007 CWIQ included spending on the 28 food
products most often consumed which represented just over 87 percent of total household spending on food in the country. The 2014 HIES uses all items which comprise at least one percent of total spending on food, leading to a basket of 25 items representing about 83 percent of consumption. Among these 25 items are four categories of food consumed outside the household (meals, snacks, alcoholic beverages, and non-alcoholic beverages).
6. In both the 2007 CWIQ and the 2014 HIES, the average number of calories
per adult equivalent were higher than expected. In 2007 CWIQ, the amounts actually consumed for all products in the survey are adjusted in order to yield exactly a total of 2,400 Kcal per equivalent adult per day. Then the total cost of purchasing the resulting food basket was estimated using the survey prices observed in the community questionnaire of the survey. In 2014 HIES, the total spending and the aggregated prices from the consumption section of the questionnaire were used to adjust the quantities.

76
5. References Foster, James, Joel Greer, and Erik Thorbecke. 1984. “A Class of
Decomposable Poverty Measures.” Econometrica: Journal of the Econometric Society, 761–66.
Gini, Corrado. 1921. “Measurement of Inequality of Incomes.” The Economic
Journal, 124–26. Ravallion, Martin. 1998. Poverty Lines in Theory and Practice. World Bank-
Living Standards Measurement. econpapers.repec.org/paper/fthwobali/133.htm.
Wodon, Quentin. 2012. Poverty and the Policy Response to the Economic
Crisis in Liberia. World Bank Publications.
Related Documents