Household Composition, Equivalence Scales and the Reliability of Income Distributions: Some Evidence for Indigenous and Other Australians* BOYD H. HUNTER Centre for Aboriginal Economic Policy Research, Australian National University, Canberra, Australia STEVEN KENNEDY AND DANIEL SMITH Australian Bureau of Statistics, Canberra, Australia Indigenous families experience substantial and multiple forms of economic burden arising from the size and structure of their families and households. Indigenous households are more likely to have more than one family in residence than other Australian households and are more likely to be multigenerational with older Indigenous people living with younger people in extended family households. This paper seeks to characterise the economies of household size in Indigenous and other Australian households using equivalence scales that cover the range of feasible values and 1995 National Health Survey data. I Background Poverty and inequality studies almost always use an equivalence scale to adjust raw income to account for the cost of maintaining households and families. These costs are said to vary with household size and composition, and sometimes the number of employed in the household and other household characteristics. Unfortunately, variations in the assumptions about the relevant costs, and the relative complexity of the trans- formations involved, mean that measures of equivalent income are difficult to compare directly. For example, different groups may be classified as poor depending on which equivalent income is used. The purpose of this paper is to explore the intricacies of equivalent income cal- culations and to identify whether a particular group, Indigenous persons, are being dispropor- tionately re-ranked by several widely used meas- ures. The paper also examines to what extent Indigenous people move along the overall distri- bution of Australian income when different measures of equivalent income are applied. One of the most widely cited international studies of poverty claims that Ôequivalence scales have in general no great effect on the rank order of measured inequality across countries as long as average family size is not extremely largeÕ (Buhman et al. 1988). As the rationale for choosing a specific scale is rather vague, the importance of testing the sensitivity of income inequality estimates to the choice of equivalence scale has long been acknow- ledged – especially where there are substantial differences in family size and composition (Coulter et al. 1992; De Vos & Zaidi 1997; Aaberge & Melby 1998; Lancaster & Ray 1998). The qualification *The authors would like to thank Jon Altman, Bruce Bradbury, Matthew Gray, Peter Saunders, and two anonymous referees for comments on an earlier version. The views expressed in this paper are those of the authors and do not necessarily represent the views of the Australian Bureau of Statistics. Where quoted or used, they should be clearly attributed to the authors. Correspondence: Boyd Hunter, Centre for Aboriginal Economic Policy Research, The Australian National University, ACT, 0200, Australia. Tel.: +61 2 6125 8207; Fax: +61 2 6125 2789. Email: Boyd. [email protected] 70 Ó 2003. The Economic Society of Australia. ISSN 0013–0249. THE ECONOMIC RECORD, VOL. 79, NO. 244, MARCH, 2003, 70–83

Welcome message from author
This document is posted to help you gain knowledge. Please leave a comment to let me know what you think about it! Share it to your friends and learn new things together.
Transcript
Household Composition, Equivalence Scales andthe Reliability of Income Distributions: SomeEvidence for Indigenous and Other Australians*
BOYD H. HUNTER�Centre for Aboriginal Economic Policy Research,
Australian National University, Canberra,Australia
STEVEN KENNEDY AND DANIEL SMITH
Australian Bureau of Statistics, Canberra,Australia
Indigenous families experience substantial and multiple forms ofeconomic burden arising from the size and structure of their familiesand households. Indigenous households are more likely to have morethan one family in residence than other Australian households and aremore likely to be multigenerational with older Indigenous people livingwith younger people in extended family households. This paper seeksto characterise the economies of household size in Indigenous andother Australian households using equivalence scales that cover therange of feasible values and 1995 National Health Survey data.
I BackgroundPoverty and inequality studies almost always
use an equivalence scale to adjust raw income toaccount for the cost of maintaining householdsand families. These costs are said to vary withhousehold size and composition, and sometimesthe number of employed in the household andother household characteristics. Unfortunately,variations in the assumptions about the relevantcosts, and the relative complexity of the trans-formations involved, mean that measures of
equivalent income are difficult to comparedirectly. For example, different groups may beclassified as poor depending on which equivalentincome is used. The purpose of this paper is toexplore the intricacies of equivalent income cal-culations and to identify whether a particulargroup, Indigenous persons, are being dispropor-tionately re-ranked by several widely used meas-ures. The paper also examines to what extentIndigenous people move along the overall distri-bution of Australian income when differentmeasures of equivalent income are applied.One of the most widely cited international
studies of poverty claims that �equivalence scaleshave in general no great effect on the rank order ofmeasured inequality across countries as long asaverage family size is not extremely large� (Buhmanet al. 1988). As the rationale for choosing a specificscale is rather vague, the importance of testing thesensitivity of income inequality estimates to thechoice of equivalence scale has long been acknow-ledged – especially where there are substantialdifferences in family size and composition (Coulteret al. 1992; De Vos &Zaidi 1997; Aaberge &Melby1998; Lancaster & Ray 1998). The qualification
*The authors would like to thank Jon Altman, BruceBradbury, Matthew Gray, Peter Saunders, and twoanonymous referees for comments on an earlier version.The views expressed in this paper are those of theauthors and do not necessarily represent the views of theAustralian Bureau of Statistics. Where quoted or used,they should be clearly attributed to the authors.
�Correspondence: Boyd Hunter, Centre forAboriginal Economic Policy Research, The AustralianNational University, ACT, 0200, Australia. Tel.: +61 26125 8207; Fax: +61 2 6125 2789. Email: [email protected]
70
� 2003. The Economic Society of Australia. ISSN 0013–0249.
THE ECONOMIC RECORD, VOL. 79, NO. 244, MARCH, 2003, 70–83
about family size by Buhman et al. is clearly notvalid in the context of Indigenous people, who livein family groupings that tend to be very differentfrom those of other citizens.Daly and Smith (1995) suggest that Indigenous
families are experiencing substantial and multipleforms of economic burden in comparison withother Australian families. Indigenous people livein larger households than do other Australiansand have smaller incomes which, once correctedfor household size, are much smaller incomes.Indigenous households are more likely to beconsisted of more than one family compared withother Australian households. They are also morelikely to be multigenerational, with older Indi-genous people living with younger people inextended family households. Adult mortality isanother important factor driving family forma-tion (and dissolution) among the Indigenoushouseholds with many children forced to live withother relatives or friends (Gray 1990). The com-plexity of extended family formations is matchedby equally complex definitions of parenting andrelated child-care arrangements.These household characteristics have economic
implications – for example, suggesting that oldergenerations are not having to survive independ-ently but remain ensconced within an extendedfamily network (Smith & Daly 1996). This canhave benefits for a household, especially as agedadults are often in receipt of reliable sources ofpension income and provide child-care and stabil-ity to household membership. However, there mayalso be economic disadvantages to these socialarrangements with many Indigenous householdsbeing overly dependent on kin with low welfare-based incomes. These welfare recipients may, inturn, be under substantial economic pressure fromother adults and children who are dependent upontheir incomes (Rowse 1988; Finlayson 1991). Suchdependents may not qualify as dependents underCenterlink criteria and may be particularly at riskin these economically vulnerable households.As extended family formations are the norm in
many Indigenous communities, it is necessary toconsider the level at which income analysis shouldbe conducted. The household and family arenotoriously difficult to define, especially in across-cultural context. The Australian Bureau ofStatistics (ABS) (ABS 1991; p. 60) defines a�household� in the national population census as a:
… group of people who reside and eat together(in a single dwelling) … as a single unit in the
sense that they have common housekeepingarrangements—i.e. they have some commonprovision for food and other essentials of living.
Persons living in the same dwelling, but withseparate catering arrangements, can therefore beclassified as separate households. However, theidentification of such households can be partic-ularly problematic where people are living inimprovised dwellings, share domestic resourcesacross dwellings, are highly mobile, or have largeflows of visitors (Finlayson 1991; Martin &Taylor 1996; Smith & Daly 1996). One innovativeattempt to capture the dynamic complexities ofIndigenous households is being implemented insurveys of two remote communities, Kurandaand Yuendumu (Smith 2000).1 Notwithstandingfuture developments in data collection, this paperis necessarily confined to existing ABS datasources. The focus on the non-remote Indigenouspopulation in this paper may somewhat reducethe impact of these factors on our results.Australian income and poverty studies often use
�income units�, which are defined by the ABS as:
One person, or a group of related personswithin a household whose command overincome is assumed to be shared. Income sharingis considered to take place between partners in acouple relationship, and between parents andtheir dependents (ABS 1995).
Given the ethnographic evidence aboutresource sharing in (and even across) large Indi-genous households, the assumption of a nuclearor coupled family is inappropriate. The nature ofthe definitions of income units and families meansthat it is better to study Indigenous economicactivity at the household level.
1 Kuranda is a small hinterland townwith a populationof 600 people, approximately half an hour’s drive from theurban and tourist centre of Cairns in North Queensland.Yuendumu is a discrete, remote and predominantlyAboriginal town of 900 people located approximately4 hours drive fromAlice Springs. In Yuendumu, censuseswere taken nightly of all persons staying overnight inhouseholds over a 12-month period. The dynamic natureof Indigenous household composition can be illustrated inone of the four-bedroom houses surveyed. A total of 27different adults and 15 different children slept at the houseover the fortnight, totaling 42 different persons. Out ofthis flow of 42, a core of 11 persons (seven adults and fourchildren) slept at the house for the whole 2-week period(Musharbash 2000).
HOUSEHOLD COMPOSITION AND INCOME2003 71
The distinct nature of Indigenous families andhouseholds has led Smith and Daly (1996; p. 6) toclaim:
[T]he census indicator of household income is amore reliable measure of Indigenous incomeand status than family income, given that thecensus concept of household at least has thepotential to capture extended kin formationsvia the multifamily household type, than doesthe discrete �family� concept.
While we endorse this judgement, we alsoexamine the other family grouping that is widelyused in literature, income units. However, givenour preference for the household concept in theIndigenous context, the analysis will predomin-antly focus on the broader grouping of people.The style of analysis in this paper is deliberately
rudimentary, with its focus on the extent ofre-ranking along Australia’s income distribution,in order to enhance community understanding ofthe implications of equivalence scales. However,before any empirical analysis is possible, it isnecessary to introduce some basic theory under-lying equivalent income calculations.The remainder of this paper is structured as
follows. The following section provides a briefoverview of the equivalent income methodology.The third section introduces the main source ofdata used in this paper, the 1995 National HealthSurvey (NHS). The next section documents thesubstantial differences in household compositionof Indigenous and other Australians. This isfollowed by an overview of Indigenous incomedistributions, and some direct evidence on thepotential sensitivity of distributions to the partic-ular equivalence scale used. The main finding isthat large numbers of Indigenous families andhouseholds move up and down the income rank-ings depending upon the scale. The final sectionmakes some concluding remarks about the impli-cations for the results, and explores the difficultyof developing equivalence scales that reflect thecircumstances of Indigenous people.
II Calculating Equivalent Household IncomeTo compare economic well being, one needs to
adjust for the income needs of households withdifferent characteristics – the conventional tech-nique is to apply an equivalence scale to adjustraw household income. There are a range ofplausible equivalence scales with differentstrengths and weaknesses, and a distinct theoret-ical bases. However, most scales can be broadly
represented in a parametric form to facilitatecomparisons between scales.Equivalence scales are usually applied to raw
household income in order to derive equivalent(or equivalised) household income as follows:
IE ¼ IHSi
ð1Þ
where IE is equivalent income, IH raw householdincome and SI the equivalence scale. When SI isset equal to one, the scale does not vary withhouseholds size or composition and equivalentincome IE equals raw household income IH. WhenSI equals the number of persons in the household,IE is per capita income. Equivalence scales typic-ally result in measures of equivalent income thatlie between raw household income and per capitaincome.2
There are a variety of functional forms that canbe used to represent various assumptions betweentotal and per capita household income. A linearfunctional form that captures economies of size aswell as adult–child differences is:
SO ¼ 1þ aðA� 1Þ þ bK ð2Þ
where A is the number of adults in the householdand K the number of children, and a and brepresent the cost of additional adults and child-ren. Variation in a and b between 0 and 1 willproduce measures of equivalent income that liebetween raw household income and per capitaincome. The Organisation for EconomicCo-operation and Development (OECD) equival-ence scale used in this paper is a version ofequation (2), where a and b equal 0.5 and 0.3,respectively (i.e. the modified OECD scale used inDe Vos & Zaidi 1997; p. 321).In this paper, we are interested in examining
Indigenous and non-Indigenous incomes usingboth income units and households. The sensitivityof these distributions is analysed by looking at the
2 A useful parametric form of Si is Si ¼ Hh where H ishousehold size and h a parameter representing �theelasticity of scale with respect to household size� (1994).Variations in h between 0 and 1 result in equivalentincome measures that lie between raw household incomeand per capita income. For example, Buhman et al.(1988; p. 120) estimated the scale predominantly used inAustralian poverty studies (i.e. the Hendersonequivalence scale) had an estimated value for h of 0.55.The modified OECD scale, which is used in this paper,has a similar value for h.
ECONOMIC RECORD72 MARCH
variation between total and per capita income,and using the modified OECD (hereafter OECD)scale as a benchmark. One advantage of theOECD scale is that, unlike the other widely usedequivalence scales, it can easily be applied tovarious levels of analysis.3
Sensitivity analysis is usually conductedbecause of uncertainty about the implicit assump-tions about economies of size and compositionembedded in the equivalence scales.4 However,there are additional source(s) of uncertainty whenmeasuring Indigenous income – arising from theappropriate level of analysis and heterogeneity inthe Indigenous population. The question of thelevel of the analysis is partially addressed byconducting the analysis at both the household andincome unit level. The issue of heterogeneity arisesbecause of cultural differences within the Indigen-ous population. For example, some Indigenouspeople, especially those in cities, may live inincome units, but others may live in householdswith resource commitments to their extendedfamilies living elsewhere. Consequently, the searchfor a single best measure of equivalent income forIndigenous Australians is probably a flawedexercise. Notwithstanding, it is useful to highlightthe likely biases involved in the current measuresof equivalent income.
III DataThe NHS was conducted over the period from
February 1995 to January 1996. Households wererandomly selected using a stratified multistagearea sample (ABS 1995). The survey obtainedinformation from over 54 000 Australian resi-dents of private and non-private dwellings. Theoverall response rate for households was 91.5 percent.In addition to the main NHS sample, a
supplementary sample of 1034 Indigenous personswas obtained. This resulted in a total sample of2099 Indigenous persons. There were 52 763 non-Indigenous persons in the sample.In this study, we have excluded households
where a response to income questions was not
obtained for all persons in the household and/orinformation about the composition of the house-hold was incomplete. Visitors to the household andhouseholds in remote areas were excluded becauseof questions about data availability and quality.5
Remote areas were defined as Statistical LocalAreas where the dwelling density was less than 57dwellings per 100 square kilometre.6 After apply-ing these exclusions to income unit data, therewere 44 890 non-Indigenous and 1541 Indigenouspersons in the sample (Table 1). Applying theexclusions to household data further reduced thesample sizes to 43 464 and 1420, respectively.At the time of the 1996 Census, about 76 200
Indigenous people lived in remote areas definedusing a similar criteria to that above (authorscalculations based on Hunter 1998). While theremainder of the excluded Indigenous obser-vations in the NHS arose largely from the lackof adequate income data within income units, thepopulation represented by the sample is still asubstantial fraction of the total population. Forexample, the Indigenous population representedby this NHS sample was approximately 73 percent of the overall 1996 Census counts (i.e. beforeexclusions).
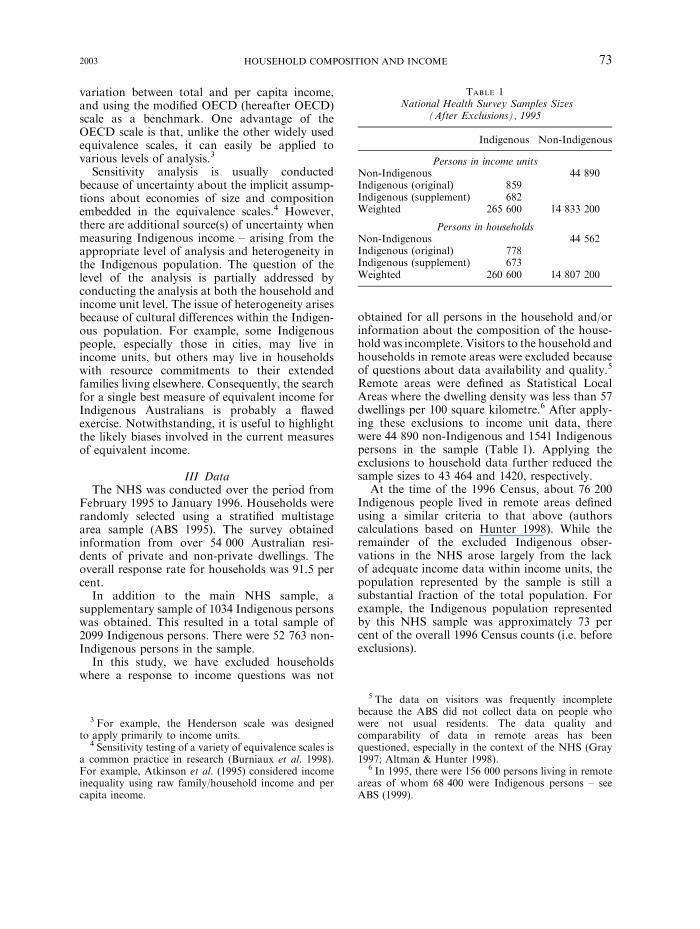
Table 1
National Health Survey Samples Sizes(After Exclusions), 1995
Indigenous Non-Indigenous
Persons in income unitsNon-Indigenous 44 890Indigenous (original) 859Indigenous (supplement) 682Weighted 265 600 14 833 200
Persons in householdsNon-Indigenous 44 562Indigenous (original) 778Indigenous (supplement) 673Weighted 260 600 14 807 200
3 For example, the Henderson scale was designedto apply primarily to income units.4 Sensitivity testing of a variety of equivalence scales is
a common practice in research (Burniaux et al. 1998).For example, Atkinson et al. (1995) considered incomeinequality using raw family/household income and percapita income.
5 The data on visitors was frequently incompletebecause the ABS did not collect data on people whowere not usual residents. The data quality andcomparability of data in remote areas has beenquestioned, especially in the context of the NHS (Gray1997; Altman & Hunter 1998).6 In 1995, there were 156 000 persons living in remote
areas of whom 68 400 were Indigenous persons – seeABS (1999).
HOUSEHOLD COMPOSITION AND INCOME2003 73
The measure of income on the 1995 NHS wasgross personal income from all sources. Theestimates of family or household income arebased on two standard ABS definitions. Thebroader definition of households outlined aboveincludes all persons who are usual residents of theparticular dwelling. Under the ABS definition ofincome units, dependents are defined as:
All persons under 15 years, and persons aged15–24 years who are full-time students, livewith a parent, guardian or other relative and donot have a spouse or offspring of their ownliving with them (ABS 1997; p. 51).
For the purposes of this study, we define childrenin a manner that is consistent with the definition ofdependants in income units. That is, any full-timestudent agedbetween 15 and 24 years is classified asa dependant. This assumption, which is an attemptto facilitate comparisons between income meas-ures, can be contrasted to the standardOECD scalewhere only those aged 14 years or less are treated asdependent children.The household sample contains fewer people
than the income unit sample because the exclusionrestrictions remove people living in householdswhere someone did not complete the incomequestion, even when some income units in thehousehold provided all the required information.Problems arising from the income questionwithin households were negligible among thenon-Indigenous sample and only reduced theIndigenous population represented in the NHS
by 1.9 per cent. The higher non-response of theIndigenous population is probably driven by theirlarger and more complex household structureswhich increase the probability that at least oneperson failed to provide all the informationrequired.
IV Describing Indigenous and Non-IndigenousHouseholds in the Context of Income Measurement
IssuesThe distinct nature of Australian Indigenous
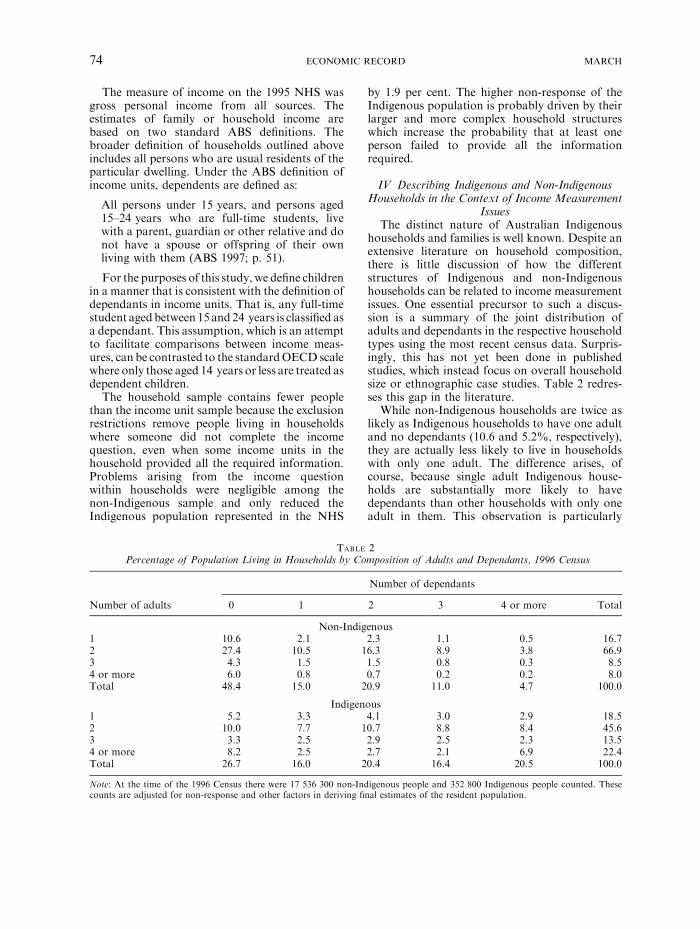
households and families is well known. Despite anextensive literature on household composition,there is little discussion of how the differentstructures of Indigenous and non-Indigenoushouseholds can be related to income measurementissues. One essential precursor to such a discus-sion is a summary of the joint distribution ofadults and dependants in the respective householdtypes using the most recent census data. Surpris-ingly, this has not yet been done in publishedstudies, which instead focus on overall householdsize or ethnographic case studies. Table 2 redres-ses this gap in the literature.While non-Indigenous households are twice as
likely as Indigenous households to have one adultand no dependants (10.6 and 5.2%, respectively),they are actually less likely to live in householdswith only one adult. The difference arises, ofcourse, because single adult Indigenous house-holds are substantially more likely to havedependants than other households with only oneadult in them. This observation is particularly
Table 2
Percentage of Population Living in Households by Composition of Adults and Dependants, 1996 Census
Number of dependants
Number of adults 0 1 2 3 4 or more Total
Non-Indigenous1 10.6 2.1 2.3 1.1 0.5 16.72 27.4 10.5 16.3 8.9 3.8 66.93 4.3 1.5 1.5 0.8 0.3 8.54 or more 6.0 0.8 0.7 0.2 0.2 8.0Total 48.4 15.0 20.9 11.0 4.7 100.0
Indigenous1 5.2 3.3 4.1 3.0 2.9 18.52 10.0 7.7 10.7 8.8 8.4 45.63 3.3 2.5 2.9 2.5 2.3 13.54 or more 8.2 2.5 2.7 2.1 6.9 22.4Total 26.7 16.0 20.4 16.4 20.5 100.0
Note: At the time of the 1996 Census there were 17 536 300 non-Indigenous people and 352 800 Indigenous people counted. Thesecounts are adjusted for non-response and other factors in deriving final estimates of the resident population.
ECONOMIC RECORD74 MARCH
pronounced among single adult householdswith four or more dependants (2.9 and 0.5%,respectively).The second salient point to arise from Table 2
is that Indigenous households are much less likelythan other households to only have two adults inthem (45.6 and 66.9%, respectively). This con-firms that Indigenous people do not conform tothe dominant paradigm of a nuclear family�model� where there is a couple living in a singledwelling.The only two adult household where Indigen-
ous people are more likely to live than otherAustralians are those with four or more depend-ants. This is consistent with the third stylised factof Indigenous households that they are morelikely to have large numbers of dependants. Theonly households with dependants where Indigen-ous households were less likely to be concentratedthan non-Indigenous households were those withonly two adults in them (i.e. those with betweenone and three dependants). Indeed, Indigenoushouseholds were only less likely to have twodependants than non-Indigenous households(20.7 and 20.4%, respectively), but this minordifference is driven solely by the concentration ofnon-Indigenous dependants in two adult families.Indigenous people are disproportionately con-
centrated in households with three or more adults.
More than one-third of Indigenous people live insuch households (35.9%). In contrast, less thanone-sixth of the non-Indigenous population live inthese �atypical� households (16.5%). The substan-tial part of this difference arises from particularlylarge households where there are more than threeadults taking care of four or more dependants –6.9 and 0.2 per cent, respectively.To recapitulate, Indigenous people are more
likely to live in larger households where there arethree or more adults and large numbers ofchildren. One important exception to this obser-vation is that Indigenous people are substantiallymore likely to live in single parent households.Household characteristics in the NHS reveal
that it tends to slightly underrepresent the largehouseholds with three or more adults and over-represent single adult households (Table 3) com-pared to the 1996 census. For example, thepercentage of the Indigenous population livingin NHS households with three or more adults was32.1 per cent compared to 35.9 per cent in the1996 Census. The converse of this is that the NHSwas more likely than the census to have Indigen-ous households with only one adult (23.2 and18.5%, respectively).While the overall differences between the census
and NHS data are relatively minor, the differen-tials become somewhat exaggerated when the
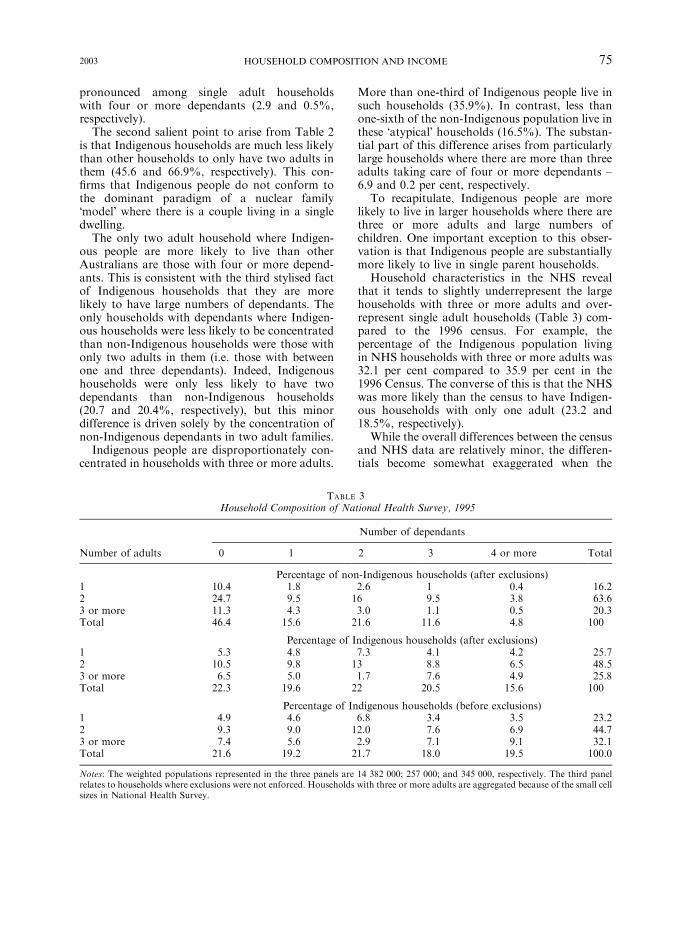
Table 3
Household Composition of National Health Survey, 1995
Number of dependants
Number of adults 0 1 2 3 4 or more Total
Percentage of non-Indigenous households (after exclusions)1 10.4 1.8 2.6 1 0.4 16.22 24.7 9.5 16 9.5 3.8 63.63 or more 11.3 4.3 3.0 1.1 0.5 20.3Total 46.4 15.6 21.6 11.6 4.8 100
Percentage of Indigenous households (after exclusions)1 5.3 4.8 7.3 4.1 4.2 25.72 10.5 9.8 13 8.8 6.5 48.53 or more 6.5 5.0 1.7 7.6 4.9 25.8Total 22.3 19.6 22 20.5 15.6 100
Percentage of Indigenous households (before exclusions)1 4.9 4.6 6.8 3.4 3.5 23.22 9.3 9.0 12.0 7.6 6.9 44.73 or more 7.4 5.6 2.9 7.1 9.1 32.1Total 21.6 19.2 21.7 18.0 19.5 100.0
Notes: The weighted populations represented in the three panels are 14 382 000; 257 000; and 345 000, respectively. The third panelrelates to households where exclusions were not enforced. Households with three or more adults are aggregated because of the small cellsizes in National Health Survey.
HOUSEHOLD COMPOSITION AND INCOME2003 75
necessary data exclusions are imposed. That is,focusing on the households for which there isvalid income data and who do not live in remoteareas further reduces the percentage of Indigenoushouseholds where there are three or more adultsfrom 32.1 to 25.8 per cent. Presumably, this isbecause it is harder to collect income informationfrom all adults in large households and becauseremote areas have larger households.As a consequence of the data exclusions and
structure of the NHS data, the role of largerIndigenous households will be understated in ouranalysis and, conversely, the role of single adulthouseholds may be overplayed.Hunter et al. (2002) show that the differences
between Indigenous and non-Indigenous incomeunits replicate the basic differentials identifiedabove between households. However, while thedifferences are still substantial they tend to becompressed for income units, by definition, giventhat income units are forced to have a maximumof two adults in them. That is, Indigenous incomeunits are closer to non-Indigenous income unitsbecause the non-Indigenous are more likely to livein two adult households, while the Indigenous aredisproportionately concentrated in householdswith three or more adults. Consequently, the actof breaking up larger Indigenous households intosmaller income units creates more of both singleadult and dual adult income units – thus distort-ing both. The increase in the number of singleadult units with dependants, relative to thehousehold distributions is a distinct feature ofthe Indigenous sample. This is consistent withethnographic evidence that indicates Indigenoussole parent families tend to live in multi-adulthouseholds with their extended families.
V Ranking Indigenous and Non-IndigenousIncomes
To examine the extent of income re-ranking inthe NHS, we re-estimate equivalent income usingthe various equivalence scales (i.e. raw income,per capita income, and OECD equivalence scales).Given that we are using the same income in thenumerator of equation (1), the only thing whichvaries between the measures of equivalent incomeare the equivalence scales and their underlyingassumptions about the economies of size andcomposition of households.The relatively low-income status of Indigenous
Australians is widely documented (Altman &Hunter 1997; Hunter 2001). This section presents
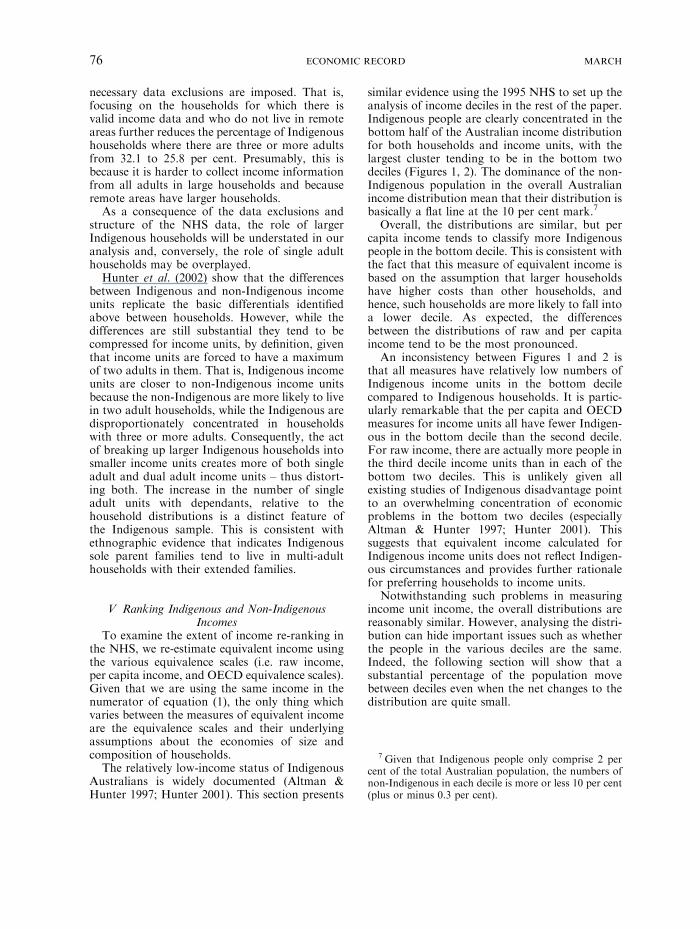
similar evidence using the 1995 NHS to set up theanalysis of income deciles in the rest of the paper.Indigenous people are clearly concentrated in thebottom half of the Australian income distributionfor both households and income units, with thelargest cluster tending to be in the bottom twodeciles (Figures 1, 2). The dominance of the non-Indigenous population in the overall Australianincome distribution mean that their distribution isbasically a flat line at the 10 per cent mark.7
Overall, the distributions are similar, but percapita income tends to classify more Indigenouspeople in the bottom decile. This is consistent withthe fact that this measure of equivalent income isbased on the assumption that larger householdshave higher costs than other households, andhence, such households are more likely to fall intoa lower decile. As expected, the differencesbetween the distributions of raw and per capitaincome tend to be the most pronounced.An inconsistency between Figures 1 and 2 is
that all measures have relatively low numbers ofIndigenous income units in the bottom decilecompared to Indigenous households. It is partic-ularly remarkable that the per capita and OECDmeasures for income units all have fewer Indigen-ous in the bottom decile than the second decile.For raw income, there are actually more people inthe third decile income units than in each of thebottom two deciles. This is unlikely given allexisting studies of Indigenous disadvantage pointto an overwhelming concentration of economicproblems in the bottom two deciles (especiallyAltman & Hunter 1997; Hunter 2001). Thissuggests that equivalent income calculated forIndigenous income units does not reflect Indigen-ous circumstances and provides further rationalefor preferring households to income units.Notwithstanding such problems in measuring
income unit income, the overall distributions arereasonably similar. However, analysing the distri-bution can hide important issues such as whetherthe people in the various deciles are the same.Indeed, the following section will show that asubstantial percentage of the population movebetween deciles even when the net changes to thedistribution are quite small.
7 Given that Indigenous people only comprise 2 percent of the total Australian population, the numbers ofnon-Indigenous in each decile is more or less 10 per cent(plus or minus 0.3 per cent).
ECONOMIC RECORD76 MARCH
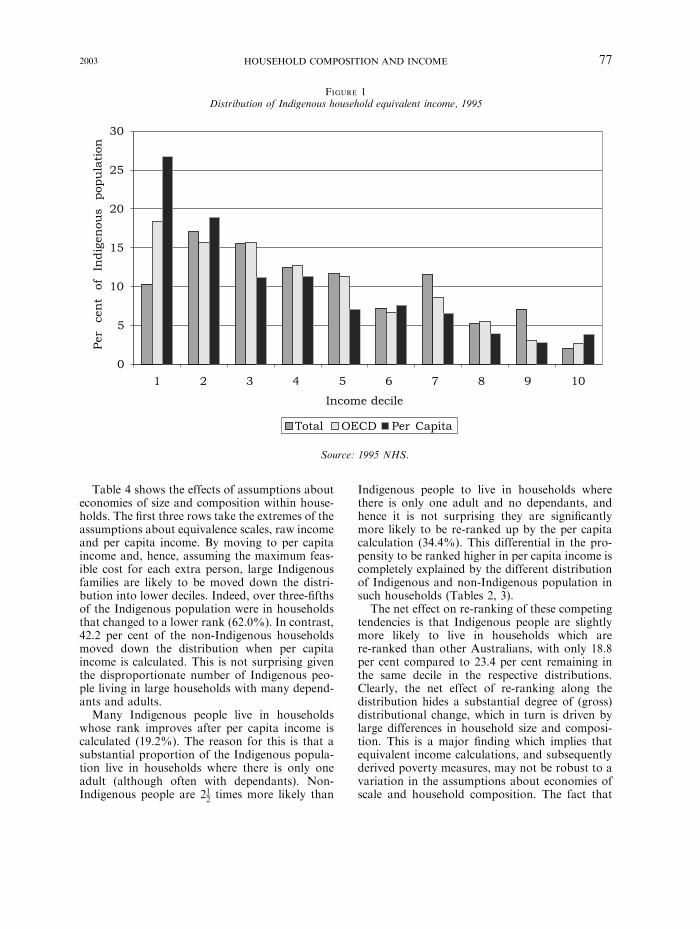
Table 4 shows the effects of assumptions abouteconomies of size and composition within house-holds. The first three rows take the extremes of theassumptions about equivalence scales, raw incomeand per capita income. By moving to per capitaincome and, hence, assuming the maximum feas-ible cost for each extra person, large Indigenousfamilies are likely to be moved down the distri-bution into lower deciles. Indeed, over three-fifthsof the Indigenous population were in householdsthat changed to a lower rank (62.0%). In contrast,42.2 per cent of the non-Indigenous householdsmoved down the distribution when per capitaincome is calculated. This is not surprising giventhe disproportionate number of Indigenous peo-ple living in large households with many depend-ants and adults.Many Indigenous people live in households
whose rank improves after per capita income iscalculated (19.2%). The reason for this is that asubstantial proportion of the Indigenous popula-tion live in households where there is only oneadult (although often with dependants). Non-Indigenous people are 212 times more likely than
Indigenous people to live in households wherethere is only one adult and no dependants, andhence it is not surprising they are significantlymore likely to be re-ranked up by the per capitacalculation (34.4%). This differential in the pro-pensity to be ranked higher in per capita income iscompletely explained by the different distributionof Indigenous and non-Indigenous population insuch households (Tables 2, 3).The net effect on re-ranking of these competing
tendencies is that Indigenous people are slightlymore likely to live in households which arere-ranked than other Australians, with only 18.8per cent compared to 23.4 per cent remaining inthe same decile in the respective distributions.Clearly, the net effect of re-ranking along thedistribution hides a substantial degree of (gross)distributional change, which in turn is driven bylarge differences in household size and composi-tion. This is a major finding which implies thatequivalent income calculations, and subsequentlyderived poverty measures, may not be robust to avariation in the assumptions about economies ofscale and household composition. The fact that
0
5
10
15
20
25
30
1 2 3 4 5 6 7 8 9 10
Income decile
PercentofIndigenouspopulation
Total OECD Per Capita
Figure 1
Distribution of Indigenous household equivalent income, 1995
Source: 1995 NHS.
HOUSEHOLD COMPOSITION AND INCOME2003 77
only one-fifth of people, Indigenous or otherwise,stay in the same decile when using per capita asopposed to raw income illustrates the possibleextent of the problem.In order to disaggregate the extent of
re-ranking between raw and per capita income,the changes between raw and OECD income, andOECD and per capita are reported. Given that percapita assumes higher costs for additional house-hold members than OECD income, which in turnassumes higher costs than raw income, one shouldexpect that the tendencies identified above arereplicated, although probably with smaller magn-itudes. This expectation is borne out with Indi-genous people more likely to move down thedistribution, and less likely to move up, than non-Indigenous people. Therefore, the phenomenon ofgross re-ranking along the distribution appears tobe monotonic in the assumption about economiesof household size and composition. As the vari-ation in assumptions about household costs are notas large for each of these pair-wise comparisons, itis not surprising that more people remain inthe same decile of the distribution for bothpopulations.
Table 5 examines the extent of incomere-ranking in more detail by analysing where onthe distribution a household is re-ranked afterapplying per capita income adjustment. Forexample, Indigenous households at the extremesof the distribution are actually more likely to stayin the same decile with 54.0 per cent staying in thefirst decile compared to 39.8 per cent of the non-Indigenous population in the lowest decile of rawincome. At the other extreme, 87.9 per cent of the5000 or so Indigenous householders in the topdecile of raw income remained in that decile afterapplying the per capita equivalence scales. It isimportant to note the underlying small samplesizes for Indigenous estimates in the upper deciles.The fact that Indigenous people are slightly lesslikely than other Australians to remain in thesame decile overall is explained solely through thegreater instability in the middle deciles.Both Indigenous and non-Indigenous Austral-
ians appear to have distinct clusters of peoplesome way from the main diagonal in Table 5 (i.e.the entries which indicate the extent to whichpeople remain in the same decile). Such �clusters�can be recognised by identifying where the
0
5
10
15
20
25
30
1 2 3 4 5 6 7 8 9 10
Income Deciles
PercentofIndigenouspopulation
Total OECD Per Capita
Figure 2
Distribution of Indigenous income unit equivalent income, 1995
Source: 1995 NHS.
ECONOMIC RECORD78 MARCH
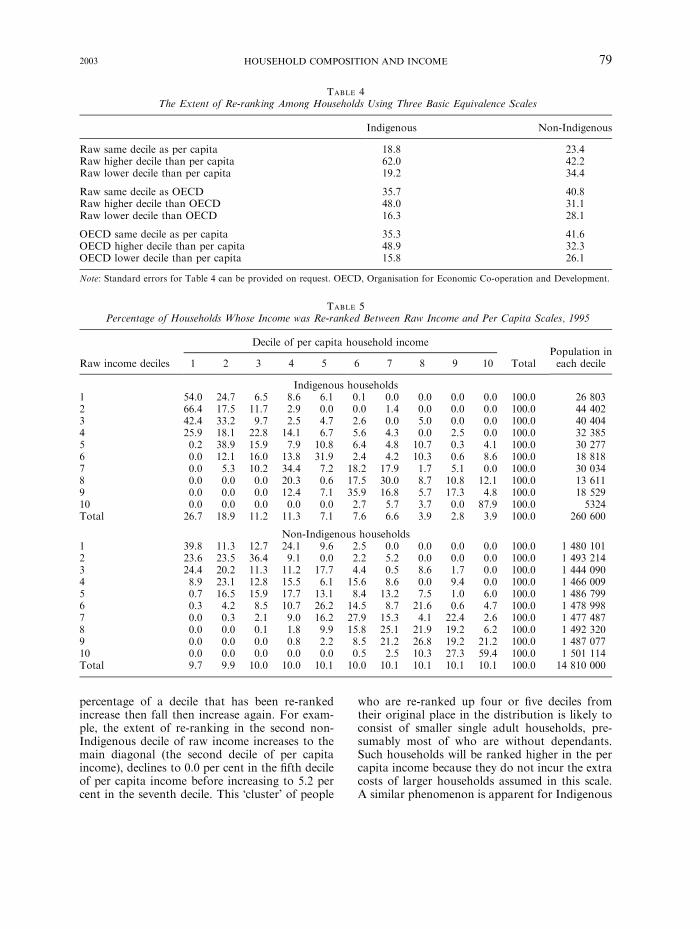
percentage of a decile that has been re-rankedincrease then fall then increase again. For exam-ple, the extent of re-ranking in the second non-Indigenous decile of raw income increases to themain diagonal (the second decile of per capitaincome), declines to 0.0 per cent in the fifth decileof per capita income before increasing to 5.2 percent in the seventh decile. This �cluster� of people
who are re-ranked up four or five deciles fromtheir original place in the distribution is likely toconsist of smaller single adult households, pre-sumably most of who are without dependants.Such households will be ranked higher in the percapita income because they do not incur the extracosts of larger households assumed in this scale.A similar phenomenon is apparent for Indigenous
Table 4
The Extent of Re-ranking Among Households Using Three Basic Equivalence Scales
Indigenous Non-Indigenous
Raw same decile as per capita 18.8 23.4Raw higher decile than per capita 62.0 42.2Raw lower decile than per capita 19.2 34.4
Raw same decile as OECD 35.7 40.8Raw higher decile than OECD 48.0 31.1Raw lower decile than OECD 16.3 28.1
OECD same decile as per capita 35.3 41.6OECD higher decile than per capita 48.9 32.3OECD lower decile than per capita 15.8 26.1
Note: Standard errors for Table 4 can be provided on request. OECD, Organisation for Economic Co-operation and Development.
Table 5
Percentage of Households Whose Income was Re-ranked Between Raw Income and Per Capita Scales, 1995
Decile of per capita household incomePopulation ineach decileRaw income deciles 1 2 3 4 5 6 7 8 9 10 Total
Indigenous households1 54.0 24.7 6.5 8.6 6.1 0.1 0.0 0.0 0.0 0.0 100.0 26 8032 66.4 17.5 11.7 2.9 0.0 0.0 1.4 0.0 0.0 0.0 100.0 44 4023 42.4 33.2 9.7 2.5 4.7 2.6 0.0 5.0 0.0 0.0 100.0 40 4044 25.9 18.1 22.8 14.1 6.7 5.6 4.3 0.0 2.5 0.0 100.0 32 3855 0.2 38.9 15.9 7.9 10.8 6.4 4.8 10.7 0.3 4.1 100.0 30 2776 0.0 12.1 16.0 13.8 31.9 2.4 4.2 10.3 0.6 8.6 100.0 18 8187 0.0 5.3 10.2 34.4 7.2 18.2 17.9 1.7 5.1 0.0 100.0 30 0348 0.0 0.0 0.0 20.3 0.6 17.5 30.0 8.7 10.8 12.1 100.0 13 6119 0.0 0.0 0.0 12.4 7.1 35.9 16.8 5.7 17.3 4.8 100.0 18 52910 0.0 0.0 0.0 0.0 0.0 2.7 5.7 3.7 0.0 87.9 100.0 5324Total 26.7 18.9 11.2 11.3 7.1 7.6 6.6 3.9 2.8 3.9 100.0 260 600
Non-Indigenous households1 39.8 11.3 12.7 24.1 9.6 2.5 0.0 0.0 0.0 0.0 100.0 1 480 1012 23.6 23.5 36.4 9.1 0.0 2.2 5.2 0.0 0.0 0.0 100.0 1 493 2143 24.4 20.2 11.3 11.2 17.7 4.4 0.5 8.6 1.7 0.0 100.0 1 444 0904 8.9 23.1 12.8 15.5 6.1 15.6 8.6 0.0 9.4 0.0 100.0 1 466 0095 0.7 16.5 15.9 17.7 13.1 8.4 13.2 7.5 1.0 6.0 100.0 1 486 7996 0.3 4.2 8.5 10.7 26.2 14.5 8.7 21.6 0.6 4.7 100.0 1 478 9987 0.0 0.3 2.1 9.0 16.2 27.9 15.3 4.1 22.4 2.6 100.0 1 477 4878 0.0 0.0 0.1 1.8 9.9 15.8 25.1 21.9 19.2 6.2 100.0 1 492 3209 0.0 0.0 0.0 0.8 2.2 8.5 21.2 26.8 19.2 21.2 100.0 1 487 07710 0.0 0.0 0.0 0.0 0.0 0.5 2.5 10.3 27.3 59.4 100.0 1 501 114Total 9.7 9.9 10.0 10.0 10.1 10.0 10.1 10.1 10.1 10.1 100.0 14 810 000
HOUSEHOLD COMPOSITION AND INCOME2003 79
Australians, albeit with smaller �clusters�. This isconsistent with the substantial number of singleadult Indigenous households although less than inthe non-Indigenous population.A relatively large number of Indigenous Aus-
tralians are re-ranked lower in the per capitadistribution. For example, a remarkable 66.4 percent of Indigenous people in the second decile ofraw income are ranked in the lowest decile of theper capita distribution. In contrast, only 23.6 percent of non-Indigenous people in the second decileare re-ranked downwards. This, as was pointedout above, is because many Indigenous householdsare very different from the Australian averagehousehold. Consequently, it is not surprising thatthere is a large cluster of people who are re-rankedlower in the per capita distribution because largehouseholds are assumed to have higher costs thanother households – there is a �cluster� of people,especially non-Indigenous people, who arere-ranked down about four or five deciles. Forexample, approximately one-eighth (12.4%) ofIndigenous householders in the ninth decile of rawincome are ranked in the fourth decile of per capitaincome.Hunter et al. (2002) further breaks down the
overall re-ranking among households by showingthe percentage of each decile of OECD householdincome that were classified in the various deciles ofraw income andper capita income. In the first decileofOECD income almost twice asmanypeoplewereoriginally classified in the bottom decile of percapita income (85.8 compared to 44.5%).However,with the possible exception of the top two deciles ofOECD income, a substantially greater number ofpeople originate from lower deciles of per capitaincome. This is because per capita income assumeslower economies of household size and composi-tion than either the OECD or raw income. Not-withstanding, the fact that the whole distributionsare recalculated mean that some household typesmove up the distribution between raw incomeand OECD income – with the top two deciles ofOECD being more likely to originate from a lowerdecile of raw income than a lower decile of percapita income. These observations confirms thatthe extent of re-ranking is much greater for theIndigenous population than for other Australiansin every part of the distribution.
VI Concluding RemarksIndigenous incomes are harder to characterise
and less stable than non-Indigenous incomes – afinding that is robust and holds for the feasible
range of equivalence scales. This is consistent withthe greater diversity of household types in theIndigenous populations being more likely to beboth single adult and exceptionally large (i.e. withthree or more adults and/or many dependants).This paper argues that households should be
used in preference to income units (or evenfamilies) as the basic unit of income analysis,especially statistical or policy analysis of Indigen-ous Australians. While households are slightly lessstable than income units, at least in terms ofmeasured income, they provide a better basis foran analysis that directly relates to Indigenouscircumstances. In addition to being culturallyinappropriate, income units frequently generatedistributions of equivalent income, which do notaccord with widespread consensus about Indigen-ous income. For example, Indigenous incomesappear to be overstated with more Indigenouspeople being in the second decile of per capita,and OECD measures of equivalent income thanthere were in the bottom decile. In any case, thereis little loss of information for other Australians inshifting the focus towards the household withnon-Indigenous households looking relativelysimilar to non-Indigenous income units, at leastin terms of size and composition. Few non-Indigenous households have more than two adultsliving in them and hence the overall incomedistributions will be relatively unaffected bymoving towards a household level analysis.The large differences between the size and
composition of Indigenous and non-Indigenoushouseholds mean that the issue of economies ofscale in household production (and consumption)has important implications for the measurementof Indigenous poverty. Equivalence scales shouldaccurately reflect the real cost of raising largehouseholds. Unfortunately, the range of equival-ence scales used by poverty researchers becomessignificantly wider as the number of childrenincreases (Whiteford 1985; p. 13, 106–107). Forexample, while the values of the Hendersonequivalence scales do not differ markedly fromother scales, they do diverge for large households(Saunders 1994; p. 251). Consequently, the choiceof equivalence scale is not trivial and there are nounique solutions to determining the extent ofincome inequality and poverty.Given that an important source of variation in
the inequality of equivalent income is from thenumber of �dependants�, it is useful to reflect onthe extent to which the definition accords withhousehold requirements for resources. Clearly,
ECONOMIC RECORD80 MARCH
there is a need for consistency in the treatment ofdependants when comparing equivalence scales.While this consistency was imposed in this paper,more discussion is required in the literature overwhich definition of dependants is appropriate. Ifolder �dependants� cost as much as adults, then theOECD treatment of children should be preferred toothers, such as the Henderson scales, which assumethat full-time students as old as 24 cost the same aschildren. The OECD definition of dependants ap-pears to offer a more realistic assessment of resourcerequirements than the Henderson definition.The policy importance of income �measure-
ment� error, indirectly identified in this paper, isthat it questions the accuracy of an income basedmeans test. If income cannot be accurately used toidentify needy families and households, then it isimpossible to guarantee that welfare is beingdirected to the right people. Many Indigenousfamilies could miss out on welfare entitlements iftheir needs are understated by inappropriatedefinitions of income, especially those whichunderestimate the cost of raising children or theexpense of running large households. The majorchallenge in any reform of the equivalence scalesused by policy makers is to ensure that thedistinctive circumstances of Indigenous peopleare taken into account.8 Unfortunately, the only
way to construct accurate benchmarks of house-hold costs is to separately estimate expenditure forIndigenous and other Australians.The use of the same equivalence scales for
Indigenous and other Australians is problem-atic (Altman & Hunter 1997). Unfortunately,the assumption is routinely made and isprobably the only one practicable in theshort-run. If one wanted to model a separateequivalence scale for the two groups, detailedexpenditure data for Indigenous and otherAustralians would be required.9 To date therehas not been a comprehensive study of Indi-genous household expenditure patterns.10 Alas,this is unlikely to occur in the near futurebecause of intrinsic methodological constraintsand the substantial cost of over-samplingIndigenous respondents.Ironically, it could be argued that it does not
matter which equivalence scale is used for Indi-genous Australians because the overwhelmingmajority of Indigenous Australians experiencemultiple disadvantage across a range of indicat-ors. For example, there is no real question aboutthe extent of deprivation and social exclusion ofIndigenous people, irrespective of the incomemeasure (Hunter 1999; Hunter 2000). Accordingto this line of argument, policy makers shouldprovide programs and subsidies to anybody whoidentifies as Indigenous. Unfortunately, this
8 One response to the mounting criticisms of theHenderson poverty line was the Budget Standardsproject commissioned by the Department of SocialSecurity and conducted by the Social Policy ResearchCentre (SPRC). The Budget Standards Unit (BSU) ofthe SPRC attempted to determine the budget necessaryfor particular types of households to achieve a modestbut adequate standard of living (Saunders 1996). Fromthe perspective of measuring Indigenous poverty, themost appealing aspect of the BSU’s approach is itattempts to take into account the geographicalvariations in costs. Given the problems with using asingle Australia-wide poverty line, the geographicaldimension of budget standards provides an unambig-uous improvement in the measurement of Indigenouspoverty. Also, while the budget standard will provide areasonably recent estimate of the cost of children andpotential economies of scale within various income units,it may not capture the diseconomies of very largeIndigenous households. Indeed, despite the fact thatmany Indigenous households have more than sixresidents, the largest household that the BSU examineshas only six residents. If the diseconomies of costs ofmaintaining larger households are not linear, then theBSU will not be able to accurately estimate Indigenouspoverty vis-a-vis other poverty.
9 Note that it is not logically necessary to assumea monolithic Indigenous culture when evaluatingequivalence scales – except perhaps because there is noadequate data of sufficient quality against whichparticular sub-populations could be benchmarked.Unfortunately, this qualification will be a bindingconstraint on the ability to distinguish between groupsof Indigenous Australians in the near future.10 Simply implementing an Indigenous identifier in the
ABS’s Household Expenditure Survey would not caterfor an adequate, nor reliable assessment. The sample sizeof the Indigenous households would also need to beextended so that it will be large enough to producereliable estimates with relatively low standard errors.Over-sampling may be necessary notwithstanding widegeographical distribution and diverse situations ofIndigenous populations. Surveys of Indigenous peopletypically suffer from four major methodological issues;the nature of kin-related households; the effect ofreciprocity and sharing within the community; theeconomic impact of subsistence activities and; thecultural sensitivity of questions posed. All of theseproblems complicate and distort expenditure measuresof welfare.
HOUSEHOLD COMPOSITION AND INCOME2003 81
approach begs the question of who identifies as anIndigenous person – an intensely political ques-tion in both the Indigenous and widercommunity.11
This paper illustrates the importance of under-standing the processes underlying income meas-urement for sub-populations. Another relatedtopic is how equivalence scales affect the extentof poverty in these populations. The next step is tofacilitate the analysis of the implications ofmeasurement error induced by potentially in-appropriate characterisations of equivalencescales for measured Indigenous poverty, especiallyIndigenous poverty relative to other Australianpoverty.
REFERENCES
Aaberge, R. and Melby I. (1998), �The Sensitivity ofIncome Inequality to Choice of Equivalence Scale�,Review of Income and Wealth 44, 565–569.
ABS (1991), �1991 Census Dictionary�, Cat. no. 2901.0.ABS, Canberra.
ABS (1995), �National Health Survey Users� Guide�,Cat. no. 4363.0. ABS, Canberra.
ABS (1997), �Survey of Income and Housing: UserGuide�, Cat. no. 6553.0. ABS, Canberra.
ABS (1999), �1995 National Health Survey: Aboriginaland Torres Strait Islander Results�, Cat no. 4806.0.ABS, Canberra.
Altman, J.C. and Hunter, B. (1997), �Indigenous PovertySince the Henderson Report�, CAEPR DiscussionPaper no. 127, CAEPR. ANU, Canberra.
Altman, J.C. and Hunter, B. (1998), �IndigenousPoverty�, in Fincher R. and Nieuwenhuysen J. (eds)Australian Poverty: Then and Now. MelbourneUniversity Press, Melbourne; 238–57.
Atkinson, A. B., Rainwater, L. and Smeeding, T. (1995),�Income Distribution in OECD Countries: Evidencefrom the Luxembourg Income Study�, Social PolicyStudies no. 18, OECD, Paris.
Buhman, B., Rainwater, L., Schmaus, G. and Smeeding,T.M. (1988), �Equivalence Scales, Well-being,Inequality, and Poverty: Sensitivity Estimates AcrossTen Countries Using the Luxembourg Income Study(LIS) Database�, Review of Income and Wealth 34,115–42.
Burniaux, J., Dang, T., Fore, D., Forster, M., D’Ercole,M. and Oxley, H. (1998), �Income Distribution and
Poverty in Selected OECD Countries�, EconomicsDepartment Working Paper no 189. OECD, Paris.
Coulter, F.A.E., Cowell, F.A. and Jenkins, S.P. (1992),�Equivalence Scale Relativities and the Extent ofInequality and Poverty�, Economic Journal 102, 1067–82.
Daly, A. and Smith, D. (1995), �The Economic Status ofIndigenous Australian Families�, CAEPR DiscussionPaper no. 93, CAEPR. ANU, Canberra.
De Vos, K. and Zaidi, M.A. (1997), �Equivalence ScaleSensitivity of Poverty Statistics for the Member Statesof the European Community�, Review of Income andWealth 43, 319–33.
Finlayson, J. (1991), �Don’t Depend on Me: Autonomyand Independence in an Aboriginal Community inNorthern Queensland�, Unpublished PhD Thesis.ANU, Canberra.
Gray, A. (ed.) (1990), �A Matter of Life and Death:Contemporary Aboriginal Mortality�. AboriginalStudies Press, Canberra.
Gray, B. (1997), �IndigenousDataQuality in theNationalHealth Survey 1995: Analysis of Selected Questionsfrom the Unedited, Unweighted File�, Abs InternalDiscussion Paper 97/1. National Centre for Aboriginaland Torres Strait Islander Statistics, Darwin.
Hunter, B.H. (1998), �Assessing the Validity of Inter-censal Comparisons of Indigenous Australians, 1986–96�, Journal of the Australian Population Association15, 51–67.
Hunter, B.H. (1999), �Three Nations, Not One: Indi-genous and Other Australian Poverty�, CAEPRWorking Paper no. 1, CAEPR, Canberra. Availableat http://charlotte.anu.edu.au/caepr/.
Hunter, B.H. (2000), �Social Exclusion, Social Capitaland Indigenous Australians: Measuring the SocialCosts of Unemployment�, CAEPR Discussion Paperno. 204. CAEPR, Canberra.
Hunter, B.H. (2001), �Tackling Poverty Among Indi-genous Australians�, in Fincher R. and Saunders P.(eds) Creating Unequal Futures. Allen & Unwin,Sydney, 129–57.
Hunter, B.H., Kennedy, S. and Smith, D. (2002), �Sen-sitivity of Australian Income Distributions to Choiceof Equivalence Scales: Exploring Some Parameters ofIndigenous Incomes�, in Eardley T. and Bradbury B.(eds) Competing Visions. Proceedings of the NationalSocial Policy Conference. Sydney 4–6 July 2001. SocialPolicy Research Centre (SPRC) Report 1/02, SPRC.University of New South Wales, Sydney.
Lancaster, G. and Ray, R. (1998), �Comparison ofAlternative Models of Household Equivalence Scales:The Australian Evidence on Unit Record Data�,Economic Record 74, 1–14.
Martin, D.F. and Taylor, J. (1996), �Enumerating theAboriginal population of Remote Australia: Meth-odological and Conceptual Issues�, Journal of theAustralian Population Association 13, 17–33.
Musharbash, Y. (2000), �The Yuendumu CommunityCase Study�, in Smith D.E. (ed.) Indigenous Familiesand the Welfare System: Two Community Case
11 For example, the federal court decision in the late1990s about the eligibility of certain people to stand foroffice in the Tasmanian Aboriginal and Torres StraitIslander Commission elections (Sanders et al. 2000).
ECONOMIC RECORD82 MARCH
Studies. CAEPR Monograph no. 17. CAEPR, ANU,Canberra.
Rowse, T. (1988), �From Houses to Households? TheAboriginal Development Commission and EconomicAdaption by Alice Springs Town Campers�, SocialAnalysis 24, 50–66.
Sanders, W., Taylor, J. and Ross, K. (2000), �Partici-pation and Representation in ATSIC Elections: aTen-Year Perspective�, CAEPR Discussion Paper no.198. CAEPR, ANU, Canberra.
Saunders, P. (1994), �Welfare and Inequality�, CambridgeUniversity Press, Cambridge.
Saunders, P. (1996), �Development of Indicative BudgetStandards for Australia: Project Outline and Research
Methods�, Budget Standards Unit Working PaperSeries Number One, SPRC. University of New SouthWales, Sydney.
Smith, D.E. (2000), �Indigenous Families and the Wel-fare System: Two Community Case Studies�, CAEPRMonograph no. 17, CAEPR, ANU, Canberra.
Smith, D.E. and Daly, A.E. (1996), �The EconomicStatus of Indigenous Australian Households: a Sta-tistical and Ethnographic Analysis�, CAEPR Discus-sion Paper no. 109. CAEPR, Canberra.
Whiteford, P. (1985), �A Family’s Needs: EquivalenceScales, Poverty and Social Security�, Research Paperno. 27, Development Division, Department of SocialSecurity, Canberra.
HOUSEHOLD COMPOSITION AND INCOME2003 83
Related Documents